GuruFocus User Manual: Interactive Charts
|
|
|
- Joel Hart
- 6 years ago
- Views:
Transcription
1 GuruFocus User Manual: Interactive Charts
2 Contents: 1. Introduction and Overview a. Accessing Interactive Charts b. Using the Interactive Chart Interface 2. Basic Features a. Financial Metrics b. Graphing series in Interactive Charts c. Comparing and Switching Companies d. Miscellaneous Graphing Options 3. Predefined Charts a. Peter Lynch Chart b. P/S Valuation Bands c. Miscellaneous predefined charts 4. Customized / User-Friendly Features a. Customized Series b. User Defined Charts 5. Advanced Features a. Adding text to chart b. Adding lines and shapes to chart 6. FAQ

3 1. Introduction and Overview As discussed in his best-seller, One Up on Wall Street, legendary investor Peter Lynch compared the company s price line to its earnings line to determine if a company is undervalued. Buying growth stocks at deeply undervalued prices and selling them when the price rose sharply above the earnings line generally leads to good returns. GuruFocus s Interactive Chart feature allows you to construct charts including the famous Peter Lynch Chart. However, you can construct an eclectic variety of charts and do many other cool things with the Interactive Charts feature. This manual will highlight some of the key aspects. Accessing Interactive Charts You can access the Interactive Charts in several ways, as described in Figures 1.1 to 1.3: 1. On the Search box located underneath the blue GuruFocus ribbon, type in a company s ticker symbol, and choose the one with Interactive Chart. 2. On a company s summary page, scroll down until you see Peter Lynch Chart. Click on the Interactive Charts link in the upper-right corner. 3. Click on Interactive Chart among the tabs listed in the gray ribbon near the top of the page. Figures 1.1 to 1.3 show how to access the interactive charts feature for Apple Inc. (AAPL), one of several companies that we will discuss throughout this user manual.

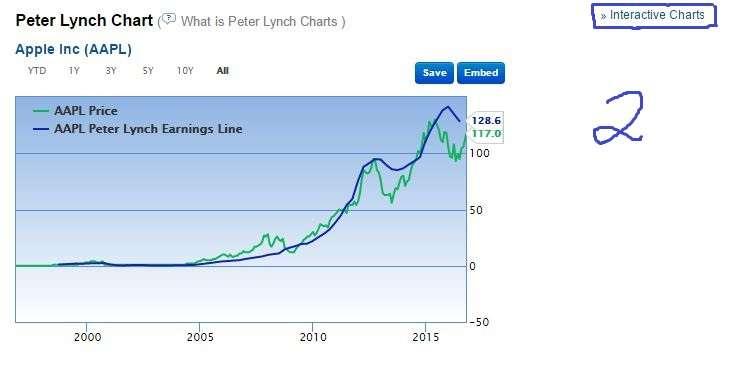
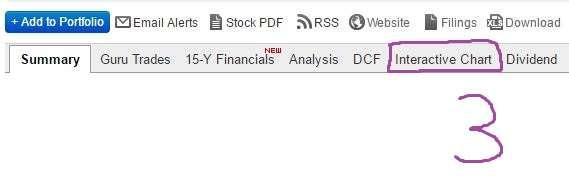
4 Figure 1.1 Figure 1.2 Figure 1.3
5 Using the Interactive Chart interface Figure 2 Once you access the Interactive Charts interface, the Chart automatically graphs the company s historical stock price line for all years as shown in Figure 2 above. You can limit the time frame to several predefined periods: Three months Six months Year to date One year Three years Five years Ten years Position 1 in Figure 2 shows the location for the predefined time frames. You can also manually set the time period using the From and To boxes located at position 2. To view the numeric value for each active series on a particular day, simply hover the mouse over the chart (position 3). Finally, you can export the chart to Excel, save the chart as an image or embed the chart to your article using the respective buttons located at position 4.

6 2. Basic Interactive Chart Features The Interactive Charts feature allows you to graph the historical trendline of a company s financials, ranging from the stock price and revenue to the company s operating margin or days sales outstanding. You can view all of the available financial metrics by clicking the tabs located on the left. Figure 3 As shown in Figure 3, the available financial metrics are grouped into several tabs, including: most popular, valuation & quality, income statement, balance sheet, cash flow statement and economic indicators. The most popular tab lists the commonly used financial metrics, including the price, revenue, market cap, dividend yield and the key valuation ratios. Other tabs list financial metrics according to the label: Valuation & Quality includes the commonly used financial strength and profitability metrics, including the Piotroski F-score, Altman Z-score, the Beneish M-score and all profit margins and returns. Income Statement includes revenue, cost of goods sold, SGA expense and gross profit. Balance Sheet includes cash, asset accounts, debt and equity accounts. Cash Flow Statement includes net income, depreciation, etc. Economic Indicators includes gross domestic product and the purchasing managers index. This allows you to graph these economic indicators with company financial information. Customized Series: If you have userdefined series, they will show up here. We will discuss this later. Technical Indicators include some advanced metrics, including Bollinger bands, moving averages and Keltner channels. In the Search Series box, you can easily find the desired series. For example, you can type oper to search for the series, operating margin.
7 Graphing series within Interactive Charts As discussed earlier, the Chart automatically graphs the company s historical stock price. (Note the check mark next to Price in Figure 3.) To remove a series, simply uncheck the box next to that series. After you uncheck Price, you should have a blank chart. Now you can graph a single series by clicking the check box next to the desired series, e.g., the price-earnings ratio (ttm). After you click the check box next to P/E (ttm), you should see Apple s historical P/E ratios throughout all years. Since we usually only care about the recent 10 years, we can click on the 10y button among the predefined time periods. The chart will then show Apple s historical P/E ratios for the past 10 years only. Figure 4 shows the chart output. Figure 4 The red numbers next to the tab labels show how many series from each of the tabs are displayed on the interactive chart, allowing you to keep track how many series you have selected. This is helpful when you are graphing multiple series. Usually, you would like to graph multiple financial metrics for a single company. For example, you may want to discuss Apple s operating margin and return on equity in a single paragraph. You can graph several financial metrics on the chart, as long as the series do not overlap and cause confusion. Figure 5 displays Apple s key profit margins and returns.
8 Figure 5 The series are color-coded so that you can easily distinguish between each of the series, and the legend appears below the chart. Note the red 4 next to valuation & quality: we have selected four series within that tab. Comparing and switching companies within Interactive Charts You will notice that there are various dialog boxes, buttons and check boxes above the interactive chart. These options, as displayed in Figure 6, allow you to customize the chart output. Figure 6 You can directly switch companies within the Interactive Chart by typing in the new company s ticker symbol in the Switch Ticker dialog box and clicking Go. For example, you can change the ticker symbol to Baidu Inc. (BIDU). Note that this also changes the header from Apple to Baidu, i.e., the header will now display the key financial information for Baidu. Often, you would like to compare one company s financial metrics to a different company. For example, you may want to compare Baidu s earnings per share to that of Google or Yahoo. From a blank chart, first search for eps and click on the check box. You can then add Google s EPS and Yahoo s EPS by typing in their ticker symbols in the Compare Company dialog box. Figure 7.1 shows the chart output.
9 Figure 7.1 By default, the Interactive Chart shows annual data. However, you can change this setting using the three radio buttons next to the Switch Ticker dialog box: Annual Data, Quarterly Data and TTM Data. Figures 7.2 and 7.3 show the three Internet content & information company s quarterly eps and TTM eps, respectively.
10 Figure 7.2 Figure 7.3
11 Miscellaneous graphing options The % Change option shows the percentage change of a company s financial metric year over year. To consider the year over year growth rate for a specific financial metric, click on the % YOY check box. You can also use a logarithmic scale, like what Peter Lynch used in his famous chart. Figure 8.1 shows Baidu s YOY operating margin growth rate for the past 10 years, and Figure 8.2 shows Baidu s Peter Lynch Chart with a logarithmic scale. Figure 8.1
12 Figure 8.2 As expected, banks suffered sharp decreases in stock price during U.S. recessions. You can highlight the recession years by clicking on the U.S. Recession check box. Figure 8.3 shows the historical stock price for two banks: Bank of America Corp. (BAC) and JPMorgan Chase & Co. (JPM).

13 Figure 8.3 Finally, the Reset All button reverts the Interactive Chart to its default view, which graphs the active company s historical stock price line for all years. (The active company is the company that is featured at the top of the Web page.)
14 3. Predefined Charts GuruFocus offers several predefined interactive charts, including the Peter Lynch Chart and the price-to-sales valuation bands. These two charts allow you to visualize when a company stock is undervalued. Peter Lynch Chart As discussed in earlier sections of this manual, the Peter Lynch Chart is one of the most famous charts in the investing world. This chart compares the company s price line to its earnings line, which is 15 times the P/E (nri) by default. However, you can change this value by entering the desired number in the Price at P/E (w/o NRI) = box, as highlighted in Figure 9. Figure 9 As companies have different price-earnings ratios, the Peter Lynch earnings line is not appropriate for companies with significantly high P/E (nri). For example, Google s P/E (nri) ranges between 16.5 and 92.6 with a median about 30. An earnings line at P/E (nri) of 15 would inappropriately overvalue Google s stock, as shown in Figure 9.1.
15 Figure 9.1 To account for the median P/E (nri) of 30, we can change the Price at P/E(nri) = value from 15 to 30 as displayed in Figure 9. Figure 9.2 shows Google s earnings line at a P/E (nri) at 30.
16 Figure 9.2 Using Figure 9.2, we can more accurately determine when Google traded below its P/E (nri) valuation: in 2009, during the four-year period from mid 2010 to mid 2013, and in A projection indicates that Google is currently fully valued based on a P/E (nri) of 30. However, the Interactive Charts feature also allows you to draw the earnings line at the company s minimum P/E (nri), median P/E (nri) and maximum P/E (nri). These three items are located just above the highlighted blue box in Figure 9. Figure 9.3 shows Google s earnings line at the company s minimum, median and maximum P/E (nri).
17 Figure 9.3 Note how the earnings line at Google s maximum P/E (nri) is severely above the rest of the chart. You can remove a series by unchecking the box for that series. You can also click on that series to deactivate it. Note that the legend displays the deactivated series in gray, indicating that the series does not appear on the chart. Figure 9.4 shows the chart output after removing the maximum P/E (nri) series.
18 Figure 9.4 Using Figure 9.4, we can observe several characteristics of Google s stock. The company traded near its minimum P/E (nri) valuation near the end of 2008 and mid 2012, indicating that Google is significantly undervalued at those times. Investors who bought Google when the stock is significantly undervalued likely realized strong gains in the short term, as suggested by the chart. Unfortunately, Google s stock currently trades significantly higher than its minimum P/E (nri) valuation. P/S valuation bands predefined chart As discussed in the definition page for P/E (nri), the P/E can frequently give misleading valuations, especially for cyclical and unpredictable companies (those with a predictability rank of one star or less). Peter Lynch warns that cyclical businesses usually have high profit margins near the peaks of business cycles and low profit margins near recessions. Other valuation metrics, including the Shiller P/E and the P/S ratios give more accurate valuations and thus can more accurately determine when a company stock is undervalued. GuruFocus also provides valuation bands for P/B, P/S and P/OCF ratios as indicated in Figure 10. You can access these underneath the Most Popular tab or search for the valuation bands using Search Series. These valuation bands work similarly to those for P/E (nri).
19 Figure 10 GuruFocus provides the P/S valuation bands predefined chart likely because the P/S ratio more accurately identifies when a stock is undervalued then do other valuation ratios. Located just under the Peter Lynch Chart in the Predefined Charts drop down box, the P/S valuation bands graphs the valuation bands at the company s minimum and maximum P/S ratios. Figure 11.1 displays Wal- Mart s P/S valuation bands for all years while Figure 11.2 narrows the chart output to the recent 10 years.
20 Figure 11.1 Figure 11.2
21 With these two charts, we can determine when Wal-Mart s stock is significantly undervalued or significantly overvalued based on P/S valuations. Based on the chart output, we can observe that while Wal-Mart traded near its maximum P/S valuation during the third-quarter of 2008, the stock price gradually decreased near its minimum P/S valuation by the third-quarter of After Wal- Mart s stock price gradually increased to its maximum P/S valuation in 2015, the stock plummeted to its minimum P/S valuation during Investors would realize gains if they bought Wal-Mart during the third quarter of 2011 and sold it after New Year s Day You can also display the valuation at the median P/S to determine the relative valuation of the company. Simply check the Price at Med P/S series, which should be the one between the two automatically selected when you choose the P/S valuation bands predefined chart. Figure 11.3 shows Wal-Mart s valuations at the minimum P/S, the maximum P/S and the median P/S. Figure 11.3
22 Other predefined charts While the previous two predefined charts are likely the most useful, the website also provides several other predefined charts. Income Statement: This predefined chart graphs the company s revenue, gross profit, earnings before interest and taxes (EBIT) and net income. Figure 12.1 displays Wal-Mart s income statement chart. Balance Sheet: This predefined chart graphs the company s cash & cash equivalents, property, plant and equipment (PPE), total assets, total equity and long-term debt. Figure 12.2 displays Wal-Mart s balance sheet chart. GDP & GNP: This predefined chart simply graphs the U.S. gross domestic product (GDP) and gross national product (GNP). dividend yield : This predefined chart just graphs the company s trailing dividend yield. price&revenue : This predefined chart graphs the company s price and revenue. Peter Lynch Chart with Estimates: This predefined chart graphs the company s Peter Lynch Chart with analyst estimates for what may happen to a company s earnings in the short term. Figure 12.3 displays Wal-Mart s Peter Lynch Chart with Estimates. Based on this chart, Wal-Mart s stock price may increase during 2018 based on its estimated earnings. Peter Lynch Chart with regular earnings CTAS: This predefined chart shows the company s price and valuation at its median P/S.
23 Figure 12.1 Figure 12.2
24 Figure Customized series and user-defined charts in Interactive Charts We have recently introduced two user-friendly features within Interactive Charts: customized series and user-defined charts. These further increase the interactivity of the Charts feature. Customized series If you try to search for Sloan Ratio in the search series box, you will notice that we do not have the Sloan Ratio as one of the available series. However, with the customized series feature, we can graph this series as a function of other, available series. Let us focus on Baidu, one company stock that has poor earnings quality based on its Sloan Ratio. This ratio is defined as follows: Sloan Ratio % = 100 * (Net Income Cash Flow from Operations Cash Flow from Investing) / (Total Assets) To create a customized series, first click on the Customized Series button among the list of buttons in Figure 6. Figure 13 repeats Figure 6 with the Customized Series button highlighted.
25 Figure 13 Once you click on Customized Series, you should see a pop-up box similar to the one displayed in Figure In the textbox given, you can type in the formula for the customized series. For our example, you would type 100 * ( Net Income Cash Flow from Operations Cash Flow from Investing ) / Total Assets Note some particulars about your formula: the parameters must have single quotes around them and are case-sensitive. As you type into the text box, the drop-down menu will populate the available financial metrics that match the letters you entered. You can select the term for accuracy, as mentioned in the pop-up box. Figure 13.1 Once you enter your formula, you will see a screen similar to one shown in Figure 13.2, which displays your formula, tells you if it is valid or not and allows you to name the customized series and pick the appropriate Y-axis. You must choose one of the Y-axis options given before you can finish the series.
26 Figure 13.2 Option 2 is most appropriate for the Sloan Ratio as it is a ratio. Choose Option 2 and click Finish to save the series. However, by saving the series, you reset the interactive chart. You can click Reset All to return the chart to show the price line. Remove Price to return to a blank chart. Figure 13.3 shows Baidu s annual Sloan Ratio for the past 10 years.
27 Figure 13.3 To edit or delete a customized series, first hover the mouse over the desired customized series. Note that this also pop-ups the formula used to draw the series. Use the pencil on clipboard button to edit the series or the X to delete the series.
28 Saving user-defined charts In addition to creating customized series, you can also create user-defined charts with the Interactive Charts feature. As discussed in the GuruFocus research article on the predictability rank, the revenue per share and EBITDA per share metrics can determine how predictable a company earnings have been for the previous 10 years. We will name this chart the Predictability Chart. To save a user-defined chart, first select the series that you want to graph. Then, among the options listed in Figure 6 (and Figure 13), type in the chart name in the Chart Name box and click Save. You can view your user-defined charts below the predefined charts discussed in section 3 of this user manual. Figure 14 shows the Predictability Chart for Amazon.com, a company that has a fivestar predictability rank as of the writing of this manual. Figure 14 While you cannot delete the predefined charts, you can delete a user-defined chart by first selecting the desired chart to delete and then pressing the Delete button next to the chart name. Click OK in the dialog box that appears, as illustrated in Figure 14.1.
29 Figure 14.1
30 5. Adding text and shapes to the chart GuruFocus has recently remodeled the Interactive Chart feature to make it as user-friendly as possible. If you recall from Figure 2, we have numbered some characteristics of the Interactive Charts interface. Figure 15 repeats Figure 2 with the addition of position 5, the location of the following features: T: This feature allows you to add text to the chart. Square: This feature allows you to add squares and rectangles to the chart. Line: This feature allows you to add lines to the chart. Circle: This feature allows you to add circular shapes to the chart. Figure 15 These features, collectively known as the Drawing Toolbox, allow you to highlight certain parts of the chart output and write brief discussions about the chart output. Figure 16 displays Apple s Peter Lynch Chart with these features in use.
31 Figure 16 As you can observe, Figure 15 highlights the time periods when AAPL traded below its Peter Lynch earnings line, i.e., the times where AAPL is undervalued. Additionally, the text discusses that Apple is currently undervalued. To reproduce Figure 16, use the Square tool to highlight the sections of the Chart where the green price line dipped below the red earnings line. To add text, use the T tool. The Line feature allows you to draw a line on the interactive chart. This can help you determine when a stock trades below a specific price target. Additionally, for mergers and acquisitions, the line feature allows you to determine the fairness of the target price. Figure 17 illustrates this by considering SolarCity s stock price.
32 Figure 17 Notes to Figure 17: We have drawn the line around $25.37, the target price for Tesla s acquisition of SolarCity. Based on Figure 17, you can observe that the current price represents a discount to the target price and that the target price is slightly unfair to shareholders. While you cannot delete shapes from the chart without resetting the chart, one work around is to use the text setting, and then drag the shapes one by one to the corner, then resizing them so that they disappear from the chart.
33 6. Some frequently asked questions How is the financial information presented, i.e., is the data trailing 12-months, annual, etc.? o The data for most financial metrics are trailing 12-month data. Due to this, you need to pay attention to the values used in your customized series. What membership do you need to use Interactive Charts? o The free membership gives limited access to Interactive Charts. Most features, including customized series and exporting to Excel, requires Premium membership. We invite you to start a free seven-day trial by clicking this link. Can I change the colors of the series? o As of Nov. 18, the writing of this manual, we do not have this service. The series colors have a fixed order.
GuruFocus User Manual: Interactive Charts version
 GuruFocus User Manual: Interactive Charts 2018 version 1 Contents: 0. Introduction and Overview a. Accessing Interactive Charts b. Interactive Chart Layout 1. Adding Stocks to the Chart 2. Graphing Financial
GuruFocus User Manual: My Portfolios
 GuruFocus User Manual: My Portfolios 2018 version 1 Contents 1. Introduction to User Portfolios a. The User Portfolio b. Accessing My Portfolios 2. The My Portfolios Header a. Creating Portfolios b. Importing
GuruFocus User Manual: All-in-One Guru Screener and Backtesting
 GuruFocus User Manual: All-in-One Guru Screener and Backtesting 2018 version 1 Contents One. Two. Three. Four. All-in-One Guru Screener: Basic Features 1. Introduction and Access a. Introduction to the
GuruFocus User Manual: New Guru Pages
 GuruFocus User Manual: New Guru Pages September 2018 version Contents: 0. Introduction a. What is a guru? b. New Guru Pages Overview 1. Key Guru Statistics 2. The Flash Chart 3. The Portfolio Composition
Ratios Current Industry Historical Median
 [1] $ 97.99 Retail - Defensive - Discount Stores Market Cap: $ 289,153 Mil Walmart Inc operates retail stores in various formats under various banners. Its operations comprise of three reportable business
Analyzing the Elements of Real GDP in FRED Using Stacking
 Tools for Teaching with Analyzing the Elements of Real GDP in FRED Using Stacking Author Mark Bayles, Senior Economic Education Specialist Introduction This online activity shows how to use FRED, the Federal
Investoscope 3 User Guide
 Investoscope 3 User Guide Release 3.0 Copyright c Investoscope Software Contents Contents i 1 Welcome to Investoscope 1 1.1 About this User Guide............................. 1 1.2 Quick Start Guide................................
Ratios Current Industry Historical Median
 [1] 51.90 Medical Devices Market Cap: 820 Mil Draegerwerk AG & Co KGaA provides medical and safety technology. The Company has two main divisions: safety division and medical division. It provides Fire
3. Entering transactions
 3. Entering transactions Overview of Transactions functions When you place an order to buy or short sell, you should immediately enter the transaction into the appropriate portfolio account so that the
Analyzing the Elements of Real GDP in FRED Using Stacking
 Tools for Teaching with Analyzing the Elements of Real GDP in FRED Using Stacking Author Mark Bayles, Senior Economic Education Specialist Introduction This online activity shows how to use FRED, the Federal
Principia Research Mode Online Basics Training Manual
 Principia Research Mode Online Basics Training Manual Welcome to Principia Research Mode Basics Course, designed to give you an overview of Principia's Research Mode capabilities. The goal of this guide
How to Create a Spreadsheet With Updating Stock Prices Version 2, August 2014
 How to Create a Spreadsheet With Updating Stock Prices Version 2, August 2014 by Fred Brack NOTE: In December 2014, Microsoft made changes to their portfolio services online, widely derided by users. My
INVESTOR360 USER GUIDE
 INVESTOR360 USER GUIDE TABLE OF CONTENTS Logging In to Investor360 1 First-time user 1 Existing user 2 Resetting your password 3 Portfolio Tab 5 Overview 5 Holdings 9 Activity 13 Account Profile 15 Statements
Research Wizard: UPGRADE (March 2006) Descriptions and Screenshots
 Descriptions and Screenshots") Research Wizard: UPGRADE (March 2006) Descriptions and Screenshots Once a backtest report is run, one of the first new things you ll see is an Automatically Generated Performance Chart in the bottom right
Research Wizard: UPGRADE (March 2006) Descriptions and Screenshots Once a backtest report is run, one of the first new things you ll see is an Automatically Generated Performance Chart in the bottom right
TAA Scheduling. User s Guide
 TAA Scheduling User s Guide While every attempt is made to ensure both accuracy and completeness of information included in this document, errors can occur, and updates or improvements may be implemented
You should already have a worksheet with the Basic Plus Plan details in it as well as another plan you have chosen from ehealthinsurance.com.
 In earlier technology assignments, you identified several details of a health plan and created a table of total cost. In this technology assignment, you ll create a worksheet which calculates the total
Getting Ready to Trade
 Section VI. Getting Ready to Trade In This Section 1. Adding new securities 78 2. Updating your data 79 3. It's important to keep your data clean 80 4. Using Real-Time Alerts 81 5. Monitoring your tickers
Budget - By Salesperson
 Budget - By Salesperson Entering a budget is easy. Follow these five steps to get started. Version 2013.12.21.01 1 Create a template. Before you can enter a budget, you first need to create a template.
Creating and Monitoring Defined Contribution Plans in Advisor Workstation
 Creating and Monitoring Defined Contribution Plans in Advisor Workstation Disclaimer - - - - - - - - - - - - - - - - - - - - - - - - - - - - - - - - - - - - - 1 Overview - - - - - - - - - - - - - - - -
Using the Clients & Portfolios Module in Advisor Workstation
 Using the Clients & Portfolios Module in Advisor Workstation Disclaimer - - - - - - - - - - - - - - - - - - - - - - - - - - - - - - - - - - - - - 1 Overview - - - - - - - - - - - - - - - - - - - - - -
StockFinder Workbook. Fast and flexible sorting and rule-based scanning. Charting with the largest selection of indicators available
 StockFinder Workbook revised Apr 23, 2009 Charting with the largest selection of indicators available Fast and flexible sorting and rule-based scanning Everything you need to make your own decisions StockFinder
Creating a Standard AssetMatch Proposal in Advisor Workstation 2.0
 Creating a Standard AssetMatch Proposal in Advisor Workstation 2.0 - - - - - - - - - - - - - - - - - - - - - - - - - - - - - - - - - - - - - - 1 What you will learn - - - - - - - - - - - - - - - - - -
INTRODUCTION CHAPTER 1
 INTRODUCTION CHAPTER 1 Autochartist offers traders automated market-scanning tools that highlight trade opportunities based on support and resistance levels. Autochartist products include: Chart pattern
Navigating Bill It Now
 Version 3 9/16/2011 Navigating Bill It Now Using your internet browser, go to www.billitnow.com Click on the Log In link located at the top right hand corner of the screen to display the BMS Login Screen,
Portfolio Manager. Chapter VI. In this Chapter
 Chapter VI. Portfolio Manager In this Chapter The Portfolio Manager is TradingExpert Pro s portfolio tracking and management application. One of its important features is an easy to use stop system. Portfolio
Disclaimer. CoreSSG Quick Start Guide. Today s Presentation. BetterInvesting s Online Tools CoreSSG Tutorial. Prepared by BetterInvesting
 s Online Tools CoreSSG Tutorial Prepared by Version: July 27, 2016 Disclaimer The information in this presentation is for educational purposes only and is not intended to be a recommendation to purchase
Spreadsheet Directions
 The Best Summer Job Offer Ever! Spreadsheet Directions Before beginning, answer questions 1 through 4. Now let s see if you made a wise choice of payment plan. Complete all the steps outlined below in
Contents. Introduction
 Getting Started Introduction O&M Profiler User Guide (v6) Contents Contents... 1 Introduction... 2 Logging In... 2 Messages... 3 Options... 4 Help... 4 Home Screen... 5 System Navigation... 5 Dashboard...
Setting Stops for Transactions in Profit Manager
 Section V. Setting Stops for Transactions in Profit Manager In This Section Variable Stop 72 Trendline Stop 72 Fixed Stop 73 Trailing Stop 73 EDS Rule Stop 73 Entering transactions into Profit Manager
Dear Client, We appreciate your business!
 FTJ FundChoice Website Guide Page 1 Dear Client, Thank you for choosing FTJ FundChoice. This guide will assist you in managing your online account at: www.portfoliologin.com. In keeping with our mission
Using the Merger/Exchange Wizard in Morningstar Office
 in Morningstar Office Overview - - - - - - - - - - - - - - - - - - - - - - - - - - - - - - - - - - - - - - 1 Can I use the Merger Wizard for all security types? - - - - - - - - - - - - - - - - - - 1 Can
Streaming Real Time Quotes Service User Guide. Version 5.3
 Streaming Real Time Quotes Service User Guide www.easecurities.com.hk Version 5.3 Table of Content 1. Introduction... 3 2. System requirement... 4 2.1 Hardware requirements... 4 2.2 Software requirements...
Finance. Training Manual
 Finance Training Manual Introduction to Finance Module Shepherd s Staff Finance module lets you keep track of your church s financial information. This manual will walk you through setting up a chart of
Introduction to Client Online
 Introduction to Client Online Trade Finance Guide TradeFinanceNewClientsV2Sept15 Contents Introduction 3 Welcome to your introduction to Client Online 3 If you have any questions 3 Logging In 4 Welcome
How to Use Fundamental Data in TradingExpert Pro
 Chapter VII How to Use Fundamental Data in TradingExpert Pro In this chapter 1. Viewing fundamental data on the Fundamental Report 752 2. Viewing fundamental data for individual stocks 755 3. Building
What's New in TradeStation 9.1: Update 22
 What's New in TradeStation 9.1: Update 22 With TradeStation 9.1: Update 22, we introduce support for mini options trading in TradeStation. Now customers with updates after Update 18 will be able to trade
The claims will appear on the list in order of Date Created. The search criteria at the top of the list will assist you in locating past claims.
 P r a c t i c e M a t e M a n u a l 63 CLAIMS/BILLING TAB Your claim submissions are managed in the Claims/Billing Tab. Claims can be printed, deleted, submitted or unsubmitted here, and rejected or failed
Quick Reference Guide. Employer Health and Safety Planning Tool Kit
 Operating a WorkSafeBC Vehicle Quick Reference Guide Employer Health and Safety Planning Tool Kit Effective date: June 08 Table of Contents Employer Health and Safety Planning Tool Kit...5 Introduction...5
University of Texas at Dallas School of Management. Investment Management Spring Estimation of Systematic and Factor Risks (Due April 1)
") University of Texas at Dallas School of Management Finance 6310 Professor Day Investment Management Spring 2008 Estimation of Systematic and Factor Risks (Due April 1) This assignment requires you to perform
University of Texas at Dallas School of Management Finance 6310 Professor Day Investment Management Spring 2008 Estimation of Systematic and Factor Risks (Due April 1) This assignment requires you to perform
Quick Reference Guide: General Budget Change
 Quick Reference Guide: General Budget Change In the USC Kuali system, every type of transaction is created and submitted in the form of an electronic document referred to as an edoc. The Kuali Financial
Morningstar Office Academy Day 4: Research and Workspace
 Morningstar Office Academy Day 4: Research and Workspace - - - - - - - - - - - - - - - - - - - - - - - - - - - - - - - - - - - - - - 1 Lesson 1: Modifying Research Settings.......................................
HedgeTools User Manual
 HedgeTools User Manual A real-time monitoring and analysis of the stocks on the NYSE and NASDQ exchanges Last update: August 29, 2018 Charles Brauer Cypress Point Technologies, LLC Carmel, California 93923
Policy. Chapter 6. Accessing the Policy. Nexsure Training Manual - CRM. In This Chapter
 Nexsure Training Manual - CRM Policy In This Chapter Accessing the Policy Adding a Thank You Letter Editing the Policy Adding, Editing and Removing Assignments Admitted Carrier Identification Summary of
Frank Winston Crum Billing Quick Reference Guide. Version 3 9/16/2011
 Frank Winston Crum Billing Quick Reference Guide Version 3 9/16/2011 Navigating Bill It Now Using your internet browser, go to www.billitnow.com Click on the Log In link located at the top right hand corner
2. Stock Recommendations: When you click on the Stocks you can view recommendations for your stocks that you currently hold
 Table of Contents Overview... 2 New Features... 2 Key differences from the old platform... 3 Reasons to Adjust Transactions... 4 Asset class Information & known issues... 6 Stocks... 6 Graphs... 6 Pending
QUICK START. Your Guide to Using Telemet Orion
 QUICK START Your Guide to Using Telemet Orion 1 Your Telemet investment platform is organized into Workspaces and component displays. Component displays are individual windows with market data, charts,
Budget Estimator Tool & Budget Template
 Budget Estimator Tool & Budget Template Integrated Refugee and Immigrant Services Created for you by a Yale School of Management student team IRIS BUDGET TOOLS 1 IRIS Budget Estimator and Budget Template
Client Software Feature Guide
 RIT User Guide Build 1.01 Client Software Feature Guide Introduction Welcome to the Rotman Interactive Trader 2.0 (RIT 2.0). This document assumes that you have installed the Rotman Interactive Trader
Finance Self Service Financial Systems
 Finance Self Service Financial Systems Finance Self Service Financial Systems 2008 University of North Florida Center for Professional Development & Training 1 UNF Drive, Jacksonville, Fl 32224 904.620.1707
Genium INET PRM User's Guide
 TM Genium INET NASDAQ Nordic Version: 4.0.0250 Document Version: 11 Publication Date: Wednesday, 6th May, 2015 Confidentiality: Non-confidential Whilst all reasonable care has been taken to ensure that
Learning TradeStation. News, Time & Sales, Research, Browser, and Ticker Bar
 Learning TradeStation News, Time & Sales, Research, Browser, and Ticker Bar Important Information No offer or solicitation to buy or sell securities, securities derivative or futures products of any kind,
GRANTEE PORTAL: Working with Proposal Budgets, to Submit
 GRANTEE PORTAL: Working with Proposal Budgets, to Submit The following will show you how to create a proposal budget and submit it to the Foundation. LOG IN TO THE GRANTEE PORTAL Please note that the Foundation
P2 Explorer for Qbyte FM
 P2 Explorer for Qbyte FM 1 Introduction 2 Overview the Interface 3 P2 Explorer Framework 4 Administration Settings 4.1 Charts 4.2 Line Graphs 4.3 Bar Graphs 4.4 Sparklines 4.5 Bullet Graphs 5 Getting Started
Fiscal Closing Methods Summary
 Fiscal Closing Methods Summary Update 1/27/2017 FALSC 1 What is Fiscal Close? In general terms, Fiscal Closing is the process of closing one set of financial books at the end of the current fiscal year
Introduction to Client Online
 Introduction to Client Online Bibby Factors International Guide 1 InternationalFactoringNewClientBibbyUKopsSept15 Introduction 3 Logging In 5 Welcome Screen 6 Navigation 7 Viewing Your Account 9 Invoice
Tutorial. Morningstar DirectSM. Quick Start Guide
 April 2008 Software Tutorial Morningstar DirectSM Quick Start Guide Table of Contents Quick Start Guide Getting Started with Morningstar Direct Defining an Investment Lineup or Watch List Generating a
GL Budgets. Account Budget and Forecast. Account Budgets and Forecasts Menu
 Account Budget and Forecast The Account Budget and Forecast function allows you to enter and maintain an unlimited number of budgets and/or forecasts values and types. When setting up the account budgets
+44 (0)
") FXCM Inc., a publicly traded company listed on the New York Stock Exchange (NYSE: FXCM), is a holding company and its sole asset is a controlling equity interest in FXCM Holdings, LLC. Forex Capital Markets
FXCM Inc., a publicly traded company listed on the New York Stock Exchange (NYSE: FXCM), is a holding company and its sole asset is a controlling equity interest in FXCM Holdings, LLC. Forex Capital Markets
Fiscal Software User s Guide, BSA April Chapter 6 - Project Maintenance
 Chapter 6 - Project Maintenance This Section Includes: 6.1 Project Definition and Use 6.2 Adding Projects 6.3 Managing Deferred Projects 6.3.1 Allocations 6.3.1.1 Monthly Allocation of Deferred Values
Autochartist User Manual
 Autochartist User Manual compliance@ifxbrokers.com www.ifxbrokers.com +27 42 293 0353 INTRODUCTION Chapter 1 Autochartist offers traders automated market-scanning tools that highlight trade opportunities
Trading Diary Manual. Introduction
 Trading Diary Manual Introduction Welcome, and congratulations! You ve made a wise choice by purchasing this software, and if you commit to using it regularly and consistently you will not be able but
Any symbols displayed within these pages are for illustrative purposes only, and are not intended to portray any recommendation.
 PortfolioAnalyst Users' Guide October 2017 2017 Interactive Brokers LLC. All Rights Reserved Any symbols displayed within these pages are for illustrative purposes only, and are not intended to portray
Maintaining Budget Change Requests
 Maintaining Budget Change Requests This document describes the functions used in TEAMS to enter and approve requests to move funds from one General Ledger account to another. In this document: Request
BELEX.info User Manual
 www.belex.info User Manual Belgrade Stock Exchange September, 2014 Welcome W Saddeeee Sadr Guidelines Through the Improved Version of the Belgrade Stock Exchange Service for Distribution of Real-Time Trading
Volcone Users Manual V2.0
 Volcone Users Manual V2.0 Thank you for purchasing our new Volcone Analyzer PRO V 2.0 software. This program will become a very important part of your option trading arsenal, if used properly. Please review
Customizing Properties
 Section 5. Customizing Properties The Properties function is used for the entry and modification of the data that, along with the price information retrieved through the internet, is the basis for the
Gtrade manual version 2.04 updated
 Gtrade manual version 2.04 updated 9.30.2016 Table of Contents Contents Table of Contents2 Getting started, Logging in and setting display language in TurboTick Pro3 Level 25 Order Entry8 Streamlined Order
Clearing Admin. Broker Permissioning User Guide
 Clearing Admin Broker Permissioning User Guide This material may not be reproduced or redistributed in whole or in part without the express, prior written consent of IntercontinentalExchange, Inc. Copyright
DUS DocWay TM Loan Documents User Guide. January 2019
 DUS DocWay TM Loan Documents User Guide January 2019 Table of Contents Getting Started with DUS DocWay... 1 Welcome Page Navigation... 3 Loan Documents Navigation... 6 Update Document Category and Type...
Data Integration with Albridge Solutions and Advisor Workstation 2.0
 Data Integration with Albridge Solutions and Advisor Workstation 2.0 This document explains how to import both portfolios and core accounts from Albridge into Morningstar s Advisor Workstation 2.0. Overview
This document will provide a step-by-step tutorial of the RIT 2.0 Client interface using the Liability Trading 3 Case.
 RIT User Guide Client Software Feature Guide Rotman School of Management Introduction Welcome to Rotman Interactive Trader 2.0 (RIT 2.0). This document assumes that you have installed the Rotman Interactive
MUNICIPAL REPORTING SYSTEM. SOE Budget (SOE-B) User Guide June 2017
 User Guide June 2017") MUNICIPAL REPORTING SYSTEM SOE Budget (SOE-B) User Guide June 2017 Crown copyright, Province of Nova Scotia, 2017 Municipal Reporting System SOE Budget (SOE-B) User Guide Municipal Affairs June 2017 ISBN:
MUNICIPAL REPORTING SYSTEM SOE Budget (SOE-B) User Guide June 2017 Crown copyright, Province of Nova Scotia, 2017 Municipal Reporting System SOE Budget (SOE-B) User Guide Municipal Affairs June 2017 ISBN:
Introduction to Basic Excel Functions and Formulae Note: Basic Functions Note: Function Key(s)/Input Description 1. Sum 2. Product
/Input Description 1. Sum 2. Product") Introduction to Basic Excel Functions and Formulae Excel has some very useful functions that you can use when working with formulae. This worksheet has been designed using Excel 2010 however the basic
Introduction to Basic Excel Functions and Formulae Excel has some very useful functions that you can use when working with formulae. This worksheet has been designed using Excel 2010 however the basic
User Guide to the Budget Process
 User Guide to the Budget Process 2/22/2018 Contents 1. Adaptive Insights... 2 2. Browsers... 2 3. Nomenclature... 2 4. User Security - Roles and Levels... 2 5. Logging into Adaptive Insights... 3 6. Budget
Introduction to Client Online
 Introduction to Client Online Construction Finance Guide ConstructionFinanceNewClientsV2Sept15 Contents Introduction 3 Welcome to your introduction to Client Online 3 If you have any questions 3 Logging
Using the Principia Suite
 Using the Principia Suite Overview - - - - - - - - - - - - - - - - - - - - - - - - - - - - - - - - - - - - - -1 Generating Research Mode Reports........................................... 2 Overview -
Gatekeeper Module Gatekeeper Version 3.5 June
 Title Budget of document & Business Planning Sub Setup heading & Quick i.e version Start xxx Guide Gatekeeper Module Gatekeeper Version 3.5 June 2016 www.farmplan.co.uk 01594 545022 Gatekeeper@farmplan.co.uk
HEALTH SAVINGS ACCOUNT (HSA) INVESTMENT PORTAL GUIDE
 INVESTMENT PORTAL GUIDE") HEALTH SAVINGS ACCOUNT (HSA) INVESTMENT PORTAL GUIDE Table of Contents HOME PAGE... 3 Menu Bar... 3 Welcome to your HSA Investment Account... 3 Your Investment Portfolio... 3 Your Investment Elections:...
HEALTH SAVINGS ACCOUNT (HSA) INVESTMENT PORTAL GUIDE Table of Contents HOME PAGE... 3 Menu Bar... 3 Welcome to your HSA Investment Account... 3 Your Investment Portfolio... 3 Your Investment Elections:...
Synaptic Analyser USER GUIDE
 Synaptic Analyser USER GUIDE Version 1.0 October 2017 2 Contents 1 Introduction... 3 2 Logging in to Synaptic Analyser... 3 3 Client Screen... 5 3.1 Client Details... 6 3.2 Holdings... 6 3.3 Income Sources...
StuckyNet-Link.NET User Interface Manual
 StuckyNet-Link.NET User Interface Manual Contents Introduction Technical Information General Information Logging In & Out Session Timeout Changing Your Password Working with the Borrowing Base Creating
SPSS I: Menu Basics Practice Exercises Target Software & Version: SPSS V Last Updated on January 17, 2007 Created by Jennifer Ortman
 SPSS I: Menu Basics Practice Exercises Target Software & Version: SPSS V. 14.02 Last Updated on January 17, 2007 Created by Jennifer Ortman PRACTICE EXERCISES Exercise A Obtain descriptive statistics (mean,
PNC BENEFIT PLUS HSA INVESTMENT USER GUIDE. Home Page and Dashboard Navigation. pnc.com/pncbenefitplus
 PNC BENEFIT PLUS HSA INVESTMENT USER GUIDE Home Page and Dashboard Navigation Top Right Quick Link Options: Home (will always return to the screen below), Print Screen and Logout. Menu Bar: Contains your
ShelbyNext Financials: General Ledger Budgeting
 ShelbyNext Financials: General Ledger Budgeting (Course #F136) Presented by: Erin Ogletree Shelby Contract Trainer 2018 Shelby Systems, Inc. Other brand and product names are trademarks or registered trademarks
Multifamily Securities Investor Access Desk Reference Manual
 Multifamily Securities Investor Access Manual February 2013 Contents 1 Application Overview... 3 2 Minimum Browser Requirements... 3 3 Contacting Investor Access Tool Administrator... 3 4 Accessing and
Part 5. Quotes Application. Quotes 691
 Part 5. Quotes Application Quotes 691 692 AIQ TradingExpert Pro User Manual Quotes Application In This Section Overview 694 Getting Started 695 News headline monitor 696 The quotes monitor 697 Quotes 693
Money Management (MX) Frequently Asked Question s
 Frequently Asked Question s") Money Management (MX) Frequently Asked Question s Account Maintenance How do I get rid of duplicate accounts? How do I permanently delete an account? How do I hide/exclude an account? How do I rename my
Money Management (MX) Frequently Asked Question s Account Maintenance How do I get rid of duplicate accounts? How do I permanently delete an account? How do I hide/exclude an account? How do I rename my
Morningstar Direct. Regional Training Guide
 SM Morningstar Direct Regional Training Guide Morning Session on Basic Overview The main objective of the morning session is become familiar with the basic navigation and functionality of Morningstar Direct.
Margin Direct User Guide
 Version 2.0 xx August 2016 Legal Notices No part of this document may be copied, reproduced or translated without the prior written consent of ION Trading UK Limited. ION Trading UK Limited 2016. All Rights
WinTen² Budget Management
 Budget Management Preliminary User Manual User Manual Edition: 4/13/2005 Your inside track for making your job easier! Tenmast Software 132 Venture Court, Suite 1 Lexington, KY 40511 www.tenmast.com Support:
emerchantview Service July 23, 2010
 emerchantview Service July 23, 2010 2010 FIRST DATA CORPORATION All Rights Reserved. Printed in U.S.A. This document contains confidential and proprietary information of First Data Corporation. You may
Autotrader Feature Guide. Version 7.6.2
 Autotrader Feature Guide Version 7.6.2 Document Version 7.6.2 DV1 5/14/2009 Legal Notices This document and all related computer programs, example programs, and all TT source code are the exclusive property
Certifying Mortgages for Freddie Mac. User Guide
 Certifying Mortgages for Freddie Mac User Guide December 2017 The Freddie Mac Single-Family Seller/Servicer (Guide) requires a Seller/Servicer selling Mortgages to Freddie Mac to forward the Notes, assignments
Collateral Representation and Warranty Relief with an Appraisal: Loan Coverage Advisor Information
 Collateral Representation and Warranty Relief with an Appraisal: Loan Coverage Advisor establishes and tracks the representation and warranty relief dates for all loans sold to Freddie Mac. It provides
2002 Thomson Financial
 2002 Thomson Financial TABLE OF CONTENTS INTRODUCTION... 1 Welcome... 1 How Thomson ONE Analytics is Used... 1 Contacting Thomson Financial... 2 Getting Started... 2 Manual Conventions... 2 Logging on
MYAITREND. The World s First Free AI Stock Analyst. User Guide
 MYAITREND The World s First Free AI Stock Analyst User Guide MYAITREND User Guide MyAiTrend LLC E-Mail: support@myaitrend.com Table of Contents The First Free AI Stock Analyst... 2 Three Important Principles
And Training Manual. Version 1.1. P a g e 1 22
 And Training Manual Version 1.1 P a g e 1 22 Contents 1 Workspaces 3 2 Watchlist.. 5 3 Graphs.. 8 4 Order Entry 11 5 Linking Panels Together 16 6 Blotter (Positions, Trades, Orders, Order Book).. 17 7
Make sure the client aged receivables balance to the general ledger total. Write off client balances. Pick a date that makes sense: a. b. c. d.
 Overview This document provides conversion tips and instructions for entering client and general ledger beginning balances Entering beginning balances in Nexsure entails bringing balances forward from
General Ledger Plus has several advantages over the standard General Ledger.
 How To Updated: 06/30/2011 2011 Shelby Systems, Inc. All Rights Reserved Other brand and product names are trademarks or registered trademarks of the respective holders. General Ledger Plus has several
The Advanced Budget Project Part D The Budget Report
 The Advanced Budget Project Part D The Budget Report A budget is probably the most important spreadsheet you can create. A good budget will keep you focused on your ultimate financial goal and help you
Chapter 6. Cash Control
 Chapter 6 Cash Control This Page Left Blank Intentionally CTAS User Manual 6-1 Cash Control: Introduction The Cash Control section allows you to enter the beginning balances for the fiscal year. This section