Do the LCAPM Predictions Hold? Replication and Extension Evidence
|
|
|
- Diane Fowler
- 5 years ago
- Views:
Transcription
1 Do the LCAPM Predictions Hold? Replication and Extension Evidence Craig W. Holden 1 and Jayoung Nam 2 1 Kelley School of Business, Indiana University, Bloomington, Indiana 47405, cholden@indiana.edu 2 Cox School of Business, Southern Methodist University, Dallas, Texas 75275, jayoungn@smu.edu ABSTRACT First, we replicate the Liquidity-adjusted Capital Asset Pricing Model (LCAPM) tests of Acharya and Pedersen (2005) using their original methodology and covering both their original time period and a more recent period. We successfully qualitatively replicate the descriptive and the first-stage tables and figures, but are not successful in replicating the second-stage tables that perform cross-sectional tests. In the large majority of cases, our replication evidence fails to support that the main LCAPM predictions all hold simultaneously. Next, we extend tests of the LCAPM following the Lee (2011) methodology and expanding to: (1) three different time periods spanning 90 years, (2) add NASDAQ stocks, (3) use four alternative liquidity measures, and (4) add risk or characteristic factors. Our extension evidence always fails to support that the main predictions of the Lee twobeta LCAPM and of the four-beta LCAPM hold at the same time. Overall, we fail to support that liquidity risk matters in the specific functional form predicted by the LCAPM. However, we are silent on the more general question of whether liquidity risk matters in some different functional form. We make publicly available our SAS code. September 2017 JEL classification: G0, G1, G12. Keywords: Liquidity risk; Liquidity-adjusted CAPM; liquidity measures.
2 1 Introduction In a pioneering and influential article, Acharya and Pedersen (AP) (2005) develop the Liquidity-adjusted Capital Asset Pricing Model (LCAPM), which extends the standard frictionless asset pricing framework to include a random liquidity cost element. They derive an unconditional version of the LCAPM 1 in which the excess return of a security recovers the expected liquidity cost, includes a market risk premium (i.e., the standard Capital Asset Pricing Model (CAPM) risk premium), and provides three new liquidity risk premia. Next, they empirically test the unconditional LCAPM on all New York Stock Exchange (NYSE) and American Stock Exchange (AMEX) stocks with available book-to-market ratios from 1962 to They find that net beta, which combines the market risk beta and the three liquidity risk betas, is priced and that the LCAPM has a higher goodness of fit (R 2 ) than the standard CAPM. We begin by replicating the LCAPM tests of AP using their original methodology, which is based on GMM and uses portfolios as test assets. We cover their original time period of and a more recent period This section of the paper is part of a broad program by Critical Finance Review to replicate the most famous papers in finance. The goal is to build an objective, replicated base of knowledge that the profession can rely upon. In this spirit, we make our SAS code publicly available. We successfully qualitatively replicate the descriptive and first-stage tables and figures that describe the properties of illiquidity portfolios, the innovations of market illiquidity, and the correlations of the portfolio betas. However, we are not successful in replicating the second-stage tables that perform cross-sectional tests under eight different variations of tests assets, portfolio weightings, and added factors. Specifically, when comparing our replicated estimates to the original estimates in these second-stage tables, we find large differences in the number of estimates that are significant, large differences in magnitude of the expected liquidity coefficients, and low similarity in the pattern of which coefficients are significant. 1 Acharya and Pedersen also derive a conditional version of the LCAPM in which the lambda coefficients and beta factors can evolve over time, but they do not test this version. Throughout this paper we exclusively test the unconditional version of the LCAPM. 2
3 We examine what the replication tests tell us about the LCAPM. We find frequent support for the less-critical predictions that the intercept is zero and mean liquidity cost is priced. However, in the large majority of cases we fail to support that the main LCAPM predictions all hold simultaneously. Throughout this paper, we are strict in requiring as our criteria that the main predictions of the LCAPM (i.e., the key predictions that distinguish it from other asset pricing theories) hold true simultaneously. Our replication tests include four different version of the LCAPM that differ in how aggregated or disaggregated the liquidity premia are. We call these four versions the one-beta LCAPM, the AP two-beta LCAPM, the Lee two-beta LCAPM, and the four-beta LCAPM (see formal definitions in the hypothesis section). We find that the AP two-beta LCAPM faces extremely severe multicollinearity with correlations between market beta and net beta always being higher than 97%. Further, we find that the Lee two-beta LCAPM and the four-beta LCAPM face significant multicollinearity when portfolios are used as test assets, but not when individual stocks are used as test assets. Next, we extend tests of the LCAPM using the innovative Lee (2011) methodology, which is based on a three-stage Fama-MacBeth approach and uses individual stocks as test assets. We expand the range of evidence in four ways. First, we analyze two new time periods, and (in addition to the original, time period). Second, we analyze NASDAQ-listed stocks (in addition to NYSE/AMEX-listed stocks). Third, we analyze four alternative liquidity measures: (1) the Corwin and Schultz proxy, (2) closing percent quoted spread, (3) the Amihud proxy, and (4) zeros. Fourth, we analyze the impact of adding Fama and French/Carhart risk factors or alternatively characteristic factors to the model. We robustly test the Lee two-beta LCAPM over the following cases: (five different timeperiod/exchange combinations) multiplied by (four different liquidity measures) multiplied by (three versions of the regression) for a total of 5*4*3 = 60 cases. Summarizing our Lee two-beta LCAPM main prediction results over these 60 cases, we find that: (1) market risk is priced in 20% of the cases, (2) net liquidity risk is priced in 12%, and (3) the market risk coefficient equals the net liquidity risk coefficient in 3
4 0% of the cases. In summary, our extension results always fail to support that the main Lee two-beta LCAPM predictions hold at the same time. We test the four-beta LCAPM predictions over five different time-period/exchange combinations. We find that: (1) market risk is priced in 0% of the cases, (2) the three liquidity risk coefficients are priced with the predicted signs in 7%, and (3) all of the risk coefficients are equal in absolute value and have the predicted signs in 0% of the cases. In summary, our extension results always fail to support that the main four-beta LCAPM predictions hold at the same time. Like AP, we find that the LCAPM has a higher R 2 than the CAPM. We decompose the source of that gain in R 2 into what is attributable to the Amihud and Mendelson-type mean liquidity cost term vs. what is attributable to the LCAPM liquidity risk term. We find that nearly all of the R 2 gain is due to the Amihud and Mendelson-type mean liquidity cost term and very little of the gain is due to the LCAPM liquidity risk term. Overall, we fail to support that liquidity risk matters in the specific functional form predicted by the LCAPM (i.e., that liquidity betas have the predicted signs; that liquidity betas and the market beta are equal in absolute value with the predicted signs; that liquidity betas have economically significant explanatory power). However, we are silent on the more general question of whether liquidity risk matters in some different functional form (perhaps as an APT or ICAPM rational factor/characteristic and/or as a behavioral factor/characteristic). In the prior literature, Amihud and Mendelson (1986) and Brennan and Subrahmanyam (1996) provide evidence that the illiquidity characteristic helps to explain stock returns. Pastor and Stambaugh (2003) and Acharya and Pedersen (2005) provide evidence that liquidity risk is priced. Ben-Rephael, Kadan, and Wohl (2015) provide evidence that the illiquidity characteristic is priced, but liquidity risk is not priced for a large majority of stocks and time periods. Acharya, Amihud, and Bharath (2013) provide evidence that conditional liquidity risk is priced. 4
5 Our paper is closely related to Lee (2011), who tests the LCAPM on a global, regional, and US basis. Lee s main US results from his Tables 3 and 5 find that net liquidity risk is not significant when evaluated at the 1% level. 2 His appendix results based on portfolio test assets find that net liquidity risk is significant at the 10% level in five out of six cases. However, an important point that Lee does not highlight is that in nearly all US cases the market risk coefficient is significantly different from the net liquidity risk coefficient, which fails to support the LCAPM. Thus, our results are generally consistent with Lee. Our paper is also closely related to Kazumori et al. (2018), who replicate AP tests of the LCAPM using US data from and who conduct out-of-sample tests of the LCAPM using US data from and Japanese data from In tests of the AP two-beta LCAPM, they find that the main two LCAPM restrictions (namely, that 1 = 0 and Net > 0) are true at the same time in only 2 cases out of 32 cases tested. Thus, their evidence strongly and robustly fails to support the main LCAPM predictions, which is consistent with our results. The plan of the paper is as follows. Section 2 develops the hypotheses. Section 3 provides our replication tests of the LCAPM following the original AP methodology and covers their original time period as well as a more recent time period. Section 4 provides our extension tests of the LCAPM following the Lee methodology and expanding in four ways. Section 5 concludes. 2 Hypotheses Let i r t, M r t, and asset, respectively. Let f r t be the returns on date t of individual asset i, the market portfolio, and the riskfree i c t and M c t be the percentage liquidity cost on date t of individual asset i and of the market portfolio, respectively. The unconditional version of the LCAPM 3 is given by t t t i f i i i i i E r r E c (1) 2 The 1% level of significance is appropriate considering that his cross-sectional regressions are based on thousands of individual stocks. 3 (1) and (2) are based on Lee (2011), equations (2) and (3). 5
6 where i M i M i M i M 1i Covrt, rt 2i Covct,c t 3i Covrt,c t 4i Covct,rt,,, and, M M M M M M M M (2) Varrt ct Varrt ct Varrt ct Varrt ct and E M M f t E rt ct rt. A fundamental property of the LCAPM is that the risk coefficient is identical across all four risk terms. AP adapt the theory for empirical testing by adding a coefficient times expected liquidity cost net, i 1i 2i 3i term and by defining net beta as 4 i. Thus one of the empirical versions of the unconditional LCAPM that they test 4 is, t t t i f i i net net i E r r E c, (3) net where in order to help keep things straight, we have renamed the coefficient. We refer to (3) as the one-beta LCAPM. In this version, i is the intercept, which is predicted to equal zero. The LCAPM is derived in a theoretical framework of overlapping generations where one-period lived agents use their entire wealth endowment to buy securities on date t (when they are born) and sell all their securities on date t+1 in order to consume (right before they die). Thus, in the theory world 1. In the real world, long-lived investors can make many small trading adjustments over a lifetime. AP argue that should be equal to average monthly turnover. 5 We avoid the difficult question of estimating average monthly turnover and simply test if is significantly positive. There are three LCAPM predictions that can be tested using the one-beta LCAPM. 4 See Acharya and Pedersen (2005), equation (25). 5 They follow the intuition of Amihud and Mendelson (1986), who show that expected returns need to be higher for more illiquid stocks so that the marginal investor can recover their average trading costs. Further, average trading costs are approximately equal to the product of (average monthly turnover) times (average liquidity cost per trade). Comparing this to (3), they argue that κ should be equal to average monthly turnover. 6
7 i Hypothesis 1: The intercept should be equal to zero 0. Hypothesis 2: The coefficient of expected liquidity cost should be greater than zero 0. net Hypothesis 3: The coefficient of net beta should be greater than zero 0. We call any LCAPM prediction on 's, the main LCAPM predictions. So this case, hypothesis 3 is the main one-beta LCAPM prediction. Amihud and Mendelson (1986) develop an asset pricing theory in which individual assets that have higher bid-ask spread should have higher expected returns, though the relationship need not be linear. We can capture the spirit of Amihud and Mendelson by considering a special case of the AP model in which i c t and M c t are constant (i.e. by zeroing out the liquidity risk). In this case, (3) reduces to i f i i 1 1, i t t t. E r r E c (4) In (4), the second term is a linear, Amihud and Mendelson-type mean liquidity cost term. We refer to (4) as the mean liquidity cost CAPM. A challenge for empirically testing the one-beta LCAPM is that it doesn t provide a very sharp separation between the LCAPM (3) and the mean liquidity cost CAPM (4). net That is, if the empirically-estimated coefficient from equation (3) is significantly greater than zero, is that because net, i is truly priced? Or do we obtain that result because the market factor 1,i is priced and the liquidity risk factors are irrelevant for pricing? The empirical test of (3) can t easily distinguish between these two cases. AP also test i f i i 1 1, i net net, i t t t, E r r E c (5) 7
8 which we refer to as the AP two-beta LCAPM. (5) is an odd test in the following sense. Recall that net beta net, i already incorporates all four betas, including the market beta 1i. Thus, the LCAPM predicts 1 that the coefficient of the added term is equal to zero 0. Another way to see this is to compare (5) to (3) and it is clear that the LCAPM predicts that the added term will be zero. A related problem with (5) is that, empirically, we find that the correlation between an extremely severe degree of multicollinearity. 1i and net, i is greater than 97%. Thus, (5) has There are four LCAPM predictions that can be tested using the AP two-beta LCAPM. It predicts hypotheses 1 2, main hypothesis 3, and one more main hypothesis: Hypothesis 4: The coefficient of market risk in the AP two-beta LCAPM should be equal to zero i Lee (2011) divides net beta into two terms: (1) the market beta and (2) the net liquidity risk 5i beta as follows net, i 1i 5 i, (6) where 5i 2i 3i 4 i. This leads to an alternative empirical specification of the LCAPM i f i i 1 1i 5 5 i t t t, E r r E c (7) which we refer to as the Lee two-beta LCAPM. Substituting (6) into (3) and comparing the result to (7), it is clear that the LCAPM also predicts that the market risk coefficient equals the net liquidity risk coefficient 1 5. The Lee two-beta LCAPM allows for a clean test of whether market risk is priced 6 AP do not highlight this test. 8
9 vs. whether net liquidity risk is priced and for a direct test of the fundamental LCAPM prediction that both of 's are equal. There are five LCAPM predictions that can be tested using the Lee two-beta LCAPM. It predicts hypotheses 1 and 2 and three more main hypotheses: Hypothesis 5: The coefficient of market risk in the Lee two-beta LCAPM should be greater than zero Hypothesis 6: The coefficient of net liquidity risk should be greater than zero 0. Hypothesis 7: The market risk coefficient in the Lee two-beta LCAPM should be equal to the net liquidity risk coefficient 1 5. AP also test another version of the LCAPM, which we call the four-beta LCAPM. It is given by i f i i 1 1i 2 2i 3 3i 4 4 i t t t, E r r E c (8) 1i 2i 3i 4i where,,, and are defined in the same way as in (2). This form also allows for a clean test of whether market risk and each of the three liquidity risks are priced and for a direct test of the fundamental LCAPM prediction that all of the 's are equal in absolute value and have the predicted signs (which follows from comparing (1) to (8)). There are five LCAPM predictions that can be tested using the four-beta LCAPM. It predicts hypotheses 1 and 2 and three more main hypotheses: Hypothesis 8: The coefficient of market risk in the four-beta LCAPM should be greater than zero
10 2 Hypothesis 9: The liquidity risk coefficients should have predicted signs as follows 0, 3 0, and 4 0. Hypothesis 10: The risk coefficients should be equal in absolute value and have the predicted signs, such that all of the following relationships should be true simultaneously: Replication Tests of the LCAPM 3.1 Replication Methodology and Data In this section, we replicate tests of the LCAPM using the original AP methodology and covering their original time period ( ), plus an out-of-sample test in a more recent time period ( ). We precisely follow the detailed procedures of AP. Specifically, we analyze all common share stocks listed on NYSE and AMEX 7 that have available book value data in Compustat from July 1, 1962 to December 31, 1999 and from January 1, 2000 to December 31, The book value for the book-to-market ratios is calculated using the fiscal year-end balance sheet data on COMPUSTAT following Ang and Chen (2002). We apply the same filtering methods on the data to form both value-weighted and equally-weighted market portfolios and test portfolios. We measure liquidity by estimating the Amihud (2002) illiquidity measure, multiplying by a market portfolio capitalization ratio to make it stationary, linearly transforming it to match the approximate scale of the percent effective spreads as reported by Chalmers and Kadlec (1998), and capping it to remove outliers. Then we form portfolios in year y based on their year y-1 illiquidity. Specifically, we form 25 illiquidity portfolios sorted by average illiquidity and 25 illiquidity-variation portfolios sorted by the standard deviation of illiquidity. 7 In 2008, NYSE Euronext acquired AMEX. In 2012, the Intercontinental Exchange (ICE) acquired NYSE Euronext. Both the NYSE and AMEX are still operated as separate exchanges, but AMEX has been renamed NYSE American. 10
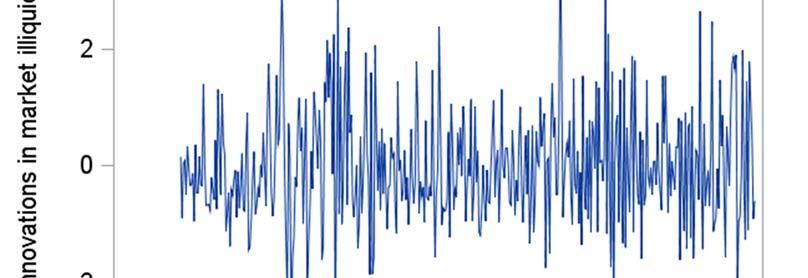
11 We adjust returns for stock delisting following Shumway (1997). We compute innovations in liquidity by truncating the un-normalized illiquidity to remove outliers, forming portfolios, and then collecting the residuals of an AR(2) regression that controls for return, volatility, average illiquidity, log of average dollar volume, log of average turnover, and log of one-month lagged market capitalization. Our AR(2) regression has a R 2 is 80% and a standard error of 0.13%. This is very similar to the AP AR(2) regression, which had a R 2 of 78% and a standard error of 0.17%. We plot the innovations in market liquidity in Figure 1. Panel A shows the AP original figure and panel B shows our replicated figure. Visual inspection suggests that they look very similar. Put Figure 1 about here We use GMM to estimate the cross-sectional regressions that takes into account the pre-estimation of the betas. Standard errors are computed using the Newey and West (1987) method with two lags. Additionally, the GMM method takes serial correlation into account. 3.2 Quantitative vs. Qualitative Replication In order to demonstrate our degree of success in replication, we show the original results of AP and our replicated results in the same table. As will be obvious momentarily, our replicated tables do not obtain the identical numbers as the original tables. Thus, we have not been able to quantitatively replicate AP results in the sense that Ivo Welch describes in his editorial in this issue. However, no published paper in the literature specifies every single detail. And it is very possible that CRSP and Compustat may have updated/corrected some of the data. So now we turn to the question of whether we can qualitatively replicate AP. Specifically, we compare our estimates with the original AP estimates and ask four questions: (1) Do the estimates have the same significant value (e.g., 0 ) or the same significant sign? (2) Are they of the same order of magnitude? (3) Do they have the same pattern (e.g., monotonically increasing) across portfolios? And (4) do they follow the same pattern of which particular estimates are significant? 11
12 3.3 Descriptive and First-Stage Results Table 1 reports the descriptive properties of the illiquidity portfolios, which corresponds to AP Table 1. Panel A shows the AP original portfolio properties for the odd-numbered portfolios. Panel B shows replicated portfolio properties for the same odd-numbered portfolios from Panel C shows recent portfolio properties for the same odd-numbered portfolios from This table (and the rest of the tables in the replication section) include one, two, or three stars to indicate which variables are significant at the 10%, 5%, and 1% levels, respectively. Put Table 1 about here 1p 2p 3p 4p Comparing our replicated values of,,, and in the first four columns of panel B to the original values in panel A, we find that the portfolio betas have nearly the same statistically significant 1 p sign, the same order of magnitude, the same pattern across portfolios (i.e., increases, levels off, and then decreases, 2 p 3 p 4 p monotonically increases, nearly monotonically decreases and nearly monotonically decreases), and nearly the same pattern of which estimates are significant. 8 Comparing the remaining seven columns of panel B to panel A, everything is very similar with roughly the same sign, the same order of magnitude, and the same monotonicity pattern across portfolios. Thus, the portfolio properties are successfully qualitatively replicated for the period Turning to the recent period of , we compare panel C to panel A. We find that the portfolio betas have roughly the same signs, same magnitudes, same pattern across portfolios (except for 3 p which decreases initially, but then starts increasing), and nearly the same pattern of which estimates are significant. Comparing the remaining seven columns of panel C to panel A, everything looks very 8 Following the AP convention, we use a p superscript when the test assets are portfolios and an i superscript when the test assets are individual stocks. 12
13 similar in sign, magnitude, and monotonicity pattern. Thus, the recent period has qualitatively similar properties to the original period. Table 2 reports the correlations of the four first-stage betas for the illiquidity portfolios, which corresponds to AP Table 2. 9 Panels A, B, and C are the original results, the replicated results for , and the recent results for , respectively. The replicated beta correlations in panel B have the same signs and order of magnitudes as the original beta correlations in panel A. Therefore the beta correlations are qualitatively replicated for Put Table 2 about here The recent beta correlations in panel C for have different signs and magnitudes compared to the original beta correlations in panel A for The only explanation that we can find for this is the difference in time period. In both panels B and C, we add the correlations of the four portfolio betas with In the two panels, we find that the correlations between 1 p and 5 p and Net, p. Net, p are and Intuitively, 1 p 2p 3p 4p this very high correlation happens, because is so much larger in magnitude than,, and. 1 p Net, p Hence, very strongly influences the value of. Thus, the correlation between 1 p and Net, p is very close to a perfect correlation of Importantly, this implies that the AP two-beta LCAPM, which includes both 1 p and Net, p as independent variables, faces an extremely severe degree of multicollinearity. In the two panels, we find that the correlations between 1 p and 5 p are and The first correlation raises concern about multicollinearity, but the second correlation is much less concerning. This suggests that the Lee two-beta LCAPM, which includes both 1 p and 5 p as independent variables, sometimes faces significant multicollinearity. Taking the absolute value of the six 9 We skip on replicating the beta correlations for individual stocks (AP Table 3), since individual stocks are not used in the rest of AP. 13
14 correlations between different pairs of 1p 2p 3p 4p,,, and, we find that average absolute value of these six correlations are and 0.540, which are also pretty high. This suggests that the four-beta LCAPM faces significant multicollinearity. 3.4 Common Format of the Second-Stage Tests Next we provide eight tables (table 3 and appendix tables A1-A7) that report second-stage tests. These eight tables follow the same variations of tests assets, portfolio weightings, and added factors as AP. All eight tables have a common format and are presented in the same order as AP. 10 In each table, panel A provides the original AP results for , panel B provides our replicated results for , and panel C provides our recent results (still following the AP methodology) for the period Each panel contains at least eight cross-sectional regressions labeled as lines 1 through 8 in the left-most column. In order they are: (1) One-beta LCAPM with a calibrated expected cost term (in grey shading), 11 (2) One-beta LCAPM with an estimated expected cost term, (3) CAPM, (4) AP two-beta LCAPM with a calibrated expected cost term (in grey shading), (5) AP two-beta LCAPM with an estimated expected cost term, (6) AP two-beta LCAPM with no expected cost term, (7) Four-beta LCAPM with a calibrated expected cost term (in grey shading), and 10 Specifically, Table 3 is based on illiquidity portfolios (AP Table 4A). Table A1 is based on portfolios sorted by the standard deviation of liquidity (AP Table 4B). Table A2 is based on equally-weighted illiquidity portfolios and an equally-weighted market portfolio (AP Table 5A). Table A3 is based on value-weighted illiquidity portfolios and a value-weighted market portfolio (AP Table 5B). Table A4 is based on size portfolios (AP Table 6A). Table A5 is based on portfolios sorted first by book/market and then sorted by size (AP Table 6B). Table A6 is the same as Table 3, except that it adds size and book-to-market factors (AP Table 7A). Table A7 is the same as Table A5, except that it adds size and book-to-market factors (AP Table 7B). 11 For the three cross-sectional regressions with a calibrated expected cost term, there is no analog of the Chalmers and Kadlec (1998) study for the period. In the absence of a straight-forwards way to apply the AP methodology to recalibrate the expected cost value for the period, we simply reuse the expected cost value. Although we include the three regressions with a calibrated expected cost for completeness, we ignore them in interpreting the LCAPM results. That is, we only interpret the regressions with estimated expected cost terms in analyzing the degree of success of the LCAPM. 14
15 (8) Four-beta LCAPM with an estimated expected cost term. We have added two more regressions to panels B and C. They are: (9) Mean liquidity cost CAPM with an estimated expected liquidity cost term and (10) Lee two-beta LCAPM with an estimated expected cost term. Panel D decomposes the source of the R 2 gain in going from the CAPM to the LCAPM. Specifically, it divides the R 2 gain into what is attributable to the Amihud and Mendelson-type mean liquidity cost term vs. what is attributable to the LCAPM liquidity risk term. All of the cross-sectional regressions in this section are based on 25 portfolios. Since the sample size is 25 in each case, we focus our analysis on the 10% level of significance for all tables. Specifically, the two-tailed (one-tailed) t-test with 25 observations has a critical value of (1.316). 3.5 Second-Stage Tests Based On Illiquidity Portfolios Table 3 reports second-stage tests based on 25 illiquidity portfolios. Panels A, B, and C are the original results, the replicated results for , and the recent results for , respectively. Nearly all of the R 2 in the three panels range from 0.65 to 0.95, which is what we would expect with portfolios where most of the idiosyncratic variation has been diversified away. Put Table 3 about here We start with the question of how well panel B replicates panel A. Examining the intercept column for lines 1-8, four are significantly different from zero in panel B versus one in panel A. Considering all of the rest of estimated coefficients (i.e., excluding the calibrated coefficients with grey shading) in lines 1-8, sixteen are significant in panels B versus five in panel A. Considering the magnitude of the estimated P coefficients for expected liquidity Ec, the absolute value of panel B coefficients average 6.7 times larger than the absolute value of panel A coefficients. Next, consider which of the non-intercept coefficients 15
16 are significant at the 10% level. 50% of these coefficients have the same significance pattern in both panels A and B (i.e., both are significant or both are not), but 50% are different. In summary, we find major differences in how many estimates are significant, large differences in magnitude of the expected liquidity coefficients, and a low similarity in which estimates are significant. We conclude that the second-state tests are not qualitatively replicated. Next we turn to the key question of whether the main predictions of four different versions of the LCAPM are true and apply our strict criteria that all of the main predictions need to be true simultaneously. 12 net, p First consider the one-beta LCAPM on line 2. In both panels B and C, is priced (i.e., significant in the direction of the predicted sign). Next consider the AP two-beta LCAPM on line 5. In panel B, 1 p is insignificantly different from zero (as the LCAPM predicts), but net, p is not priced. In 1 p net, p panel C, is insignificantly different from zero and is priced. Now turn to the Lee two-beta LCAPM on line 10. In panel B, 1 p is not priced and 5 p is not priced. In panel C, 5 p is priced. Finally, consider the four-beta LCAPM on line 8. In panel B, but 3 p and 4 p are priced. In panel C, 2 p and 3 p are not priced, but 1 p and 1 p and 1 p is priced and 2 p are not priced, 4 p are priced. In summary, out of eight cases (four LCAPM versions X 2 panels), the main LCAPM predictions all hold true in four cases and two of these four cases are based on the one-beta LCAPM, which is difficult to empirically distinguish from the mean liquidity cost CAPM. Like AP, we find that the LCAPM has a higher R 2 than the CAPM. For example, if you take the one-beta LCAPM R 2 in line 2 and subtract the CAPM R 2 in line 3, you get an R 2 gain of in panel B and of in panel C. Panel D decomposes the source of that R 2 gain into what is attributable to the expected liquidity cost term vs. what is attributable to the net liquidity risk term. This is done by comparing 12 More specifically, in the replication section we test all of the main predictions excluding hypotheses and hypothesis 10. In the extension section, we test all of the main predictions including hypotheses 7 and
17 to line 9, which estimates the mean liquidity cost CAPM with an estimated mean liquidity cost term. Taking the mean liquidity cost CAPM R 2 in line 9 and subtracting the CAPM R 2 in line 3, we find that adding an i expected liquidity cost t E c term yields a large R 2 gain of in and in Taking LCAPM R 2 in line 2 and subtracting the mean liquidity cost CAPM R 2 in line 9, we find that 1i, switching from the CAPM market beta to the LCAPM net beta net i, yields a tiny R 2 gain of just in and just in Similarly, the R 2 gain from adding 5 p to obtain the Lee two-beta LCAPM is small (0.005 and 0.030) and the R 2 gain from adding 2p 3p 4p,, and to obtain the four-beta LCAPM is small (0.022 and 0.034). Thus, we conclude that nearly all of R 2 gain is due to the Amihud and Mendelson-type mean liquidity cost term and very little is due to LCAPM liquidity risk. In summary, we are not able to qualitatively replicate the second-stage results, in half of the cases the main LCAPM predictions are not true at the same time, and nearly all of R 2 gain is due to the Amihud and Mendelson-type mean liquidity cost term and very little is due to LCAPM liquidity risk. 3.6 Summary of All Second-Stage Tests Table 4 summarizes the LCAPM prediction success across the eight second-stage tables (i.e., tables 3 and A1-A7). Panels A, B, C, and D summarize how frequently the LCAPM predictions (hypotheses) are true 13 for the one-beta, AP two-beta, Lee two-beta, and four-beta LCAPM, respectively. Put Table 4 about here Panel A summarizes the frequency that three hypotheses of the one-beta LCAPM are true. It is based on line 2 in (eight tables) times (three panels each) for a total of 24 cases. The first row summarizes our findings that the hypothesis 0 is true in 70.8% of the cases (i.e., in 17 times out of 24 cases), 0 13 For any hypothesis that predicts that a coefficient is greater than zero or less than zero, we consider it to be true only when the estimated coefficient has the predicted sign and is significant in a one-tail test at the 10% level. For a hypothesis that predicts a coefficient is equal to zero, we consider it to be true only when the estimated coefficient is insignificantly different from zero in a two-tail test at the 10% level. 17
18 Net is true in 75.0%, and 0 in 83.3%. On the surface, these results appear to be supportive of the LCAPM. However, recall that the one-beta LCAPM doesn t provide a very sharp separation between the LCAPM and the mean liquidity cost CAPM. Panel B summarizes the frequency that four hypotheses of the AP two-beta LCAPM are true. It is based on line 5 in (eight tables) times (three panels each) for a total of 24 cases. Focusing on the main 1 Net hypotheses, we find that 0 is true in 58.3% of the cases and 0 in 31.3%. Given the extremely severe multicollinearity between 1 p and Net. p, it is not surprising that 1 and Net frequently have 1 Net opposite signs. So importantly we consider how often both of the main hypotheses, 0 and 0, are true at the same time. This happens in only 16.7% of cases. Thus, the AP two-beta CAPM is not supported 83.3% of the time. Panel C summarizes the frequency that four hypotheses of the Lee two-beta LCAPM are true. It is 1 based on line 10 in (eight tables) times (two panels each) for a total of 16 cases. We find that 0 is true in 68.8% of the cases and 5 0 in 31.3%. Given that sometimes there is significant multicollinearity between 1 p and 5 p, it is important to consider how often both of the main hypotheses, 1 0 and 5 0, are true at the same time. This happens in only 25.0% of cases. Thus, the Lee two-beta CAPM is not supported 75.0% of the time. Panel D summarizes the frequency that six hypotheses of the four-beta LCAPM are true. It is based on line 8 in (eight tables) times (three panels each) for a total of 24 cases. We find that 1 0 is true in 41.7% of the cases and the three liquidity betas are priced in 0.0%, 20.8%, and 33.3%, respectively. Given significant multicollinearity between the four portfolio betas, it is important to consider how often all four lambda predictions are true at the same time. This happens 0.0% of cases. Thus, the four-beta LCAPM is not supported 100% of the time. 18
19 Finally, we turn to the R 2 decomposition. In panel A, we find that adding an expected liquidity cost term yields a large R 2 1 p gain (0.348 and 0.263), whereas switching from the CAPM to the LCAPM Net. p yields a tiny R 2 gain (0.007 and 0.003). Similarly in panel C, the R 2 gain from adding 5 p to obtain the Lee two-beta LCAPM is small (0.046 and 0.022) and in panel D, the R 2 gain from adding three separate liquidity betas to obtain the four-beta LCAPM is small (0.055 and 0.076). Thus, we conclude that nearly all of R 2 gain is due to the Amihud and Mendelson-type mean liquidity cost term and very little is due to LCAPM liquidity risk. In summary, we obtain frequent support for the LCAPM predictions that 0 and for 0. However, for AP two-beta, Lee two-beta, and four-beta LCAPMs, we do not support that the main LCAPM predictions are true at the same time in the large majority of cases. Further, nearly all of R 2 gain is due to the Amihud and Mendelson mean-type liquidity cost term and very little is due to LCAPM liquidity risk. 4 Extension Tests of the LCAPM 4.1 Extension Methodology and Data In this section, we extend tests of the unconditional LCAPM using the Lee (2011) methodology and expand to: (1) cover 90 years, (2) add NASDAQ stocks, (3) use four alternative liquidity measures, and (4) add risk or characteristic factors. Lee s methodology is founded on the Fama-MacBeth (1973) approach. Fama- MacBeth allows the beta parameters to evolve over rolling estimation windows and avoids errors-invariables problems in estimating the betas. Lee s methodology also uses individual stocks as the test assets (as opposed to portfolios), which provides greater statistical power due to a larger number of observations in each cross-sectional regression. Lee s innovative methodology has three-stages. In the first stage, it involves computing pre-ranking betas from monthly returns in years t-5 to t-1. Then individual stocks are one-dimensionally sorted in 10 portfolios based on pre-ranking beta. Next in the second stage, post-ranking betas are computed for the 10 portfolios in year t. In order to minimize noise in beta estimation, the portfolio betas are assigned to the individual stocks. Then in the third stage, cross-sectional regressions are run for 19
20 each month across the individual stocks in the year t+1. Finally, the whole process is rolled forward by a year and this continues throughout the time period. We report the average results of the cross-sectional regressions over a given time period. Stock return data covering comes from the Center for Research in Security Prices (CRSP). The book equity value data for the periods comes from Compustat. For the pre- Compustat period , we use the book equity value data reported in Moody s Industrial, Public Utility, Transportation, and Bank and Finance Manuals, which is available on Ken French s web site. The Fama and French risk factors are also obtained from Ken French s web site. We divide the 90 year period from into three periods: , , and These three time periods correspond to before, during, and after the time period studied by AP. We also study NASDAQ-listed as a separate sample from the NYSE- and AMEX-listed stocks that Acharya and Pedersen studied. Since NASDAQ didn t exist in the before period, we have five combinations of time period and exchange. The data for the NASDAQ-listed stocks begins in Table 5 provides descriptive statistics and first-stage beta correlations for the extension sample. Panel A provides the descriptive statistics for five period-exchange combinations. The average number of stocks in the cross-section ranges from 644 to 2,180. Based on this large sample size, all statistical tests in the extension section are based on the 1% level of significance. Monthly turnover for a given stock in a given month is computed as the dollar trading volume of that month divided by the dollar value of shares outstanding at the beginning of the month. Average monthly turnover for a period-exchange is the equallyweighted average of monthly turnover across all stocks on an exchange and all months in the period. Average monthly turnover has increased over time for the three periods examined. Put Table 5 about here Panels B-F provide first-stage, individual stock beta correlations for five period-exchange combinations. Generally speaking the correlations between the four betas are relatively modest. Taking the 20
21 1i 2i 3i 4i absolute value of the six correlations between different pairs of,,, and and averaging the absolute value of these six correlations over all five panels, we find an average absolute value of for the extended sample. 14 This suggests that there is no multicollinearity issue for the four-beta LCAPM in the extended sample, which is likely due to the fact that the extension sample uses individual stocks as test assets. 1i Net, i Next, we average the correlations between and across all five panels and find an average 1i correlation of Again, intuitively this is because that strongly dominates the three other betas in determining the value of Net,i and so the correlation is close to As before with the replication sample, we conclude that the AP two-beta LCAPM, which includes both faces an extremely severe degree of multicollinearity. 1i and Net,i as independent variables, 1i 5i Finally, we average the correlations between and across all five panels and find an average correlation of This suggests that the Lee two-beta LCAPM, which includes both independent variables, faces minimal multicollinearity. 1 p and 5 p as We test four alternative liquidity proxies based on the results of Fong, Holden, and Trzcinka (2017). They study both percent-cost liquidity measures, which measure small trade transaction costs as a percentage of the price, and cost-per-dollar-volume liquidity measures, which capture the marginal transaction costs per dollar of volume. Specifically, they test all low-frequency liquidity proxies that had been developed to see how well they capture high-frequency liquidity benchmarks on a global basis. They find that Closing Percent Quoted Spread is the best monthly percent-cost proxy when available. Unfortunately, the daily bid and ask prices needed to compute it are only available for NYSE/AMEX stocks from and 1993-present and for NASDAQ stocks over the life of the exchange. They find that 14 Throughout the extension section, the i superscript indicates that individual stocks are the test assets. 21
22 the next best monthly percent-cost proxy is the High-Low proxy. Fortunately, the daily high and low prices needed to compute it are available from 1926-present. They also find that the Amihud proxy is tied as one of the best monthly cost-per-dollar-volume proxies. We test these three liquidity proxies plus the zeros proxy. They find that the zeros proxy does not perform as well as others, but we include it here in order to facilitate comparisons with Lee (2011) that uses zeros. The first liquidity proxy that we test the High-Low measure developed by Corwin and Shultz (2012) as a proxy for the percent effective spread. It is computed as follows 2 t e High- Low Average 1, t 1 e (9) where t 2t t t, t is the sum over two days of the squared daily log(high price / low price), and t is the squared log(high Price /Low Price) where the High (Low) Price is over two days. The second liquidity proxy we test is the Closing Percent Quoted Spread developed by Chung and Zhang (2014). It is computed as follows Closing Percent Quoted Spread Closing Askt Closing Bid t Average. Closing Askt Closing Bidt/2 (10) as follows The third liquidity proxy we test is the Amihud proxy developed by Amihud (2002). It is computed r, (11) t Amihud Average Dollar Volume t where the average is computed over positive volume days only and where rt is the stock return on day t and Dollar Volume t is the US dollar value, in millions, of volume on day t. 22
23 The fourth liquidity proxy we test is the Zeros proxy developed by Lesmond, Ogden, and Trzcinka (1999). It is computed as follows ZRD Zeros, TD NTD (12) where ZRD is the number of zero returns days, TD is the number of trading days, and NTD is the number of no-trade days in a given stock-month. 4.2 Extension Tests by Five Period-Exchange Combinations Table 6, Panels A-E report the base case cross-sectional regression results for five period-exchange combinations. Each panel contains five cross-sectional regressions labeled 1 through 5 in the left-most column. In order they are: (1) CAPM, (2) mean liquidity cost CAPM, (3) one-beta LCAPM, (4) Lee twobeta LCAPM, and (5) four-beta LCAPM. The liquidity measure is the High-Low proxy of Corwin and Shultz (2012). Stars are added to indicate significance at the 1% level. Put Table 6 about here Starting with the R 2 columns in Panels A-E, we see values ranging from 0.02 to This lower range is what we would expect for regressions based on individual stock returns, where idiosyncratic shocks cause much of the variation. Next, we examine line 4, which is the Lee two-beta LCAPM that will allow us to test several hypotheses. First, we look at the estimate on line 4 of Panels A-E. We see that this coefficient is significantly different from zero in zero times out of five regressions, which supports the prediction that the i intercept is zero. Second, we look the E c coefficient in line 4 and see that it is significantly greater than zero in one time out of five cases, which largely fails to support the prediction that it is priced. Third, we look at 1i coefficient in line 4 and observe that it is significantly greater than zero in zero times out of five, which fails to support the prediction that it is priced. Fourth, we look at the 5i coefficient in line 4 23
24 and see that it is significantly greater than zero in zero times out of five, which fails to support the prediction that it is priced. Next, we examine line 5, which is the four-beta LCAPM that will allow us to test several hypotheses. The intercept coefficient in line 5 of Panels A-E is never significantly from zero, which supports the prediction that the intercept is zero. The expected liquidity cost coefficient is significant one time out of five, which mostly fails to support the prediction that it is priced. The market beta coefficient is never significant, which fails to support the prediction that it is priced. The significant and the prediction that they are priced. 2i and 4i coefficients are never 3i coefficient is significant one time out of five, which mostly fails to support the Panel F reports likelihood ratio tests (LRT) for the Lee two-beta or four-beta LCAPM with the restriction(s) that lambda coefficients are equal in absolute value and have the predicted signs against the analogous unrestricted LCAPM. For the Lee two-beta LCAPM, the first column reports the p-value of the 1 5 chi-squared statistic that the restriction is true. We find that this restriction is always not supported. Thus, the Lee two-beta LCAPM is not supported 100% of the time. For the four-beta LCAPM, the second column reports the p-value of the chi-squared statistic that all of the restrictions are true. We find that this restriction is always not supported. Thus, the four-beta LCAPM is not supported 100% of the time. In summary, our base case extension results always fails to support the main Lee two-beta and fourbeta LCAPM predictions in each of the five period-exchange combinations. 4.3 Extension Tests Using Alternative Liquidity Measures Table 7 reports extension tests of the Lee two-beta LCAPM using alternative liquidity measures. For convenience in comparison, panel A repeats the line 4 results from Table 6 based on the High-Low 24
25 liquidity measure. Panels B, C, and D report analogous Lee two-beta LCAPM results based on three other liquidity measures: closing percent quoted spread, Amihud, and zeros, respectively. Put Table 7 about here The first five columns of Table 7 allow us to test five hypotheses. First, looking down the column of Panels A-D, we see that this coefficient is significantly different from zero in one time out of i twenty cases, which supports the prediction that the intercept is zero. Second, the E c coefficient is significant four times out of twenty (20%), which largely fails to support the prediction that it is priced. Third, the 1i coefficient is significant zero times out of twenty, which fails to support the prediction that it is priced. Fourth, the net liquidity beta 5i coefficient is significant one time out of twenty (5%), which largely fails to support the prediction that it is priced. Fifth, the p-value of the chi-squared statistic that the 1 5 LRT that is always not supported. Thus, the Lee two-beta LCAPM is not supported 100% of the time. The last two columns report the R 2 i gain decomposition of what is attributable to the E c term vs. what is attributable to 5i. The R 2 i gain from the E c term is positive in nearly all cases and averages over all twenty cases. The 5i term yields a R 2 gain of zero in nearly all cases and averages over all twenty cases. Thus, all of R 2 gain is due to the Amihud and Mendelson-type mean liquidity cost term and none is due to LCAPM liquidity risk term. In summary, our extension tests robustly fail to support the main Lee two-beta LCAPM predictions under each of the alternative liquidity measures. Further under each of the alternative liquidity measures, the LCAPM R 2 gain is not due to incorporating liquidity risk. 4.4 Extension Tests Adding Characteristic Factors or Risk Factors Table 8 reports extension tests of the Lee two-beta LCAPM when adding either characteristic factors or risk factors. Panel A adds the following characteristic variables: (1) the log of market value (LnMV), (2) 25
26 the log of book/market when available or zero otherwise (LnBMmod), and (3) a dummy that equals 1 when book value is available and zero otherwise (BMdum). Panel B adds the following risk factors based on Fama and French (1993) and Carhart (1997): (1) Small-Minus-Big (SMB) size risk factor, (2) High-Minus- Low (HML) book/market risk factor, and (3) Up-Minus-Down (UMD) momentum risk factor. Put Table 8 about here Panel A reports that LnMV and LnBMmod are significant in all five period-exchange cases and BMdum is significant in two out of five cases. So the added characteristic factors are priced most of the time. Regarding the five hypotheses: 0 i is not supported all five times, E c is priced two times out 1i 5i 1 5 of five, is priced two times out of five, is priced one time out of five, and is not supported all five times. The average R 2 i gain from the E c term is 0.035, whereas the average R 2 gain due to the 5i term is Thus, nearly all of R 2 gain is due to the Amihud and Mendelson-type mean liquidity cost term and very little is due to LCAPM liquidity risk term. Panel B reports that SML and HML are not significant in all five period-exchange cases and UMD is significant in two out of five cases. Regarding the five hypotheses: 0 is not supported two times out i of five, E c is priced two times out of five, 1 5 out of five, and is not supported all five times. 1i is priced one time out of five, 5i is priced one times In summary, our extension tests robustly fail to support the main Lee two-beta LCAPM are true at the same time after adding characteristics or risk factors. Further after adding characteristics or risk factors, the LCAPM R 2 gain is not due to incorporating liquidity risk. 4.5 Summary of Extension Tests Table 9 summarizes extension tests of the Lee two-beta LCAPM for 60 different cases and by various breakouts. Specifically, it includes: (five different period-exchange combinations) times (four different 26
27 liquidity measures) times (three different versions of the regression) for a total of 5*4*3 = 60 cases. The three regression versions are: (1) no added variables, (2) added characteristic factors, and (3) added risk factors. Put Table 9 about here Panel A summarizes the extension tests overall all 60 cases. Specifically, it reports the frequency that the five hypotheses are true. 15 We find that 0 is true in 56.7% of the cases (34 out of 60), 0 in 43.3%, 1 0 in 20.0%, 5 0 in 11.7%, and 1 5 in 0.0%. Thus, our extension results always fail to support the main Lee two-beta LCAPM predictions are true at the same time. Across all 60 cases, i the E c term contributes to the R 2 gain, whereas the 5i term contributes exactly overall. Panel B summarizes the extension tests by period-exchange. Each row of panel B represents (four different liquidity measures) times (three different versions of the regression) for a total of 4*3 = 12 cases. We see a consistent pattern in each period-exchange that most of the LCAPM predictions are not supported and that incorporating liquidity risk robustly adds nothing to the LCAPM R 2 gain. Panel C summarizes the extension tests by alternative liquidity measures. Each row of panel C represents (five different period-exchange combinations) times (three different versions of the regression) for a total of 5*3 = 15 cases. We see a consistent pattern for each liquidity measure that most of the LCAPM predictions are not supported and that incorporating liquidity risk robustly adds nothing to the LCAPM R 2 gain. In summary, our extension results always fail to support the main Lee two-beta LCAPM predictions and that incorporating liquidity risk robustly adds nothing to the LCAPM R 2 gain. 15 For any hypothesis that predicts that a coefficient is greater than zero or less than zero, we consider it to be true only when the estimated coefficient has the predicted sign and is significant in a one-tail test at the 1% level. For a hypothesis that predicts a coefficient is equal to zero, we consider it to be true only when the estimated coefficient is insignificantly different from zero in a two-tail test at the 1% level. 27
28 5 Conclusion We replicate the LCAPM tests of Acharya and Pedersen using their original methodology and covering both their original time period and a more recent period. We successfully qualitatively replicate the descriptive and first-stage tables and figure, but are not successful in replicating the second-stage tables that perform cross-sectional tests. In the large majority of cases, our replication evidence fails to support that the main LCAPM predictions all hold simultaneously. Next, we extend tests of the LCAPM following the Lee (2011) methodology and expanding to: (1) three different time periods spanning 90 years, (2) add NASDAQ stocks, (3) use four alternative liquidity measures, and (4) add risk or characteristic factors. Our extension evidence always fails to support that the main predictions of the Lee two-beta LCAPM and of the four-beta LCAPM hold at the same time. Overall, we fail to support that liquidity risk matters in the specific functional form predicted by the LCAPM. However, we are silent on the more general question of whether liquidity risk matters in some different functional form. We make our SAS code publicly available. Appendix The appendix provides seven of the eight tables that report the replication second-stage tests. The eight tables (table 3 and appendix tables A1-A7) follow the same variations of tests assets, portfolio weights, and added factors in the same order as Acharya and Pedersen. Specifically, Table 3 is based on illiquidity portfolios. Table A1 is based on portfolios sorted by the standard deviation of liquidity. Table A2 is based on equally-weighted illiquidity portfolios and an equally-weighted market portfolio. Table A3 is based on value-weighted illiquidity portfolios and a value-weighted market portfolio. Table A4 is based on size portfolios. Table A5 is based on portfolios sorted first by book/market and then sorted by size. Table A6 is the same as table 8, except that it adds size and book-to-market variables. Table A7 is the same as table A5, except that it adds size and book-to-market variables. Put Appendix Tables A1-A7 about here 28
29 Acknowledgements * We thank Ivo Welch (Editor) for his initiative and leadership in creating these Special Replication Issues of Critical Finance Review and we thank an anonymous referee and an anonymous associate editor for helpful insights and suggestions. References Acharya, V., Y. Amihud, and S. Bharath Liquidity risk of corporate bond returns: conditional approach. Journal of Financial Economics 110, Acharya, V. and L. Pedersen Asset Pricing with Liquidity Risk. Journal of Financial Economics 77, Amihud, Y Illiquidity and stock returns: Cross section and time-series effects. Journal of Financial Markets 5, Amihud, Y. and H. Mendelson Asset pricing and the bid ask spread. Journal of Financial Economics 17, Amihud, Y. and J. Noh The Pricing of the Illiquity Factor s Systematic Risk. Working paper, New York University. Ang, A. and J. Chen Asymmetric correlations of equity portfolios. Journal of Financial Economics 63, Ben-Rephael, A., O. Kadan, and A. Wohl The Diminishing Liquidity Premium. Journal of Financial and Quantitative Analysis 50, Brennan, M. and A. Subrahmanyam Market microstructure and asset pricing: On the compensation for illiquidity in stock returns. Journal of Financial Economics 41, Carhart, M On persistence in mutual fund performance. Journal of Finance 52, Chalmers, J. and G. Kadlec An empirical examination of the amortized spread. Journal of Financial Economics 48, Chung, K. and H. Zhang A simple approximation of intraday spreads using daily data. Journal of Financial Markets 17, Corwin, S. and P. Schultz A Simple Way to Estimate Bid-Ask Spreads from Daily High and Low Prices. Journal of Finance 67, Fama, E. and K. French Common risk factors in the returns on stocks and bonds. Journal of Financial Economics 33,
30 Fong, K, C. Holden, and C. Trzcinka What are the best liquidity proxies for global research? Review of Finance 21, Kazumori, E., F. Fang, R. Sharman, and F. Takeda Asset Pricing with Liquidity Risk: A Replication and Out-of-Sample Tests with the Recent US and the Japanese Market Data. Working paper, State University of New York. Lee, K The world price of liquidity risk. Journal of Financial Economics 99, Lesmond, D., J. Ogden, and C. Trzcinka A new estimate of transaction costs. Review of Financial Studies 12, Newey, W. and K. West A simple, positive semi-definite, heteroskedasticity and autocorrelation consistent covariance matrix. Econometrica 55, Pastor, L. and R. Stambaugh Liquidity risk and expected stock returns. Journal of Political Economy 111,

31 31
Liquidity skewness premium
 Liquidity skewness premium Giho Jeong, Jangkoo Kang, and Kyung Yoon Kwon * Abstract Risk-averse investors may dislike decrease of liquidity rather than increase of liquidity, and thus there can be asymmetric
Further Test on Stock Liquidity Risk With a Relative Measure
 International Journal of Education and Research Vol. 1 No. 3 March 2013 Further Test on Stock Liquidity Risk With a Relative Measure David Oima* David Sande** Benjamin Ombok*** Abstract Negative relationship
THE EFFECT OF LIQUIDITY COSTS ON SECURITIES PRICES AND RETURNS
 PART I THE EFFECT OF LIQUIDITY COSTS ON SECURITIES PRICES AND RETURNS Introduction and Overview We begin by considering the direct effects of trading costs on the values of financial assets. Investors
Revisiting Idiosyncratic Volatility and Stock Returns. Fatma Sonmez 1
 Revisiting Idiosyncratic Volatility and Stock Returns Fatma Sonmez 1 Abstract This paper s aim is to revisit the relation between idiosyncratic volatility and future stock returns. There are three key
Online Appendix for. Penny Wise, Dollar Foolish: Buy-Sell Imbalances On and Around Round Numbers
 Online Appendix for Penny Wise, Dollar Foolish: Buy-Sell Imbalances On and Around Round Numbers Utpal Bhattacharya Kelley School of Business, Indiana University, Bloomington, Indiana 47405, ubattac@indiana.edu
Real Estate Ownership by Non-Real Estate Firms: The Impact on Firm Returns
 Real Estate Ownership by Non-Real Estate Firms: The Impact on Firm Returns Yongheng Deng and Joseph Gyourko 1 Zell/Lurie Real Estate Center at Wharton University of Pennsylvania Prepared for the Corporate
Liquidity Variation and the Cross-Section of Stock Returns *
 Liquidity Variation and the Cross-Section of Stock Returns * Fangjian Fu Singapore Management University Wenjin Kang National University of Singapore Yuping Shao National University of Singapore Abstract
Stock price synchronicity and the role of analyst: Do analysts generate firm-specific vs. market-wide information?
 Stock price synchronicity and the role of analyst: Do analysts generate firm-specific vs. market-wide information? Yongsik Kim * Abstract This paper provides empirical evidence that analysts generate firm-specific
Problem Set 6. I did this with figure; bar3(reshape(mean(rx),5,5) );ylabel( size ); xlabel( value ); mean mo return %
,5,5) );ylabel( size ); xlabel( value ); mean mo return %") Business 35905 John H. Cochrane Problem Set 6 We re going to replicate and extend Fama and French s basic results, using earlier and extended data. Get the 25 Fama French portfolios and factors from the
Business 35905 John H. Cochrane Problem Set 6 We re going to replicate and extend Fama and French s basic results, using earlier and extended data. Get the 25 Fama French portfolios and factors from the
Common Risk Factors in the Cross-Section of Corporate Bond Returns
 Common Risk Factors in the Cross-Section of Corporate Bond Returns Online Appendix Section A.1 discusses the results from orthogonalized risk characteristics. Section A.2 reports the results for the downside
Deviations from Optimal Corporate Cash Holdings and the Valuation from a Shareholder s Perspective
 Deviations from Optimal Corporate Cash Holdings and the Valuation from a Shareholder s Perspective Zhenxu Tong * University of Exeter Abstract The tradeoff theory of corporate cash holdings predicts that
The cross section of expected stock returns
 The cross section of expected stock returns Jonathan Lewellen Dartmouth College and NBER This version: March 2013 First draft: October 2010 Tel: 603-646-8650; email: jon.lewellen@dartmouth.edu. I am grateful
The Effect of Kurtosis on the Cross-Section of Stock Returns
 Utah State University DigitalCommons@USU All Graduate Plan B and other Reports Graduate Studies 5-2012 The Effect of Kurtosis on the Cross-Section of Stock Returns Abdullah Al Masud Utah State University
The Pricing of Liquidity Risk Around the World
 Master Thesis The Pricing of Liquidity Risk Around the World Author: D.W.J. Röttger Studentnumber/ANR: u1255565/985824 Master Programme: Master in Finance, CFA track Faculty: Tilburg School of Economics
Asubstantial portion of the academic
 The Decline of Informed Trading in the Equity and Options Markets Charles Cao, David Gempesaw, and Timothy Simin Charles Cao is the Smeal Chair Professor of Finance in the Smeal College of Business at
University of California Berkeley
 University of California Berkeley A Comment on The Cross-Section of Volatility and Expected Returns : The Statistical Significance of FVIX is Driven by a Single Outlier Robert M. Anderson Stephen W. Bianchi
Illiquidity and Stock Returns: Cross-Section and Time-Series Effects: A Replication. Larry Harris * Andrea Amato ** January 21, 2018.
 Illiquidity and Stock Returns: Cross-Section and Time-Series Effects: A Replication Larry Harris * Andrea Amato ** January 21, 2018 Abstract This paper replicates and extends the Amihud (2002) study that
Earnings Announcement Idiosyncratic Volatility and the Crosssection
 Earnings Announcement Idiosyncratic Volatility and the Crosssection of Stock Returns Cameron Truong Monash University, Melbourne, Australia February 2015 Abstract We document a significant positive relation
Liquidity, Liquidity Risk, and the Cross Section of Mutual Fund Returns. Andrew A. Lynch and Xuemin (Sterling) Yan * Abstract
 Yan * Abstract") Liquidity, Liquidity Risk, and the Cross Section of Mutual Fund Returns Andrew A. Lynch and Xuemin (Sterling) Yan * Abstract This paper examines the impact of liquidity and liquidity risk on the cross-section
Liquidity, Liquidity Risk, and the Cross Section of Mutual Fund Returns Andrew A. Lynch and Xuemin (Sterling) Yan * Abstract This paper examines the impact of liquidity and liquidity risk on the cross-section
Asset-Specific and Systematic Liquidity on the Swedish Stock Market
 Master Essay Asset-Specific and Systematic Liquidity on the Swedish Stock Market Supervisor: Hossein Asgharian Authors: Veronika Lunina Tetiana Dzhumurat 2010-06-04 Abstract This essay studies the effect
Asset Pricing with Liquidity Risk
 Asset Pricing with Liquidity Risk Viral V. Acharya and Lasse Heje Pedersen First Version: July 10, 2000 Current Version: January 2, 2003 Abstract This paper studies equilibrium asset pricing with liquidity
The Value of True Liquidity
 The Value of True Liquidity Working Paper This version: December 2016 Abstract This study uncovers the ability of liquid stocks to generate significant higher riskadjusted portfolio returns than their
FE670 Algorithmic Trading Strategies. Stevens Institute of Technology
 FE670 Algorithmic Trading Strategies Lecture 4. Cross-Sectional Models and Trading Strategies Steve Yang Stevens Institute of Technology 09/26/2013 Outline 1 Cross-Sectional Methods for Evaluation of Factor
Income Inequality and Stock Pricing in the U.S. Market
 Lawrence University Lux Lawrence University Honors Projects 5-29-2013 Income Inequality and Stock Pricing in the U.S. Market Minh T. Nguyen Lawrence University, mnguyenlu27@gmail.com Follow this and additional
Investment Performance of Common Stock in Relation to their Price-Earnings Ratios: BASU 1977 Extended Analysis
 Utah State University DigitalCommons@USU All Graduate Plan B and other Reports Graduate Studies 5-2015 Investment Performance of Common Stock in Relation to their Price-Earnings Ratios: BASU 1977 Extended
SFSU FIN822 Project 1
 SFSU FIN822 Project 1 This project can be done in a team of up to 3 people. Your project report must be accompanied by printouts of programming outputs. You could use any software to solve the problems.
Applied Macro Finance
 Master in Money and Finance Goethe University Frankfurt Week 2: Factor models and the cross-section of stock returns Fall 2012/2013 Please note the disclaimer on the last page Announcements Next week (30
Asset Pricing with Liquidity Risk
 Asset Pricing with Liquidity Risk Viral V. Acharya and Lasse Heje Pedersen First Version: July 10, 2000 Current Version: July 17, 2003 Abstract This paper studies equilibrium asset pricing with liquidity
Liquidity and IPO performance in the last decade
 Liquidity and IPO performance in the last decade Saurav Roychoudhury Associate Professor School of Management and Leadership Capital University Abstract It is well documented by that if long run IPO underperformance
On the economic significance of stock return predictability: Evidence from macroeconomic state variables
 On the economic significance of stock return predictability: Evidence from macroeconomic state variables Huacheng Zhang * University of Arizona This draft: 8/31/2012 First draft: 2/28/2012 Abstract We
Sharpe Ratio over investment Horizon
 Sharpe Ratio over investment Horizon Ziemowit Bednarek, Pratish Patel and Cyrus Ramezani December 8, 2014 ABSTRACT Both building blocks of the Sharpe ratio the expected return and the expected volatility
A Note on Predicting Returns with Financial Ratios
 A Note on Predicting Returns with Financial Ratios Amit Goyal Goizueta Business School Emory University Ivo Welch Yale School of Management Yale Economics Department NBER December 16, 2003 Abstract This
Fresh Momentum. Engin Kose. Washington University in St. Louis. First version: October 2009
 Long Chen Washington University in St. Louis Fresh Momentum Engin Kose Washington University in St. Louis First version: October 2009 Ohad Kadan Washington University in St. Louis Abstract We demonstrate
LIQUIDITY EXTERNALITIES OF CONVERTIBLE BOND ISSUANCE IN CANADA
 LIQUIDITY EXTERNALITIES OF CONVERTIBLE BOND ISSUANCE IN CANADA by Brandon Lam BBA, Simon Fraser University, 2009 and Ming Xin Li BA, University of Prince Edward Island, 2008 THESIS SUBMITTED IN PARTIAL
The effect of liquidity on expected returns in U.S. stock markets. Master Thesis
 The effect of liquidity on expected returns in U.S. stock markets Master Thesis Student name: Yori van der Kruijs Administration number: 471570 E-mail address: Y.vdrKruijs@tilburguniversity.edu Date: December,
DIVIDEND POLICY AND THE LIFE CYCLE HYPOTHESIS: EVIDENCE FROM TAIWAN
 The International Journal of Business and Finance Research Volume 5 Number 1 2011 DIVIDEND POLICY AND THE LIFE CYCLE HYPOTHESIS: EVIDENCE FROM TAIWAN Ming-Hui Wang, Taiwan University of Science and Technology
Discussion Paper No. DP 07/02
 SCHOOL OF ACCOUNTING, FINANCE AND MANAGEMENT Essex Finance Centre Can the Cross-Section Variation in Expected Stock Returns Explain Momentum George Bulkley University of Exeter Vivekanand Nawosah University
Illiquidity and Stock Returns:
 Illiquidity and Stock Returns: Empirical Evidence from the Stockholm Stock Exchange Jakob Grunditz and Malin Härdig Master Thesis in Accounting & Financial Management Stockholm School of Economics Abstract:
A Lottery Demand-Based Explanation of the Beta Anomaly. Online Appendix
 A Lottery Demand-Based Explanation of the Beta Anomaly Online Appendix Section I provides details of the calculation of the variables used in the paper. Section II examines the robustness of the beta anomaly.
Volatility Lessons Eugene F. Fama a and Kenneth R. French b, Stock returns are volatile. For July 1963 to December 2016 (henceforth ) the
 the") First draft: March 2016 This draft: May 2018 Volatility Lessons Eugene F. Fama a and Kenneth R. French b, Abstract The average monthly premium of the Market return over the one-month T-Bill return is substantial,
First draft: March 2016 This draft: May 2018 Volatility Lessons Eugene F. Fama a and Kenneth R. French b, Abstract The average monthly premium of the Market return over the one-month T-Bill return is substantial,
The Volatility of Liquidity and Expected Stock Returns
 The Volatility of Liquidity and Expected Stock Returns Ferhat Akbas, Will J. Armstrong, Ralitsa Petkova January, 2011 ABSTRACT We document a positive relation between the volatility of liquidity and expected
Variation in Liquidity, Costly Arbitrage, and the Cross-Section of Stock Returns
 Variation in Liquidity, Costly Arbitrage, and the Cross-Section of Stock Returns Badrinath Kottimukkalur * January 2018 Abstract This paper provides an arbitrage based explanation for the puzzling negative
Does Calendar Time Portfolio Approach Really Lack Power?
 International Journal of Business and Management; Vol. 9, No. 9; 2014 ISSN 1833-3850 E-ISSN 1833-8119 Published by Canadian Center of Science and Education Does Calendar Time Portfolio Approach Really
Liquidity as risk factor
 Liquidity as risk factor A research at the influence of liquidity on stock returns Bachelor Thesis Finance R.H.T. Verschuren 134477 Supervisor: M. Nie Liquidity as risk factor A research at the influence
Core CFO and Future Performance. Abstract
 Core CFO and Future Performance Rodrigo S. Verdi Sloan School of Management Massachusetts Institute of Technology 50 Memorial Drive E52-403A Cambridge, MA 02142 rverdi@mit.edu Abstract This paper investigates
University of Texas at Dallas School of Management. Investment Management Spring Estimation of Systematic and Factor Risks (Due April 1)
") University of Texas at Dallas School of Management Finance 6310 Professor Day Investment Management Spring 2008 Estimation of Systematic and Factor Risks (Due April 1) This assignment requires you to perform
University of Texas at Dallas School of Management Finance 6310 Professor Day Investment Management Spring 2008 Estimation of Systematic and Factor Risks (Due April 1) This assignment requires you to perform
Turnover: Liquidity or Uncertainty?
 Turnover: Liquidity or Uncertainty? Abstract I show that turnover is unrelated to several alternative measures of liquidity risk and in most cases negatively, not positively, related to liquidity. Consequently,
Liquidity and Asset Pricing. Evidence on the role of Investor Holding Period.
 Liquidity and Asset Pricing. Evidence on the role of Investor Holding Period. Randi Næs Norges Bank Bernt Arne Ødegaard Norwegian School of Management BI and Norges Bank UiS, Sep 2007 Holding period This
Fama-French in China: Size and Value Factors in Chinese Stock Returns
 Fama-French in China: Size and Value Factors in Chinese Stock Returns November 26, 2016 Abstract We investigate the size and value factors in the cross-section of returns for the Chinese stock market.
The predictive power of investment and accruals
 The predictive power of investment and accruals Jonathan Lewellen Dartmouth College and NBER jon.lewellen@dartmouth.edu Robert J. Resutek Dartmouth College robert.j.resutek@dartmouth.edu This version:
Market Frictions, Price Delay, and the Cross-Section of Expected Returns
 Market Frictions, Price Delay, and the Cross-Section of Expected Returns forthcoming The Review of Financial Studies Kewei Hou Fisher College of Business Ohio State University and Tobias J. Moskowitz Graduate
Personal Dividend and Capital Gains Taxes: Further Examination of the Signaling Bang for the Buck. May 2004
 Personal Dividend and Capital Gains Taxes: Further Examination of the Signaling Bang for the Buck May 2004 Personal Dividend and Capital Gains Taxes: Further Examination of the Signaling Bang for the Buck
Appendix. A. Firm-Specific DeterminantsofPIN, PIN_G, and PIN_B
 Appendix A. Firm-Specific DeterminantsofPIN, PIN_G, and PIN_B We consider how PIN and its good and bad information components depend on the following firm-specific characteristics, several of which have
The Importance of Cash Flow News for. Internationally Operating Firms
 The Importance of Cash Flow News for Internationally Operating Firms Alain Krapl and Carmelo Giaccotto Department of Finance, University of Connecticut 2100 Hillside Road Unit 1041, Storrs CT 06269-1041
Volatility Appendix. B.1 Firm-Specific Uncertainty and Aggregate Volatility
 B Volatility Appendix The aggregate volatility risk explanation of the turnover effect relies on three empirical facts. First, the explanation assumes that firm-specific uncertainty comoves with aggregate
Master Thesis Finance THE ATTRACTIVENESS OF AN INVESTMENT STRATEGY BASED ON SKEWNESS: SELLING LOTTERY TICKETS IN FINANCIAL MARKETS
 ) Master Thesis Finance THE ATTRACTIVENESS OF AN INVESTMENT STRATEGY BASED ON SKEWNESS: SELLING LOTTERY TICKETS IN FINANCIAL MARKETS Iris van den Wildenberg ANR: 418459 Master Finance Supervisor: Dr. Rik
starting on 5/1/1953 up until 2/1/2017.
 An Actuary s Guide to Financial Applications: Examples with EViews By William Bourgeois An actuary is a business professional who uses statistics to determine and analyze risks for companies. In this guide,
Internet Appendix. Table A1: Determinants of VOIB
 Internet Appendix Table A1: Determinants of VOIB Each month, we regress VOIB on firm size and proxies for N, v δ, and v z. OIB_SHR is the monthly order imbalance defined as (B S)/(B+S), where B (S) is
Online Appendix for Overpriced Winners
 Online Appendix for Overpriced Winners A Model: Who Gains and Who Loses When Divergence-of-Opinion is Resolved? In the baseline model, the pessimist s gain or loss is equal to her shorting demand times
IDIOSYNCRATIC RISK AND AUSTRALIAN EQUITY RETURNS
 IDIOSYNCRATIC RISK AND AUSTRALIAN EQUITY RETURNS Mike Dempsey a, Michael E. Drew b and Madhu Veeraraghavan c a, c School of Accounting and Finance, Griffith University, PMB 50 Gold Coast Mail Centre, Gold
Journal Of Financial And Strategic Decisions Volume 10 Number 2 Summer 1997 AN ANALYSIS OF VALUE LINE S ABILITY TO FORECAST LONG-RUN RETURNS
 Journal Of Financial And Strategic Decisions Volume 10 Number 2 Summer 1997 AN ANALYSIS OF VALUE LINE S ABILITY TO FORECAST LONG-RUN RETURNS Gary A. Benesh * and Steven B. Perfect * Abstract Value Line
Premium Timing with Valuation Ratios
 RESEARCH Premium Timing with Valuation Ratios March 2016 Wei Dai, PhD Research The predictability of expected stock returns is an old topic and an important one. While investors may increase expected returns
Another Look at Market Responses to Tangible and Intangible Information
 Critical Finance Review, 2016, 5: 165 175 Another Look at Market Responses to Tangible and Intangible Information Kent Daniel Sheridan Titman 1 Columbia Business School, Columbia University, New York,
This paper investigates whether realized and implied volatilities of individual stocks can predict the crosssectional
 MANAGEMENT SCIENCE Vol. 55, No. 11, November 2009, pp. 1797 1812 issn 0025-1909 eissn 1526-5501 09 5511 1797 informs doi 10.1287/mnsc.1090.1063 2009 INFORMS Volatility Spreads and Expected Stock Returns
MULTI FACTOR PRICING MODEL: AN ALTERNATIVE APPROACH TO CAPM
 MULTI FACTOR PRICING MODEL: AN ALTERNATIVE APPROACH TO CAPM Samit Majumdar Virginia Commonwealth University majumdars@vcu.edu Frank W. Bacon Longwood University baconfw@longwood.edu ABSTRACT: This study
Internet Appendix for. Fund Tradeoffs. ĽUBOŠ PÁSTOR, ROBERT F. STAMBAUGH, and LUCIAN A. TAYLOR
 Internet Appendix for Fund Tradeoffs ĽUBOŠ PÁSTOR, ROBERT F. STAMBAUGH, and LUCIAN A. TAYLOR This Internet Appendix presents additional empirical results, mostly robustness results, complementing the results
Statistical Understanding. of the Fama-French Factor model. Chua Yan Ru
 i Statistical Understanding of the Fama-French Factor model Chua Yan Ru NATIONAL UNIVERSITY OF SINGAPORE 2012 ii Statistical Understanding of the Fama-French Factor model Chua Yan Ru (B.Sc National University
Turnover: Liquidity or Uncertainty?
 Turnover: Liquidity or Uncertainty? Alexander Barinov Terry College of Business University of Georgia E-mail: abarinov@terry.uga.edu http://abarinov.myweb.uga.edu/ This version: July 2009 Abstract The
The Liquidity Style of Mutual Funds
 Thomas M. Idzorek Chief Investment Officer Ibbotson Associates, A Morningstar Company Email: tidzorek@ibbotson.com James X. Xiong Senior Research Consultant Ibbotson Associates, A Morningstar Company Email:
Monetary Economics Risk and Return, Part 2. Gerald P. Dwyer Fall 2015
 Monetary Economics Risk and Return, Part 2 Gerald P. Dwyer Fall 2015 Reading Malkiel, Part 2, Part 3 Malkiel, Part 3 Outline Returns and risk Overall market risk reduced over longer periods Individual
Decimalization and Illiquidity Premiums: An Extended Analysis
 Utah State University DigitalCommons@USU All Graduate Plan B and other Reports Graduate Studies 5-2015 Decimalization and Illiquidity Premiums: An Extended Analysis Seth E. Williams Utah State University
Mean-Variance Theory at Work: Single and Multi-Index (Factor) Models
 Models") Mean-Variance Theory at Work: Single and Multi-Index (Factor) Models Prof. Massimo Guidolin Portfolio Management Spring 2017 Outline and objectives The number of parameters in MV problems and the curse
Mean-Variance Theory at Work: Single and Multi-Index (Factor) Models Prof. Massimo Guidolin Portfolio Management Spring 2017 Outline and objectives The number of parameters in MV problems and the curse
Asset pricing and systematic liquidity risk: An empirical investigation of the Spanish stock market
 International Review of Economics and Finance 14 (2005) 81 103 www.elsevier.com/locate/econbase Asset pricing and systematic liquidity risk: An empirical investigation of the Spanish stock market Miguel
Can Hedge Funds Time the Market?
 International Review of Finance, 2017 Can Hedge Funds Time the Market? MICHAEL W. BRANDT,FEDERICO NUCERA AND GIORGIO VALENTE Duke University, The Fuqua School of Business, Durham, NC LUISS Guido Carli
Hedge Funds as International Liquidity Providers: Evidence from Convertible Bond Arbitrage in Canada
 Hedge Funds as International Liquidity Providers: Evidence from Convertible Bond Arbitrage in Canada Evan Gatev Simon Fraser University Mingxin Li Simon Fraser University AUGUST 2012 Abstract We examine
Liquidity Creation as Volatility Risk
 Liquidity Creation as Volatility Risk Itamar Drechsler Alan Moreira Alexi Savov Wharton Rochester NYU Chicago November 2018 1 Liquidity and Volatility 1. Liquidity creation - makes it cheaper to pledge
Differential Pricing Effects of Volatility on Individual Equity Options
 Differential Pricing Effects of Volatility on Individual Equity Options Mobina Shafaati Abstract This study analyzes the impact of volatility on the prices of individual equity options. Using the daily
Journal of Insurance and Financial Management, Vol. 1, Issue 4 (2016)
") Journal of Insurance and Financial Management, Vol. 1, Issue 4 (2016) 68-131 An Investigation of the Structural Characteristics of the Indian IT Sector and the Capital Goods Sector An Application of the
Journal of Insurance and Financial Management, Vol. 1, Issue 4 (2016) 68-131 An Investigation of the Structural Characteristics of the Indian IT Sector and the Capital Goods Sector An Application of the
Does market liquidity explain the idiosyncratic volatility puzzle in the Chinese stock market?
 Does market liquidity explain the idiosyncratic volatility puzzle in the Chinese stock market? Xiaoxing Liu Guangping Shi Southeast University, China Bin Shi Acadian-Asset Management Disclosure The views
LIQUIDITY AND STOCK PRICE VOLATILITY: EVIDENCE FROM THE GREEK STOCK MARKET
 University of Piraeus MSc in Banking and Finance Department of Banking and Financial Management July 2007 Master thesis: LIQUIDITY AND STOCK PRICE VOLATILITY: EVIDENCE FROM THE GREEK STOCK MARKET by VASILEIOS
Positive Correlation between Systematic and Idiosyncratic Volatilities in Korean Stock Return *
 Seoul Journal of Business Volume 24, Number 1 (June 2018) Positive Correlation between Systematic and Idiosyncratic Volatilities in Korean Stock Return * KYU-HO BAE **1) Seoul National University Seoul,
An Online Appendix of Technical Trading: A Trend Factor
 An Online Appendix of Technical Trading: A Trend Factor In this online appendix, we provide a comparative static analysis of the theoretical model as well as further robustness checks on the trend factor.
in-depth Invesco Actively Managed Low Volatility Strategies The Case for
 Invesco in-depth The Case for Actively Managed Low Volatility Strategies We believe that active LVPs offer the best opportunity to achieve a higher risk-adjusted return over the long term. Donna C. Wilson
Liquidity and Asset Pricing. Evidence on the role of Investor Holding Period.
 Liquidity and Asset Pricing. Evidence on the role of Investor Holding Period. Randi Næs Norges Bank Bernt Arne Ødegaard Norges Bank and Norwegian School of Management BI Third workshop on Market Microstructure
Long Run Stock Returns after Corporate Events Revisited. Hendrik Bessembinder. W.P. Carey School of Business. Arizona State University.
 Long Run Stock Returns after Corporate Events Revisited Hendrik Bessembinder W.P. Carey School of Business Arizona State University Feng Zhang David Eccles School of Business University of Utah May 2017
Problem Set 4 Solutions
 Business John H. Cochrane Problem Set Solutions Part I readings. Give one-sentence answers.. Novy-Marx, The Profitability Premium. Preview: We see that gross profitability forecasts returns, a lot; its
Can Global Stock Liquidity Be Measured?*
 Can Global Stock Liquidity Be Measured?* Kingsley Fong University of New South Wales Craig W. Holden Indiana University Charles A. Trzcinka** Indiana University February 200 Abstract A growing literature
Capital allocation in Indian business groups
 Capital allocation in Indian business groups Remco van der Molen Department of Finance University of Groningen The Netherlands This version: June 2004 Abstract The within-group reallocation of capital
Risk-Adjusted Futures and Intermeeting Moves
 issn 1936-5330 Risk-Adjusted Futures and Intermeeting Moves Brent Bundick Federal Reserve Bank of Kansas City First Version: October 2007 This Version: June 2008 RWP 07-08 Abstract Piazzesi and Swanson
Principles of Finance
 Principles of Finance Grzegorz Trojanowski Lecture 7: Arbitrage Pricing Theory Principles of Finance - Lecture 7 1 Lecture 7 material Required reading: Elton et al., Chapter 16 Supplementary reading: Luenberger,
Return Reversals, Idiosyncratic Risk and Expected Returns
 Return Reversals, Idiosyncratic Risk and Expected Returns Wei Huang, Qianqiu Liu, S.Ghon Rhee and Liang Zhang Shidler College of Business University of Hawaii at Manoa 2404 Maile Way Honolulu, Hawaii,
Research Division Federal Reserve Bank of St. Louis Working Paper Series
 Research Division Federal Reserve Bank of St. Louis Working Paper Series Does commonality in illiquidity matter to investors? Richard G. Anderson Jane M. Binner Bjӧrn Hagstrӧmer And Birger Nilsson Working
Beta dispersion and portfolio returns
 J Asset Manag (2018) 19:156 161 https://doi.org/10.1057/s41260-017-0071-6 INVITED EDITORIAL Beta dispersion and portfolio returns Kyre Dane Lahtinen 1 Chris M. Lawrey 1 Kenneth J. Hunsader 1 Published
Idiosyncratic volatility and stock returns: evidence from Colombia. Introduction and literature review
 Idiosyncratic volatility and stock returns: evidence from Colombia Abstract. The purpose of this paper is to examine the association between idiosyncratic volatility and stock returns in Colombia from
Online Appendix to. The Value of Crowdsourced Earnings Forecasts
 Online Appendix to The Value of Crowdsourced Earnings Forecasts This online appendix tabulates and discusses the results of robustness checks and supplementary analyses mentioned in the paper. A1. Estimating
Changes in REIT Liquidity : Evidence from Daily Data
 J Real Estate Finan Econ (2011) 43:258 280 DOI 10.1007/s11146-010-9270-3 Changes in REIT Liquidity 1988 2007: Evidence from Daily Data Susanne E. Cannon & Rebel A. Cole Published online: 9 September 2010
Properties of the estimated five-factor model
 Informationin(andnotin)thetermstructure Appendix. Additional results Greg Duffee Johns Hopkins This draft: October 8, Properties of the estimated five-factor model No stationary term structure model is
Empirical Asset Pricing Saudi Stylized Facts and Evidence
 Economics World, Jan.-Feb. 2016, Vol. 4, No. 1, 37-45 doi: 10.17265/2328-7144/2016.01.005 D DAVID PUBLISHING Empirical Asset Pricing Saudi Stylized Facts and Evidence Wesam Mohamed Habib The University
Washington University Fall Economics 487
 Washington University Fall 2009 Department of Economics James Morley Economics 487 Project Proposal due Tuesday 11/10 Final Project due Wednesday 12/9 (by 5:00pm) (20% penalty per day if the project is
Aggregate Earnings Surprises, & Behavioral Finance
 Stock Returns, Aggregate Earnings Surprises, & Behavioral Finance Kothari, Lewellen & Warner, JFE, 2006 FIN532 : Discussion Plan 1. Introduction 2. Sample Selection & Data Description 3. Part 1: Relation