|
|
|
- Cleopatra Webster
- 5 years ago
- Views:
Transcription
1
2
3
4
5
6
7
8
9
10

11
12
13
14
15
16
17
18
19
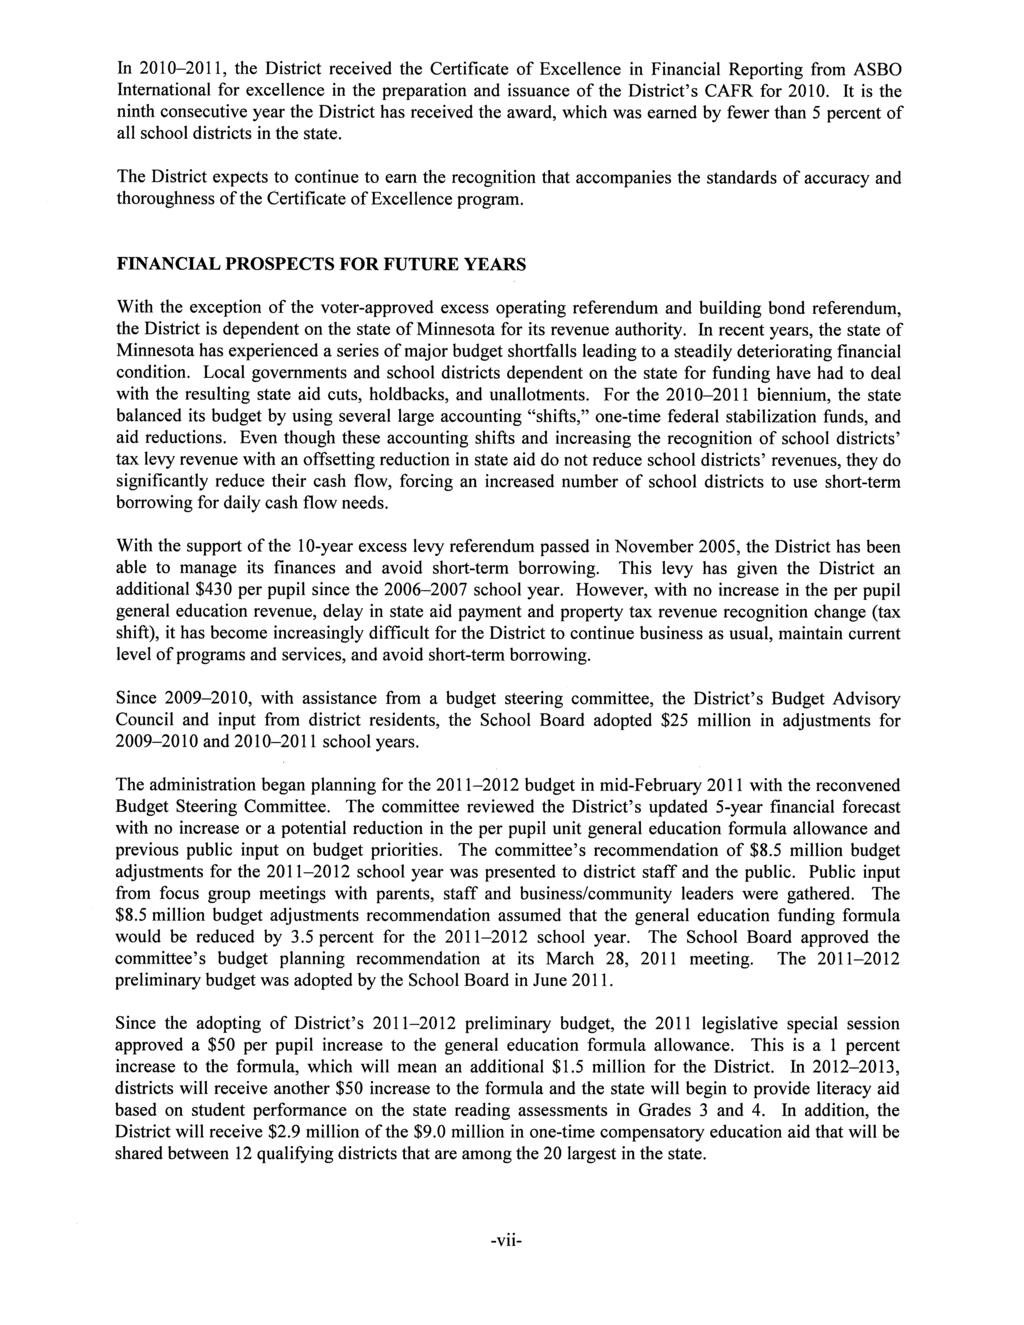
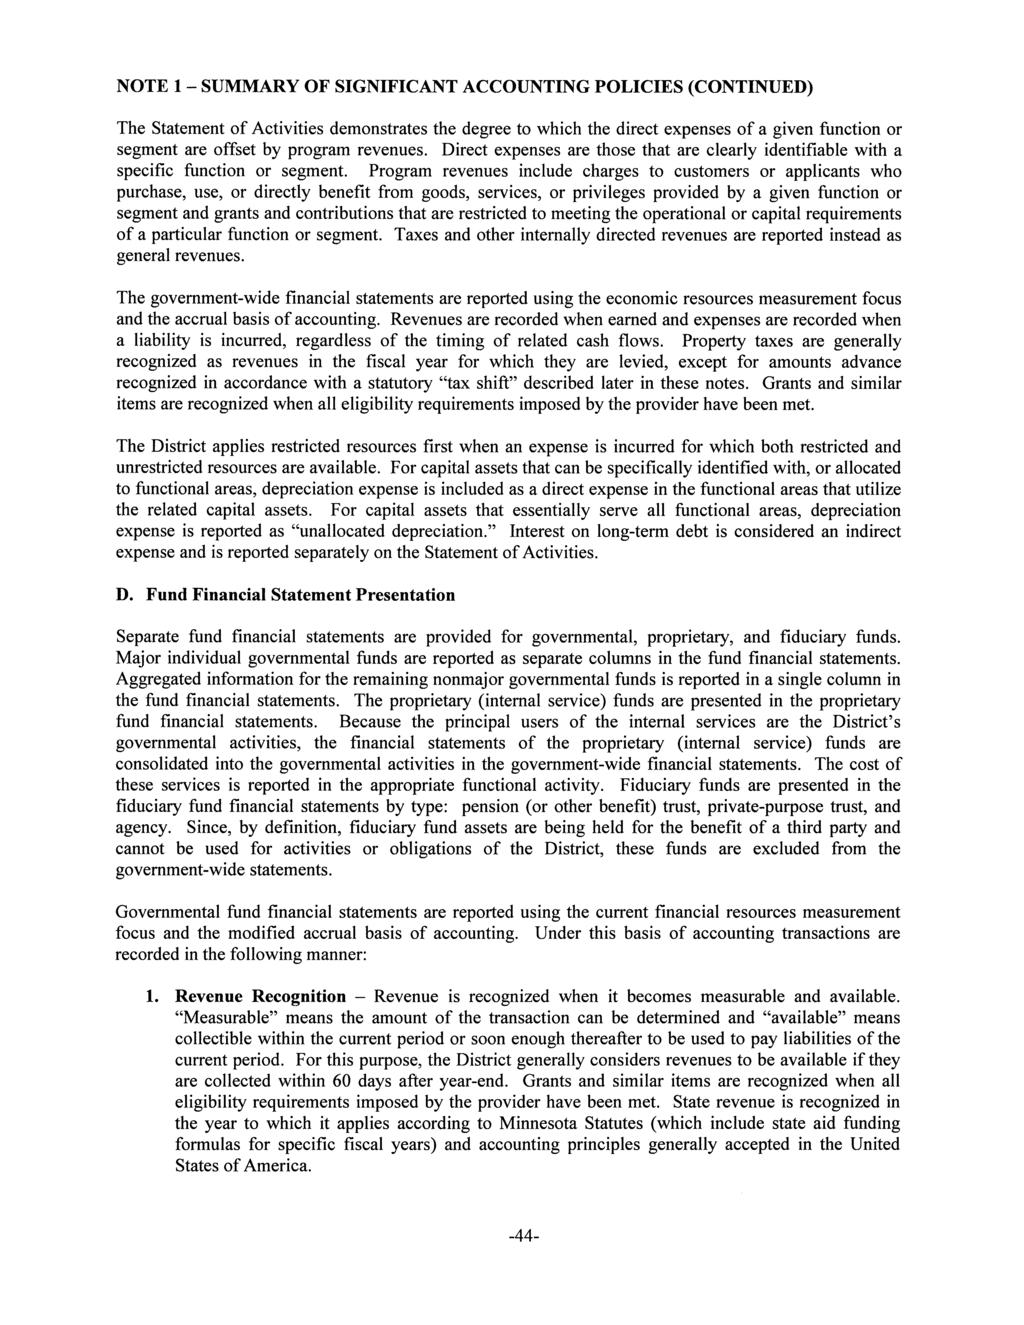
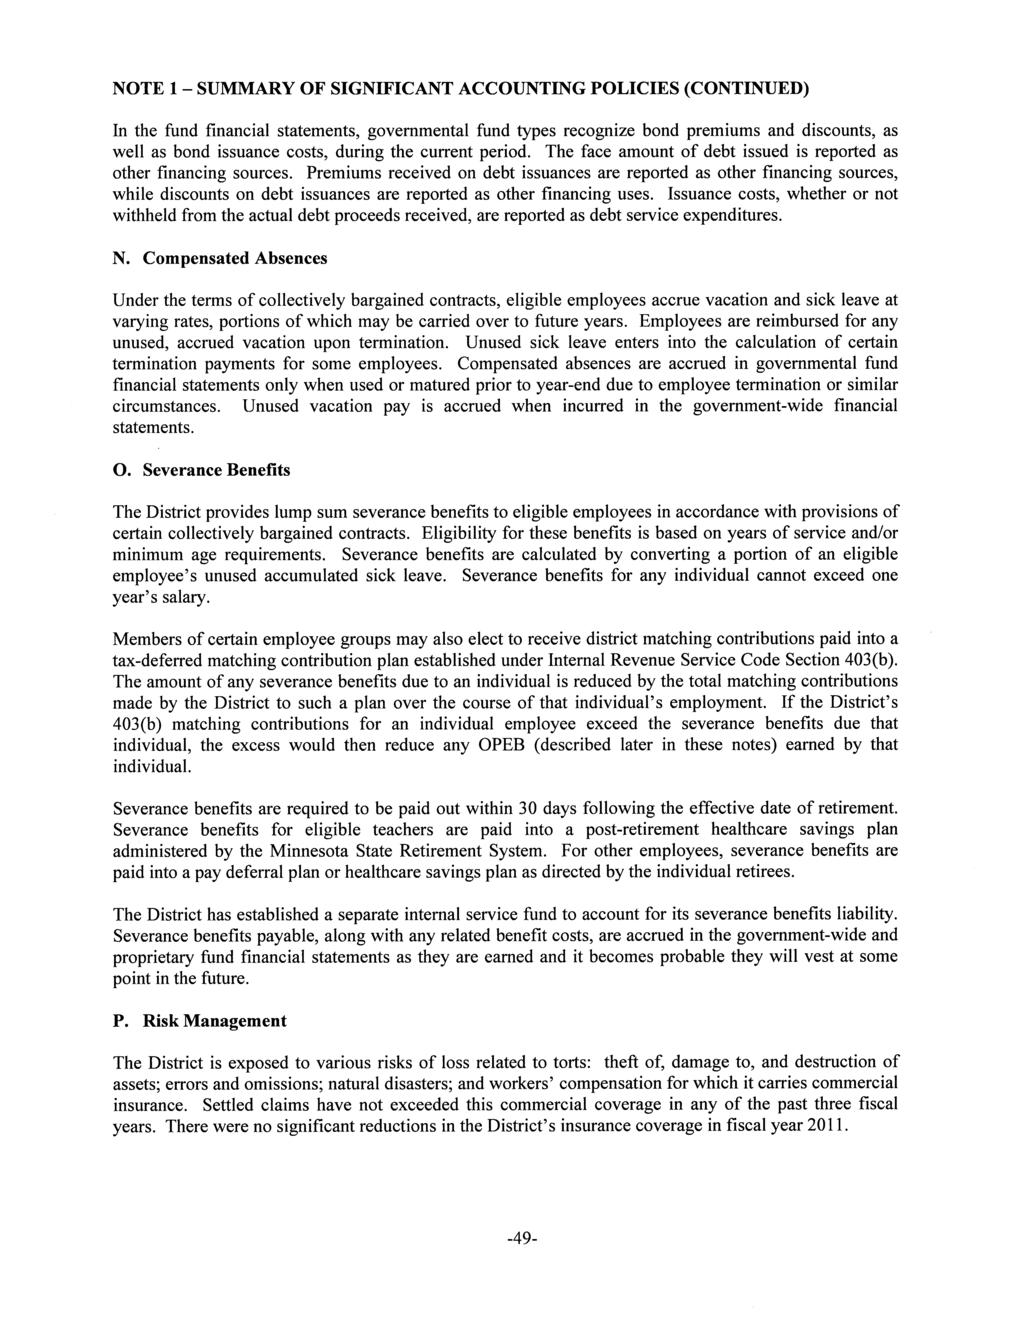
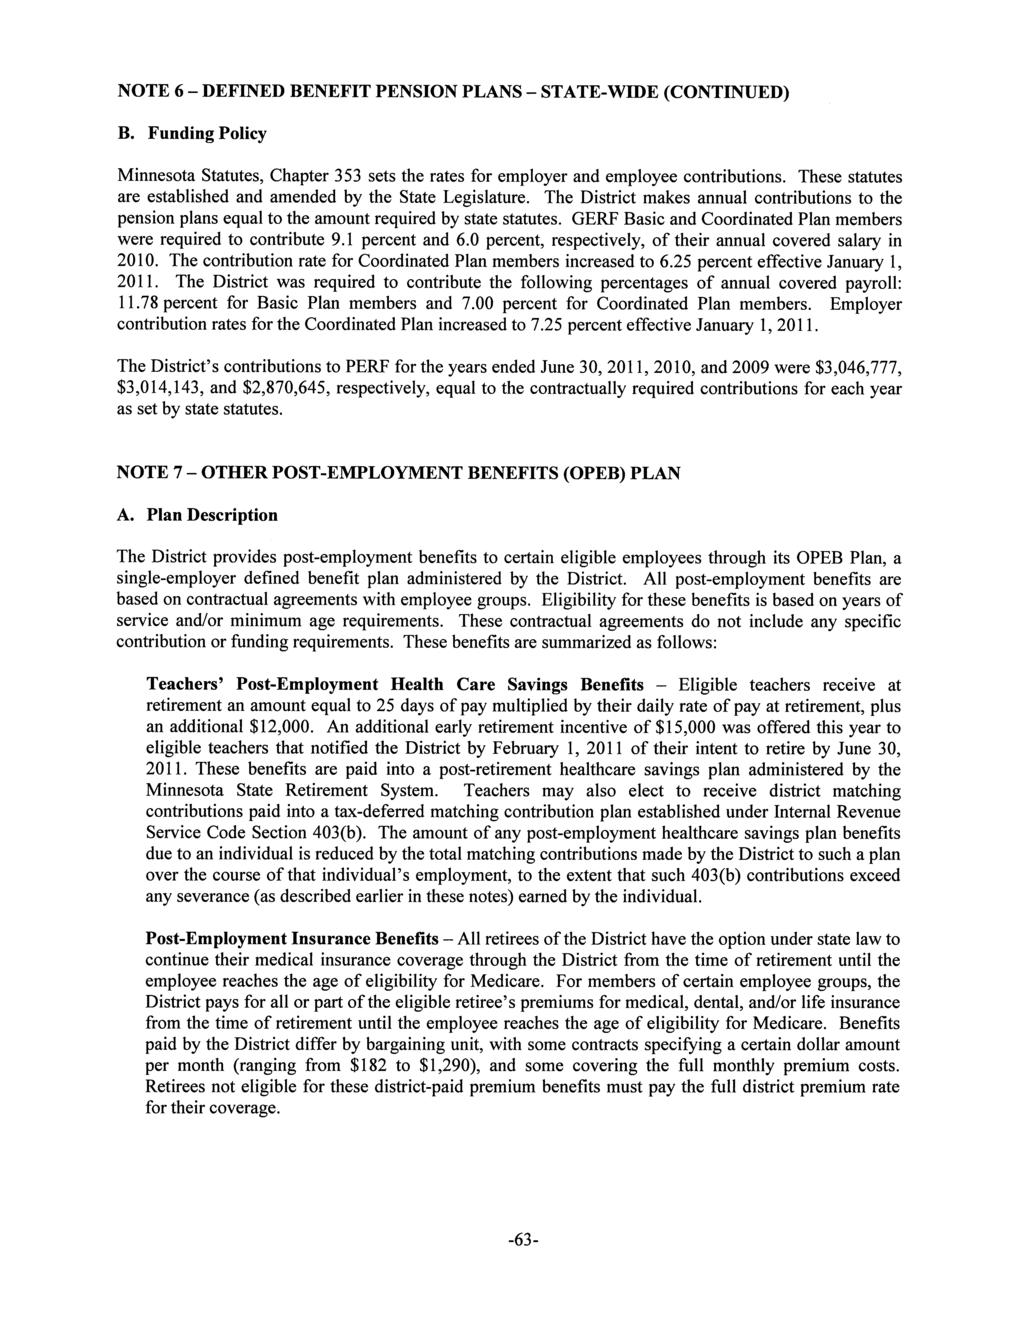
20 Corporate boundar y Interstate U.S. Hwy. State Hwy. County Hwy. Courthouse Blvd. 15 We scott Rd Deerwood Dr Diffley Rd. 8 Brad dock 13 Coates Ve rmillion Township Lone Oak Rd. 55 Yankee Doodle Rd. 149 Lexington Ave. Elrene Rd. Rahn Rd. Inver Grove Heights Eagan Thomas Lake Rd. 6 Cliff Rd. 3 9 Johnny Cake Rd. Minn. Zoo McAndrews Rd. 34 Dodd Rd. -xii- 22 P alomino Dr nd St E Northview P ark R d. 3 Dodd Rd. 3 35E 3 Apple Valley 140th St Rosemount Barnes Ave. 135th St. 145th St. 40 Elementary Schools 1 Deerwood 2 Echo Park 3 Greenleaf 4 Highland 5 Northview 6 Oak Ridge 7 Parkview 8 Pinewood 9 Red Pine 10 Rosemount 11 Shannon Park 12 Southview 13 Thomas Lake 14 Westview 15 Woodland Elementary Magnet Schools 16 Cedar Park Science, Tech., Engineering and Math (STEM) School 17 Diamond Path School of International Studies 18 Glacier Hills School of Arts and Science Middle Schools 20 Black Hawk 21 Dakota Hills 22 Falcon Ridge 23 Rosemount 24 Scott Highlands 25 Valley High Schools 30 Apple Valley 31 Eagan 32 Eastview 33 Rosemount 34 School of Environmental Studies 35 Area Learning Center Special Education School 40 Dakota Ridge District Offices Early Childhood Learning Center Adult Basic Education Grace Site Rahncliff Learning Center Cour thouse Bl vd. C edar Ave. Pilot Knob Rd. Akron Ave INDEPENDENT SCHOOL DISTRICT 196 Rosemount-Apple Valley-Eagan Public Schools Educating our students to reach their full potential District Map ( ) Portland Ave. 35 Galaxie Ave. Hayes Rd. Garden V iew Dr. 35W 35E Diamond Path Pilot Knob Rd. 42 Burnsville 2 Southcross Dr. Blaine Ave. Canada Ave. Dodd Rd. Cedar Ave. Whitney Dr th St. Shannon Pkwy. C hicago Ave. 35W 160th St. 16 Foliage Ave. 7 Lakeville Gannon Ave. Empire Township 3 Map also available at
21
22
23
24 INDEPENDENT AUDITOR S REPORT To the School Board of Independent School District No. 196 Rosemount, Minnesota We have audited the accompanying financial statements of the governmental activities, each major fund, and the aggregate remaining fund information of Independent School District No. 196 (the District) as of and for the year ended June 30, 2011, which collectively comprise the District s basic financial statements as listed in the table of contents. These financial statements are the responsibility of the District s management. Our responsibility is to express opinions on these financial statements based on our audit. The prior year partial comparative information presented has been derived from the District s financial statements for the year ended June 30, 2010, and in our report dated October 12, 2010, we expressed unqualified opinions on the respective financial statements of the governmental activities, each major fund, and the aggregate remaining fund information. We conducted our audit in accordance with auditing standards generally accepted in the United States of America and the standards applicable to financial audits contained in Government Auditing Standards, issued by the Comptroller General of the United States. Those standards require that we plan and perform the audit to obtain reasonable assurance about whether the financial statements are free of material misstatement. An audit includes consideration of internal control over financial reporting as a basis for designing audit procedures that are appropriate in the circumstances, but not for the purpose of expressing an opinion on the effectiveness of the District s internal control over financial reporting. Accordingly, we express no such opinion. An audit also includes examining, on a test basis, evidence supporting the amounts and disclosures in the financial statements, assessing the accounting principles used, and the significant estimates made by management, as well as evaluating the overall financial statement presentation. We believe that our audit provides a reasonable basis for our opinions. In our opinion, the financial statements referred to above present fairly, in all material respects, the respective financial position of the governmental activities, each major fund, and the aggregate remaining fund information of the District as of June 30, 2011, and the respective changes in financial position and, where applicable, cash flows thereof, and the budgetary comparison for the General Fund for the year then ended, in conformity with accounting principles generally accepted in the United States of America. As described in Note 1 of the notes to the basic financial statements, the District has implemented Governmental Accounting Standards Board Statement No. 54, Fund Balance Reporting and Governmental Fund Type Definitions during the year ended June 30, The financial statements include prior year partial comparative information, which does not include all of the information required in a presentation in conformity with accounting principles generally accepted in the United States of America. Accordingly, such information should be read in conjunction with the District s financial statements for the year ended June 30, 2010, from which it was derived (continued)
25
26 Independent School District No. 196 Rosemount, Minnesota Educating our students to reach their full potential Management s Discussion and Analysis Fiscal Year Ended June 30, 2011 This section of Independent School District No. 196 s (the District) comprehensive annual financial report (CAFR) presents management s discussion and analysis of the District s financial performance during the fiscal year ended June 30, Please read it in conjunction with the transmittal letter at the front of this report and the District s financial statements, which immediately follow this section. FINANCIAL HIGHLIGHTS As of June 30, 2011, the District shows an increase in total net assets from current year activities of $9.75 million. There are many factors that have contributed to the decrease. A few key financial highlights from the District s basic financial statements for the fiscal year are listed below. The assets of the District exceeded its liabilities at the close of the fiscal year by $ million. Of this amount, $22.42 million (unrestricted net assets) may be used to meet the District s ongoing obligations. The District s total net assets increased by $9.75 million from current year activities. The District s investment in capital assets, net of related debt increased by $5.82 million, due in part to the use of an available alternate facilities levy that allows the District to make significant facility improvements without having to issue debt. Restricted net assets increased by $1.58 million, mainly due to budget savings for approved projects and conservative budgeting practices. The unrestricted portion of the District s net assets increased by $2.35 million. This increase is mainly due to budget savings experienced in the District s General Fund. District budget administrators continue to monitor their budgets closely and adjust their programs and spending accordingly. As of June 30, 2011, the District s governmental funds reported a combined ending fund balance of $45.12 million, a net increase of $0.54 million in comparison with the prior year. Approximately percent of this total amount, $23.45 million, is unrestricted unassigned fund balance. At the close of the fiscal year, unrestricted unassigned fund balance for the General Fund was $23.54 million, or 8.29 percent, of total General Fund expenditures. The District s long-term liabilities decreased by $10.95 million, or 6.20 percent, during the current fiscal year. The key factors in this change were: a net decrease of outstanding bonds and capital notes payable (net of discounts) of $13.01 million, a decrease of $2.25 million in capital lease obligations, an increase of $2.71 million in certificates of participation, and an increase of $1.60 million in net other post-employment benefit (OPEB) obligations, severance and vacation payable. -3-
27 OVERVIEW OF THE FINANCIAL STATEMENTS The financial section of the CAFR consists of the following: Independent Auditor s Report; Management s Discussion and Analysis (MD&A); Basic financial statements, including the government-wide financial statements, fund financial statements, and the notes to basic financial statements; Required supplementary information; and Supplemental information consisting of combining, individual fund, and capital assets statements and schedules. The basic financial statements include two kinds of statements that present different views of the District: Government-Wide Financial Statements The government-wide financial statements, including the Statement of Net Assets and Statement of Activities, provide short-term and long-term information about the District s overall financial status. Fund Financial Statements The fund financial statements focus on individual parts of the District, reporting the District s operation in more detail than the government-wide statements. The District maintains three groups of fund financial statements: 1. Governmental Fund Statements Governmental fund statements review how basic services such as regular and special education were financed in the short-term as well as what remains for future spending. 2. Proprietary Fund Statements Proprietary fund statements offer short-term and longterm financial information about the activities the District operates like businesses. 3. Fiduciary Fund Statements Fiduciary fund statements provide information about the financial relationships in which the District acts solely as a trustee or agent for the benefit of others to whom the resources belong. The financial statements also include notes that explain some of the information in the statements and provide more detailed data. -4-
28 Figure 1 depicts how the various parts of this CAFR are arranged and their relationship to one another. Figure 1 Organization of Comprehensive Annual Financial Report Management s Discussion and Analysis Basic Financial Statements Government-Wide Fund Notes Financial Financial to Basic Statements Statements Financial Statements Summary Detail Figure 2, at the top of the next page, summarizes the major features of the District s financial statements, including portions of the District s activities covered and the types of information they contain. The remainder of this overview section of the MD&A highlights the structure and contents of each of the statements. -5-
29 Figure 2 Major Features of the Government-Wide and Fund Financial Statements Government-Wide Statements Governmental Funds Fund Financial Statements Proprietary Funds Fiduciary Funds Scope Entire district (except The activities of the District Activities of the District operate Instances in which the fiduciary funds) that are not proprietary or similar to private businesses: District administers fiduciary, such as internal service fund resources on behalf of building maintenance, someone else, such as food service, and flexible benefit plans community education Required financial Statement of Net Assets Balance Sheet Statement of Net Assets Statement of Fiduciary statements Net Assets Statement of Activities Statement of Revenue, Statement of Revenue, Expenditures, and Changes Expenses, and Changes in Statement of Changes in Fund Balances Fund Net Assets in Fiduciary Net Assets Statement of Cash Flows Accounting basis and Accrual accounting and Modified accrual accounting Accrual accounting and Accrual accounting and measurement focus economic resources focus and current financial focus economic resources focus economic resources focus Type of asset/liability All assets and liabilities, Generally assets expected All assets and liabilities, All assets and liabilities, information both financial and capital, to be used up and both financial and capital, both short-term and short-term and long-term liabilities that come due and short-term and long-term long-term; funds do during the year or soon not currently contain thereafter; no capital capital assets, although assets or long-term they can liabilities included Type of inflow/outflow All revenues and expenses Revenues for which cash is All revenues and expenses All additions and information during the year, regardless received during or soon during the year, regardless deductions during the of when cash is received after the end of the year; of when cash is received year, regardless of when or paid expenditures when goods or paid cash is received or or services have been paid received and the related liability is due and payable Government-Wide Statements The government-wide financial statements are designed to provide readers with a broad overview of the District s finances, using accounting methods similar to those used by private sector companies. Statement of Net Assets Presents all of the District s assets and liabilities with the difference between the two reported as net assets. Over time, increases or decreases in the District s net assets are indicators of whether its financial position is improving or deteriorating, respectively. Statement of Activities Presents information showing how the District s net assets changed during the most recent fiscal year. All of the current year s revenues and expenses are accounted for in the Statement of Activities regardless of when cash is received or paid. To assess the overall health of the District requires consideration of additional non-financial factors such as changes in the District s property tax base and the condition of school buildings and other facilities. In the government-wide financial statements the District s activities are shown in one category titled governmental activities. Governmental Activities The District s basic services are reported here, including regular and special education, transportation, administration, food services, and community education. Property taxes and state aids finance most of these activities. -6-
30 Fund Financial Statements A fund is a grouping of related accounts that is used to maintain control over resources that have been segregated for specific activities or objectives. The District uses fund accounting to ensure and demonstrate compliance with finance-related legal requirements. The fund financial statements provide more detailed information about the District s funds, focusing on its most significant or major funds, rather than the District as a whole. Funds (Food Service and Community Service Special Revenue) that do not meet the threshold to be classified as major funds are called nonmajor funds. Detailed financial information for nonmajor funds can be found in the combining, individual fund, and capital assets statements and schedules section. The District maintains three kinds of funds: Governmental Funds The District s basic services are included in governmental funds which generally focus on: 1) how cash and other financial assets that can readily be converted to cash flow in and out, and 2) the balances left at year-end that are available for spending. Consequently, the governmental funds statements provide a detailed short-term view that helps to determine whether there are more or less financial resources that can be spent in the near future to finance the District s programs. Because this information does not encompass the additional long-term focus of the government-wide statements, we provide additional information (reconciliation schedules) immediately following the governmental funds statements that explain the relationship (or differences) between these two types of financial statement presentations. Proprietary Funds Services for which the District charges a fee are generally reported in proprietary funds. Proprietary funds are reported in the same way as the government-wide statements. The District currently has two internal service funds for severance and OPEB. Fiduciary Funds The District is the trustee, or fiduciary, for assets that belong to others, such as the Employee Benefit Trust Fund and Scholarship Private-Purpose Trust Fund. The District is responsible for ensuring that the assets reported in these funds are used only for their intended purposes and by those to whom the assets belong. All of the District s fiduciary activities are reported in a separate Statement of Fiduciary Net Assets and a Statement of Changes in Fiduciary Net Assets. We exclude these activities from the government-wide financial statements because the District cannot use these assets to finance its operations. FINANCIAL ANALYSIS OF THE DISTRICT AS A WHOLE The District s financial position is the product of many factors. As indicated earlier, net assets may serve over time as a useful indicator of the District s financial position. The reader needs to understand that the determination of net capital assets involves a great deal of assumptions and estimates, such as current and accumulated depreciation amounts. A conservative versus liberal approach to depreciation estimates, as well as capitalization policies, will produce a significant difference in the calculated amounts. -7-
31 Net Assets The District s combined net assets were $ million on June 30, This is an increase of $9.75 million, or 6.56 percent, from the previous year total of $ million. (See Table 1) Table 1 Net Assets Governmental Activities Percent Change to 2011 Current and other assets $ 192,123,501 $ 211,768,838 (9.28%) Capital assets 228,074, ,047,602 (2.13%) Total assets $ 420,198,286 $ 444,816,440 (5.53%) Long-term liabilities $ 165,684,331 $ 176,638,409 (6.20%) Other liabilities 96,150, ,560,749 (19.58%) Total liabilities $ 261,835,010 $ 296,199,158 (11.60%) Net assets Invested in capital assets, net of related debt $ 125,050,825 $ 119,230, % Restricted 10,896,584 9,318, % Unrestricted 22,415,867 20,067, % Total net assets $ 158,363,276 $ 148,617, % The largest portion of the District s net assets (78.97 percent) reflects its investment in capital assets (e.g., land, buildings, and furniture and equipment) less any related debt used to acquire those assets that is still outstanding. An additional portion of the District s net assets (6.88 percent) represents resources that are restricted as to how they may be used, such as capital assets acquisition and debt service payment needs. The remaining balance of unrestricted net assets (14.15 percent) may be used to meet the District s ongoing obligations. The $9.75 million increase in net assets is a result of many factors. Some of the major ones are listed below: In , capital assets, net of related debt, increased by $5.82 million. This increase is mainly due to the use of alternative facilities levy to make facility improvements without having to issue debt. An increase of $3.64 million in investment income from short-term investments in the OPEB Trust and favorable market returns. A planned draw from the OPEB Trust of $1.31 million to reimburse the operating funds for a portion of subsidized health benefits for retirees. -8-
32 Table 2, as presented below, contains a condensed version of the Change in Net Assets of the District: Table 2 Change in Net Assets Percent Change to 2011 Revenues Program revenues Charges for services $ 19,383,833 $ 18,793, % Operating grants and contributions 48,184,008 45,687, % Capital grants and contributions 52,688 37, % General revenues Property taxes 103,752,574 74,585, % General grants and aids 157,855, ,031,690 (13.75%) Other 7,384,667 3,701, % Total revenues 336,613, ,837, % Expenses Administration 11,180,500 12,497,969 (10.54%) District support services 8,294,596 8,540,817 (2.88%) Elementary and secondary regular instruction 147,871, ,566,426 (1.79%) Vocational education instruction 3,771,098 3,540, % Special education instruction 56,254,830 55,603, % Instructional support services 13,330,690 14,365,141 (7.20%) Pupil support services 22,136,945 20,712, % Sites and buildings 25,708,804 26,723,703 (3.80%) Fiscal and other fixed cost programs 480, , % Food service 10,846,263 10,782, % Community service 9,231,014 9,093, % Unallocated depreciation 9,918,941 9,814, % Interest and fiscal charges on long-term debt 7,841,877 7,825, % Total expenses 326,867, ,542,849 (1.11%) Increase in net assets 9,745,994 (4,705,548) % Net assets beginning 148,617, ,322,830 Net assets ending $ 158,363,276 $ 148,617,282 Changes in Net Assets The District s total revenues were $ million for the year ended June 30, This is an increase of $10.78 million, or 3.31 percent, from the actual revenues of $ million. For , property taxes and general grants and aids accounted for percent of total revenue for the year. About percent of the District s revenue came from operating and capital grants. Fees and charges for services accounted for 5.76 percent of the total revenue, while the remaining 2.19 percent came from other general revenue, including investment income. -9-
33 For , the total cost of all programs and services was $ million. This is a decrease of $3.68 million, or 1.11 percent, from the total of $ million. As in past years, the bulk of the District s resources (74.45 percent) were directed to providing instructional services to our students enrolled in regular education, special education, and vocational education programs (including instructional and pupil support). (See Figure 4) The administrative activities of the District accounted for 3.42 percent of total costs for the year. Total revenues surpassed expenses, increasing the District s net assets by $9.75 million. Figure 3 Sources of Revenues for Fiscal Year 2011 General Grants and Aids 46.90% Other 2.19% Charges for Services 5.76% Operating Grants and Contributions 14.31% Property Taxes 30.82% Capital Grants and Contributions 0.02% Figure 4 Expenses for Fiscal Year 2011 Instructional Support Services 4.08% Pupil Support Services 6.77% Sites and Buildings 7.87% Fiscal and Other Fixed Cost Programs 0.15% Special Education Instruction 17.21% Vocational Education Instruction 1.15% Elementary and Secondary Regular Instruction 45.24% District Support Services 2.54% Food Service 3.32% Community Service 2.82% Unallocated Depreciation 3.03% Interest and Fiscal Charges 2.40% Administration 3.42% -10-
34 The cost of all governmental activities for was $ million. Of this amount, $67.62 million was supported by charges for services, operating grants, or capital grants received by the schools. (See Table 3) A majority of the District s costs were paid for by district taxpayers and the taxpayers of our state in property taxes and state aid based on the state-wide education aid formula. The federal and state governments, and other local sources, subsidized certain programs with grants and contributions. This totaled $48.24 million, or percent, of the total costs for About 5.93 percent, or $19.4 million, of costs were paid by the users of the District s programs. Finally, $7.38 million of district revenue came from investment earnings and other general revenue. Table 3 Net Cost of Governmental Activities Net Cost of Services Percent Change to 2011 Administration $ 11,179,507 $ 12,497,969 (10.55%) District support services 8,077,481 8,317,193 (2.88%) Elementary and secondary regular instruction 135,365, ,728,517 (1.72%) Vocational education instruction 2,940,093 2,771, % Special education instruction 22,074,269 23,920,814 (7.72%) Instructional support services 13,212,253 14,180,538 (6.83%) Pupil support services 20,380,218 19,330, % Sites and buildings 25,457,041 26,563,553 (4.17%) Fiscal and other fixed cost programs 480, , % Food service (471,034) (333,941) (41.05%) Community service 2,790,352 2,930,889 (4.80%) Unallocated depreciation 9,918,941 9,814, % Interest and fiscal charges on long-term debt 7,841,877 7,825, % Total $ 259,247,178 $ 266,024,209 (2.55%) -11-
35 FINANCIAL ANALYSIS OF THE DISTRICT S FUNDS The financial performance of the District as a whole is also reflected in its governmental funds. As of June 30, 2011, the District s governmental funds reported a combined fund balance of $45.12 million, an increase of $0.54 million, or 1.22 percent, from last year s ending fund balance of $44.58 million. This net increase is chiefly due to the following factors: In , actual expenditures and other financing uses were less than actual revenues and other financing sources in the General Fund, Capital Projects Building Construction Fund, Food Service Special Revenue Fund, and Community Service Special Revenue Fund. A planned draw from the OPEB Trust of $1.31 million to reimburse the operating funds for a portion of subsidized health benefits for retirees. For the school year, the District accepted a debt service levy reduction calculated based on the District s accumulated reserve and its bond principal and interest payments for the school year. The accumulated reserve was spent down to support bond principal and interest payments due in Table 4 shows the change in total fund balances of each of the District s governmental funds: Table 4 Governmental Fund Balances as of June 30, 2011 Percent Increase Change (Decrease) 2010 to 2011 Major funds General $ 35,497,752 $ 35,035,006 $ 462, % Capital projects building construction 1,518, , , % Debt service 4,697,250 5,290,924 (593,674) (11.22%) Total major funds 41,713,903 41,189, , % Nonmajor funds Special revenue Food service 2,572,718 2,562,797 9, % Community service 833, ,773 8, % Total nonmajor funds 3,406,432 3,387,570 18, % Total major and nonmajor funds $ 45,120,335 $ 44,576,744 $ 543, % -12-
36 GENERAL FUND The General Fund is used by the District to record the primary operations of providing education services to students from kindergarten through Grade 12. Pupil transportation activities and capital and major maintenance projects are also included in the General Fund. Funding for Minnesota school districts is largely driven by enrollment. Over the last five years, the District s enrollment has remained fairly stable in the number of students. Based on the results of an updated enrollment projection reviewed by the School Board in November 2010, it appears that enrollment for the District will remain fairly stable. The graph below (Figure 5) shows the District s actual average daily membership (ADM) over the last five years. Both elementary and secondary ADM for decreased slightly from the previous year. Preliminary enrollment data for the school year shows a small increase over Figure 5 Students (Average Daily Membership) 30,000 25,000 20,000 15,000 10,000 5, Elementary Secondary -13-
37 Table 5, as shown below, presents a summary of General Fund revenues and other financing sources: Table 5 General Fund Revenues and Other Financing Sources Amount of Percent Year Ended June 30, Increase Increase (Decrease) (Decrease) Revenues Local sources Property taxes $ 82,783,372 $ 55,729,127 $ 27,054, % Interest earnings 65, ,840 (123,565) (65.43%) Other 11,374,761 10,710, , % State sources 187,899, ,159,957 (5,260,632) (2.72%) Federal sources 9,842,124 27,163,398 (17,321,274) (63.77%) Total revenues 291,964, ,952,245 5,012, % Other financing sources Capital leases 496,033 (496,033) (100.00%) Sale of capital assets 2, ,996 (151,118) (98.13%) Total other financing sources 2, ,029 (647,151) (99.56%) Total General Fund revenues and other financing sources $ 291,967,735 $ 287,602,274 $ 4,365, % During , the District s total General Fund revenues and other financing sources increased by $4.37 million, or 1.52 percent from the previous year. Basic general education revenue is determined by a state per pupil funding formula. Other state authorized revenue, including operating levy referendum and the property tax shift, involve an equalized mix of property tax and state aid revenue. As a result, the mix of property tax and state aid can change significantly from year to year without any net change in revenue. The increase in General Fund revenues is mainly due to the following factors: 1) During the school year, the District collected $0.66 million more in student fees, such as participation fees for cocurricular programs, admission fees to sports and fine art events, gifts, and grants from local organizations/agencies. 2) The decrease in General Fund other financing sources is chiefly due to the prior year issuance of three capital leases (two generators for Red Pine Elementary School and School of Environmental Studies and four Chevy Vans). 3) The $27.05 million increase in property taxes is chiefly due to an increase in the property tax shift percentage approved by the 2010 Legislature. This increase was offset by a reduction of the same amount in state aid. 4) For the school year, state and federal sources combined show a total decrease of $22.58 million. Federal aid for the school year included $16.04 million of ARRA federal stimulus funds the state used to replace state funding reductions made by the Governor when the 2009 Legislature failed to reach an agreement on K 12 education funding for the biennium. In , state general education aid was restored to its pre-arra federal stimulus funds level. -14-
38 Table 6, as shown below, presents a summary of General Fund expenditures and other financing uses: Table 6 General Fund Expenditures and Other Financing Uses Amount of Percent Year Ended June 30, Increase Increase (Decrease) (Decrease) Expenditures Salaries $ 186,950,265 $ 190,933,987 $ (3,983,722) (2.09%) Employee benefits 58,982,969 57,149,819 1,833, % Purchased services 21,056,658 21,357,299 (300,641) (1.41%) Supplies and materials 8,756,369 7,929, , % Capital expenditures 4,257,947 5,745,517 (1,487,570) (25.89%) Other expenditures 4,066,221 4,062,995 3, % Total expenditures 284,070, ,179,558 (3,109,129) (1.08%) Other financing uses Transfers out 7,434,560 5,056,267 2,378, % Total General Fund expenditures and other financing uses $ 291,504,989 $ 292,235,825 $ (730,836) (0.25%) Total General Fund expenditures and other financing uses decreased $0.73 million, or 0.25 percent, from the previous year. In fiscal year , actual salaries were 2.09 percent less than the prior school year. This is mainly due to budgeted staffing reductions. Employee benefits increased $1.83 million, or 3.21 percent, from the previous school year. Health insurance costs were higher due to premium increases passed on by the health care providers, number of participants in the program, and their choice of coverage. District costs for OPEB also increased due to a retirement incentive offered to retirees during the year. Spending for capital items for the fiscal year decreased by $1.49 million, or percent. The decrease is mainly due to schools not spending all of their capital expenditure allocations, and savings from some health and safety and maintenance projects. In , General Fund other financing sources increased by $2.38 million, or percent. This increase is chiefly due to an increase in the District s alternative facility levy (used to support the District s major maintenance projects) transferred to the Capital Projects Building Construction Fund. For the school year, the District did not levy the maximum alternative facility levy allowed by the state. In summary, General Fund revenues and other financing sources exceeded expenditures and other financing uses by $0.46 million. As a result, total fund balance increased by the same amount at June 30, After deducting statutory restrictions and internal assignments, the unrestricted unassigned fund balance decreased from $24.17 million at June 30, 2010 to $23.54 million at June 30,
39 Figure 6 and Table 7 show the General Fund Operating Account unrestricted unassigned fund balance as a percentage of expenditures. Figure 6 General Fund Operating Account Unrestricted Unassigned Fund Balance as a Percentage of Expenditures $290,000,000 $280,000,000 $270,000,000 $260,000,000 $250,000,000 $240,000,000 $230,000,000 $220,000,000 $210,000,000 $200,000,000 $190,000,000 $180,000,000 $170,000,000 $160,000,000 $150,000,000 $140,000,000 $130,000,000 $120,000,000 $110,000,000 $100,000,000 $90,000,000 $80,000,000 $70,000,000 $60,000,000 $50,000,000 $40,000,000 $30,000,000 $20,000,000 $10,000,000 $ 9.63% 9.36% Total Expenditures Fund Balance The graph, as shown in Figure 6 above, is the single best measure of the District s overall financial health. The unrestricted unassigned fund balance of $24.23 million in the Operating Account of the General Fund at June 30, 2011 represents 9.36 percent of annual operating account expenditures or slightly under five weeks of operations. It is the District s desire to continue to provide quality instructional services to our students; the administration and School Board will continue to monitor expenditures and strive to maintain a minimum fund balance of 5 percent of operating costs. -16-
40 Table 7 General Fund Operating Account Unrestricted Unassigned Fund Balance and Expenditures Unrestricted unassigned fund balance $ 25,175,620 $ 24,232,630 Percent increase (decrease) N/A (3.75%) Expenditures $ 261,556,680 $ 258,787,398 Percent increase (decrease) (10.03%) (1.06%) Percent of fund balance to expenditures 9.63% 9.36% N/A Not Available General Fund Budgetary Highlights The District is required to adopt an operating budget prior to the beginning of its fiscal year (July 1), referred to as the preliminary budget. Over the course of the year, the District revised its annual operating budget twice. These budget amendments fall into two categories: Implementing budgets for specially funded projects, which include both federal and state grants, adjusting staffing and various instructional allocations to the schools based on actual enrollment on October 1, 2010, and unspent funds carried over from fiscal year Increase in appropriations for significant unbudgeted costs. -17-
41 The final budget amounts, as shown in Table 8 below, include all of these adjustments and represent the District s revised estimates for Table 8 General Fund Budget Percent Change Preliminary Increase Preliminary Budget Final Budget (Decrease) to Final Revenue and other financing sources $ 287,036,268 $ 291,256,997 $ 4,220, % Expenditures and other financing uses $ 292,592,156 $ 302,166,985 $ 9,574, % Net gain (loss) $ (5,555,888) $ (10,909,988) $ (5,354,100) (96.37%) While the District s final budget for the General Fund anticipated that expenditures and other financing uses would exceed revenues and other financing sources by $10.91 million, the actual results for the year show an excess of revenues and other financing sources over expenditures and other financing uses of $0.46 million. Actual revenues and other financing sources were about $0.71 million more than expected. This is mainly due to higher than expected delinquent tax collections, admission and co-curricular participation fees collected from students, and additional funds raised by the schools. Actual federal aids received were lower than budget; federal reimbursements are based on actual expenditures. The District did not spend all of its federal entitlements in ; in most cases the unspent entitlements can be carried over to the next school year. Actual expenditures and other financing uses were $10.69 million, or 3.54 percent, lower than budget. About half of the budget savings are in the area of employee salary and benefits. Some of the programs that showed budget to actual savings include administration, district support services, elementary and secondary regular instruction, and instructional support services. Another percent, or $2.13 million, of the savings is directly due to our schools not spending all of their allocations. In , the District also under spent its purchased services and supplies and materials budget; this is mostly likely a result of conservative budgeting practices. CAPITAL PROJECTS BUILDING CONSTRUCTION FUND Fiscal year is the seventh year after the passage of the June 2004, $68.00 million facilities referendum. All of the planned building construction and facilities improvement projects are complete. The funds remaining will be used to support School Board-approved capital projects. The Capital Projects Building Construction Fund revenues and other financing sources exceeded expenditures by $0.66 million for the year ended June 30, 2011, resulting in an increase of the same amount in the June 30, 2011 fund balance. The increase is mainly a result of the certificates of participation issued by the District. The Capital Projects Building Construction Fund balance shows a fund balance of $1,518,901 as of June 30,
42 DEBT SERVICE FUND Revenues and expenditures for the District s Debt Service Fund are directly tied to the District s bond principal and interest payment needs. For , approximately percent of the District s debt service revenues came from property taxes. The balance came from the state in the form of homestead and agricultural market value property tax credits and interest income from short-term investments. In , the District s total Debt Service Fund expenditures exceeded revenues by $0.59 million. The June 30, 2011 Debt Service Fund balance totaled $4.70 million. Of this amount, $4.31 million is available for regular debt service and the remaining $382,903 is reserved for OPEB debt service needs. NONMAJOR FUNDS Revenues and other financing sources in the nonmajor funds exceeded expenditures by $18,862. Food Service Special Revenue Fund The Food Service Special Revenue Fund revenues for totaled $11.32 million and expenditures were $11.31 million, resulting in an increase in the fund balance of $9,921. The June 30, 2011 Food Service Special Revenue Fund balance is $2.57 million. The actual revenues were $197,772, or 1.78 percent, greater than the budgeted amount. This increase is due to a combination of two factors. During the school year, sales to students, adults, and revenues from special functions were almost $38,000 less than budget, while federal aids for the school lunch program were $249,171 more than projected. The increase in federal aid reimbursements is mainly due to an increase in food commodities. The actual Food Service Special Revenue Fund expenditures were $713,119, or 5.93 percent, lower than the budgeted amount. The savings is mainly due to three factors. During , cafeteria workers salaries and other employee benefits such as health insurance exceeded budget by $0.24 million; budgets for lunchroom supplies, U.S. Department of Agriculture commodities use, and food and milk experienced a savings of $0.41 million. Actual capital expenditures, including building improvements, equipment, and technology equipment were $0.46 million less than budget. Consistent with the food service comprehensive capital projects plan, the District will continue to use the accumulated fund balance to fund routine state authorized equipment purchases and major capital projects. Community Service Special Revenue Fund In , the total revenues and other financing sources for the Community Service Special Revenue Fund were $9.09 million and the total expenditures were $9.08 million, resulting in an increase to fund balance of $8,941. The Community Service Special Revenue Fund balance as of June 30, 2011 is $833,714. Of this amount, $360,438 is restricted for community education, $341,468 is restricted for the Adult Basic Education Program, $33,354 is restricted for the Early Childhood Family Education Program, $98,364 is restricted for the School Readiness Program, and $90 is restricted for community services. -19-
43 INTERNAL SERVICE FUNDS The District maintains two internal service funds. The Severance Benefits Internal Service Fund is used to pre-fund severance or retirement pay for eligible retirees. For , the revenues for this fund include interest income from short-term investments and contributions paid from the District s governmental funds. The severance pay liabilities for the District on June 30, 2011 totaled $12.14 million, and the net assets of the fund were a negative $2.76 million. The OPEB Benefits Internal Service Fund accounts for assets contributed to a revocable trust used by the District to finance its OPEB liabilities and the proceeds from the $37.44 million general obligation taxable OPEB bonds issued in January The net OPEB obligation liability for the District at June 30, 2011 was $9.92 million, and the net assets of the fund were $32.25 million. The net OPEB obligation liability recorded in the fund represents the cumulative excess of the actuarially determined annual required contributions over the actual OPEB costs paid by the District through the current year-end. The District s total unfunded actuarial accrued liability, as determined in its most recent actuarial study dated July 1, 2010, was $45.15 million. CAPITAL ASSETS AND DEBT ADMINISTRATION CAPITAL ASSETS By the end of 2011, the District has net capital assets of $ million representing a broad range of capital assets, including school buildings, athletic facilities, computer and audio-visual equipment, and other equipment for various instructional programs (see Table 9). Total depreciation expenses for the year were $12.88 million. During , the District invested a total of $8.34 million in buildings, furniture and equipment, and construction in progress. Almost all of the capital investment can be attributed to major maintenance and building improvement projects approved by the state and funded by alternative facility levy revenue; and health and safety and operating capital revenues. Table 9 Capital Assets Percent Change Land $ 8,870,712 $ 8,870,712 Land improvements 10,826,510 10,421, % Buildings 335,841, ,947, % Furniture and equipment 43,721,943 42,780, % Construction in progress 3,748,287 1,059, % Less accumulated depreciation (174,934,308) (164,032,551) 6.65% Total $ 228,074,785 $ 233,047,602 (2.13%) -20-
44 LONG-TERM LIABILITIES At year-end, the District had $ million in general obligation bonds, refunding bonds, capital notes, certificates of participation, and state energy loans outstanding. This is a net decrease of $12.13 million from the previous year, as shown in Table 10. Outstanding bonds and capital notes show a net decrease of $14.83 million, mainly due to the retirement of existing debt. The District continues to make required scheduled payments. The District continued to pay down its debt, retiring $2.25 million of existing leases during the year. The District issued certificates of participation of $2.71 million during the year. Table 10 Outstanding Long-Term Liabilities Percent Change to 2011 General obligation bonds $ 111,655,000 $ 123,615,000 (9.68%) General obligation refunding bonds 22,415,000 25,150,000 (10.87%) Capital notes 90, ,000 (60.00%) State energy loans 2,564 5,129 (50.01%) Capital leases payable 6,542,399 8,794,032 (25.60%) Certificates of participation 2,705, % Severance benefits payable 12,136,872 12,678,000 (4.27%) Accrued vacation payable 3,041,104 2,975, % Net OPEB obligation 9,916,517 7,837, % Discount on bonds (2,820,125) (4,641,639) (39.24%) $ 165,684,331 $ 176,638,409 (6.20%) -21-
45 Bond Ratings The District s general obligation bonds carry a rating of Aa1, upgraded by Moody s Investors Service in April Limitation on Debt The state limits the amount of general obligation debt the District can issue up to 15 percent of actual market value of all taxable property within the District s boundaries. The estimated market value of all taxable property is $13.82 billion for calendar year 2011 and the District s debt limit is $2.1 billion. The District s outstanding debt is significantly below this limit. The District s outstanding debt as of June 30, 2011 is $ million. The amount that is applicable to the debt limit calculation is $ million (total outstanding debt less Debt Service Fund balance). Additional details of the District s capital assets and long-term debt activity can be found in the notes to basic financial statements. FACTORS BEARING ON THE DISTRICT S FUTURE Similar to other states throughout the nation, the state of Minnesota has experienced major budget shortfalls with expenditure outpacing revenues in recent years. The state s financial difficulties have resulted in state aid cuts, delays in state aid payment and property tax recognition shift to school districts. The biennium budget for the state was balanced using property tax shifts, one-time federal stabilization funds, and additional delay in payments to schools. All of these in turn resulted in significant challenges to school districts. With the exception of the voter-approved operating referendum, the District is dependent on the state of Minnesota for the majority of its revenue authority. Recent experience has demonstrated that legislated revenue levels have been insufficient to meet instructional program needs and increased costs due to inflation. Similar to other school districts in the state, voters in the District approved an operating levy referendum in November 2005 to provide additional funding for education. This operating levy provides the District with a 10-year levy; the District began to collect the revenue in Until recently, the District had been able to use the additional revenue to avoid significant budget or program reductions as experienced by other school districts in the state. Over the past two school years, the District had to reduce its General Fund budget by $25 million; the budget adjustments approved by the School Board for the school year totaled $8.5 million; $3.4 million in budget adjustments; and $5.0 million in one-time Federal Education Jobs Funds that became available in fall
46 The 2011 Legislature adjourned its regular session on May 23, 2011 without a K 12 education funding bill; an agreement was reached in July 2011 after a three-week state shutdown. The agreement called for a $50, or a 1 percent, increase in per pupil funding for general education for the school year, and another 1 percent or $50 increase in The agreement also included more state aid delays/holdbacks, and larger property tax shifts. The increase in the state aid delay and higher property tax shift percentage has significantly reduced the District s cash flow, forcing the District to use short-term borrowing for daily cash flow needs. The District is grateful for the funding increases and one-time money. However, to avoid potential cash flow shortages, the administration will continue to work with the District s financial advisor to closely monitor its cash flow projection and to implement a comprehensive cash flow management strategy to ensure that funds are on-hand to meet daily cash flow needs. The District is also committed to continue to engage parents, staff, business and community members in further budget adjustment discussions and to consider other options for increasing revenues. The administration appreciates the continued support from the community and is committed to continue to monitor its spending and strive to maintain sustainable operations. CONTACTING THE DISTRICT S FINANCIAL MANAGEMENT This financial report is designed to provide our citizens, taxpayers, customers, investors, and creditors with a general overview of the District s finances and to demonstrate the District s accountability for the money it receives. If you have questions about this report or need additional financial information, contact the Finance Department, Independent School District No. 196, Rosemount Apple Valley Eagan Public Schools, rd Street West, Rosemount, Minnesota
47 -24-
48
49
50
51 INDEPENDENT SCHOOL DISTRICT NO. 196 Balance Sheet Governmental Funds as of June 30, 2011 (With Partial Comparative Information as of June 30, 2010) Capital Projects Building Debt Total Governmental Funds General Fund Construction Fund Service Fund Nonmajor Funds Assets Cash and temporary investments $ 4,038,408 $ 3,945,200 $ 12,486,327 $ 3,490,722 $ 23,960,657 $ 58,537,636 Cash and investments held by trustee 497, ,568 Receivables Current taxes 32,745,556 11,271, ,354 44,999,602 45,007,896 Delinquent taxes 803, ,547 25,773 1,132, ,074 Accounts and interest 309,076 30, , ,922 Due from other governmental units 66,198, , ,623 67,242,115 57,603,160 Due from other funds 2,463,631 2,463,631 85,370 Inventory 524, , , ,078 Prepaid items 249,127 9, , ,396 Total assets $ 107,333,433 $ 4,442,768 $ 24,390,115 $ 5,562,584 $ 141,728,900 $ 163,855,532 Liabilities and Fund Balances Liabilities Salaries payable $ 17,426,808 $ $ $ 382,921 $ 17,809,729 $ 18,122,609 Accounts and contracts payable 21,126,934 1,775, ,233 23,444,319 20,966,342 Due to other governmental units 3,094,941 15,371 3,110,312 2,830,892 Due to other funds 1,148,715 1,148,715 85,370 Property taxes levied for subsequent year 29,059,770 19,390, ,020 49,319,108 75,922,846 Unearned revenue 323, , , ,655 Deferred revenue 803, ,547 25,773 1,132, ,074 Total liabilities 71,835,681 2,923,867 19,692,865 2,156,152 96,608, ,278,788 Fund balances (deficit) Nonspendable 773, ,961 1,093,820 1,425,474 Restricted 2,218,810 1,610,199 4,697,250 3,086,471 11,612,730 13,274,994 Assigned 8,962,579 8,962,579 7,107,706 Unassigned 23,542,504 (91,298) 23,451,206 22,768,570 Total fund balances (deficit) 35,497,752 1,518,901 4,697,250 3,406,432 45,120,335 44,576,744 Total liabilities and fund balances $ 107,333,433 $ 4,442,768 $ 24,390,115 $ 5,562,584 $ 141,728,900 $ 163,855,532 See notes to basic financial statements 28 and 29
52
53
54 INDEPENDENT SCHOOL DISTRICT NO. 196 Statement of Revenue, Expenditures, and Changes in Fund Balances Governmental Funds Year Ended June 30, 2011 (With Partial Comparative Information for the Year Ended June 30, 2010) Capital Projects Building Debt Total Governmental Funds General Fund Construction Fund Service Fund Nonmajor Funds Revenue Local sources Property taxes $ 82,783,372 $ $ 18,317,431 $ 2,439,565 $ 103,540,368 $ 74,528,277 Investment earnings 65,275 1,890 30,031 10, , ,790 Other 11,374,761 37,657 88,300 12,235,334 23,736,052 22,855,768 State sources 187,899, ,969 1,848, ,544, ,502,525 Federal sources 9,842,124 3,770,591 13,612,715 30,566,131 Total revenue 291,964,857 39,547 19,232,731 20,304, ,541, ,756,491 Expenditures Current Administration 10,610,352 10,610,352 10,936,881 District support services 8,003,178 8,003,178 8,337,360 Elementary and secondary regular instruction 146,233, ,233, ,836,850 Vocational education instruction 3,684,086 3,684,086 3,590,812 Special education instruction 55,441,820 55,441,820 54,584,837 Instructional support services 13,266,880 13,266,880 14,147,361 Pupil support services 21,823,059 21,823,059 21,601,756 Sites and buildings 21,853,910 21,853,910 21,957,328 Fiscal and other fixed cost programs 480, , ,935 Food service 10,859,314 10,859,314 10,813,496 Community service 48,623 9,037,194 9,085,817 8,974,527 Capital outlay 9,293, ,371 9,795,213 9,043,684 Debt service Principal 2,251,633 14,832,565 17,084,198 17,415,183 Interest and fiscal charges 373,148 76,484 4,993,840 5,443,472 5,611,984 Total expenditures 284,070,429 9,370,326 19,826,405 20,397, ,665, ,327,994 Excess (deficiency) of revenue over expenditures 7,894,428 (9,330,779) (593,674) (93,075) (2,123,100) (11,571,503) Other financing sources (uses) Certificates of participation issued 2,705,000 2,705,000 Discount on debt issued (41,187) (41,187) Capital lease 496,033 Sale of capital assets 2,878 2, ,996 Transfers in 7,322, ,937 7,434,560 5,056,267 Transfers (out) (7,434,560) (7,434,560) (5,056,267) Total other financing sources (uses) (7,431,682) 9,986, ,937 2,666, ,029 Net change in fund balances 462, ,657 (593,674) 18, ,591 (10,921,474) Fund balances Beginning of year 35,035, ,244 5,290,924 3,387,570 44,576,744 55,498,218 End of year $ 35,497,752 $ 1,518,901 $ 4,697,250 $ 3,406,432 $ 45,120,335 $ 44,576,744 See notes to basic financial statements 32 and 33
55
56
57
58
59
60
61
62
63
64
65
66
67
68
69
70
71
72
73
74
75
76
77
78
79
80
81
82
83
84
85
86
INDEPENDENT SCHOOL DISTRICT NO Atwater/Cosmos/Grove City, Minnesota AUDITED FINANCIAL STATEMENTS. For the Year Ended June 30, 2015
 Atwater/Cosmos/Grove City, Minnesota AUDITED FINANCIAL STATEMENTS For the Year Ended TABLE OF CONTENTS BOARD OF EDUCATION AND ADMINISTRATION... 1 INDEPENDENT AUDITOR S REPORT... 2 MANAGEMENT S DISCUSSION
Independent School District No. 271 Bloomington, Minnesota. Financial Statements. June 30, 2018
 Bloomington, Minnesota Financial Statements June 30, 2018 Table of Contents Board of Education and Administration 1 Independent Auditor's Report 2 Management's Discussion and Analysis 5 Basic Financial
Independent School District No. 14 Fridley, Minnesota. Financial Statements. June 30, 2018
 Fridley, Minnesota Financial Statements June 30, 2018 Table of Contents Board of Education and Administration 1 Independent Auditor's Report 2 Management's Discussion and Analysis 5 Basic Financial Statements
INDEPENDENT SCHOOL DISTRICT NO. 31 BEMIDJI, MINNESOTA FINANCIAL STATEMENTS AND INDEPENDENT AUDITOR S REPORT JUNE 30, 2015
 FINANCIAL STATEMENTS AND INDEPENDENT AUDITOR S REPORT JUNE 30, 2015 JUNE 30, 2015 TABLE OF CONTENTS OFFICIAL DIRECTORY - (Unaudited) 1 INDEPENDENT AUDITOR S REPORT 2-4 REQUIRED SUPPLEMENTARY INFORMATION:
Final Budget
 Manya Chugh, Deerwood Elementary 2015-16 Final Budget Fiscal Year Ending June 30, 2016 independent school district 196 Rosemount-Apple Valley-Eagan Public Schools Dakota County Rosemount, Minnesota www.district196.org
Independent School District No. 277 Minnetrista, Minnesota. Financial Statements. June 30, 2018
 Minnetrista, Minnesota Financial Statements June 30, 2018 Table of Contents Board of Education and Administration 1 Independent Auditor's Report 2 Management's Discussion and Analysis 5 Basic Financial
INDEPENDENT SCHOOL DISTRICT NO. 286 BROOKLYN CENTER, MINNESOTA. Financial Statements and Supplemental Information. Year Ended June 30, 2016
 INDEPENDENT SCHOOL DISTRICT NO. 286 BROOKLYN CENTER, MINNESOTA Financial Statements and Supplemental Information Year Ended June 30, 2016 THIS PAGE INTENTIONALLY LEFT BLANK INDEPENDENT SCHOOL DISTRICT
INDEPENDENT SCHOOL DISTRICT NO. 31 BEMIDJI, MINNESOTA FINANCIAL STATEMENTS AND INDEPENDENT AUDITOR S REPORT JUNE 30, 2017
 FINANCIAL STATEMENTS AND INDEPENDENT AUDITOR S REPORT JUNE 30, 2017 JUNE 30, 2017 TABLE OF CONTENTS OFFICIAL DIRECTORY - (Unaudited) 1 INDEPENDENT AUDITOR S REPORT 2-4 REQUIRED SUPPLEMENTARY INFORMATION:
Final Budget
 Huang, Shannon Park Elementary 2016-17 Final Budget Fiscal Year Ending June 30, 2017 independent school district 196 Rosemount-Apple Valley-Eagan Public Schools Dakota County Rosemount, Minnesota www.district196.org
INDEPENDENT SCHOOL DISTRICT NO. 659 FINANCIAL STATEMENTS YEAR ENDED JUNE 30, 2017
 FINANCIAL STATEMENTS YEAR ENDED JUNE 30, 2017 TABLE OF CONTENTS YEAR ENDED JUNE 30, 2017 INTRODUCTORY SECTION BOARD OF EDUCATION AND ADMINISTRATION 1 FINANCIAL SECTION INDEPENDENT AUDITORS REPORT 2 REQUIRED
INDEPENDENT SCHOOL DISTRICT NO. 197 WEST ST. PAUL MENDOTA HEIGHTS EAGAN, MINNESOTA. Financial Statements and Supplemental Information
 INDEPENDENT SCHOOL DISTRICT NO. 197 WEST ST. PAUL MENDOTA HEIGHTS EAGAN, MINNESOTA Financial Statements and Supplemental Information Year Ended June 30, 2016 THIS PAGE INTENTIONALLY LEFT BLANK INDEPENDENT
STAPLES-MOTLEY SCHOOL DISTRICT INDEPENDENT SCHOOL DISTRICT NO FINANCIAL STATEMENTS AND SUPPLEMENTARY INFORMATION YEAR ENDED JUNE 30, 2016
 FINANCIAL STATEMENTS AND SUPPLEMENTARY INFORMATION YEAR ENDED JUNE 30, 2016 TABLE OF CONTENTS (CONTINUED) JUNE 30, 2016 INTRODUCTORY SECTION 4 BOARD OF EDUCATION AND ADMINISTRATION 1 FINANCIAL SECTION
ANNUAL FINANCIAL REPORT OF MINNEAPOLIS PUBLIC SCHOOLS SPECIAL SCHOOL DISTRICT NO. 1 MINNEAPOLIS, MINNESOTA YEAR ENDED JUNE 30, 2012
 ANNUAL FINANCIAL REPORT OF MINNEAPOLIS PUBLIC SCHOOLS SPECIAL SCHOOL DISTRICT NO. 1 MINNEAPOLIS, MINNESOTA YEAR ENDED SPECIAL SCHOOL DISTRICT NO. 1 TABLE OF CONTENTS YEAR ENDED INTRODUCTORY SECTION SCHOOL
Stillwater Area Schools Stillwater, Minnesota District 834 Map ( ) School Boundaries Afton-Lakeland Andersen Lake Elmo Lily Lake Marine Oa
 School Boundaries Afton-Lakeland Andersen Lake Elmo Lily Lake Marine Oa") Stillwater Area Schools Stillwater, Minnesota 55082 District 834 Map (2004-05) School Boundaries Afton-Lakeland Andersen Lake Elmo Lily Lake Marine Oak Park Rutherford Stonebridge Valley Crossing Withrow
Stillwater Area Schools Stillwater, Minnesota 55082 District 834 Map (2004-05) School Boundaries Afton-Lakeland Andersen Lake Elmo Lily Lake Marine Oak Park Rutherford Stonebridge Valley Crossing Withrow
Sioux Falls School District Financial Report June 30, 2018
 Financial Report June 30, 2018 Contents Independent auditor s report 1-2 Management s discussion and analysis 3-16 Basic financial statements Government-wide financial statements: Statement of net position
Independent School District No. 742 St. Cloud, Minnesota Financial Statements June 30, 2018
 St. Cloud, Minnesota Financial Statements June 30, 2018 c: bergankov CPAS I ADVISORS Table of Contents Board of Education and Administration 1 Independent Auditor's Report 2 Management's Discussion and
ANNUAL FINANCIAL REPORT OF MINNEAPOLIS PUBLIC SCHOOLS SPECIAL SCHOOL DISTRICT NO. 1 MINNEAPOLIS, MINNESOTA YEAR ENDED JUNE 30, 2013
 ANNUAL FINANCIAL REPORT OF MINNEAPOLIS PUBLIC SCHOOLS SPECIAL SCHOOL DISTRICT NO. 1 MINNEAPOLIS, MINNESOTA YEAR ENDED INTRODUCTORY SECTION MINNEAPOLIS PUBLIC SCHOOLS SPECIAL SCHOOL DISTRICT NO. 1 TABLE
Norway-Vulcan Area School District Norway, Michigan
 ANNUAL FINANCIAL REPORT June 30, 2018 JUNE 30, 2018 Table of Contents INDEPENDENT AUDITORS REPORT 1 MANAGEMENT S DISCUSSION AND ANALYSIS 3 BASIC FINANCIAL STATEMENTS District-wide Financial Statements
CITY SCHOOL DISTRICT OF THE CITY OF ALBANY. Financial Statements and Required Reports Under OMB Circular A-133 as of June 30, 2015
 CITY SCHOOL DISTRICT OF THE CITY OF ALBANY Financial Statements and Required Reports Under OMB Circular A-133 as of June 30, 2015 CONTENTS Page INDEPENDENT AUDITOR S REPORT. 1-2 MANAGEMENT S DISCUSSION
BASIC FINANCIAL STATEMENTS CITY SCHOOL DISTRICT OF SYRACUSE, NEW YORK JUNE 30, 2013
 BASIC FINANCIAL STATEMENTS CITY SCHOOL DISTRICT OF SYRACUSE, NEW YORK (A COMPONENT UNIT OF THE CITY OF SYRACUSE, NEW YORK) TABLE OF CONTENTS INDEPENDENT AUDITOR S REPORT 1-3 MANAGEMENT S DISCUSSION AND
INDEPENDENT SCHOOL DISTRICT NO. 15 ST. FRANCIS, MINNESOTA. Financial Statements and Supplemental Information. Year Ended June 30, 2018
 INDEPENDENT SCHOOL DISTRICT NO. 15 ST. FRANCIS, MINNESOTA Financial Statements and Supplemental Information Year Ended June 30, 2018 THIS PAGE INTENTIONALLY LEFT BLANK INDEPENDENT SCHOOL DISTRICT NO. 15
Minneapolis Public Schools Special School District No. 1 Minneapolis, Minnesota. Financial Statements. June 30, 2017
 Minneapolis, Minnesota Financial Statements June 30, 2017 Minneapolis, Minnesota Board of Education and Administration 1 Independent Auditor's Report 2 Management's Discussion and Analysis 5 Basic Financial
GOVERNOR MIFFLIN SCHOOL DISTRICT
 FINANCIAL AND COMPLIANCE REPORT Year Ended June 30, 2017 TABLE OF CONTENTS INDEPENDENT AUDITOR'S REPORT... 1-2 Pages MANAGEMENT S DISCUSSION AND ANALYSIS... 3-17 BASIC FINANCIAL STATEMENTS Government-Wide
Independent Auditor's Report Members of the Board of Education Indian Prairie Community Unit School District 204 Naperville, Illinois We have audited
 Independent Auditor's Report Members of the Board of Education Naperville, Illinois We have audited the accompanying financial statements of the governmental activities, each major fund and the aggregate
Financial Statements June 30, Aberdeen School District 6-1
 Financial Statements Aberdeen School District 6-1 School District Officials Board Members Term Expiration Robert Nikolas... Brian Sharp... Scott Wirth... Mike Miller... June 30, 2012 Brad Olson... June
CONESTOGA VALLEY SCHOOL DISTRICT YEAR ENDED JUNE 30, 2013
 CONTENTS Page Independent auditors' report 1-3 Management s discussion and analysis (unaudited) 4-18 Financial statements: Government-wide financial statements: Statement of net position 19 Statement of
EXTRACURRICULAR STUDENT ACTIVITY ACCOUNTS
 EXTRACURRICULAR STUDENT ACTIVITY ACCOUNTS Financial Statements Year Ended June 30, 2014 INDEPENDENT SCHOOL DISTRICT 196 Rosemount-Apple Valley-Eagan Public Schools Rosemount, Minnesota Educating our students
BALDWIN-WHITEHALL SCHOOL DISTRICT PITTSBURGH, PENNSYLVANIA JUNE 30, 2017
 PITTSBURGH, PENNSYLVANIA JUNE 30, 2017 AUDIT REPORT PITTSBURGH, PENNSYLVANIA TABLE OF CONTENTS Page Independent Auditor s Report 1 3 Management s Discussion and Analysis (MD&A) i - xi Statement of Net
EXTRACURRICULAR STUDENT ACTIVITY ACCOUNTS
 EXTRACURRICULAR STUDENT ACTIVITY ACCOUNTS Financial Statements Year Ended June 30, 2015 INDEPENDENT SCHOOL DISTRICT 196 Rosemount-Apple Valley-Eagan Public Schools Rosemount, Minnesota Educating our students
Financial Statements June 30, 2014 Aberdeen School District 6-1
 Financial Statements Aberdeen School District 6-1 School District Officials Board Members Term Expiration Duane Alm... June 30, 2016 Todd Kolden... June 30, 2016 Brad Olson... June 30, 2015 Robert Nikolas...
BRAINERD PUBLIC SCHOOLS INDEPENDENT SCHOOL DISTRICT NO. 181 FINANCIAL STATEMENTS AND SUPPLEMENTARY INFORMATION YEAR ENDED JUNE 30, 2016
 FINANCIAL STATEMENTS AND SUPPLEMENTARY INFORMATION YEAR ENDED JUNE 30, 2016 TABLE OF CONTENTS JUNE 30, 2016 INTRODUCTORY SECTION 5 BOARD OF EDUCATION AND ADMINISTRATION 1 FINANCIAL SECTION 1 INDEPENDENT
Minneapolis Public Schools Special District No. 1 Minneapolis, Minnesota. Financial Statements. June 30, 2016
 Minneapolis, Minnesota Financial Statements June 30, 2016 Table of Contents Board of Education and Administration 1 Independent Auditor's Report 2 Management's Discussion and Analysis 5 Basic Financial
Independent Auditor's Report To the Board of Education Schaumburg Community Consolidated School District No. 54 Schaumburg, Illinois We have audited t
 Independent Auditor's Report To the Board of Education Schaumburg Community Consolidated School District No. 54 Schaumburg, Illinois We have audited the accompanying financial statements of the governmental
Financial Statements June 30, 2016 Aberdeen School District 6-1
 Financial Statements Aberdeen School District 6-1 School District Officials (Unaudited) Board Members Term Expiration Scott Wirth... June 30, 2017 Brian Sharp... June 30, 2017 Kevin Burckhard... June 30,
SAN LEANDRO UNIFIED SCHOOL DISTRICT ANNUAL FINANCIAL REPORT JUNE 30, 2018
 SAN LEANDRO UNIFIED SCHOOL DISTRICT ANNUAL FINANCIAL REPORT TABLE OF CONTENTS FINANCIAL SECTION Independent Auditor's Report 2 Management's Discussion and Analysis 5 Basic Financial Statements Government-Wide
FREMONT-MILLS COMMUNITY SCHOOL DISTRICT
 INDEPENDENT AUDITOR'S REPORTS BASIC FINANCIAL STATEMENTS AND SUPPLEMENTARY INFORMATION SCHEDULE OF FINDINGS AND RESPONSES June 30, 2011 Table of Contents Page Officials 1 Independent Auditor's Report 2-3
Jersey Shore Area School District
 Financial Statements and Supplementary Information Table of Contents Independent Auditors Report 1 Management s Discussion and Analysis (Unaudited) 4 Basic Financial Statements: Government-Wide Financial
Audited Financial Statements. June 30, 2018
 Audited Financial Statements June 30, 2018 CONTENTS INDEPENDENT AUDITOR S REPORT 1-3 PAGE MANAGEMENT S DISCUSSION AND ANALYSIS (UNAUDITED) 4-16 FINANCIAL STATEMENTS Government Wide Financial Statements
PORTAGE, PENNSYLVANIA. Single Audit Reporting Package
 PORTAGE, PENNSYLVANIA Single Audit Reporting Package For The Fiscal Year Ended June 30, 2018 PORTAGE AREA SCHOOL DISTRICT SINGLE AUDIT REPORTING PACKAGE JUNE 30, 2018 TABLE OF CONTENTS Page Management
Minneapolis Public Schools Special School District No. 1 Minneapolis, Minnesota. Financial Statements. June 30, 2018
 Minneapolis, Minnesota Financial Statements June 30, 2018 Minneapolis, Minnesota Board of Education and Administration 1 Independent Auditor's Report 2 Management's Discussion and Analysis 5 Basic Financial
ROCHESTER PUBLIC SCHOOLS INDEPENDENT SCHOOL DISTRICT NO. 535 FINANCIAL STATEMENTS YEAR ENDED JUNE 30, 2014
 FINANCIAL STATEMENTS YEAR ENDED JUNE 30, 2014 TABLE OF CONTENTS YEAR ENDED JUNE 30, 2014 INTRODUCTORY SECTION BOARD OF EDUCATION AND ADMINISTRATION 1 FINANCIAL SECTION INDEPENDENT AUDITORS REPORT 2 REQUIRED
Final Budget independent school district 196 Rosemount-Apple Valley-Eagan Public Schools Rosemount, Minnesota
 2013-14 Final Budget # 196 independent school district 196 Rosemount-Apple Valley-Eagan Public Schools Rosemount, Minnesota Educating our students to reach their full potential A Budget Guide For Our Community
MANKATO PUBLIC SCHOOLS INDEPENDENT SCHOOL DISTRICT NO. 77 FINANCIAL STATEMENTS YEAR ENDED JUNE 30, 2016
 FINANCIAL STATEMENTS YEAR ENDED JUNE 30, 2016 TABLE OF CONTENTS YEAR ENDED JUNE 30, 2016 INTRODUCTORY SECTION BOARD OF EDUCATION AND ADMINISTRATION 1 FINANCIAL SECTION INDEPENDENT AUDITORS REPORT 2 REQUIRED
COMPREHENSIVE ANNUAL FINANCIAL REPORT. The York County School Division Component Unit of the County of York, Virginia
 COMPREHENSIVE ANNUAL FINANCIAL REPORT The York County School Division Component Unit of the County of York, Virginia For the Fiscal Year Ended June 30, 2010 Prepared by the Department of Finance Dennis
WYALUSING AREA SCHOOL DISTRICT FINANCIAL STATEMENTS AND SUPPLEMENTARY INFORMATION FISCAL YEAR ENDED JUNE 30, 2018
 FINANCIAL STATEMENTS AND SUPPLEMENTARY INFORMATION FISCAL YEAR ENDED JUNE 30, 2018 WITH REPORT OF CERTIFIED PUBLIC ACCOUNTANTS TABLE OF CONTENTS 2018 FINANCIAL STATEMENTS Transmittal Letter... 1 Schedule
SAN LEANDRO UNIFIED SCHOOL DISTRICT ANNUAL FINANCIAL REPORT JUNE 30, 2016
 SAN LEANDRO UNIFIED SCHOOL DISTRICT ANNUAL FINANCIAL REPORT TABLE OF CONTENTS FINANCIAL SECTION Independent Auditor s Report 2 Management's Discussion and Analysis 5 Basic Financial Statements Government-Wide
ROCHESTER PUBLIC SCHOOLS INDEPENDENT SCHOOL DISTRICT NO. 535 FINANCIAL STATEMENTS YEAR ENDED JUNE 30, 2017
 FINANCIAL STATEMENTS YEAR ENDED JUNE 30, 2017 TABLE OF CONTENTS YEAR ENDED JUNE 30, 2017 INTRODUCTORY SECTION BOARD OF EDUCATION AND ADMINISTRATION 1 FINANCIAL SECTION INDEPENDENT AUDITORS REPORT 2 REQUIRED
School District of the Menomonie Area Menomonie, Wisconsin
 Menomonie, Wisconsin Financial Statements With Supplementary Financial Information Year Ended June 30, 2016 Financial Statements With Supplementary Financial Information Year Ended June 30, 2016 Table
WEST CONTRA COSTA UNIFIED SCHOOL DISTRICT Richmond, California. FINANCIAL STATEMENTS June 30, 2013
 Richmond, California FINANCIAL STATEMENTS June 30, 2013 FINANCIAL STATEMENTS WITH SUPPLEMENTARY INFORMATION For the Year Ended June 30, 2013 TABLE OF CONTENTS Page Independent Auditor's Report 1 Management's
Branch County, Michigan. Annual Financial Report
 Branch County, Michigan Annual Financial Report For the year ended Table of Contents For the year ended Financial Section Independent Auditor s Report... 1 Management s Discussion and Analysis... 4 Basic
DORCHESTER COUNTY SCHOOL DISTRICT TWO SUMMERVILLE, SOUTH CAROLINA FINANCIAL STATEMENTS YEAR ENDED JUNE 30, 2016
 DORCHESTER COUNTY SCHOOL DISTRICT TWO SUMMERVILLE, SOUTH CAROLINA FINANCIAL STATEMENTS YEAR ENDED JUNE 30, 2016 PREPARED BY: OFFICE OF FINANCIAL SERVICES Government-Wide Financial Statements Fund Financial
WALL SCHOOL DISTRICT NO. 51-5
 WALL SCHOOL DISTRICT NO. 51-5 INDEPENDENT AUDITOR S REPORTS, FINANCIAL STATEMENTS, AND SUPPLEMENTARY INFORMATION JUNE 30, 2017 RAPID CITY, SOUTH DAKOTA GILLETTE, WYOMING Table of Contents June 30, 2017
BERRYESSA UNION SCHOOL DISTRICT AUDIT REPORT For the Fiscal Year Ended June 30, 2018
 AUDIT REPORT For the Fiscal Year Ended June 30, 2018 For the Fiscal Year Ended June 30, 2018 Table of Contents FINANCIAL SECTION Page Independent Auditors Report... 1 Management s Discussion and Analysis...
INDEPENDENT SCHOOL DISTRICT NO. 273 EDINA, MINNESOTA. Financial Statements and Supplemental Information. Year Ended June 30, 2014
 INDEPENDENT SCHOOL DISTRICT NO. 273 EDINA, MINNESOTA Financial Statements and Supplemental Information Year Ended June 30, 2014 THIS PAGE INTENTIONALLY LEFT BLANK INDEPENDENT SCHOOL DISTRICT NO. 273 Table
CITY SCHOOL DISTRICT OF WHITE PLAINS, NEW YORK FINANCIAL STATEMENTS AND SUPPLEMENTARY INFORMATION FOR THE YEAR ENDED JUNE 30, 2014 IN CONNECTION WITH
 CITY SCHOOL DISTRICT OF WHITE PLAINS, NEW YORK FINANCIAL STATEMENTS AND SUPPLEMENTARY INFORMATION FOR THE YEAR ENDED JUNE 30, 2014 IN CONNECTION WITH OMB CIRCULAR A-133 CITY SCHOOL DISTRICT OF WHITE PLAINS,
Chippewa Valley Schools Clinton Township, Michigan. Financial Report with Supplemental Information June 30, 2012
 Clinton Township, Michigan Financial Report with Supplemental Information June 30, 2012 Contents Independent Auditor's Report 1-2 Management's Discussion and Analysis 3-12 Basic Financial Statements District-wide
ENGADINE CONSOLIDATED SCHOOLS Mackinac County, Michigan
 ENGADINE CONSOLIDATED SCHOOLS Mackinac County, Michigan Annual Financial Report For the year ended Table of Contents For the year ended Financial Section Independent Auditor s Report... 1 Management s
BEAUMONT UNIFIED SCHOOL DISTRICT AUDIT REPORT For the Fiscal Year Ended June 30, 2016
 BEAUMONT UNIFIED SCHOOL DISTRICT AUDIT REPORT For the Fiscal Year Ended June 30, 2016 For the Fiscal Year Ended June 30, 2016 Table of Contents FINANCIAL SECTION Page Independent Auditors' Report... 1
SCHOOL DISTRICT OF REEDSBURG Reedsburg, Wisconsin AUDITED FINANCIAL STATEMENTS. June 30, 2016
 Reedsburg, Wisconsin AUDITED FINANCIAL STATEMENTS C O N T E N T S Independent Auditor s Report... 1 Management s Discussion and Analysis... 4 Basic Financial Statements District-Wide Financial Statements
KELLOGGSVILLE PUBLIC SCHOOLS
 KELLOGGSVILLE PUBLIC SCHOOLS Kent County, Michigan Annual Financial Report For the year ended June 30, 2014 Table of Contents Year ended June 30, 2014 Financial Section Independent Auditor s Report...
Kent County, Michigan. Annual Financial Report
 Kent County, Michigan Annual Financial Report For the year ended June 30, 2018 Table of Contents For the year ended June 30, 2018 Financial Section Independent Auditor s Report... 1 Management s Discussion
CITY SCHOOL DISTRICT OF WHITE PLAINS, NEW YORK FINANCIAL STATEMENTS AND SUPPLEMENTARY INFORMATION FOR THE YEAR ENDED JUNE 30, 2015 IN CONNECTION WITH
 CITY SCHOOL DISTRICT OF WHITE PLAINS, NEW YORK FINANCIAL STATEMENTS AND SUPPLEMENTARY INFORMATION FOR THE YEAR ENDED JUNE 30, 2015 IN CONNECTION WITH OMB CIRCULAR A-133 Independent Auditor's Report Required
ROSEVILLE AREA SCHOOLS INDEPENDENT SCHOOL DISTRICT NO. 623 FINANCIAL STATEMENTS AND SUPPLEMENTAL INFORMATION YEAR ENDED JUNE 30, 2017
 FINANCIAL STATEMENTS AND SUPPLEMENTAL INFORMATION YEAR ENDED JUNE 30, 2017 TABLE OF CONTENTS YEAR ENDED JUNE 30, 2017 INTRODUCTORY SECTION SCHOOL BOARD AND ADMINISTRATION 1 FINANCIAL SECTION INDEPENDENT
Greenwood County School District Number 52
 Greenwood County School District Number 52 Report on Financial Statements For the year ended June 30, 2017 Board of Trustees Term of office Name From To Paul Cobb, Chairman July 1, 2016 June 30, 2019 Dayne
MOUNT VERNON COMMUNITY SCHOOL DISTRICT MOUNT VERNON, IOWA
 MOUNT VERNON, IOWA INDEPENDENT AUDITOR S REPORTS BASIC FINANCIAL STATEMENTS AND SUPPLEMENTARY INFORMATION SCHEDULE OF FINDINGS JUNE 30, 2015 T A B L E O F C O N T E N T S OFFICIALS 4 INDEPENDENT AUDITOR
FONTANA UNIFIED SCHOOL DISTRICT AUDIT REPORT For the Fiscal Year Ended June 30, 2018
 FONTANA UNIFIED SCHOOL DISTRICT AUDIT REPORT For the Fiscal Year Ended June 30, 2018 For the Fiscal Year Ended June 30, 2018 Table of Contents FINANCIAL SECTION Page Independent Auditors' Report... 1 Management's
FLEETWOOD AREA SCHOOL DISTRICT FINANCIAL AND COMPLIANCE REPORT
 FINANCIAL AND COMPLIANCE REPORT Year Ended TABLE OF CONTENTS Pages INDEPENDENT AUDITOR'S REPORT... 1-2 MANAGEMENT S DISCUSSION AND ANALYSIS... 3-13 BASIC FINANCIAL STATEMENTS Government-Wide Financial
CEDARBURG SCHOOL DISTRICT Cedarburg, Wisconsin. Audited Financial Statements Year Ended June 30, Independent Auditors' Report 1-2
 Audited Financial Statements Year Ended Table of Contents Page(s) Independent Auditors' Report 1-2 Management Discussion & Analysis 3-14 Basic Financial Statements Statement of Net Position 15 Statement
KELLOGGSVILLE PUBLIC SCHOOLS
 KELLOGGSVILLE PUBLIC SCHOOLS Kent County, Michigan Annual Financial Report For the year ended June 30, 2013 Table of Contents Year ended June 30, 2013 Financial Section Independent Auditor s Report...
ENGADINE CONSOLIDATED SCHOOLS Mackinac County, Michigan
 ENGADINE CONSOLIDATED SCHOOLS Mackinac County, Michigan Annual Financial Report For the year ended Table of Contents For the year ended Financial Section Independent Auditor s Report... 1 Management s
BRITTON DEERFIELD SCHOOLS BRITTON, MICHIGAN FINANCIAL STATEMENTS YEAR ENDED JUNE 30, 2014 WITH INDEPENDENT AUDITORS REPORT
 BRITTON, MICHIGAN FINANCIAL STATEMENTS YEAR ENDED JUNE 30, 2014 WITH INDEPENDENT AUDITORS REPORT CONTENTS PAGE Management s Discussion and Analysis i vi Independent Auditors Report 1 3 Basic Financial
Weld County School District RE-1. Financial Statements and Supplementary Information For the Year Ended June 30, 2017
 Financial Statements and Supplementary Information For the Year Ended June 30, 2017 Contents Independent Auditor s Report 1 2 Management s Discussion and Analysis 3 15 Basic Financial Statements: Government-Wide
SONOMA COUNTY OFFICE OF EDUCATION AUDIT REPORT For the Fiscal Year Ended June 30, 2018
 SONOMA COUNTY OFFICE OF EDUCATION AUDIT REPORT For the Fiscal Year Ended June 30, 2018 For the Fiscal Year Ended June 30, 2018 Table of Contents FINANCIAL SECTION Page Independent Auditors Report... 1
LAS VIRGENES UNIFIED SCHOOL DISTRICT AUDIT REPORT For the Fiscal Year Ended June 30, 2016
 LAS VIRGENES UNIFIED SCHOOL DISTRICT AUDIT REPORT For the Fiscal Year Ended June 30, 2016 For the Fiscal Year Ended June 30, 2016 Table of Contents FINANCIAL SECTION Page Independent Auditors Report...
Clinton Community School District Clinton, Iowa. Financial Report Year Ended June 30, 2017
 Clinton, Iowa Financial Report Year Ended June 30, 2017 Table of Contents INTRODUCTORY SECTION Table of contents Officials i iii FINANCIAL SECTION Independent auditor s report 1-3 Management s discussion
SCHOOL DISTRICT OF AMERY Amery, Wisconsin FINANCIAL STATEMENTS AND SUPPLEMENTARY INFORMATION YEAR ENDED JUNE 30, 2018
 FINANCIAL STATEMENTS AND SUPPLEMENTARY INFORMATION YEAR ENDED TABLE OF CONTENTS YEAR ENDED FINANCIAL SECTION INDEPENDENT AUDITORS' REPORT 1 REQUIRED SUPPLEMENTARY INFORMATION Management's Discussion and
SWEETWATER UNION HIGH SCHOOL DISTRICT
 SWEETWATER UNION HIGH SCHOOL DISTRICT AUDIT REPORT For the Fiscal Year Ended June 30, 2010 AUDIT REPORT For the Fiscal Year Ended June 30, 2010 Table of Contents FINANCIAL SECTION Page Independent Auditor
COTATI-ROHNERT PARK UNIFIED SCHOOL DISTRICT COUNTY OF SONOMA ROHNERT PARK, CALIFORNIA AUDIT REPORT JUNE 30, 2014
 COTATI-ROHNERT PARK UNIFIED SCHOOL DISTRICT COUNTY OF SONOMA ROHNERT PARK, CALIFORNIA AUDIT REPORT JUNE 30, 2014 CHAVAN & ASSOCIATES, LLP CERTIFIED PUBLIC ACCOUNTANTS 1475 SARATOGA AVE., SUITE 180 SAN
HOWARD SCHOOL DISTRICT NO FINANCIAL STATEMENTS AND INDEPENDENT AUDITOR'S REPORT FOR THE YEAR ENDED JUNE 30, 2017
 FINANCIAL STATEMENTS AND INDEPENDENT AUDITOR'S REPORT FOR THE YEAR ENDED SCHOOL DISTRICT OFFICIALS Board Members: Rick Olson - President Julie Schwader - Vice President Jill Calmus Rebecca Connor Stacy
ANAHEIM UNION HIGH SCHOOL DISTRICT ANNUAL FINANCIAL REPORT JUNE 30, 2015
 ANAHEIM UNION HIGH SCHOOL DISTRICT ANNUAL FINANCIAL REPORT TABLE OF CONTENTS FINANCIAL SECTION Independent Auditor's Report 2 Management's Discussion and Analysis 5 Basic Financial Statements Government-Wide
Livonia Public Schools. Financial Report with Supplemental Information June 30, 2012
 Financial Report with Supplemental Information June 30, 2012 Contents Independent Auditor's Report 1-2 Management's Discussion and Analysis 3-11 Basic Financial Statements Government-wide Financial Statements:
Belding Area Schools. Financial Statements With Supplemental Information June 30, 2018
 Financial Statements With Supplemental Information Contents Independent Auditor s Report 1-2 Management s Discussion and Analysis 3-9 Basic Financial Statements Government - Wide Financial Statements:
LEXINGTON COUNTY SCHOOL DISTRICT FOUR - GASTON SWANSEA SWANSEA, SOUTH CAROLINA. ANNUAL FINANCIAL REPORT June 30, 2017
 LEXINGTON COUNTY SCHOOL DISTRICT FOUR - GASTON SWANSEA ANNUAL FINANCIAL REPORT June 30, 2017 (With Independent Auditors Report Thereon) Annual Financial Report Table of Contents June 30, 2017 FINANCIAL
MILLCREEK TOWNSHIP SCHOOL DISTRICT
 ERIE, PENNSYLVANIA FINANCIAL STATEMENTS YEAR ENDED YEAR ENDED CONTENTS Independent Auditor s Report 1-2 Page Management s Discussion and Analysis 3-14 Basic Financial Statements Government-wide Financial
Public Schools of the City of Ann Arbor, Michigan. Financial Report with Supplemental Information June 30, 2018
 Financial Report with Supplemental Information Contents Independent Auditor's Report 1-2 Management's Discussion and Analysis 3-9 Basic Financial Statements Government-wide Financial Statements: Statement
Addison Community Schools. Report on Financial Statements (with required supplementary and additional information) Year Ended June 30, 2015
 Year Ended June 30, 2015") Report on Financial Statements (with required supplementary and additional information) Year Ended Table of Contents PAGE Independent Auditor's Report 1 2 Management s Discussion and Analysis 3 9 Basic
Report on Financial Statements (with required supplementary and additional information) Year Ended Table of Contents PAGE Independent Auditor's Report 1 2 Management s Discussion and Analysis 3 9 Basic
SCHOOL DISTRICT OF KEWASKUM Kewaskum, Wisconsin. Audited Financial Statements Year Ended June 30, Independent Auditors' Report 1-2
 Audited Financial Statements Year Ended Table of Contents Page(s) Independent Auditors' Report 1-2 Management Discussion & Analysis 3-13 Basic Financial Statements Statement of Net Position 14 Statement
Independent Auditor's Report
 Independent Auditor's Report Chairperson and Members of The School Board of Miami-Dade County, Florida Report on the Financial Statements We have audited the accompanying financial statements of the governmental
GAYLORD COMMUNITY SCHOOLS GAYLORD, MICHIGAN FINANCIAL STATEMENTS JUNE 30, 2016
 GAYLORD, MICHIGAN FINANCIAL STATEMENTS JUNE 30, 2016 TABLE OF CONTENTS Independent Auditor's Report 1-3 Management's Discussion and Analysis 4-11 Basic Financial Statements District-wide Financial Statements
TWIN RIVERS UNIFIED SCHOOL DISTRICT COUNTY OF SACRAMENTO MCCLELLAN, CALIFORNIA
 TWIN RIVERS UNIFIED SCHOOL DISTRICT COUNTY OF SACRAMENTO MCCLELLAN, CALIFORNIA FINANCIAL STATEMENTS WITH INDEPENDENT AUDITOR'S REPORT TABLE OF CONTENTS FINANCIAL SECTION PAGE INDEPENDENT AUDITOR'S REPORT
MENANDS UNION FREE SCHOOL DISTRICT AUDITED FINANCIAL STATEMENTS AND SUPPLEMENTAL SCHEDULES JUNE 30, 2018
 MENANDS UNION FREE SCHOOL DISTRICT AUDITED FINANCIAL STATEMENTS AND SUPPLEMENTAL SCHEDULES C O N T E N T S PAGE INDEPENDENT AUDITORS REPORT... 1 2 MANAGEMENT S DISCUSSION AND ANALYSIS... 3 10 BASIC FINANCIAL
PRATTSBURGH CENTRAL SCHOOL DISTRICT AUDIT REPORTING PACKAGE FOR THE FISCAL YEAR ENDED JUNE 30, 2018
 AUDIT REPORTING PACKAGE FOR THE FISCAL YEAR ENDED JUNE 30, 2018 TABLE OF CONTENTS 2018 REPORTING PACKAGE School District s Audited Financial Statements... 1 Section School District s Management Letter...
ANDERSON COUNTY SCHOOL DISTRICT NUMBER THREE
 ANDERSON COUNTY SCHOOL DISTRICT NUMBER THREE ANNUAL FINANCIAL REPORT June 30, 2017 (With Independent Auditors Report Thereon) Annual Financial Report Table of Contents June 30, 2017 Page(s) Independent
SCHOOL DISTRICT FREMONT RE-1
 FINANCIAL STATEMENTS With Independent Auditors Report Year Ended June 30, 2015 TABLE OF CONTENTS JUNE 30, 2015 INDEPENDENT AUDITORS REPORT MANAGEMENT S DISCUSSION AND ANALYSIS PAGE i BASIC FINANCIAL STATEMENTS
BEDFORD PUBLIC SCHOOLS Temperance, Michigan ANNUAL FINANCIAL REPORT. June 30, 2015
 Temperance, Michigan ANNUAL FINANCIAL REPORT June 30, 2015 Bedford Public Schools Table of Contents June 30, 2015 Independent Auditor s Report... 1-2 Independent Auditor s Report on Internal Control over
MADISON METROPOLITAN SCHOOL DISTRICT Madison, Wisconsin. FINANCIAL STATEMENTS June 30, 2015
 MADISON METROPOLITAN SCHOOL DISTRICT Madison, Wisconsin FINANCIAL STATEMENTS Madison, Wisconsin TABLE OF CONTENTS Page INDEPENDENT AUDITORS REPORT...1 MANAGEMENT S DISCUSSION AND ANALYSIS...3 BASIC FINANCIAL
HOUGHTON LAKE COMMUNITY SCHOOLS. REPORT ON FINANCIAL STATEMENTS (with required supplementary and additional supplementary information)
") REPORT ON FINANCIAL STATEMENTS (with required supplementary and additional supplementary information) YEAR ENDED JUNE 30, 2018 1 C O N T E N T S Page Independent auditor s report... 4-6 Management s Discussion
REPORT ON FINANCIAL STATEMENTS (with required supplementary and additional supplementary information) YEAR ENDED JUNE 30, 2018 1 C O N T E N T S Page Independent auditor s report... 4-6 Management s Discussion
Tecumseh Public Schools Tecumseh, Michigan FINANCIAL STATEMENTS. June 30, 2018
 Tecumseh, Michigan FINANCIAL STATEMENTS TABLE OF CONTENTS Page INDEPENDENT AUDITOR S REPORT MANAGEMENT S DISCUSSION AND ANALYSIS i-ii iii-viii BASIC FINANCIAL STATEMENTS District-wide Financial Statements
Livonia Public Schools. Financial Report with Supplemental Information June 30, 2013
 Financial Report with Supplemental Information June 30, 2013 Contents Independent Auditor's Report 1-2 Management's Discussion and Analysis 3-12 Basic Financial Statements Government-wide Financial Statements:
FONTANA UNIFIED SCHOOL DISTRICT AUDIT REPORT For the Fiscal Year Ended June 30, 2013
 FONTANA UNIFIED SCHOOL DISTRICT AUDIT REPORT For the Fiscal Year Ended June 30, 2013 For the Fiscal Year Ended June 30, 2013 Table of Contents FINANCIAL SECTION Page Independent Auditors Report... 1 Management