Uncovering Chronic, Persistent Vulnerability to Hunger in the Southern Lowlands and Senqu River Valley. Report of the DMA-WFP Targeting Exercise
|
|
|
- Willa Casey
- 5 years ago
- Views:
Transcription


1 Uncovering Chronic, Persistent Vulnerability to Hunger in the Southern Lowlands and Senqu River Valley Report of the DMA-WFP Targeting Exercise Maseru, Lesotho March 2006 Economic Planning Unit Disasters Management Authority Maseru, Lesotho Vulnerability Analysis and Mapping Unit United Nations World Food Programme Maseru, Lesotho
2 Executive Summary Chronic vulnerability to hunger and poverty prevail in the Southern Lowlands and Senqu River Valley areas of Lesotho. This document reports on the DMA-WFP led Targeting Exercise that found the livelihoods of a large number of households across the two zones at risk. A significant proportion of vulnerable households were found to be experiencing livelihood failure. Such households lack the capacity to ensure that their food, health and income needs can be met. Rural communities in 1,520 villages identified more than 39,000 households vulnerable to hunger and poverty, totalling to approximately 195,000 persons. These households were identified using a community level wealth-ranking method. Almost 31,000 of these households were interviewed in order to verify their vulnerability. The results of the Targeting Exercise show that: Livelihoods of poor rural-households are compromised and there is evidence of widespread livelihood failure that impacts household income, health and nutritional security. Livelihood systems appear to have become more structurally vulnerable to shocks as a result of declining agricultural capacity, loss of economic activities, high prevalence of chronic illness, and erratic, irregular and unevenly distributed rainfall affecting agricultural production. Agricultural production provides a source of livelihood for only a few poor-rural households, either through the provision of food for consumption or through the sale of crops. A large proportion of poor rural-households do not have access to agricultural assets, including land, and many of those with fields lack the labour or inputs necessary to utilise them. The majority of poor rural-households in the Southern Lowlands and Senqu River Valley do not have secure access to resources and income-generating activities, thus compromising their ability to cope with risks and shocks. Nearly 60 percent of interviewed poor-rural households were considered to be experiencing severe food-insecurity at the time of the survey. Most poor rural-households are unable to access adequate food, and their daily diets lack quality and diversity. Chronic Illness has a significant impact on rural livelihoods, with many households being directly impacted through death, illness or caring for persons infected with HIV/AIDS and their families. The overwhelming majority of poor rural-households with a chronically-ill household member were found to be immediately vulnerable to hunger. The Targeting Exercise shows that the majority of poor rural-households in the Southern Lowlands and Senqu River Valley areas have difficulty sustaining their livelihood and food security. DMA-WFP recommend that targeted social-protection programmes such as food aid or cash-transfers should be implemented to ensure that groups vulnerable to chronic hunger and poverty in Lesotho are provided with the means to ensure their survival and to enhance their livelihoods. 2
3 Table of Contents Executive Summary 2 Acknowledgments 4 List of Tables and Maps 5 List of Acronyms / Glossary 7 Section I: Introduction 10 Section II: Methodology 14 Section III: General Findings 19 Section IV: Maseru District Hunger Report 32 Section V: Mafeteng District Hunger Report 38 Section VI: Mohale s Hoek District Hunger Report 45 Section VII Quthing District Hunger Report 52 Section VIII Qacha s Nek District Hunger Report 59 List of References 65 Annexes: Annex 1. Community Dialogue Schedule 67 Annex 2. Vulnerable Household List 68 Annex 3. Public Verification Questionnaire 69 Annex 4. List of Participants 75 Annex 5. District Reports 77 3
4 Acknowledgements DMA and WFP acknowledge the important role played by community leaders and communities for their invaluable time and positive contributions. The DMA and WFP would like to acknowledge the support of the following bodies, which was integral to the success of the exercise. District Secretaries and Administrations District of Mafeteng District of Maseru District of Mohale s Hoek District of Qacha s Nek District of Quthing Government Departments and Agencies Bureau of Statistics District Administration Food and Nutrition Coordination Office Lesotho Vulnerability Assessment Committee Ministry of Agriculture and Food Security Ministry of Education Ministry of Forestry and Land Reclamation Ministry of Health and Social Welfare Rural Water Supply Public Health Inspectorate Non-Governmental Agencies Christian Health Association of Lesotho DORCAS Aid Lesotho Red Cross Salvation Army World Vision World Food Programme Regional Bureau Vulnerability Analysis and Mapping Unit 4
5 List of Tables and Maps Table 1.1: Participating Districts by Livelihood Zone. Map Constituencies Surveyed in the Targeting Exercise. Picture 2.1. Community Pitso, Quthing. Picture 2.2. Village Mapping Exercise, Mohale s Hoek. Picture 2.3. Wealth Ranking, Mafeteng. Table 2.1: Participating Districts by Constituency. Table 2.2. Participation in the Public Verification Exercise. Figure 3.1. Degree of Vulnerability to Hunger of Interviewed Households, by District. Figure 3.2. Primary Source of Foods Consumed. Figure 3.3. Impact of Chronic Illness on Household Vulnerability to Hunger, by District. Map 3.1. Average Household Vulnerability Score by Constituency. Map 3.2. Proportion of Interviewed Households without Maize Stocks. Map 3.3. Households without an Income Source. Map 3.4. Number of Single-Orphan Hosting Households Vulnerable to Hunger. Map 3.5. Number of Double-Orphan Hosting Households Vulnerable to Hunger. Table 3.1 Number of Villages and Vulnerable Households Identified in the Exercise. Table 3.2. Household Food Consumption by Group. Table 3.3. Number of Meals Eaten Yesterday. Table 3.4. Income Sources. Table 3.5 Agricultural Asset Ownership. Table 3.6. Households with Illness. Table 3.7. Child-Headed Household by District. Table 3.8. Vulnerable Elderly-Headed Households by District. Table 3.9. Presence of Disabled Household Members by District. Table Sex of Household Head and Vulnerability Status. Table 4.1. District Survey Summary. Table 4.2. Community Description of Wealth Groups, Maseru. Table 4.3. Problems and Solutions Presented by Communities, Maseru. Table 4.4. Numbers of Orphan-Hosting Households and Vulnerable Orphaned Children. Figure 4.1. Depth of Hunger, Maseru. Figure 4.2. Maize Stock Holding, Maseru. 5
6 Table 5.1. District Survey Summary. Table 5.2. Community Description of Wealth Groups, Mafeteng. Table 5.3. Problems and Solutions Presented by Communities, Mafeteng. Table 5.4. Numbers of Orphan-Hosting Households and Vulnerable Orphaned Children. Figure 5.1. Depth of Hunger, Mafeteng. Figure 5.2. Maize Stock Holding, Mafeteng. Table 6.1. District Survey Summary. Table 6.2. Community Description of Wealth Groups, Mohale s Hoek. Table 6.3. Problems and Solutions Presented by Communities, Mohale s Hoek. Table 6.4. Numbers of Orphan-Hosting Households and Vulnerable Orphaned Children. Figure 6.1. Depth of Hunger, Mohale s Hoek. Figure 6.2. Maize Stock Holding, Mohale s Hoek. Table 7.1. District Survey Summary. Table 7.2. Community Description of Wealth Groups, Quthing. Table 7.3. Problems and Solutions Presented by Communities, Quthing. Table 7.4. Numbers of Orphan-Hosting Households and Vulnerable Orphaned Children. Figure 7.1. Depth of Hunger, Quthing. Figure 7.2. Maize Stock Holding, Quthing. Table 8.1. District Survey Summary. Table 8.2. Community Description of Wealth Groups, Qacha s Nek. Table 8.3. Problems and Solutions Presented by Communities, Qacha s Nek. Table 8.4. Numbers of Orphan-Hosting Households and Vulnerable Orphaned Children. Figure 8.1. Depth of Hunger, Qacha s Nek. Figure 8.2. Maize Stock Holding, Qacha s Nek. 6
7 List of Acronyms / Glossary Asset CFSAM A resource having economic value that an individual or household owns or controls with the expectation that it will provide future benefit. Crop and Food Supply Assessment Mission. Chronic Food Insecurity A situation in which people and households are consistently unable to meet their food consumption needs over time. Chronic Illness Community Group Coping Strategies Constituency For the purposes of this exercise, any illness that renders an individual unable to engage in productive activities for three months or more. Chronic Illness is believed to be a good proxy indicator for HIV/AIDS. A mixed group that includes men, women and young people from all subgroups within the community. Activities that people resort to in order to obtain food income and/or services when their normal means of livelihood have been disrupted. An electoral area. Disability District DMA Elderly Food Access Food Insecurity Food Security High-Burden of Care A disadvantage or deficiency, especially a physical or mental impairment that prevents or restricts normal achievement. A division of an area for administrative purposes. Disaster Management Authority. A person over 60 years of age. A household s ability to acquire adequate amounts of food through a combination of their own home production and stocks, purchases, barter, gifts, borrowing or food aid. Food insecurity is the absence of food security, see below. A situation in which all people at all times have physical, social, and economic access to sufficient, safe and nutritious food which meets their dietary requirements and food preferences for an active and healthy life. A household that hosts two or more double orphans. (Note: for the purposes of this survey). 7
8 Household Hunger Livelihood Livelihood Group LVAC OVC Pair-Wise Ranking Pitso PLWHA Public Verification Exercise PVE Score Stakeholder Targeting Targeting System VAM VHL A social unit composed of individuals, with family or other social relations among themselves, eating from the same pot and sharing a common resource base. A condition in which people lack the required nutrients (protein, energy, vitamins and minerals) for fully productive, active and healthy lives. Hunger can be a short-term phenomenon, or a longer-term chronic problem. It can also have a range of severity from mild to clinical. (WFP Nutrition Service). A livelihood comprises of a household s capabilities, assets and activities required to secure basic needs such as food, shelter, health, education and income. A group of households who share the same basic means of livelihood styles. Lesotho Vulnerability Assessment Committee. Orphaned and Vulnerable Children. A participatory rural-appraisal tool that enables the communities to identify and prioritise problems according to the severity of their impact. A public gathering, usually convened by the chief. People Living with HIV/AIDS. An administrative exercise established by the DMA and WFP to assess household-level vulnerability to hunger and poverty. A score derived from the public verification exercise ranging from 1 to 38. The higher the score, the higher the level of household vulnerability to hunger and poverty. An agency, organization, group or individual that has a direct interest in the exercise or its evaluation. The process by which areas and populations are selected for a resource and given it. A series of mechanisms to define target groups, identify members of the groups, and ensure that assistance reaches the intended beneficiaries. Vulnerability, Analysis and Mapping. Vulnerable Household List. 8
9 Vulnerability WFP The presence of factors that place people at risk of becoming food insecure or malnourished, including those factors that affect their ability to cope. Vulnerability is a result of exposure to risk factors and of underlying socioeconomic processes that serve to reduce the capacity of populations to cope with those risks. World Food Programme. 9
10 Section I: Introduction This report documents the findings of the DMA-WFP Targeting Exercise. The aim of this exercise was to identify households within LVAC-identified vulnerable livelihood zones that are food insecure and to identify potential interventions for relief and recovery. The report is divided into eight sections. Section II outlines the methodology of the exercise. Section III details the general findings of the Targeting Exercise across the two livelihood zones. Sections IV to VIII detail the findings of the exercise at district level. 1.1 Background In April and May 2005, two assessment activities were carried out in Lesotho: the Lesotho Vulnerability Assessment undertaken by the LVAC and the Crop and Food Supply Assessment undertaken by FAO/WFP mission (CFSAM). Both activities indicated that agricultural production had improved for many districts compared to the previous marketing year (2003/04) but that the production of summer crops in (2004/05) marketing year was still percent below the long-term average. The assessments showed, however, that the Southern Lowlands and Senqu River Valley livelihood zones had high levels of predicted food deficit for the year 2005 to Other zones in the country experienced pockets of food insecurity. The Southern Lowlands are estimated to support 273,000 people. LVAC report that the four main elements in this food economy are food crops, paid employment, livestock and trade. According to LVAC, the poor are highly dependent upon purchases as a source of food and therefore local-wage employment as a source of income. A smaller share of their cash income comes from vegetable sales. The Senqu River Valley dissects large parts of the mountains that occupy the eastern side of Lesotho, supporting an estimated 346,000 people. LVAC report that the four main elements in this food economy are food crops, paid employment, cash crops and livestock. The poor here utilize six sources for their normal food access but are also highly dependent upon purchases. Utilising the findings of these missions, DMA and WFP designed and proposed to implement a targeting exercise in the two livelihood zones. The specific objectives of the exercise were: to identify and list households that were food insecure through village mapping; to verify the vulnerability of poor rural-households to hunger and food insecurity by administering a questionnaire; to prioritise problems that face communities and to identify potential interventions for relief and recovery. By developing a database of rural households vulnerable to hunger and livelihood insecurity, DMA and WFP seek to contribute to the elimination of hunger and poverty in the Southern Lowlands and Senqu River Valley areas. 10
11 1.2 Food Security Food security refers to the state where all people have access to nutritionally adequate food at all times for a healthy and active life (World Food Summit, 1996). Food is obtainable through production or purchase, but often through a combination of both. To be food secure the following conditions must be met: Food availability: this refers to the amount of food that is physically available in an area through production and markets. Food supplies must be adequate to feed the population; Food access: households must have the ability to acquire food on a sustainable basis through own stock and production, social and economic means; Food utilisation: this refers to the way the households utilise the food which they have accessed to improve the nutrition and health of household members. The knowledge and practises used to distribute food play a very crucial role in meeting the food security of individuals that translates into good nutritional status. Complimentary inputs such as clean water and good sanitation are also important. When a household is not able to acquire safe and nutritious food on a regular basis, that household may be said to be food insecure. The Targeting Exercise sought to identify food insecure households and those enduring vulnerability to hunger. 1.3 Targeting Challenges As part of the evolution of programming from relief to recovery, DMA and WFP face a number of targeting challenges. Through ongoing surveillance in the Southern Lowlands and Senqu River Valley areas, WFP monitors the impact of food assistance. Community Household Surveillance surveys identify the characteristics of those households that may not benefit from the receipt of food aid, and those households that would benefit from food aid. These characteristics were taken into account when designing the targeting exercise to ensure that food aid reaches those food insecure households who can most benefit from assistance. 1.4 Survey Scope The survey sites were selected by the DMA in cooperation with LVAC, WFP and partners. Sites were selected on the basis of their vulnerability to food insecurity and livelihood failure as determined by the LVAC assessment activities. The exercise surveyed 1,520 villages across the two livelihood zones. The survey took place from August 15th to October 31st, 2005 and was implemented by skilled personnel from the Government of Lesotho, World Food Programme, NGOs and CSOs. All survey enumerators participated in a two-day training exercise on the methodology that was hosted by the Targeting Exercise Technical Working Group. DMA-WFP employed a hybrid methodology for the targeting exercise consisting of two parts. In part one, communities participated in a community mapping exercise. In part two, vulnerable households participated in a verification exercise. 11
12 Districts Livelihood Zone Maseru Southern Lowlands Areas Mafeteng Southern Lowlands Areas Mohale's Hoek Southern Lowlands Areas Mohale's Hoek Senqu River Valley Areas Quthing Senqu River Valley Areas Qacha's Nek Senqu River Valley Areas Table 1.1: Participating Districts by Livelihood Zone. Part 1: In each village surveyed, a group of diverse householders provided information about the livelihoods in their community and undertook a community mapping exercise. Every household was categorised according to four wealth groups: the very poor, poor, moderate and better-off. Using this method, over 39,000 rural households were identified as being vulnerable to hunger and poverty (either poor or very poor), corresponding to more than 195,000 persons. Map Constituencies Surveyed in the Targeting Exercise. Part 2: In each village surveyed, very poor and poor households were invited to participate in a Public Verification Exercise. In this exercise, each householder was asked to provide information about their household membership, food consumption, income levels and asset ownership characteristics. By completing a series of questions, each household was given a vulnerability score, ranging from 1 to 38. The higher the 12
13 score, the more vulnerable a household is to hunger and poverty. Through the administration of this PVE questionnaire, DMA-WFP were able to estimate whether each household was immediately vulnerable to hunger, moderately vulnerable to hunger, or not vulnerable to hunger. The questionnaire also provided DMA-WFP with a significant picture of the characteristics of vulnerable households. Information from both parts of the survey was entered into two separate databases. The databases were linked with spatial data provided by the Bureau of Statistics, enabling the DMA-WFP to map the results at both district and community level. The detailed methodology is presented in Section II. 13
14 Section II: Methodology 2.1 Introduction The targeting exercise was carried out within the geographical areas that were classified by LVAC (2005) as food insecure and enduring a significant, predicted food deficit. These areas were characterised by inadequate rainfall, poor soils, declining purchasing power, high food prices, poor rangelands and livestock conditions (LVAC 2005). For a list of constituencies surveyed in the Targeting Exercise, refer to table 2.1. Districts Maseru Mafeteng Mohale's Hoek Quthing Qacha's Nek Constituencies Rothe, Koro-Koro, Qeme Kolo, Thaba-Pechela, Thaba-Tsoeu, Thabana Morena, Likhoele, Qalabane, Mafeteng Mohale s Hoek, Taung, Qhalasi, Mekaling, Qaqatu, Ketane Mount Moorosi, Qhoali, Sebapala, Moyeni, Tele Qacha s Nek, Lebakeng, Tsoelike, Hloahloeng Table 2.1: Participating Districts by Constituency. 2.2 Exercise Methods and Tools The exercise employed a combination of qualitative and quantitative selection methods. Community members participated in qualitative methods for defining, identifying and selecting households vulnerable to livelihood and food insecurity. Quantitative methods were used by trained enumerators to further classify households using objective and standardized criteria with a selection procedure that measured each household against a minimum standard set at sub-national level. Individuals who fell below the defined criteria were classified as either immediately or moderately vulnerable to hunger. Households above the defined criteria were deemed food secure. The exercise was conducted at the Food Distribution Point (FDP). The FDP was selected as the primary site of the survey, as normally the FDP is a central location around which a number of villages cluster. In some cases where FDPs did not provide a central location, another central point was selected to host the survey. All villages that fall under each FDP were invited to attend the pitso and the community members from different corners of the villages (to represent the whole village) were encouraged to attend the pitso. The following methods were used: Pair-Wise Ranking: Pair-wise ranking was used to identify and prioritise the problems within communities. An initial list of threats was provided and the community was requested to modify the list within their own context. Threats and problems were compared against each other to achieve a unique list in order of priority. 14


15 Picture 2.1. Community Pitso, Quthing. Community Mapping: At the FDP, community members were asked to gather separately to draw maps of their own villages and detail household locations. Each household was identified by name. Community members were asked to ensure that each household in the village appeared on the map and that households with chronically ill members, single orphans and double orphans were identified. The village maps provided information on the total number of households in each village, number of households with chronically ill and information on orphaned children. Wealth Ranking: Following the completion of the community mapping exercise, participants were asked to classify all households into four wealth categories from very poor, poor, moderate to better off. Participants were asked to identify the characteristics of each wealth group to ensure consistency throughout the ranking. Through probing, the position of each household was discussed until the group agreed on the appropriateness of the wealth category. 15


16 Picture 2.2. Village Mapping Exercise, Mohale s Hoek. Picture 2.3. Wealth Ranking, Mafeteng. Public Verification Exercise (PVE): Households identified as very poor and poor were called to the pitso ground on day two for further assessment. A household-vulnerability questionnaire was administered to the household head to verify their status. The questionnaire was used to calculate a vulnerability score for the household based on a series of questions about household membership, food consumption, food sources and stocks, income and livelihood strategies and asset ownership. For a detailed analysis of the questionnaire methodology, please see annex 3. 16
17 Although all poor and very poor households were invited to participate in the PVE, a proportion was unable to attend. Three-quarters of the households were interviewed, see table 2.2 below. District Participation Rate Maseru 79% Mafeteng 67% Mohale s Hoek 67% Quthing 82% Qacha s Nek 76% All Areas 74% Table 2.2. Participation in the Public Verification Exercise. As a safeguard, basic information for no-show households was captured on a Vulnerable Household List which provides information on the household s membership, vulnerability characteristics, current food-aid status and their community-ranked wealth group. An example of the Vulnerable Household List is provided in Annex Structure of the Targeting Exercise A unique structure was formed by the DMA and WFP to undertake the Targeting Exercise. The structure was designed to ensure maximum local-level participation of District Disaster Management Teams. DMA/WFP Steering Committee Comprised of key DMA and WFP focal points with a role to assist in the overall management of the targeting exercise. Technical Working Group (Maseru Based) - Composed of line ministries, Bureau of Statistics, and NGOs. The working group provided technical direction and support to the DMA-WFP for the exercise. Field Office (Mohale s Hoek Based) - A field office was established in Mohale s Hoek to oversee the implementation and operation of the targeting exercise. The Field Office was staffed by two Field Leaders, who were seconded by WFP and DMA who liaised directly with WFP Heads of Sub-Offices and DMA district staff. Team Leaders (District Based) - District leaders, usually from the DMA and WFP, were responsible to oversee the implementation of the exercise within each district. Targeting Teams (District Based) - Fifteen teams consisting of staff from DMA, WFP, line ministries and NGOs were established to administer the field level activities of the targeting exercise. 2.4 Training and Implementation Training on the methodology was held on the th August 2005 in Maseru. The training was led by the Technical Working Group. The exercise started on the 15 th August 2005 and ended in the first week of October in Mohale s Hoek and Quthing, mid- 17
18 October in Maseru and Qacha s Nek. Mafeteng was the last to district to be completed by the end of October. 2.5 Method Assumptions and Limitations The following limitations were observed: Attendance: In some areas, attendance was poor, which had an impact on the exercise results. Some of those households identified as poor or very poor did not participate in the public verification exercise. Given the scale and nature of the exercise, the overall participation rate is considered to be good. In cases where householders were unable to attend the PVE session due to social reasons such as illness, enumerators were encouraged to undertake the PVE with a next-of-kin. It proved difficult to ensure the attendance of some particular groups, such as child-headed households. Community Mapping: The community mapping process was used as an entry-point to identify households vulnerable to livelihood instability and hunger. These maps have been summarised for presentation of this exercise. Full profiles are available from LVAC assessment reports. Language of Enumeration: In some areas, especially in Quthing, Xhosa and Phuthi are the vernacular language for many households. Although efforts were made to find enumerators with these language skills, communication was hampered. Livelihood Zone Boundaries: At the time of the survey, the Bureau of Statistics and the Lesotho Vulnerability Assessment Committee were revising the boundaries of the livelihood zones. As a result, some FDPs and villages previously considered to be within the Senqu River Valley and Southern Lowlands livelihood zones were included in the survey. Openness: Although enumerators were trained on the use of effective probing skills, some participants were reluctant to disclose their wealth status. Validity of Information: The Targeting Exercise was undertaken at a point-in-time. The exercise recorded information from communities and households which may change, given the dynamic nature of food insecurity. DMA-WFP will update the database on a continuous basis. Village Boundaries: At some locations, the boundaries between FDPs and villages were unclear. Some villages and households were duplicated on community maps. The existence of sub-villages in larger villages also created difficulty in linking field data with electronic spatial data. 18
19 Section III: General Findings 3.1 Introduction Chronic and persistent vulnerability to hunger and poverty prevail in the Southern Lowlands and Senqu River Valley areas of Lesotho. The livelihoods of poor ruralhouseholds are compromised and there is evidence of widespread livelihood failure that impacts household income, health and nutritional security. Livelihood systems appear to have become more structurally vulnerable as a result of declining agricultural capacity, loss of economic activities, high prevalence of chronic illness and erratic weather patterns that affect agricultural production. The majority of households vulnerable to hunger and poverty in the Southern Lowlands and Senqu River Valley do not have secure ownership or access to productive assets and income-generating activities. This compromises their ability to cope with potential risks and shocks. Adequate food is becoming less and less accessible to many households, whose daily diets are shown to lack quality and diversity. Agricultural production provides few poor rural-households with a secure livelihood, either through the provision of food for consumption or through the sale of crops for income. A large proportion of poor rural-households do not have access to agricultural assets including land. Many households with fields do not have the assets and inputs necessary to utilise them. Chronic illness has a profound impact on rural livelihoods, with many households being directly affected by death, illness or a high-burden of care. Table 3.1 details the number of households identified to be vulnerable to hunger and poverty across the survey area. Chronic livelihood failure renders it increasingly difficult for poor rural-households to develop and maintain sustainable livelihoods. Targeted social-protection mechanisms, including social safety nets such as food assistance, in areas where markets are weak, or cash-transfers, where markets function, can ensure that chronically poor groups maintain access to food markets and cope with short-term shocks that increase their vulnerability to hunger. District Number of Villages Surveyed Number of Households Vulnerable to Hunger and Poverty Maseru 104 4,275 Mafeteng ,266 Mohale s Hoek 318 6,551 Quthing 435 7,719 Qacha s Nek 222 7,786 All Areas 1,520 39,597 Table 3.1 Number of Villages and Vulnerable Households Identified in the Exercise. 19
20 3.2 Depth of Hunger The Targeting Exercise shows that the livelihoods of over 39,000 households across the Southern Lowlands and Senqu River Valley are at risk of poverty and hunger. This figure approximately corresponds to 195,000 persons. Of these households, a high proportion can be considered to be experiencing complete livelihood failure. Such households lack the means to ensure that their food, health and income needs can be met. The survey identified that there is variation in the level of vulnerability to hunger and poverty within each district, as some areas show a higher ratio of vulnerable households to nonvulnerable households. These figures support the findings of the LVAC and CFSAM 2005 assessments, which mapped the status of vulnerable rural households. However, the overall estimates of vulnerable households are lower than those from the CFSAM and LVAC lean-period assessments. The Targeting Exercise was undertaken in the post-harvest period, when householders may have been more confident about their ability to weather shocks to their livelihood. Nearly 60 percent of interviewed householders were considered to experience immediate vulnerability to hunger at the time of the survey. Differences are observable across the survey area. While 59 percent of Qacha s Nek households were identified as being immediately vulnerable to hunger, nearly 73 percent of interviewed households in Mohale s Hoek were identified as immediately vulnerable to hunger. Forty percent of all households were considered to show a moderate level of vulnerability to hunger. The level of vulnerability to hunger varies across the survey area, as detailed in figure 3.1. Vulnerability to Hunger All Districts Qacha's Nek District Quthing Mohale's Hoek Immediate Moderate Secure Mafeteng Maseru 0% 20% 40% 60% 80% 100% Percentage of Poor Households Figure 3.1. Degree of Vulnerability to Hunger of Interviewed Households, by District. 20
21 Map 3.1 shows the average level of vulnerability for interviewed households across the five districts. Households in peripheral constituencies in Quthing, Mohale s Hoek and Mafeteng have the highest average vulnerability score. Considerable differences have been measured both between and within constituencies and districts. The higher the score, the more vulnerable a household is to hunger. Households that scored 24 and above were considered to be immediately vulnerable to hunger and poverty according to the threshold established when designing the questionnaire. Households scoring 17 to 24 were considered to be moderately vulnerable to hunger and poverty. While households scoring 16 or less were considered to be secure. Analysis of districts and constituencies will be provided in later sections in the report. Map 3.1. Average Household Vulnerability Score by Constituency. 3.3 Food Stocks and Sources The majority of poor-rural households do not hold food stocks. Given that the survey took place shortly after the harvest period, DMA-WFP expected to find households with some level of stock ownership. Nearly 80 percent of households had none or less than one month of maize in stock, 16 percent of households had stock to last one to two months. Four percent of households had stock to last between three and six months and only one percent of interviewed households held enough stock to last until the next harvest period. Differences were found among the five districts. In Maseru, 85 percent of households had none or less than one-month of maize in stock. Given these households proximity to 21
22 the market, it could be assumed that such households may have easier access to basic food stuffs. It should be noted, however, that most of these households do not have a reliable source of livelihood or income. As such, their ability to utilise the market may be limited. Households in peripheral areas, such as Quthing and Qacha s Nek, were more likely to have maize stocks lasting between one and two months. However it is important to note that over 70 percent of households in these districts have none or less than one month of maize in stock. Map 3.2 details the proportion of households that do not keep stocks of maize. Map 3.2. Proportion of Interviewed Households Without Maize Stocks. When examining the source of the food consumed by households, it is clear that the majority of poor households rely on gifts and casual employment as their primary source of food, see figure 3.2. Forty percent of all households rely upon gifts as their primary source, with 46 percent of households in Maseru and Mafeteng, and 50 percent of households in Mohale s Hoek relying on gifts respectively. Purchases and own production account for 31 percent of food consumed by all households. Food aid accounts for only 13 percent of poor rural-households primary source of food. Food aid plays a more important role in households in Mohale s Hoek and Mafeteng and is of lower importance for households in Maseru. 22
23 Primary Source of Food Consumed All Districts Qacha's Nek Quthing Mohale's Hoek Food Aid Gifts Casual Employment Purchase / Own Production No Source Mafeteng Maseru 0% 10% 20% 30% 40% 50% 60% 70% 80% 90% 100% Percentage of Households Figure 3.2. Primary Source of Foods Consumed. 3.4 Dietary Diversity The majority of vulnerable households in the Southern Lowlands and Senqu River valley fail to eat an adequately diverse diet. The majority of households eat food items from only one or two food groups, with majority of households depending on starches, mostly maize, and vegetables, mostly cabbage. Table 3.2 shows the complete breakdown of the food groups that were consumed by the households participating in the exercise. Foods Eaten Yesterday (% of Households) District Starch Vegetable & Tubers Fresh & Dried Fruit Animal Products Plant Protein Fats & Oils Maseru 96% 87% 0.20% 4% 9% 50% Mafeteng 98% 76% 0.50% 2% 11% 45% Mohale s Hoek 99% 81% 0.10% 2% 10% 54% Quthing 97% 58% 0.10% 2% 13% 30% Qacha s Nek 97% 59% 0.10% 2% 12% 25% Table 3.2. Household Food Consumption by Group 1. 1 All responses were based on the 24-hour recall method, in which respondents are asked to detail all of the foods that they ate in the day immediately previous to the exercise. 23
24 Less than half of all interviewed households accompanied their meals with fats and oils, such as margarine and cooking oil. A smaller proportion of households ate plant proteins such as peas and beans. Only 2 percent of households consumed animal products, such as meat and milk. It is clear that some areas appear to have a greater diversity than others, with households in Quthing and Qacha s Nek appearing to eat a slightly less diverse diet than households in other districts. District Four or More Three One to Two None Maseru 2% 18% 79% 1% Mafeteng 1% 16% 82% 1% Mohale's Hoek 2% 13% 83% 2% Quthing 2% 15% 81% 2% Qacha's Nek 2% 21% 75% 2% All Areas 2% 17% 80% 2% Table 3.3. Number of Meals Eaten Yesterday. Examination of the number of meals that householders ate per day, shows that a large proportion of vulnerable households ate just one to two meals a day. Table 3.3 shows that only 17 percent of households ate three meals on the day preceding the survey. Eighty percent of all households ate one to two meals per day, indicating that many households may not have sufficient access to adequate supplies of food. 3.5 Income and Asset Ownership A large proportion of vulnerable households in the study area are without an adequate means of income. Nearly one-fifth of the vulnerable population are without any source of income. Map 3.3 shows the proportion of households in each constituency without an income source. Constituencies in Mohale s Hoek, Quthing and Maseru have the highest proportion of households without incomes. Of the remaining four-fifths, the majority have only one source of income. Casual labour is the primary source of income for one-third of these households, with beer brewing and the receipt of a salary or pension also ranking as important. Table 3.4 details the major sources of income. Sources of Income Maseru Mafeteng Mohale s Hoek Quthing Qacha s Nek All Areas Remittances 23% 14% 6% 10% 3% 11% Livestock 2% 2% 1% 2% 2% 2% Small Business 4% 4% 1% 4% 4% 4% Crop Production 2% 4% 2% 2% 6% 3% Salary / Pension 16% 18% 10 % 18% 19% 16% Casual Labour 21% 35% 26% 26% 37% 29% Beer Brewing 8% 16% 20% 20% 25% 18% Table 3.4. Household Income Sources by District. 24
25 Map 3.3. Households without an Income Source. District Agricultural Asset Ownership Maseru Mafeteng Mohale's Hoek Quthing Qacha's Nek All Areas Tractor and Implements 3.9 % 1.3 % 1.0 % 0.8 % 1.0 % 1.4 % Draught Animals and Most Implements 1.5 % 0.7 % 0.6 % 0.5 % 2.0 % 1.0 % Draught Animals and One Implement 3.7 % 4.1 % 0.7 % 1.2 % 3.5 % 2.7 % One Major Asset 38.8 % 54.1 % 23.7 % 19.7 % 38.6 % 36.7 % No Assets 52.1 % 39.8 % 74.0 % 77.8 % 54.8 % 58.2 % Table 3.5 Household Agricultural-Asset Ownership, by District. Table 3.5 illustrates the agricultural asset-ownership patterns for vulnerable households in the two livelihood zones. While the majority of households do not have access to neither agricultural assets nor land, there are differences in the level of ownership across the survey area. Constituencies in Qacha s Nek, Mafeteng and Maseru have the highest levels of ownership, with a higher proportion of households having at least one major asset. Only five percent of the interviewed households have access to draught power and the implements necessary to utilise them. 25
26 3.6 Particular Vulnerable Groups Chronic Illness and HIV/AIDS Chronic illnesses are seriously impacting on the livelihoods of rural poor, who are directly affected through the death or illness of household members and the higher burden of care associated with caring for PLWHA and their offspring. The number of households identified as chronically vulnerable by the community appears rather low, perhaps reflecting the level of understanding of the HIV/AIDS pandemic in rural areas. Of those households that the community identified as affected by chronic illness, up to 70 percent are considered to be vulnerable to hunger and poverty. Such figures show that HIV/AIDS is having an impact on rural households ability to meet their livelihood needs. District Presence of Illness Chronically Illness Maseru 14 % 35 % Mafeteng 15 % 28 % Mohale's Hoek 27 % 34 % Quthing 31 % 25 % Qacha's Nek 26 % 29 % All Areas 23 % 29 % Table 3.6. Households with Illness. Information from household interviews, detailed in table 3.6, shows that there is a high rate of illness experienced by households. When specifically asked to detail the nature of the illness, roughly one-third of household heads considered the most ill person in their house to be chronically ill. Qacha's Nek 25% 75% Quthing 14% 86% Immediately Vulnerable Mohale's Hoek 9% 91% Moderately Vulnerable Mafeteng 13% 86% Maseru 12% 88% Figure 3.3. Impact of Chronic Illness on Household Vulnerability to Hunger, by District. 26
27 Chronic illness has a severe impact on a household s vulnerability to hunger. Figure 3.3 clearly shows that of those households with a presence of chronic illness, 85 percent of households are immediately vulnerable to hunger, a further 15 percent show moderate vulnerability to hunger Orphaned Children The community-mapping exercise provides information on the number of double and single orphans in the survey areas. Across the surveyed areas a total number of 19,768 households are supporting both single and/or double orphans. Over half of single-orphan hosting households are identified by the community as being vulnerable to hunger and poverty. Almost two-thirds of double-orphan hosting households are identified as vulnerable to hunger and poverty by the community. This suggests that orphan status is a relatively good indicator of household vulnerability status. The PVE exercise examined the impact of orphan status in the survey areas by providing information on those households who are considered to have a higher burden of care than most 2. Ten percent of all interviewed households were shown to have a high burden of care, hosting two or more double orphans as indicated in map 3.5. There are differences both between and within districts. Further analysis is provided later in the report. 2 Results from WFP s bi-annual Community Household Surveillance (CHS) survey assert that those households hosting two or more double orphans have a higher degree of vulnerability than households hosting one or none. Households with a higher burden of care are shown to have a reduced capacity to provide for themselves and are shown to employ severe coping methods in response. 27

28 Map 3.4. Number of Single-Orphan Hosting Households Vulnerable to Hunger. Particular attention must be given to the existence of child-headed households. Childheaded households are considered to be a particularly vulnerable group within Lesotho 3. Statistical data on child-headed households is considered to consistently under-report the existence of such households. In WFP s continuous surveying, child-headed households are uncommon. The targeting exercise was able to identify that only one percent of vulnerable households are headed by children. Analysis of their status shows that these households are severely vulnerable to hunger and livelihood insecurity. Further analysis is provided later in the report. Anecdotal evidence suggests that child-headed households are not identified as childheaded by communities, who traditionally share the burden of care for orphaned children. Such children may fall under the responsibility of an adult within the community. 3 The Rapid Assessment, Analysis and Action Planning for OVC (2004) reports that child headed households are often coerced into hazardous situations in order to provide food for their family and relatives. The RAAAP reported that just two percent of the orphan population of 92,000 reside in childheaded households. 28
29 Map 3.5. Number of Double-Orphan Hosting Households Vulnerable to Hunger. Other evidence suggests that as the pitso is primarily attended by adults, even when children are called, their attendance is normally low as they are unfamiliar with these events. As a result, DMA-WFP believe that their existence and needs may not be fully accounted for. Table 3.7 provides a breakdown of the number of child-headed households identified in each district. District Number of Child- Headed Households Identified Child-Headed Households as a Percentage of all Vulnerable Households Maseru 32 1 % Mafeteng % Mohale s Hoek % Quthing % Qacha s Nek % All Areas % Table 3.7. Child-Headed Household by District. 29
30 3.6.3 Elderly The elderly make up a large proportion of the poor rural-households, accounting for 40 percent of those interviewed. Differences in the number of elderly-headed households vulnerable to hunger and poverty are observable across all districts. In Quthing, elderlyheaded households represent almost half of the surveyed population. Qacha s Nek, however, showed the lowest proportion of elderly-headed households vulnerable to hunger and poverty, with just over one-third of interviewed households being headed by persons over 60 years of age. Table 3.8 provides the district level breakdown. District Elderly-Headed Households % of Total Interviewed Households Maseru 1, % Mafeteng 3, % Mohale s Hoek 1, % Quthing 3, % Qacha s Nek 2, % All Areas 12, % Table 3.8. Vulnerable Elderly-Headed Households by District Disabled Twelve percent of interviewed households have the presence of a physically disabled person. There are observable differences in the level of disability across the districts. Sixteen percent of households vulnerable to hunger and poverty in Mohale s Hoek are hosting a physically-disabled person. In Maseru, vulnerable households appear to have the lowest proportion, with just eight percent of households hosting a member with a physical disability. Table 3.9 details the presence of disability by district. District Presence of Disability % of Total Interviewed Households Maseru % Mafeteng % Mohale s Hoek % Quthing % Qacha s Nek % All Areas 3, % Table 3.9. Presence of Disabled Household Members by District Female-Headed Female-headed households are slightly more vulnerable than male-headed households. Following administration of the PVE questionnaire, a higher proportion of female-headed households were considered to be immediately vulnerable to hunger than male-headed households. See Table 3.10 for detailed information. 30
31 Sex of HH Head Secure Vulnerability to Hunger and Poverty Moderately Vulnerable to Hunger Immediately Vulnerable to Hunger Male 2% 46% 52% Female 1% 44% 55% Table Sex of Household Head and Vulnerability Status. 3.7 Conclusion The Targeting Exercise finds evidence of chronic livelihood failure in the Southern Lowlands and Senqu River Valley livelihood zones. This failure renders it increasingly difficult for households vulnerable to hunger and poverty to develop and maintain sustainable livelihoods. In particular, the exercise shows that: A large body of households are at risk of hunger in the Southern Lowlands and Senqu River Valley areas. The degree of vulnerability to hunger and poverty varies across villages and constituencies, with some areas having a higher concentration of vulnerable households than others. The majority of poor rural-households did not hold any cereal stocks in the immediate post-harvest period. The majority of poor rural-households depend on gifts and casual employment as their primary source of food. Most poor rural-households do not have an adequately diverse diet, relying on basic cereals and some vegetables for food consumption. The majority of poor rural-households rely on just one source of income, either casual labour, beer brewing or the receipt of a salary or pension. A large proportion of poor rural-households are without an adequate means of income. The majority of poor rural-households do not have access to neither agricultural land nor the inputs necessary to engage in productive agriculture. Chronic Illness greatly affects poor rural-households, with almost one-quarter experiencing illness in some form. There are a large number of single and double-orphans identified as vulnerable by their communities. Targeted social-protection mechanisms, such as food aid, in areas where markets are weak, or cash-transfers, in areas where markets function, can ensure that households chronically vulnerable to hunger and poverty identified in this survey are provided with the means to ensure their survival and enhance their livelihoods. 31
32 Section IV: Maseru District Hunger Report 4.1 Introduction Three constituencies were surveyed in Maseru. Communities identified over 4,000 vulnerable households in the constituencies of Koro-Koro, Qeme and Rothe. This number represents 43 percent of the total number of households surveyed in the three constituencies. Communities in Rothe identified the highest number of households vulnerable to hunger and poverty, with some 52 percent of the households being identified as immediately vulnerable. In Koro-Koro and Qeme, the figures were 41 and 29 percent respectively. Seventy-nine percent of these households participated in the Public Verification Exercise. Table 4.1 details the summary findings. Koro-Koro Qeme Rothe All Areas Number of Households Surveyed 2,943 2,380 4,561 9,884 Number of Households Identified as Poor/Very Poor 1, ,349 4,225 Number of Households Interviewed ,865 3,317 Participation Rate 74% 84% 79% 79% Table 4.1. District Survey Summary 4.2 Wealth Ranking Across the three constituencies, households without land were largely considered to be very poor. Those with land in Qeme do not cultivate due to lack of draught power and agricultural inputs. Child-headed households were highlighted as a very poor category (see table 4.2). In Koro-Koro, the construction of the airport was cited as having affected the livelihoods of poor households. The poor are mostly unemployed, but rely on casual labour and beer brewing. Moderate and better-off households had more sources of income. The moderate engage in income generating activities such as making clay pots and to some extent some earn monthly salaries. Most of the better-off earn monthly salaries. The number of fields and livestock owned by the better-off is higher than that of the moderate. 32
33 Vulnerable Households Very Poor Poor Moderate Better-Off Rothe Unemployed. Landless. Do not have enough food to eat. Rely on gifts. No livestock. Depend on other people for cultivation. Have access to land but no inputs. Unemployed. No livestock. Own Fields. Engage in income generating activities e.g. beer brewing. Engage in Casual Labour. Employed. Own fields. Own livestock. Have food stocks. Landless. Unemployed. Unemployed. No livestock. Engage in income generating activity e.g. clay pots. Have formal jobs e.g. teachers and mine workers. Koro-Koro Child-headed family. Rely on gifts. Landless. Have food stock. Do income generating activities. Earn monthly salaries. Own Livestock. Own Cars or Tractors. Have fields. Engage casual labour. Unemployed. Beer Brewers. Own fields and livestock. Have shops. Qeme Rely on gifts. Do not have enough food to eat Child-headed family. Depend on remittance. Elderly-headed. Some have few livestock but are landless. Own land Earn a salary. Beer brewing. Earn a salary e.g. teachers. Own more than one field. Own productive resources e.g. tractors. Have land but no livestock. Table 4.2. Community Description of Wealth Groups, Maseru. 4.3 Threat Analysis Analysis of key threats affecting the communities livelihoods was also carried out. Drought was the greatest concern across the constituencies. Poor availability of farm inputs was also mentioned frequently. Other significant threats include stock theft, lack of potable water and increasing food prices in Rothe, Koro-Koro and Qeme respectively. Communities proposed a range of agricultural and infrastructural improvements as a response to the problems that they raised. Dam construction and water harvesting for domestic use, specifically the construction of water tanks and pipes were proposed in all the constituencies. Village policing was also considered to be an important social infrastructure that could improve livelihoods in Rothe and Qeme constituencies. Subsidies on farm inputs were proposed especially in Koro-Koro constituency. Full details are provided in Table
34 Constituency Rothe Koro-Koro Qeme Threats to Livelihoods (Top Three Ranked) 1. Drought 2. Stock theft 3. Poor availability of farm inputs 1. Drought 2. Poor availability of farm inputs 3. Lack of potable water 1. Drought 2. Increasing food prices 3. Poor availability of farm inputs Proposed Solutions In Order of Importance 1. Dam construction 2. Construction of water tanks and pipes 3. Village policing 4. Subsidies on farm inputs 5. Others: Tree planting at Ramatekane Community groups at Moreneng Road construction at Liqoabing Price control mechanism at Linotsing 1. Construction of water tanks and pipes 2. Dam construction 3. Subsidies on farm inputs 4. Others: Bridge construction at Ha Tsiu village Agriculture implements at Mokema Agriculture expertise at Lesoli 1. Dam construction 2. Others Police station at Matukeng Farm subsidies at Mantsebo Table 4.3. Problems and Solutions Presented by Communities, Maseru. 4.4 Depth of Hunger Over half of the interviewed very poor and poor households were considered to be immediately vulnerable to hunger. Differences were observable between the constituencies, with over 55 percent of households in Koro-Koro falling into the immediately hungry category. A further 42 percent of households were considered to be moderate. Qeme showed a lower proportion of households in the vulnerable group, with almost 49 percent of households falling into the immediately vulnerable category. A similar proportion of households were observed to be moderate. The number of community-identified households considered to be secure was low, with just three percent of households in all three constituencies falling into this group. The mean vulnerability score for all three constituencies fell under the vulnerability threshold of 24 and within the moderately vulnerable category. A total of 1,780 and 1,439 households were identified as immediately and moderately vulnerable respectively. See figure 4.1 for further details. 34
35 54% Rothe 42% 3% Qeme 2% 49% 49% Immediate Moderate Secure 55% Koro-Koro 42% 3% Figure 4.1. Depth of Hunger, Maseru. 4.5 Food Consumption and Stocks The majority of interviewed vulnerable households do not hold any significant stocks of cereal or pulses. Looking specifically at maize holding, some 85 percent of households keep less than one month stock of maize, this includes households that do not keep any stocks. In Rothe and Qeme, households appear to keep fewer stocks than households in Koro-Koro, who are more likely to have a bigger supply of maize in stock, see figure 4.2. Using a one-day recall, households were also asked to provide information on their food consumption patterns. When asked the primary source of food, it is observed that the majority of very poor and poor households rely on external sources. Just over 46 percent of households relied on gifts, and 32 percent relied on production or purchase. DMA- WFP expected that households producing their own food would hold stock in the period immediately after the harvest. Given that the majority of households do not have significant amounts of foodstuffs in stock, it is possible to assume that most households in this category rely on purchasing food. 4.6 Income and Asset Ownership Patterns The majority of vulnerable households in the three constituencies have only one source of income. Households in Koro-Koro and Qeme appear to have the least number of income sources; 28 percent of households are without an income source, while 71 percent of households have just one source. In Rothe, however, households appear to have more income sources to rely on, with 76 percent of households having one source 35
36 of income, and three percent of households having two. When examining the major sources of income, the results show that: Remittances appear to be the most important source, with more than one-fifth of householders relying on this strategy; Casual labour accounts for almost one fifth of household livelihood strategies. Casual labour is traditionally seen to be a weak livelihood strategy. Given the importance that households in these constituencies attached to problems associated with agriculture and their resolution, it may have been expected that crop production and livestock sales would play a larger role, however only two percent of households cite these areas as a source of income; The role of salaries and pensions are important also, with some 17 percent of households relying on these sources. Given that 90 percent of these households are elderly-headed it may be possible to assume that the Old Age Pension plays a significant role here; Beer brewing is also a significant strategy for very poor and poor households. Rothe Qeme Less than One Month / No Stock One to Two Months Three to Six Months Until Next Harvest Koro-Koro 0% 10% 20% 30% 40% 50% 60% 70% 80% 90% 100% Figure 4.2. Maize Stock Holding, Maseru. There is a considerable difference in the level of agricultural asset ownership for vulnerable households in the three constituencies: Households in Rothe have a higher number of key agricultural assets, either mechanical or animal-draught power, than in the other constituencies; A significant majority of householders in Koro-Koro do not have any agricultural assets, representing 63 percent of households; Fifty-one and 47 percent of households in Qeme and Rothe respectively do not have any agricultural assets. 36
37 4.7 Characteristics of Vulnerable Groups Less than ten percent of the poor and very poor households were identified as having a chronically-ill household member during the community mapping. Of those households who were identified as being affected by chronic illness, over half were considered by the community to fall within either the poor or very poor categories. A significant number of all households hosted either single or double orphans, with 1,612 households hosting single orphans and 640 households hosting double orphans. Of these, 841 vulnerable households hosted 1,667 single orphans and 358 vulnerable households hosted 645 double orphans. These households have a high average PVE score of 26, which falls firmly in the immediately vulnerable category. Vulnerability Characteristics Koro-Koro Qeme Rothe All Areas Single Orphan Hosting Households ,612 Vulnerable Single Orphan Hosting Households Double-Orphan Hosting Households Vulnerable Double Orphan Hosting Households Total Number of Vulnerable Single Orphans ,667 Total Number of Vulnerable Double Orphans Table 4.4. Numbers of Orphan-Hosting Households and Vulnerable Orphaned Children. Child-headed households are considered to be a particularly vulnerable group, as defined earlier in the report. The constituency of Qeme appears to have a higher proportion of child headed households than the other constituencies participating in the survey, with two percent of vulnerable households falling into this category. Elderly-headed households form a significant proportion of the total, representing some 38 percent. 37
38 Section V: Mafeteng District Hunger Report 5.1 Introduction Seven constituencies were surveyed in Mafeteng. Communities here identified a total of 13,626 households as being either very poor or poor. This number represents almost half of the total number of households captured. There is a considerable degree of divergence within the seven constituencies. Thaba-Pechela, Thabana-Morena and Qalabane appeared to have the highest levels of poverty, with 68 and 62 percent of the households falling into the two lowest wealth rank groups, respectively. Two-thirds of all households identified as very poor or poor in the district participated in the Public Verification Exercise. Thaba-Pechela, Thaba-Tsoeu and Likhoele had the highest level of participation in the exercise, with the lowest participation levels being found in Thabana-Morena and Mafeteng constituencies. Table 5.1 details the summary findings. Number of Households Surveyed Thaba-Pechela Kolo Thaba-Tsoeu Thabana-Morena 4,001 5,215 3,119 5,173 2,938 4,088 2,416 26,950 Number of Households Identified as Very/Poor Poor 2,267 2,306 1,407 3,501 1,144 2, ,626 Likhoele Qalabane Mafeteng All Areas Number of Households Interviewed 1,950 1,804 1,188 1, , ,138 Participation Rate 86% 78% 84% 43% 75% 64% 46% 67% Table 5.1.District Survey Summary. 5.2 Wealth Ranking Within Mafeteng district, very poor households were considered to be those that do not have fields or livestock and rely on gifts for food and income. Although poor households are unemployed, they have access to land. They generate income through beer brewing and engage in casual labour. Moderate households have fields and few livestock. They are able to plough their fields. Some are employed and earn an income of at least 150 Maloti each month and some receive remittances from their children who are employed. The better-off earn monthly income either through their business interests or formal employment and they have enough food for household members. Table 5.2 provides a summary of the wealth group characteristics identified by householders in the district of Mafeteng. 38
39 Vulnerable Households Moderate Better-Off Very Poor Poor Unemployed. No livestock. No fields. Unemployed, but own land. Sometimes do not have farm inputs. Have few livestock. Own fields. Are able to plough their fields. Have formal employment e.g. teachers. Own business, car and tractors. Mafeteng No farm inputs. Rely on gifts. No income. Engage in casual labour. Engage in beer brewing. They are employed, but they earn small amount of money around M150. They receive remittances. Have casual employment. They work in the mines. Produce enough food. Table 5.2. Community Description of Wealth Groups, Mafeteng. 5.3 Threat Analysis Drought and erratic rainfall were of most concern to all householders in the seven constituencies. Increasing food prices were a major concern in Likhoele and of secondary importance in Thaba-Tsoeu, Thabana-Morena and Thaba-Pechela. Poor availability of farm inputs was noted as a secondary concern in Thaba-Pechela, Thabana-Morena and Likhoele constituencies. Orphanhood was noted as a secondary concern in Thaba-Pechela constituency. Opening of supermarkets was cited by some constituencies, as an attempt to bring lower food prices. Communities in all the constituencies, with the exception of Likhoele, proposed dam construction as a primary intervention strategy. Communities in Likhoele also cited cooperatives and health education as the most important solutions to combat their health-related hazards. Assistance with supply of potable water, income generating projects, soil conservation, irrigation scheme, farm inputs, and health education were cited as important intervention strategies in Kolo, Qalabane, Thaba-Pechela, Thabana-Morena, Thaba-Tsoeu and Likhoele constituencies respectively. Table 5.3 details these findings. 39
40 Constituency Threats to Livelihood (Top Three Ranked) Kolo 1. Erratic rains 2. Drought 3. Lack of water Qalabane 1. Drought 2. Lack of water 3. Poor soils Thaba- Pechela Thabana- Morena 1. Drought 2. High Number of Orphans 3. Erratic rains 1. Drought 2. Poor availability of farm inputs 3. Increasing food prices Thaba-Tsoeu 1. Drought 2. Increasing food prices 3. Erratic rains Likhoele 1. Drought 2. Increasing food prices 3. Erratic rains Proposed solutions in order of importance 1. Dam construction 2. Supply of drinking water 3. Food for Work (FFW) development projects 4. Soil conservation 5. Farm inputs Others: Clinic construction at Malaleng Promotion of tourism in historic areas at Mphasa Vegetable gardening at Malaleng. 1. Dam construction 2. Income generating projects 3. Farm inputs 4. FFW projects Others: Construction of water tanks and pipes Food price control mechanisms Road construction Promotion of communal gardening Irrigation schemes Food aid 1. Dam construction 2. Soil conservation 3. Improvement of health services 4. Maintenance of health services 5. FFW projects Others: Reestablishment of cooperative systems Irrigation 1. Dam construction 2. Irrigation scheme 3. Tree planting 4. Provision of extension services 5. Income generation projects Others: Grants for orphans Food aid Training of health programmes Structure for community conflict management 1. Dam construction 2. Farm inputs 3. Income-generating projects 4. Provision of extension services 5. Health services improvement 6. Police station 7. Bridge and road construction 8. Tree planting Others: Orphan grants Cooperatives Provision of supermarkets Primary schools 1. Cooperatives 2. Health education 3. Agricultural inputs and fertilizers 4. FFW cash generating projects Others: Dam construction Provision of supermarkets Provision of pipes for irrigation Orphan grants Tree planting Table 5.3. Problems and Solutions Presented by Communities, Mafeteng. 40
41 5.4 Depth of Hunger More than half of the interviewed households in the district were considered to be immediately vulnerable to food insecurity. A total of 4,653 households were categorised as being immediately vulnerable to food insecurity. There was some divergence in the depth of hunger at the constituency level. Higher levels of hunger were found in Thaba- Pechela, Mafeteng, Thaba-Tsoeu and Thabana-Morena. Lower levels of hunger were observed in Kolo, Likhoele and Qalabane. A further 48 percent of households were determined to be at moderate risk to hunger in the district. Approximately one percent of interviewed households in the district were found to be food secure. The lowest levels of food secure households were found in Thaba-Tsoeu, Qalabane and Mafeteng. A full breakdown is provided in figure 5.1. Mafeteng 0% 47% 53% Qalabane 1% 49% 50% Likhoele 1% 46% 53% Thabana Morena 2% 51% 48% Immediate Vulnerability Moderate Vulnerability Secure Thaba-Tsoeu 1% 48% 51% Kolo 2% 49% 50% Thaba-Pechela 2% 42% 56% Figure 5.1. Depth of Hunger, Mafeteng. 5.5 Food Consumption and Stocks The vast majority of interviewed very poor and poor households in Mafeteng are without significant stocks of cereals or pulses. More than 90 percent of households in Thaba- Pechela, Qalabane and Mafeteng possess none or less than one month s stock of maize. Some 10 percent of households in the district possess one to two months supply. In Kolo, Thaba-Tsoeu and Thabana-Morena a higher proportion of households hold such amount of stock. In these three constituencies over two percent of households have 41
42 stock to last three to six months. Less than one percent of households have enough stock to last them until the next harvest. A full breakdown is provided in figure 5.2. Mafeteng Qalabane Likhoele Less than One Month/ No Stock Thabana Morena One to Two Months Three to Six Months Until Next Harvest Thaba-Tsoeu Kolo Thaba-Pechela 0% 10% 20% 30% 40% 50% 60% 70% 80% 90% 100% Figure 5.2. Maize Stock Holding, Mafeteng. The majority of households in all seven constituencies depend on gifts as their primary source of food. Using a one-day recall, the survey observed that 56 percent of households in Qalabane cited gifts as their primary source of food consumed in the day previous to the exercise. Between 41 and 48 percent of households in the remaining six constituencies relied on gifts. Food production and purchase were the second most important source for almost one-third of interviewed households. There were considerable differences within the district, with a lower proportion of householders in Thaba-Pechela relying on production or purchase than elsewhere. In contrast, 39 percent of households in Mafeteng constituency relied on production or purchase as their primary source of food. Given that the vast majority of poor households in the district do not possess any significant stock of foodstuffs, it may be assumed that food purchase is over greater importance than production. Food assistance was considered to be of greater importance to 15 percent of households across the district. In the constituencies of Thaba-Tsoeu food assistance accounted as a primary source for almost one-quarter of households. Food obtained from casual employment was most evident in Thaba-Pechela and Kolo. One percent of all the households in the district cited that they did not have any regular source of food for consumption. 42
43 5.6 Income and Asset Ownership Patterns Two-fifths of all poor and very poor households utilise only one source of income to meet their livelihood needs. In the constituencies of Thaba-Tsoeu, Likhoele and Qalabane, 87, 85 and 82 percent of households respectively have only one means of income source. In Thaba-Pechela, Kolo, Thabana-Morena and Mafeteng a lower proportion of households have one source of income. Over 14 percent of households in the district had no source of income, with 22 percent of households in Thaba-Pechela being without a source of income. A high proportion of vulnerable households in Mafeteng, Kolo and Thabana-Morena were also without a source. In particular: Casual labour ranks as the most important source of income for communityidentified households in Mafeteng. Thirty-five percent of households in the district rely upon casual labour as their primary source of income. Casual labour is of greater importance to households in Thaba-Tsoeu and Qalabane, with over 40 percent of poor and very poor households relying on it. The receipt of a salary or pension ranks as the second most important source of income for poor and very poor households in Mafeteng. Given that the vast majority of these households are elderly-headed, ranging from 80 percent in Thaba-Pechela to 94 percent in Kolo, it may be considered that the majority of these very poor and poor households rely on the old-age pension. Furthermore, when compared with the income category of the household, it is possible to assume that the old-age pension plays an important role. Beer brewing and the receipt of remittances are also important strategies in all seven constituencies. The majority of poor, rural households in Mafeteng have few agricultural assets or access to land. In particular: With the exception of Thaba-Pechela, over half of all rural households possess one major asset. A higher proportion of households in this constituency, however, do not possess any agricultural assets or access to land. Six percent of households have access to their own draught power across all seven constituencies. The majority of poor and very poor households hold few livestock, if at all. Over 90 percent of households in the district have less than two head of cattle and five head of goats or sheep. 5.7 Characteristics of Vulnerable Groups Sixteen percent of interviewed households acknowledged having a sick household member, of which 28 percent stated that this was chronic illness. Seventy-three percent of these households with chronic illness were considered to be immediately vulnerable to hunger and poverty. In the district, a large number of very poor, poor, moderate and better-off households hosted orphaned children. A total of 3,548 single orphans were hosted by vulnerable households. A further 1,361 double orphans were hosted by vulnerable households. Ten percent of the interviewed households were considered to have a high burden of care, hosting two or more double-orphaned children. Such households had a higher vulnerability score than other households participating in the survey. The average score 43
44 for a high-burden of care household in Mafeteng constituency was 25, compared to the average score of 23 for the district. Table 5.4 provides information on single and double orphaned children in the district. Thaba-Pechela Vulnerability Characteristics Households Hosting Single Orphans ,296 Vulnerable Households Hosting Single Orphans ,813 Households Hosting Double Orphans ,571 Vulnerable Households Hosting Double Orphans ,085 Total Number of Vulnerable Single Orphans ,548 Total Number of Vulnerable Double Orphans ,361 Kolo Thaba-Tsoeu Thabana Morena Likhoele Qalabane Mafeteng All Areas Table 5.4. Numbers of Orphan-Hosting Households and Vulnerable Orphaned Children. Forty-seven child-headed households were identified by the community during the survey. The proportion of child-headed households identified by the community in Mafeteng is lower than the proportion identified in other districts. Elderly-headed households accounted for over one-third of the household heads in the survey. A higher proportion of elderly-headed households were identified as poor or very poor in Kolo, Thabana-Morena and Likhoele constituencies. 44
45 Section VI: Mohale s Hoek District Hunger Report 6.1 Introduction Six constituencies were surveyed in Mohale s Hoek 4. Communities here identified 6,651 households as very poor or poor. These vulnerable households represented 41 percent of the overall households captured in the survey. The rate varies across the constituencies. Communities in Mohale s Hoek constituency identified 27 percent of households as being vulnerable. In contrast, in Mekaling constituency, communities identified over half of the households as vulnerable. Participation rates were high in most constituencies, except Mpharane where only one village was located in the survey area; this constituency has been excluded from analysis. A full breakdown is provided in table 6.1. Taung Qhalasi Mohale's Hoek Mekaling Qaqatu Ketane All Areas Number of Households Surveyed 3,640 3,138 2,009 2,677 3, ,059 Number of Households Identified as Very Poor or Poor 1,741 1, ,458 1, ,651 Number of Households Interviewed 1, ,149 1, ,022 Show Rate 84% 68% 77% 79% 79% 80% 76% Table 6.1. District Survey Summary. 6.2 Wealth Ranking Across the surveyed constituencies in Mohale s Hoek, the very poor do not own assets, have no sources of income and are mostly unemployed. The poor appear to have unreliable sources of income such as casual labour. In Taung constituency, households with disabled members were ranked as very poor, while elderly-headed households were ranked as poor. In the constituency of Mohale s Hoek, households living with double orphans were ranked as poor. Moderate and better-off households were described as households that have productive assets and are thus able to engage in productive agriculture. They also have more reliable sources of income from employment and the sale of agricultural products. Better-off households have income security and are able to send their children to school, see table Cases for Mpharane have been included, although only one village was surveyed. 45
46 Very Poor Vulnerable Households Poor Moderate Better-Off Mohale's Hoek No fields. No livestock. No means of livelihood. Unemployed. Not enough food to eat. Casual labourers. Live with double orphans. No livestock. Pensioners. Casual labourers. Own few livestock. Own fields. Sell agricultural products. Earn monthly salary e.g. Miners. Own livestock. Own fields. Qhalasi Unemployed. Not enough food to eat. No livestock. Rely on gifts. Unemployed but own fields. No livestock. Engage in casual labour. No remittance. Have monthly income less than M1000. Own fields but no farm implements. Own few livestock. Own fields. Income exceeds M1,000. Employed. Own fields. Own livestock. Have means of livelihood. Taung Disabled. No fields. No livestock. Not enough food. Casual labourers. Elderly-headed. Own fields but no implements. Own few livestock. Have means of livelihood. Middle aged. Own fields but do not have seeds and fertilisers. Employed. Own livestock. Own fields and are able to produce. Qaqatu No fields. No livestock. Unemployed. Unemployed. No fields. No livestock. Casual labourers. Own few livestock. Own fields. Casual labourers. Earn monthly salary. Own fields. Own livestock. Able to send children to school. Mekaling No means of livelihood. Not enough food. Own fields but no implements. Casual labour. No livestock. Share- crop with poor households. Own fields. Own few livestock. Sell livestock. Have food. Able to plant and plough. Have means of livelihood/income. Able to send children to school. Own livestock. Help the poor. Mpharane No fields. No clothes. No livestock. Owns livestock. No farm implements. Own fields. Own few livestock. Unemployed. Cannot afford clothes for family members. Own fields. Own livestock. Formally employed. Ketane No livestock. No fields. Elderly-headed. No livestock. Have income from unreliable sources. Depend on other people for agricultural activities. Beer brewing. Casual labourers. Small businesses. Farmers. Have enough food. Table 6.2. Community Description of Wealth Groups, Mohale s Hoek. 6.3 Threat Analysis Communities presented a number of threats to their well-being. Drought seemed to be of primary concern in all constituencies surveyed. Increasing food prices were also noted 46
47 as a primary concern in Ketane, Taung, Qhalasi and Qaqatu constituencies. Poor soils are noted as major concern in Qhalasi and Mekaling constituencies. Other significant threats noted include the increasing numbers of orphaned children, high prevalence of TB and chronic illness in Mohale s Hoek and Ketane constituencies. In response to these threats, the communities proposed a number of different solutions. The majority of the solutions proposed in the constituencies are associated with the construction of important community infrastructures, such as water harvesting and supply, development of irrigation schemes, agricultural extension services and job-creation activities. Constituency Threats to Livelihood (Top Three Ranked) Mohale s Hoek 1. Drought 2. Increased number of orphans. 3. Chronic illness Qhalasi 1. Drought 2. Poor soils 3. Increasing food prices Taung 1. Drought 2. Increasing food prices 3. Poor availability of farm inputs Mekaling 1. Drought 2. Poor soils 3. Poor availability of farm inputs Qaqatu 1. Drought 2. Increasing numbers of orphans. 3. Increasing food prices Ketane 1. Drought/increasing food prices 2. TB 3. Chronic illness Proposed Solutions In Order of Importance 1. Construction of water tanks and pipes 2. Irrigation schemes 3. Dam construction 4. Income-generating projects Others: Clinic constructions Road constructions Tree planting Agriculture extension services 1. Provision of farm inputs and supervision 2. Dam construction for irrigation 3. Construction of water tanks Others: FFW activities-donga rehabilitation, development projects Clinic construction Food aid for orphans and vulnerable groups Job creation Road construction 1. Supply of farm inputs 2. Dam construction for irrigation 3. Road construction and maintenance Others Job creation Income generation activities Construction of water tanks FFW-development projects Tree planting-soil conservation Clinic construction 1. Food aid for OVCs and groups. 2. Dam construction 3. FFW development projects 4. Supply of farm inputs Others Road construction/maintenance Clinic construction 1. Job creation/income generating projects 2. Dam construction/irrigation schemes 3. Road construction Others: Supply of farm inputs FFW projects Promotion of share cropping Road construction Table 6.3. Problems and Solutions Presented by Communities, Mohale s Hoek. 47
48 Communities proposed that food-for-work and cash generation projects would be appropriate ways to address food security issues. Food assistance is proposed in some constituencies as an appropriate safety net to provide social support to orphaned and vulnerable children and other vulnerable groups. Full details are provided in table Depth of Hunger The depth of hunger in Mohale s Hoek is considerably higher than that experienced in the other districts covered by the survey. The average vulnerability score for all constituencies, with the exception of Qaqatu, lies within the immediately vulnerable category. Ketane and Mohale s Hoek registered an average score of 25 or more. Average scores for Taung, Qhalasi, and Mekaling are comparably high when compared to constituencies in other districts. 78% Ketane 0% 22% 55% Qaqatu 2% 43% 70% Mekaling 1% 29% Immediate Vulnerability Moderate Vulnerability 75% Secure Mohale's Hoek 1% 24% 73% Qhalasi 1% 27% 71% Taung 1% 28% Figure 6.1. Depth of Hunger, Mohale s Hoek. Over 68 percent of households in the district can be considered to be immediately vulnerable to hunger. This accounts for a total number of 3,433 households. Taung and Mekaling host the highest number of households affected by hunger. A further 27 percent of households in the seven constituencies can be considered to be moderately vulnerable to hunger. This accounts for some 1,546 households. A small proportion of the community-identified households are considered to be food secure. 48
49 6.5 Food Consumption and Stocks The vast majority of interviewed poor and very poor households do not keep any significant stocks of cereal or pulses. Almost 90 percent of households in Ketane and Mohale s Hoek keep none or less than one month s stock of maize. It is apparent, however, that in certain constituencies such as Mekaling and Qaqatu, a higher than normal proportion of households possess one to two month s worth of stock. Furthermore, in Qaqatu a significant proportion of the interviewed households have maize stock that is expected to last for three to six months. Given that the survey took place immediately after the harvest period, it was expected that a higher proportion of households across all constituencies would have staple foods in stock. This, however, is not the case. A full breakdown of the maize holding statistics is illustrated in figure 6.2. Ketane Qaqatu Mekaling Mohale's Hoek Less than One Month / No Stock One to Two Months Three to Six Months Until Next Harvest Qhalasi Taung 0% 10% 20% 30% 40% 50% 60% 70% 80% 90% 100% Figure 6.2. Maize Stock Holding, Mohale s Hoek. Using a one-day recall method, household heads were asked to provide information on the food consumption patterns of their household. When asked about the primary source of food, it is observed that a significant majority of poor and very poor households rely heavily on gifts. In Qhalasi, Mohale s Hoek, and Ketane, more than half of all households rely on gifts as a source. Own production and purchasing rank as the second most important source for all households in the district, accounting for one-quarter of households. In Qaqatu, 37 percent of household selected this category as their primary source of the food consumed. Food assistance accounts as the third most important source, for some 16 49
50 percent of households in the district. Casual labour accounts for 12 percent of households. One percent of households have no regular source of food. 6.6 Income and Asset Ownership Households in Mohale s Hoek appear to have a lower number of income sources than poor and very poor households in other districts. Some 32 percent of interviewed households have no source of income. The majority of households in the surveyed area have one income source, and only one percent of households have two income sources. No households have three or more sources of income. When examining those households that have one or more sources of income, the pattern is similar to that observed in other districts: Casual labour accounts as the most important source of income. A higher proportion of households in Qhalasi and Taung depend on this source, as compared to the other five constituencies. Beer brewing ranks as the second most important source of income. A small proportion of households receive income from either salaries or pensions. Remittances are a significant source. Agriculture, either through livestock or crop practices, does not appear to be an important income-earning strategy for poor or very poor households. There is a broad concurrence in the level of agricultural-asset ownership across the constituencies that were captured in the survey. Almost three-quarters of households across all constituencies do not own any agricultural assets or have access to land. A quarter of all households have one agricultural asset. A very small proportion of poor and very poor households own draught animals or mechanical power. 6.7 Characteristics of Vulnerable Groups Seventy-two percent of interviewed households in the district stated that they had a sick member in their home. Thirty-four percent of these persons were established to either be chronically or regularly ill. Ninety-one percent of these households were immediately vulnerable to hunger. A large number of all households host single or double-orphaned children. Of these, a significant proportion are considered by the community to be poor or very poor. A total number of 1,047 vulnerable households host single orphaned children, and 611 vulnerable households host double-orphaned children. The survey identified a total number of 1,353 single-orphans and 967 double-orphans in Mohale s Hoek. A large proportion of households are considered to have a high-burden of care, and host two or more orphaned children. This rate is considerably higher in Mohale s Hoek than in other districts. The average vulnerability score for these households is 27, which compares unfavourably with the district average. The constituencies of Mohale s Hoek and Ketane have a higher than average proportion of interviewed child-headed households. 50
51 Vulnerability Characteristics Households Hosting Single Orphans ,366 Vulnerable Households Hosting Single Orphans ,047 Households Hosting Double Orphans ,116 Vulnerable Households Hosting Double Orphans Total Number of Vulnerable Single Orphans ,353 Total Number of Vulnerable Double Orphans Taung Qhalasi Mohale's Hoek Mekaling Qaqatu Ketane All Areas Table 6.4. Numbers of Orphan-Hosting Households and Vulnerable Orphaned Children. Elderly-headed households form a significant proportion of those households participating in the survey. 51
52 Section VII: Quthing District Hunger Report 7.1 Introduction Five constituencies were surveyed in Quthing. A total of 7,997 households were identified as vulnerable by communities in the survey area. This represented 45 percent of the total number of households that were captured in the survey. In Tele, the poverty rate was significantly higher than the other four constituencies of the district. Sebapala and Mount Moorosi showed above average poverty rates also. Eighty-four percent of all households that were identified by the community as being very poor or poor participated in the Public Verification Exercise. A higher proportion of households participated in Tele and Mount Moorosi, with the lowest level of participation being observed in Moyeni constituency. A full breakdown is provided in table 7.1. Tele Moyeni Sebapala Mount Moorosi Qhoali All Areas Number of Households Surveyed 2,968 2,098 3,953 4,311 4,299 17,629 Number of Households Very/Poor Poor 1, ,847 1,924 1,638 7,997 Number of Households Interviewed 1, ,468 1,855 1,189 6,747 Show Rate 96% 67% 79% 96% 73% 84% Table 7.1. District Survey Summary. 7.2 Wealth Ranking Very poor households in Quthing district are described as those households without productive assets, in particular fields and livestock. The very poor in Sebapala and Moyeni constituencies were described as elderly-headed without remittances. Childheaded households in Mount Moorosi constituency, and the disabled and sick in Tele constituencies, are considered very poor. The poor have few assets and are unable to utilise their existing assets for productive purposes. For example, in Qhoali, Moyeni and Sebapala constituencies, the poor have land but do not have the draught power necessary to utilise it. The moderate and better-off have more assets and income. Thus, they are able to engage in productive agriculture. Better-off households have regular income from employment, small businesses and remittances. Full details are provided in Table 7.2. Very Poor Vulnerable Households Poor Moderate Better Off Sebapala Elderly with no remittance. Elderly with no one to help them. Have fields, but depend on other people for cultivation. Own fields. Mine workers. Own fields. Have livestock. 52
53 Very Poor Vulnerable Households Poor Moderate Better Off No fields. Own land but do not have farm inputs. Own livestock. Own livestock. No livestock. Unemployed. Work for other people. Formal salary. Tele Unemployed. Host orphans. Earn little income. Gets remittance. Disabled and the sick. Moyeni No assets. No land. No livestock. Have productive assets but unable to utilize them to earn a living. Own land and livestock. Are able to produce food. Unemployed. Elderly. Mount Moorosi No land and no livestock. No able-bodied person. Child-headed households. No land but few livestock. Own land and livestock but no farm inputs. Employed. Own small businesses e.g. shops. Unemployed. Qhoali No land. No livestock. Own land but are not able to produce due to lack of farm inputs. Own few livestock. Own fields and livestock. Employed. Table 7.2. Community Description of Wealth Groups, Quthing. 7.3 Threat Analysis Drought is cited as a major threat in Quthing district. This is followed in importance by increasing food prices in three out of the five constituencies, namely, Moyeni, Tele, and Qhoali constituencies. Poor availability of farm inputs is also of concern in almost all the constituencies except Qhoali. Communities proposed a number of solutions in response to these problems. The majority of the solutions presented by the communities are associated with either the development of physical or administrative infrastructure. Communities in all five constituencies proposed that the construction of clinics, roads, dams, and water and sanitation systems would assist in addressing the problems that hinder their development. Communities believe that agricultural extension services and the provision of readily available inputs would help to improve their self-sufficiency. 53
54 Constituency Moyeni Tele Sebapala Mount Moorosi Qhoali Threats to Livelihood (Top Three Rankings) 1. Drought 2. Increasing food prices 3. Poor availability of farm inputs 1. Drought 2. Increasing food prices 3. Poor availability of farm inputs 1. Drought 2. Poor soils & high numbers of orphans. 3. Poor availability of farm inputs 1. Drought 2. Poor availability of farm inputs 3. Poor soils 1. Drought 2. Increasing food prices 3. High numbers of orphans. Proposed Solutions - In Order of Importance 1. Construction of clinics 2. Construction of water tanks and pipes 3. Donation of farm inputs Others: Dam construction HIV/AIDS advocacy Orphanage establishment Secondary schools Public transport Price control mechanisms 1. Donation of farm inputs 2. Job creation/ffw projects 3. Improvement of health services/mobile clinics Others: Water tanks and pipes Dam construction/irrigation schemes Food aid, grants for orphans and orphanage Free education at high school level 1. Dam constructions 2. Irrigation schemes 3. Donation of farm inputs 4. Job creation/income generation projects Others: Food aid to vulnerable households Water tanks and pipes Agriculture cooperatives and extension Clinic construction Village policing 1. Donation of farm inputs 2. Irrigation schemes 3. Job creation Others: Road construction (maintenance) Clinic construction Soil conservation Agriculture- extension services 1. Construction of water tanks and pipes 2. Donation/subsidy of farm inputs (seeds and fertilizers) 3. Irrigation schemes Others: Dam construction Clinic construction HIV/AIDS advocacy Job creation Water supply extension services Village policing/police station Post office Table 7.3. Community Identified Problems and Solutions, Quthing. 7.4 Depth of Hunger Three-quarters of the interviewed households were considered to be immediately vulnerable to hunger. The constituency of Tele showed the highest proportion of households enduring hunger, with almost 67 percent of interviewed households proving immediately vulnerable. Sebapala and Mount Moorosi also showed above average rates of vulnerability to hunger. A total of 4,173 households were identified as vulnerable to hunger during the verification exercise. Thirty-seven percent of interviewed households 54
55 in the district were considered to be moderately at risk. A total of 2,516 households were identified as moderate in the district. Under one percent of the interviewed households were considered to be food secure. Figure 7.1 outlines the depth of hunger in Quthing. 55% Qhoali 1% 44% 63% Mount Moorosi 37% 1% Sebapala 1% 37% 62% Immediate Vulnerability Moderate Vulnerability Secure 58% Moyeni 1% 41% 67% Tele 1% 32% Figure 7.1. Depth of Hunger, Quthing. 7.5 Food Consumption and Stocks Poor and very poor households in Quthing appear to have more cereal and pulses in stock than in other districts. The overwhelming majority of households in the district, however, keep little or no stock. Looking specifically at maize holdings, it is observed that more than two-thirds of households have less than one month or no maize in stock. Households in Tele and Mount Moorosi have the least amount of stocks, with an above average number of households falling into this category. Almost a quarter of all households in the district have one to two months of stock, with households in Qhoali, Sebapala and Moyeni falling above the district average for this category. Almost five percent of households in the district keep three to six months of maize in stock. One percent of interviewed households have enough stock to last them until the next harvest, a similar trend across all districts. This overall trend of higher levels of stock keeping may be a result of the highly peripheral location of many of the villages in the districts and the ineffective market, as identified in the problem-identification session. Figure 7.2 details the maize stocks of the households participating in the survey. When examining the source of food consumed by interviewed households in Quthing, using the one-day recall method, a different trend was observed than those in other 55
56 districts. A lower proportion of households rely on own production or purchase as the primary source of the food that they consume. Qhoali Mount Moorosi Sebapala Less than One Month / No Stock One to Two Months Three to Six Months Until Next Harvest Moyeni Tele 0% 10% 20% 30% 40% 50% 60% 70% 80% 90% 100% Figure 7.2. Maize Stock Holding, Quthing. Twenty-six percent of households rely on own production or purchase category, with the highest levels found in Qhoali at 36 percent and the lowest levels in Tele at 18 percent. For over one-third of the poor and very poor households in Quthing, the receipt of gifts is a primary source. Mount Moorosi, Qhoali and Sebapala fall above the average for this category. Twenty percent of interviewed households in the district rely on casual employment as a source of food, with households in Mount Moorosi being most dependent on this strategy. The importance of food assistance varies considerably, with over a quarter of all households in Tele stating that assistance was their primary source of food consumed. Sebapala and Moyeni also register an above average number of households that rely on food assistance as a main source. The lowest levels of reliance on food assistance as a primary source of food consumed are found in Mount Moorosi and Qhoali. 56
57 7.6 Income and Asset Ownership The majority of interviewed households in Quthing have only one source of income. A significant proportion of households state that they do not have any source of income. A very small proportion of households in the district have two sources of income, representing just two percent of the overall population. None of the interviewed poor or very poor households in Quthing have three or more sources of income. The exercise found that: Casual Labour ranks as the most important income strategy for households in Quthing; 27 percent of households cite casual labour as an income source. There are observable variations between the five constituencies, with households in Mount Moorosi and Tele being most reliant on casual labour as a source of income. Beer brewing ranks as the second most important strategy for very poor and poor households in Quthing, with 19 percent of the households in the district engaging in this practice as a means to generate income. Qhoali has the highest proportion of beer brewers among its very poor and poor households. The receipt of a salary of pension ranks as the third most important strategy in the district, with 17 percent of households receiving an income through this means. Over 94 percent of those households receiving a formal salary or pension are elderly-headed. Further, in almost 62 percent of cases, the households fall into the category that earns less than 210 Maloti per month. It may be assumed that the in most cases the households receives the old-age pension. Agricultural practices provide a relatively small proportion of very poor and poor households with income. Only three percent of households in Quthing receive an income from the sale of crops. Livestock sales are of less significance for households in Quthing, with less than two percent of the very poor and poor households citing this strategy as a source of income. Remittances play an important role for some ten percent of households in Quthing, with households in Mount Moorosi, Tele and Moyeni more reliant on this strategy as a source of income than households in Sebapala and Qhoali. Most poor and very poor households in Quthing have little or no access to land or agricultural assets. There is, however, a significant degree of difference within the five constituencies in the district. Although the majority of households in Qhoali do not have access to either land or assets, some 29 percent of households have access to one major agricultural asset. Very few poor or very poor households in Qhoali have access to draught power and the implements necessary to utilise them. Poor and very poor households in Tele are the least likely to own agricultural implements or have access to land, with 87 percent of households falling into this category. A similar pattern is observable in Moyeni. 7.7 Characteristics of Vulnerable Groups Twenty-six percent of households interviewed stated that they had a chronically ill household member. Eighty-six percent of these households were considered to be immediately vulnerable to hunger. Chronic illness would appear to be a very strong targeting criteria. 57
58 Some 2,697 of all households were identified by the community as hosting single orphans, of which 1,568 households were vulnerable. A further 1,208 of all households were identified by the community as hosting double-orphans, of which 739 households were vulnerable. A total of 3,224 vulnerable single orphans and 1,340 vulnerable double orphans were identified by the community. A small proportion of households were considered to be child-headed, representing 1.2 percent of interviewed households. Over nine percent of interviewed households were considered to have a high burden-of-care, hosting two or more double orphaned children. On average, these households scored 26 in the vulnerability test, which is considerably higher that the average for vulnerable households for the district. Further details are provided in table 7.4. Vulnerability Characteristics Households Hosting Single Orphans ,697 Vulnerable Households Hosting Single Orphans ,568 Households Hosting Double Orphans ,208 Vulnerable Households Hosting Double Orphans Total Number of Vulnerable Single Orphans ,224 Total Number of Vulnerable Double Orphans ,340 Tele Moyeni Sebapala Mount Moorosi Qhoali All Areas Table 7.4. Numbers of Orphan-Hosting Households and Vulnerable Orphaned Children. Elderly-headed households account for a significant proportion of interviewed households, representing 48 percent of interviewed poor and very poor households in Quthing. A higher proportion of elderly-headed households were found in Moyeni, compared to a lower proportion in Tele. 58
59 Section VIII: Qacha s Nek District Hunger Report 8.1 Introduction Four constituencies were surveyed in Qacha s Nek. A total of 6,380 households were identified by the community as being poor or very poor during the community mapping exercise. Seventy percent of all households captured in the survey were considered by their communities to fall into these categories. A significant proportion of these households participated in the public verification exercise. Table 8.1 details the survey findings in Qacha s Nek. Qacha's Nek Lebakeng Tsoelike Hloahloeng All Areas Number of Households Surveyed 1,937 2,712 1,632 2,860 9,141 Number of Households Identified as Very Poor or Poor 1,326 2,337 1,148 1,569 6,380 Number of Households Interviewed 1,114 2,795 1, ,495 Show Rate 84 % 120 % 142 % 61 % 77 % Table 8.1. District Survey Summary. 8.2 Wealth Ranking The very poor are described as having no access to productive assets especially fields and livestock. They engage in severe coping strategies such as depending on others for help. The poor are seen to engage in some form of income generating activities although these are weak, such as brewing. Moderate and better-off groups were described as having more assets, sustainable access to food and sources of regular income. The better-off were also described as having ability to assist others and meet their basic needs. Full details are provided in table 8.2. Vulnerable Households Very Poor Poor Moderate Better-off Qacha s Nek They depend on others for help. Landless. No animals. Brew beer. Can work but have no means. Have fields and do not have farm inputs. Access food daily. Earn formal salary. Have animals and fields. Have means and are able to take care of the poor. Able to acquire necessary basic needs. Table 8.2. Community Description of Wealth Groups, Qacha s Nek. 59
60 8.3 Threat Analysis Communities in Qacha s Nek prioritised problems associated with agriculture as their primary concern. Environmental issues ranked second in importance for some constituencies and socio-economic problems were cited as second in importance for other districts. In Tsoelike, erratic rainfall and poor roads were considered to be the most serious. Full details are provided in table 8.3. Constituency Threats to Livelihood (Top Three Ranked) Proposed solutions In Order of Importance Hloahloeng 1. Stock theft 2. Drought 3. Hunger Qacha s Nek 1. Poor production 2. Poor roads 3. Stock theft Lebakeng 1. Poor production 2. Drought 3. Poor soils Tsoelike 1. Erratic rains 2. Poor roads 3. Poor production 4. Stock theft Qhoali 1. Drought 2. Increasing food prices 3. High numbers of orphaned children. 1. FFW- Dam constructions, furrows, water tanks. 2. Sharecropping initiatives 3. Income-generating activities Others: Community gardens for consumption and sale Subsidized fertilizers 1. FFW- Dam constructions, furrows, water tanks. 2. Sharecropping 3. Subsidized farming inputs Others: FFT farming methods Soil conservation 1. Dam constructions 2. Irrigation schemes 3. Subsidised farm inputs Others: Income-generating activities Community gardening Improvement of health services 1. Dam and tanks construction through FFW 2. Subsidised farm inputs 3. Village policing Others: Pasture management Community gardening Use of decomposed manure. 1. Construction of water tanks and pipes 2. Donation/subsidy of farm inputs (seeds and fertilizers) 3. Irrigation schemes Others: Dam construction Clinic construction HIV/AIDS advocacy Job creation Water supply extension services Village policing/police station Post office Table 8.3. Problems and Solutions Presented by Communities, Qacha s Nek. 8.4 Depth of Hunger Of those households that participated in the verification exercise, some 38 percent were considered to be immediately vulnerable to hunger. The proportion of households scoring vulnerable in Qacha s Nek constituency is higher than the proportion in the other constituencies in the district. A total of 2,480 households were verified as being immediately vulnerable to hunger. Almost 60 percent of households in the district were 60
61 considered to be moderate, with a smaller proportion of households testing moderate in the constituency of Qacha s Nek. A total of 3,870 households scored moderately vulnerable to hunger from the verification questionnaire. A further two percent of households were considered to be food secure. All constituencies PVE scores averaged below the vulnerable threshold of 24. A full breakdown is provided in figure % Hloahloeng 61% 2% 38% Tsoelike 60% 2% 36% Immediately Vulnerable Moderately Vulnerable Secure Labakeng 62% 2% 46% Qacha's Nek 52% 2% Figure 8.1. Depth of Hunger. Qacha s Nek. 8.5 Food Consumption and Stocks Households in Qacha s Nek district appeared to keep larger amounts of cereal and pulses in stock, when compared to other districts. Nevertheless, the overwhelming majority of households had little or no stock. Examining the level of maize stock keeping, 73 percent of households had none or less than a one month supply of maize in their home. Householders in Qacha s Nek constituency held less stocks than in the other constituencies. Some 22 percent of households in the district keep between one to two months of maize in stock, with the highest proportion being noted in Lebakeng. A further five percent of households keep three to six months of maize in stock, with a higher proportion of households in Lebakeng keeping such amounts. Less than one percent of households have enough maize in stock until the harvest period. A full breakdown is provided in figure 8.2. When asked to provide information on their food consumption patterns, using a one-day recall method, it is apparent that the majority of households in the district cite own production and purchase as their primary source of food consumed. Over 50 percent of 61
62 interviewed poor and very poor households in Lebakeng and Hloahloeng state that this is their primary source of food. Hloahloeng Tsoelike Less than One Month / No Stock One to Two Months Three to Six Months Until Next Harvest Lebakeng Qacha's Nek 0% 10% 20% 30% 40% 50% 60% 70% 80% 90% 100% Figure 8.2. Maize Stock Holding, Qacha s Nek. The receipt of food gifts is the second most important source of food stuffs, with 26 percent of households in the district relying on this strategy. The proportion of households depending on gifts is highest in Qacha s Nek and Tsoelike constituencies. Hloahloeng has the lowest proportion of households dependent on gifts. Casual employment ranks as the third most important source of foodstuffs for households in the district, however, in the Hloahloeng constituency it is the second most important source. Nine percent of households rely on food assistance as their primary source of food consumed, with the proportion being higher in Qacha s Nek and Tsoelike constituencies, and lowest in Hloahloeng. 8.6 Income and Asset Ownership Over ten percent of interviewed poor and very poor households are without any source of income. The highest proportion of such households are found in Qacha s Nek constituency and the lowest proportion are found in Hloahloeng constituency. The majority of households have just one source of income, with 82 percent of the total number of interviewed households falling into this category. Some seven percent of 62
63 households have two income sources. Less than one percent of households have three major sources. The exercise results show that: Casual labour is the largest income source for interviewed households in the district with some 37 percent of all households engaging in casual labour. Slightly higher levels are observed in Tsoelike and Hloahloeng constituencies. Beer brewing ranks as the second most important strategy for poor and very poor households, with 26 percent of all households in the district engaging in this activity. Households in Qacha s Nek are the least likely to engage in beer brewing. The receipt of a salary or pension is also important, with 19 percent of households receiving income this way. It should be noted, however, that 84 percent of these households are elderly-headed, which may imply that the majority of these householders are pension-receivers and not salary-earners. Agricultural-based income sources, through livestock or crop sales, appear to be more significant for poor and very poor households in Qacha s Nek than in the other districts covered by the survey. Some six percent of households receive income through crop sales and a further two percent through livestock sales. Remittances are of lower importance to poor and very poor households in Qacha s Nek, as only three percent of households are receiving cash remittances. Vulnerable households in Qacha s Nek have a higher level of agricultural asset ownership than those households captured in the other districts. Ownership levels appear to be lowest within Qacha s Nek constituency, with 65 percent of households not owning agricultural assets or land. Some 26 percent have access to land and one major asset. In Lebakeng, Tsoelike and Hloahloeng over 40 percent of households have access to agricultural assets, although most have only one major asset. 8.7 Characteristics of Vulnerable Groups Twenty-six percent of households hosted a chronically ill member. Of these households 75 percent can be considered to be immediately vulnerable to hunger. Chronic illness appears to be a strong indicator of vulnerability to hunger and poverty. A total of 3,175 poor single orphans and 1,013 poor double orphans were identified by the community. A full breakdown is provided in table 8.4. Over nine percent of interviewed households are considered to have a high burden-of-care, hosting two or more double orphaned children. On average, these households scored 26 in the vulnerability test, which is considerably higher than the average score for throughout the district. 63
64 Vulnerability Characteristics Households Hosting Single Orphans* Qacha's Nek Lebakeng Tsoelike Hloahloeng All Areas Not Available Vulnerable Households Hosting Single Orphans Households Hosting Double Orphans Vulnerable Households Hosting Double Orphans Total Number of Vulnerable Single Orphans 595 1, ,175 Total Number of Vulnerable Double Orphans ,013 Table 8.4. Numbers of Orphan-Hosting Households and Vulnerable Orphaned Children. The proportion of child-headed households was higher in Qacha s Nek constituency than in the other districts. Hloahloeng registered the lowest number of chid-headed households. Elderly-headed households accounted for almost 50 percent of all interviewed households, with the constituencies of Qacha s Nek and Tsoelike registering the highest proportion of households. 64
65 List of References Barrett, Food Aid Effectiveness: It s the targeting Stupid! Ithaca, Cornell. DMA, Food/Non-Food Aid Targeting Handbook. Maseru, DMA. DMA/WFP, Food Aid Targeting Guidelines. Maseru, DMA/WFP. FAO/WFP, Crop and Food Supply Assessment Mission. Rome, FAO/WFP. FAO/WFP, Crop and Food Supply Assessment Mission. Rome, FAO/WFP. Food Security Policy Team, Food and Nutrition Insecurity in Lesotho: Problems, Trends & Responses. DIAGNOSTIC REPORT Harvey and Lind, Dependency and Relief A Critical Analysis. London, Humanitarian Practitioners Group. LVAC, Lesotho Vulnerability Assessment Committee Annual Report, Maseru, LVAC. LVAC, Lesotho Vulnerability Assessment Committee Annual Report, Maseru, LVAC. ODI, Regional Issues for Food Security in Southern Africa. Forum for Food Security in Southern Africa, Outline Theme Paper. ODI, Maize, Mines or Manufacturing? Options for Reducing Hunger in Lesotho. Country Food Security Options, Paper Number 1. UN Millennium Project Task Force on Hunger, Halving Hunger, It Can Be Done. New York, UNDP. UNDP, Human Development Report New York, UNDP. UNHCR/WFP, Joint Assessment Guidelines. Geneva/Rome, UNCHR/WFP. WFP, Food Aid and Livelihoods in Emergencies Strategies for WFP. Executive Board Document. WFP, WFP Food Aid Targeting and Distribution Guidelines. Harare, WFP/ECHO. WFP, Community Household Surveillance, Round IV Report. Maseru, WFP. 65
66 WFP, Community Household Surveillance, Round V Report. Maseru, VAM. WFP, Emergency Food Security Assessment Handbook. Rome, WFP. World Bank Group, Problem Ranking. Washington, World Bank. World Bank, Social Analysis. Washington, World Bank. World Bank, Repositioning Nutrition as Central to Development. A Strategy for Large Scale Action. Washington, World Bank. World Food Summit,
67 Annex 1. Community Dialogue Schedule Steps 1. Introduce the team and the purpose of the visit. 2. Create a conducive environment to break the ice, before the start of the exercise. 3. Ask the participants to draw a map of the village on the ground that shows the major infrastructures such as schools and clinics. This is to enable them to locate individual households. Where are the major infrastructures located in the village (use big stones to locate them)? 4. Provide the participants with small cards to write the names of all households in the area and place them on the map in appropriate locations. 5. After placing the names in appropriate locations, number all the cards. 6. Ask a few people to copy the map to a flip chart and write the numbers of each card to replace the names. 7. Ask people to mark in red for example or using symbols (using makers) the households with chronically ill. 8. Ask them to mark in blue the households with single and double orphans. 9. Ask them to mark in green the households that benefited from food aid last month. 10. Ask the participants to provide characteristics of the wealth groups that exist in their villages. 11. On a flip chart or ground, draw a table that shows wealth groups and ask the participants to categorize the names of the households into appropriate wealth groups. 12. Take record of the total number of households in the village and of households by categories. 13. Produce the lists of the asset poor, households with chronically ill, orphans and those already benefiting from external support (only among the poor/very poor). 67

68 Annex 2. Vulnerable Household List 68
69 Annex 3. Public Verification Exercise Questionnaire Background A household vulnerability questionnaire was developed with the intention of identifying those households immediately vulnerable and moderately vulnerable to hunger, and hence poverty. The questionnaire was based on a vulnerability questionnaire that was in place since the beginning of PRRO in The questionnaire was reviewed by the Technical Working Group for the purposes of the Targeting Exercise. A new questionnaire was established and tested with populations in peri-urban Maseru and rural Mafeteng. The focus groups discussions enabled DMA-WFP to establish the vulnerability to hunger thresholds. The questionnaire is provided at the end of this annex. Two separate focus group discussions were conducted in Qoaling, peri-urban of Maseru and Sebelekoane, rural area of Mafeteng. The objective of the focus group discussion was to discuss the questions with community members and ensure that the tool reflected the reality of poverty and hunger. The first group was composed of 11 people from the following categories: support groups, the sick, elderly, double orphans, single orphans and vulnerable households. The second group was also comprised of these categories, although the number of participants was 40. Community health workers also participated in the exercise. The outcome of the discussions are presented below. The questionnaire has 15 questions. From question three onwards, each question is given a score, unless stated. The questions are asked in a multiple-choice format. Each option under each question is numbered with a score, indicating the level of vulnerability to food insecurity and hunger. The higher the score, the more probable the household is exposed to food insecurity. Following completion of the questionnaire, all the scores are summed. The total score is compared against the cut-off points to determine the group that the household falls under. The cut-off points to designate vulnerable, moderate and the not vulnerable categories (secure) are indicated at the end of the questionnaire. Households scoring 24 to 38 are considered immediately vulnerable to hunger and poverty. Households scoring 17 to 23 are considered moderately vulnerable to hunger and poverty. Households scoring 1 to 16 are considered secure. SECTION A: HOUSEHOLD COMPOSITION Questions 1 and 2: These questions ask basic geographical information such as the name of the district, constituency, DP, village, chief, name of target person, sex and age. These questions are not given scores. Question 3: Who is the household head? The community indicated that child-headed households are the most vulnerable because they cannot provide adequate care to family members and often have no sources of income. Elderly-headed households were ranked second because old people do not have opportunities for employment and are normally too old to produce food in the fields. The community stated that male-headed households are more vulnerable than femaleheaded households because the majority of men abandon their families. Children mentioned that their fathers are normally not in a position to provide them with adequate 69
70 care. When mothers are not around, sometimes fathers instruct older children to leave school and search for paying jobs. Men also indicated that sometimes when women are away, they scoop out maize meal or other food commodities (including food aid) to give their concubines, thus leaving family members with little or no food to eat. Both communities provided the same responses for this question. However, it was agreed that male and female headed households should be ranked the same since in many male-headed households, women (who are capable of providing enough care) are also present. Question 4: How many people live in this household, including yourself (please provide the names and their age groups? The number of household members is used to measure the dependency ratio of the household. Both groups stated that households with less than five people are regarded as small families, five people in a household is a moderate number, while more than five is a big number, making it difficult for some households to access adequate food for every member. The names of household members are required to minimise the number of households providing false household sizes with the intention of receiving more food aid. Question 5: How many double orphans or adopted children are there in this household? Both communities stated that double orphans fall under the most vulnerable group, as they often do not have proper care. It was recommended that the question should specify double orphans. This is because it becomes clear to the interviewer that there have been additional people to the household members. This may force the household to adjust its livelihood sources in order to feed the extra mouths. If the household is already poor, taking double orphans increases the burden to that family especially if there are two or more double orphans. This is confirmed by WFP s CHS. On the other hand, there are children, normally neglected, who are adopted especially by the elderly and are most in need. These children should also be considered since normally they live with vulnerable households and increase the burden. A household with single orphans is not necessarily at risk of food insecurity. If at least one parent is alive, the livelihoods sources do not normally change dramatically unless the other parent was a sole breadwinner. Question 6: Do you have a sick person/people in your household? Both communities stated that the chronically ill are the most vulnerable. This is because chronically illness compels households to spend money, previously spent on food and basic needs, on health expenditures. Households lose the time that was supposed to be spent on family labour or productive activities to care for the sick. The regularly ill are moderately affected while those who have been sick for less than three months are not considered vulnerable. 70
71 Question 7: Does the household have physically disabled person? Living with the physically disabled also put the household at risk. However, since the level of disability differs, it is important to investigate whether the disabled are able or not able to work. SECTION B: FOOD CONSUMPTION Question 8: How many meals did people in your family take yesterday? Both communities stated that for household members to eat properly, they have to eat three meals a day. However, they stated that in some instances some households (especially in rural areas) eat two meals a day because they eat heavy meals in the morning (e.g. papa, moroho and fermented porridge). Although some households eat two meals a day because they do not have enough food, eating two meals a day may not be a good indicator of shortage of food in the household as it is a tradition for some people. Households that eat one to two times a day show some level of vulnerability to food insecurity. There are households that do not eat anything for the whole day due to a lack of food. The communities indicated that the type of food eaten is a good indicator of food available in the household. Question 9: What food did you eat yesterday? Both communities reported that papa and vegetables make up a meal for most households. Households that consume beans and vegetables such as carrots, beetroot are considered to be better-off. Any protein foods such as meat, eggs, fish and milk are also better off. Poor households mainly eat papa and vegetables. In Qoaling, it was also mentioned that there are some households that spent days consuming green vegetables from their gardens with water alone because they did not have maize meal. Both groups felt that it is important for the food monitors to probe on the type of food the household eat because this is a good indicator of food available in the household. Question 10: What is the primary source of food your family ate yesterday? Both communities stated that households who obtain food either through own production or purchases or through a combination of both are not vulnerable. Households who obtain food through transfers indicate that they are food insecure. If households source food from gifts from relatives/neighbours and/or through food aid, they are food insecure and should be given the same score. This is because relatives and neighbours cannot afford to provide for these households on a long-time basis. Likewise, food aid from the government/ngos is also not considered to be sustainable. Question 11: How much cereal and pulses does the household have in stock? (No. and weight of bags). Both communities stated that households with stock that will last until the next harvest are not vulnerable. Those that have food stock that will last them for six months are also considered not vulnerable at the time of the interview even though what is in stock will not last them throughout the year. Those with food stock that will last them for less than 71
72 three months are vulnerable as they already indicate that they are food insecure and might start applying negative coping strategies. SECTION C: INCOME AND ASSET INFORMATION Question 12A: Indicate all your sources of income. Both communities indicated that employment opportunities have declined. In Qoaling, the community stated that non-agricultural casual labour is the common source of income for poor households. Because this is a peri-urban area, some people are employed in the garment factories while some have formal employment in the government and the private sector. However, there are households that are very poor and have no source of income at all. The elderly who earn pensions mentioned that this income is low because the standard of living is high in peri-urban areas. However, in Sebelekoane, the elderly stated that this pension contributed positively to their lives. However, the community of Sebelekoane reported that there are no piece jobs as many households in the area can not afford to provide casual labour. It is also important to assess the income level of households. Question 12B: How much income does the household get from the above sources? Question 12C: How often do you get income? Both communities reported that it is important to know the type of income sources so that the number of times the household get income is well analysed. Sometimes households regularly get some little money through the sale of firewood and other means, which do not meet household food needs. There is a need to probe for information on the income level of each household and the frequency of the income received. However, if the household receives income regularly, depending on the type of income source, it may also be vulnerable. A household that does not have income is considered to be more vulnerable than other households. Question 13: Which of the following assets do you have? Both communities stated that households that have land and draught animals, draught animals and ox drawn planter or ox-drawn cultivator or ox-cart are not vulnerable. Those with ox cart alone, draught animals alone, planter/cultivator alone may be in a position to rent them out and therefore are moderate. A household with a sickle and/or hand hoe is asset poor. Question 14: Do you own any of these assets? Households that own such items as a working television, vehicle, gas/electric cooker, cell phone and a working landline telephone are not considered vulnerable. The two groups indicated that even if the television is played with a car battery, there is no poor household that can prioritise to charge this battery if food is not available. Poor people do not even have friends who call them on the cell phones. Charging the phone and maintaining it shows that the household is not vulnerable. 72
73 Question 15: How much livestock do you currently have (cattle, sheep and goats)? Both groups stated that households with more than four head of cattle and those with more than ten head of sheep and goats are livestock rich, while households with two to four head of cattle and those with five to ten head of sheep and goats are livestock poor. Households that have less than two cattle or less than five sheep and goats are considered to be livestock poor. Summary The level of participation of both groups in the review of the questionnaire was good. The discussion was long but they were willing to provide information. They also indicated that the discussion was of great importance to them since it has improved their understanding of vulnerable households. A recommendation was made to hold pitsos to sensitise all communities about the importance of targeting the right beneficiaries of food aid. 73

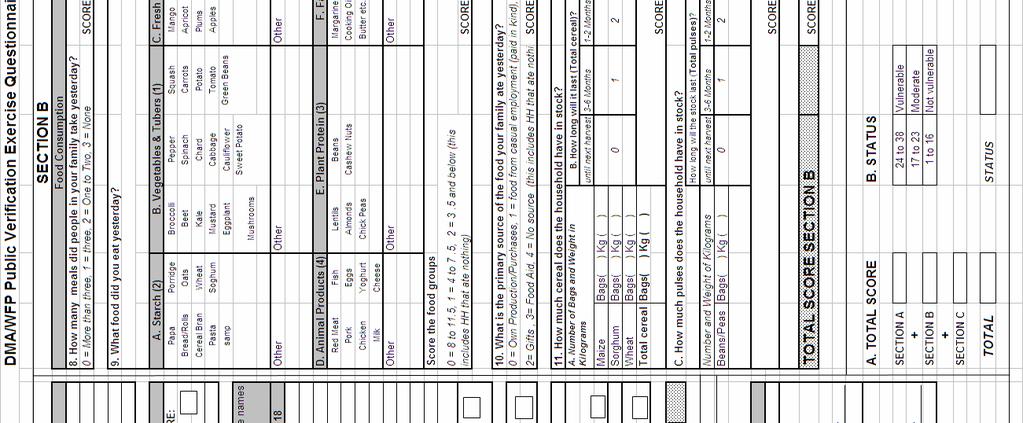

74 74
COMMUNITY AND HOUSEHOLD SURVEILLANCE (CHS) FINDINGS
 FINDINGS") Disaster Management Authority World Food Programme COMMUNITY AND HOUSEHOLD SURVEILLANCE (CHS) FINDINGS October/November 2008 (Round 11) Community & Household Surveillance Round Eight Findings Draft Report
Disaster Management Authority World Food Programme COMMUNITY AND HOUSEHOLD SURVEILLANCE (CHS) FINDINGS October/November 2008 (Round 11) Community & Household Surveillance Round Eight Findings Draft Report
Community and Household Surveillance System (CHS) Zimbabwe Round 1 October Food Security and Livelihood In-Depth Report Findings
 Zimbabwe Round 1 October Food Security and Livelihood In-Depth Report Findings") Community and Household Surveillance System (CHS) Zimbabwe Round 1 October 2003 Food Security and Livelihood In-Depth Report Findings Prepared by Clare Mbizule for C-SAFE and WFP May 2004 1 Table of contents
Community and Household Surveillance System (CHS) Zimbabwe Round 1 October 2003 Food Security and Livelihood In-Depth Report Findings Prepared by Clare Mbizule for C-SAFE and WFP May 2004 1 Table of contents
BUDGET INCREASE No. 5 TO ZIMBABWE PROTRACTED RELIEF AND RECOVERY OPERATION
 BUDGET INCREASE No. 5 TO ZIMBABWE PROTRACTED RELIEF AND RECOVERY OPERATION 200162 Assistance for Food Insecure Vulnerable Groups Start date: 1 January 2011 End date: 31 December 2012 Extension period:
E Distribution: GENERAL PROJECTS FOR EXECUTIVE BOARD APPROVAL. Agenda item 9
 Executive Board Second Regular Session Rome, 14 17 November 2011 PROJECTS FOR EXECUTIVE BOARD APPROVAL Agenda item 9 For approval BUDGET INCREASES TO PROTRACTED RELIEF AND RECOVERY OPERATIONS KENYA PRRO
Q&A THE MALAWI SOCIAL CASH TRANSFER PILOT
 Q&A THE MALAWI SOCIAL CASH TRANSFER PILOT 2> HOW DO YOU DEFINE SOCIAL PROTECTION? Social protection constitutes of policies and practices that protect and promote the livelihoods and welfare of the poorest
Food Security Outcome Monitoring
 SAVING LIVES CHANGING LIVES Photo Credits: WFP / Edward Johnson Security Outcome Monitoring WFP Lebanon July 2018 Highlights This report covers the outcome results for July 2018. The World Programme (WFP)
Overview of PADR process
 SECTION 3 Overview of PADR process PADR is a methodology for use at community level. It involves active engagement, with the community, in a process to explore the risks they face and the factors contributing
E Distribution: GENERAL. Executive Board Second Regular Session. Rome, October September 2007 ORIGINAL: ENGLISH
 Executive Board Second Regular Session Rome, 22 26 October 2007! E Distribution: GENERAL 11 September 2007 ORIGINAL: ENGLISH Cost (United States dollars) Current budget Increase Revised budget WFP food
WFP Yemen Crisis Response Pre-assistance Baseline Survey
 World Food Programme: Fighting Hunger Worldwide WFP Yemen Crisis Response Pre-assistance Baseline Survey Highlights This baseline survey was conducted in June 2015 in seven governorates (Aden, Al Hudaydah,
Management response to the recommendations deriving from the evaluation of the Mali country portfolio ( )
") Executive Board Second regular session Rome, 26 29 November 2018 Distribution: General Date: 23 October 2018 Original: English Agenda item 7 WFP/EB.2/2018/7-C/Add.1 Evaluation reports For consideration
Executive Board Second regular session Rome, 26 29 November 2018 Distribution: General Date: 23 October 2018 Original: English Agenda item 7 WFP/EB.2/2018/7-C/Add.1 Evaluation reports For consideration
STEP 7. Before starting Step 7, you will have
 STEP 7 Gap analysis Handing out mosquito nets in Bubulo village, Uganda Photo credit: Geoff Sayer/Oxfam Step 7 completes the gap-analysis strand. It should produce a final estimate of the total shortfall
Quarter 1: Post Distribution Monitoring Report. January - March 2017 HIGHLIGHTS. 2. Methodology
 Quarter 1: Post Distribution Monitoring Report January - March 2017 HIGHLIGHTS In December 2016, off camp assistance increased to 100 TL per person; in January 2017, off camp assistance switched from s
Emergency Cash-based Interventions in Urban Areas: Tropical Storm Washi in the Philippines
 gfsc Good Practice Case Study ACF in the Philippines Emergency Cash-based Interventions in Urban Areas: Tropical Storm Washi in the Philippines Background to the project/programme Tropical Storm Washi
PROJECT BUDGET REVISION FOR APPROVAL BY THE REGIONAL DIRECTOR
 PROJECT BUDGET REVISION FOR APPROVAL BY THE REGIONAL DIRECTOR 5) To: Initials In Date Out Date Reason for Delay David Kaatrud, Regional Director 4) Through: Initials In Date Out Date Reason for Delay Peter
E Distribution: GENERAL. Executive Board First Regular Session. Rome, 9 11 February January 2009 ORIGINAL: ENGLISH
 Executive Board First Regular Session Rome, 9 11 February 2009 E Distribution: GENERAL 15 January 2009 ORIGINAL: ENGLISH This document is printed in a limited number of copies. Executive Board documents
Seminar on Strengthening Social Protection Systems in Namibia
 Seminar on Strengthening Social Protection Systems in Namibia PRESENTATION OVERVIEW 1. Social Support Model in Malawi 2. Objectives of the Policy/Programme 3. Interventions 4. Challenges 5. Reforms to
Fighting Hunger Worldwide. Emergency Social Safety Net. Post-Distribution Monitoring Report Round 1. ESSN Post-Distribution Monitoring Round 1 ( )
") Emergency Social Safety Net Post-Distribution Monitoring Report Round 1 ESSN Post-Distribution Monitoring Round 1 ( ) Table of Contents 1. Introduction 3 2. Approach, methodology and Data 3 2.1. Method
Emergency Social Safety Net Post-Distribution Monitoring Report Round 1 ESSN Post-Distribution Monitoring Round 1 ( ) Table of Contents 1. Introduction 3 2. Approach, methodology and Data 3 2.1. Method
Tracking Government Investments for Nutrition at Country Level Patrizia Fracassi, Clara Picanyol, 03 rd July 2014
 Tracking Government Investments for Nutrition at Country Level Patrizia Fracassi, Clara Picanyol, 03 rd July 2014 1. Introduction Having reliable data is essential to policy makers to prioritise, to plan,
25. Country profile: Lesotho
 25. Country profile: Lesotho 1. Development profile Lesotho is a small enclave of South Africa with a population of about 2 millions. The country was ruled by Leabua Jonathan from independence in 1966
The CASH+ approach in the Sahel
 The CASH+ approach in the Sahel as a tool to reinforce RESILIENCE Mali // Mauritania MauritaniA Nejiha, a CASH+ beneficiary, at her market stall FAO/Sonia Nguyen 2 The CASH+ approach in the Sahel MALI
The Ghana LEAP program: results from the impact evaluation
 The Ghana LEAP program: results from the impact evaluation Benjamin Davis FAO, PtoP and Transfer Project Robert Osei ISSER Scoping Conference The Links between Social Inclusion and Sustainable Growth in
Cash Transfers in Lesotho:
 Cash Transfers in Lesotho: An evaluation of World Vision s Cash and Food Transfers Pilot Project Stephen Devereux 1 Michael Mhlanga 2 July 2008 1 2 Centre for Social Protection, Institute of Development
BUSINESS-BASED SOLUTIONS IN HUMANITARIAN CRISES: LESSONS FROM ZIMBABWE
 BUSINESS-BASED SOLUTIONS IN HUMANITARIAN CRISES: LESSONS FROM ZIMBABWE Credit: Cynthia R Matonhodze 2017/CARE EXECUTIVE SUMMARY / In response to heightened food insecurity in Zimbabwe, Crown Agents and
E Distribution: GENERAL PROJECTS FOR EXECUTIVE BOARD APPROVAL. Agenda item 9
 Executive Board Second Regular Session Rome, 8 11 November 2010 PROJECTS FOR EXECUTIVE BOARD APPROVAL Agenda item 9 For approval E Distribution: GENERAL WFP/EB.2/2010/9-D 19 October 2010 ORIGINAL: ENGLISH
International Workshop on Sustainable Development Goals (SDG) Indicators Beijing, China June 2018
 Indicators Beijing, China June 2018") International Workshop on Sustainable Development Goals (SDG) Beijing, China 26-28 June 2018 CASE STUDIES AND COUNTRY EXAMPLES: USING HOUSEHOLD SURVEY DATA FOR SDG MONITORING IN MALAYSIA NORISAN MOHD ASPAR
International Workshop on Sustainable Development Goals (SDG) Beijing, China 26-28 June 2018 CASE STUDIES AND COUNTRY EXAMPLES: USING HOUSEHOLD SURVEY DATA FOR SDG MONITORING IN MALAYSIA NORISAN MOHD ASPAR
Presented by Samuel O Ochieng MGCSD KENYA CT- OVC MIS AND POSSIBLE USES TO IMPROVE THE COORDINATION OF SOCIAL PROTECTION PROGRAMMES
 Presented by Samuel O Ochieng MGCSD KENYA Policy dialogue expert workshop and south to south learning event Brasília, Brazil 3-5 December 2012 CT- OVC MIS AND POSSIBLE USES TO IMPROVE THE COORDINATION
Hawala cash transfers for food assistance and livelihood protection
 Afghanistan Hawala cash transfers for food assistance and livelihood protection EUROPEAN COMMISSION Humanitarian Aid and Civil Protection In response to repeated flooding, ACF implemented a cash-based
BUDGET INCREASE TO EMERGENCY OPERATION BANGLADESH
 BUDGET INCREASE TO EMERGENCY OPERATION BANGLADESH 10715.0 Food Assistance to Cyclone-Affected Populations in Southern Bangladesh Cost (United States dollars) 1 Present budget Increase Revised budget Food
Post-Distribution Monitoring Report. WFP Kyrgyzstan
 121/1 Shopokova street Red Centre, Office 516,518 Bishkek, Kyrgyzstan T: +996 (312) 306 106 F: +996 (312)306 105 www.wfp.org Post-Distribution Monitoring Report WFP Kyrgyzstan May-July 2009 Conducted by
MEASURING HOUSEHOLD STRESS
 OXFAM PUBLICATION APRIL 208 A working Afghan child herding animal for livelihood in Pulecharkhi, Kabul, November 207. Photo: Joel van Houdt, Oxfam. MEASURING HOUSEHOLD STRESS Introducing the multi-sector
Evaluating the Mchinji Social Cash Transfer Pilot
 Evaluating the Mchinji Social Cash Transfer Pilot Dr. Candace Miller Center for International Health and Development Boston University & Maxton Tsoka Centre for Social Research University of Malawi Benefits
Protec on Risk Analysis
 Protec on Risk Analysis Associated with food distribu on North Waziristan Agency IDPs response October, 2014 This document has been produced and released by the Vulnerability Analysis and Mapping (VAM)
Fighting Hunger Worldwide
 WFP LEBANON FOOD SECURITY OUTCOME MONITORING ROUND 7: AUGUST Fighting Hunger Worldwide Highlights WFP assisted 665,996 displaced Syrians in August, of which 20 percent were female-headed and 65 percent
GEORGIA: DROUGHT. The context. appeal no. 31/00 situation report no. 1 period covered: November January 2001.
 GEORGIA: DROUGHT 7 February 21 appeal no. 31/ situation report no. 1 period covered: November 2 - January 21 The drought in Georgia compounds an already dire economic situation in the country. While the
CASE STUDY. Targeting vulnerable households for humanitarian cash transfers
 CARE Programmes Targeting vulnerable households for humanitarian cash transfers Using a community-based, participatory approach to target the most vulnerable in Zimbabwe s cash-first response CASE STUDY
9. Country profile: Central African Republic
 9. Country profile: Central African Republic 1. Development profile Despite its ample supply of natural resources including gold, diamonds, timber, uranium and fertile soil economic development in the
Summary of main findings
 IMPACT ASSESSMENT REPORT NUSAF2 - Northern Uganda Social Action Fund 12-13 Project in Moroto Municipality and Nadunget Sub-County Karamoja, Uganda Summary of main findings There is a reduction from % to
The Price of Eating Well in Durham Region
 The Price of Eating Well in Durham Region 2017 According to Durham Region Health Department data, some families in Durham Region cannot afford a healthy diet. Let s take a closer look to see why Rising
TERMS OF REFERENCE EXTERNAL EVALUATION OF UNICEF S CASH TRANSFER PROJECT IN NIGER SEPTEMBER 2010
 TERMS OF REFERENCE EXTERNAL EVALUATION OF UNICEF S CASH TRANSFER PROJECT IN NIGER SEPTEMBER 2010 I. Background Following poor crops in 2009-2010 in Niger, the vulnerability survey conducted in April 2010
Characteristics of Eligible Households at Baseline
 Malawi Social Cash Transfer Programme Impact Evaluation: Introduction The Government of Malawi s (GoM s) Social Cash Transfer Programme (SCTP) is an unconditional cash transfer programme targeted to ultra-poor,
All social security systems are income transfer
 Scope of social security coverage around the world: Context and overview 2 All social security systems are income transfer schemes that are fuelled by income generated by national economies, mainly by
Unit of the Ministry of health and sanitation
 1. Introduction 2. Activities Undertaken by Food and nutrition Unit of the Ministry of health and sanitation 3. Government and Donor Funding to the Food and Nutrition Unit 4. Allocation of Funds by Government
Ageing and Vulnerability: Evidence-based social protection options for reducing vulnerability amongst older persons
 Ageing and Vulnerability: Evidence-based social protection options for reducing vulnerability amongst older persons Key questions: in what ways are older persons more vulnerable to a range of hazards than
MAIN FINDINGS OF THE DECENT WORK COUNTRY PROFILE ZAMBIA. 31 January 2013 Launch of the Decent Work Country Profile
 MAIN FINDINGS OF THE DECENT WORK COUNTRY PROFILE ZAMBIA Griffin Nyirongo Griffin Nyirongo 31 January 2013 Launch of the Decent Work Country Profile OUTLINE 1. Introduction What is decent work and DW Profile
April Humanitarian Aid
 Zimbabwe Emergency Cash Transfer (ZECT) Pilot Programme Monitoring Consolidated Report, November 2009 to March 2010 Elena Ruiz Román April 2010 Humanitarian Aid Contents List of Acronyms 3 Executive Summary
Monitoring & Evaluation Quarterly
 YEMEN CO M&E REPORT ISSUE 07: APRIL- JUNE 2017 Monitoring & Evaluation Quarterly Yemen EMOP Highlights Photo: WFP/Fares Khoailed In Q2 2017, an average of 4.9 million beneficiaries per month received general
By Mr J.Handina, Ms A.Ncube &Mr A.J.Jordaan
 An analysis of the efficacy of cash transfers in addressing food insecurity for Mutare urban communities of Zimbabwe By Mr J.Handina, Ms A.Ncube &Mr A.J.Jordaan University of Free State Disaster management
Fiscal Year 2018/19. Lesotho National Budget Brief
 Lesotho National Budget Brief Fiscal Year 2018/19 This budget brief is one of four briefs that explore the extent to which the national budget of the Kingdom of Lesotho addresses the needs of children
E Distribution: GENERAL PROJECTS FOR EXECUTIVE BOARD APPROVAL. Agenda item 9
 Executive Board Second Regular Session Rome, 12 14 November 2012 PROJECTS FOR EXECUTIVE BOARD APPROVAL Agenda item 9 For approval BUDGET INCREASES TO DEVELOPMENT ACTIVITIES ARMENIA DEVELOPMENT PROJECT
LESOTHO SOCIAL ASSISTANCE BUDGET BRIEF 1 NOVEMBER 2017
 Photography: UNICEF Lesotho/2017/Schermbrucker LESOTHO SOCIAL ASSISTANCE BUDGET BRIEF 1 NOVEMBER 2017 This budget brief is one of four that explores the extent to which the national budget addresses the
ECHO-funded WFP programme in Serbia
 FINAL REPORT ECHO-funded WFP programme in Serbia August 19-23, 2002 QUEST-Consult Wim Klaassen, Teamleader and Logistics Aart van der Heide, Nutrition This report has been produced and financed by at the
FOOD SECURITY IN NEVADA
 Difficult economic conditions in Nevada have led to an increase in the number of households that are food insecure, meaning that they do not have access at all times to enough food for an active, healthy
Household s Vulnerability to Shocks in Zambia
 Public Disclosure Authorized Public Disclosure Authorized Public Disclosure Authorized Public Disclosure Authorized SP DISCUSSION PAPER NO. 0536 Household s Vulnerability to Shocks in Zambia Carlo del
PROJECT REVISION FOR THE APPROVAL OF: Deputy Executive Director and Chief Operating Officer
 HAITI DEVELOPMENT PROJET 200150 B/R No.: 3 Support for the National School Meals Programme PROJECT REVISION FOR THE APPROVAL OF: Deputy Executive Director and Chief Operating Officer Initials In Date Out
Direct Response to Emergency Cash Transfer Project (DiRECT) A Synthesis of Learning
 A Synthesis of Learning") Direct Response to Emergency Cash Transfer Project (DiRECT) A Synthesis of Learning The Direct Response to Emergency Cash Transfer project (DiRECT) modelled an emergency response to household food insecurity
Direct Response to Emergency Cash Transfer Project (DiRECT) A Synthesis of Learning The Direct Response to Emergency Cash Transfer project (DiRECT) modelled an emergency response to household food insecurity
Scaling Up Nutrition Kenya Country Experience
 KENYA Ministry of Health Scaling Up Nutrition Kenya Country Experience Terry Wefwafwa, Division of Nutrition, Ministry of Health Structure of presentation 1.Background Information 2.Status of SUN in Kenya
Life saving integrated food security and livelihoods support for IDPs and vulnerable host communities affected by conflict and drought in Ayod County.
 HSSD19-FSC-153004-1 Life saving integrated food security and livelihoods support for IDPs and vulnerable host communities affected by conflict and drought in Ayod County. Last updated by Justus Vundi on
Appendix 2 Basic Check List
 Below is a basic checklist of most of the representative indicators used for understanding the conditions and degree of poverty in a country. The concept of poverty and the approaches towards poverty vary
Somalia Common Humanitarian Fund Standard Allocation Document 2015
 Somalia Common Humanitarian Fund Standard Allocation Document 2015 First standard allocation 2015 This document outlines the strategic objectives of the Somalia Common Humanitarian Fund (CHF) first standard
Content. 05 May Memorandum. Ministry of Health and Social Affairs Sweden. Strategic Social Reporting 2015 Sweden
 Memorandum 05 May 2015 Ministry of Health and Social Affairs Sweden Strategic Social Reporting 2015 Sweden Content 1. Introduction... 2 2. Delivering on the Europe 2020 objective to combat poverty and
Risk in Zimbabwe: a study of local exposure to risk in Masvingo province: implications for risk management. Philip Buckle
 Risk in Zimbabwe: a study of local exposure to risk in Masvingo province: implications for risk management Philip Buckle Risk Hierarchy: Terry Cannon EQ Severe flood Tropical Land Flood slidecyclones Fire
IMPROVING PUBLIC FINANCING FOR NUTRITION SECTOR IN TANZANIA
 INN VEX UNITED REPUBLIC OF TANZANIA MINISTRY OF FINANCE IMPROVING PUBLIC FINANCING FOR NUTRITION SECTOR IN TANZANIA Policy Brief APRIL 2014 1 Introduction and background Malnutrition in Tanzania remains
UGANDA S EXPERIENCE ON SOCIAL PROTECTION &POVERTY
 UGANDA S EXPERIENCE ON SOCIAL PROTECTION &POVERTY Presentation at the Bi-regional conference on Social Protection and Poverty Reduction By Stephen Kasaija, Assistant Commissioner Planning, MINISTRY OF
UNICEF Unconditional Cash Transfer Program
 Protecting Children from Poverty and Disasters in East Asia and the Pacific. A Symposium on Linkages between Social Protection and Disaster Risk. 22-23 May 2014 in Bangkok, Thailand UNICEF Unconditional
TANAUAN CITY: Utilizing CBMS as a Tool for Strategic Planning and Resource Allocation
 TANAUAN CITY: Utilizing CBMS as a Tool for Strategic Planning and Resource Allocation Presenter: HON. ANTONIO C. HALILI City Mayor, City Government of Tanauan Tanauan City Brief Profile Tanauan is a second
Welcome to the presentation on
 Welcome to the presentation on Poverty Reduction strategy in Bangladesh : Estimating and Monitoring of Poverty Mu. Mizanur Rahman Khandaker Deputy Director National Accounting Wing Bangladesh Bureau of
Prime Age Adult Mortality and Household Livelihood in Rural Mozambique: Preliminary Results and Implications for HIV/AIDS Mitigation Efforts
 Prime Age Adult Mortality and Household Livelihood in Rural Mozambique: Preliminary Results and Implications for HIV/AIDS Mitigation Efforts Annex Tables: Results from TIA 2002 Ministry of Agriculture
Executive Summary. The CACFP and Tiering
 Executive Summary The introduction of tiered reimbursement rates in the Child and Adult Care Food Program (CACFP) concentrated program benefits more intensely on low-income children, as intended. Tiering
Targeting the Ultra Poor in Ghana. Abhijit Banerjee December 9, 2015
 Targeting the Ultra Poor in Ghana Abhijit Banerjee December 9, 2015 1 Why Evaluate? What is the impact of the Graduation model on the ultra poor? Impact evaluation measures: How have the lives of clients
Community & Household Surveillance CARE ZIMBABWE. Baseline Survey August Report of Findings
 CARE ZIMBABWE Community & Household Surveillance Baseline Survey August 2003 Report of Findings Preface The World Food Programme (WFP) and the Consortium for Southern Africa Food Emergency (C-SAFE) regionally
COUNTRY STRATEGIC PLAN REVISION FOR APPROVAL BY THE EXECUTIVE DIRECTOR
 COUNTRY STRATEGIC PLAN REVISION FOR APPROVAL BY THE EXECUTIVE DIRECTOR Revision of Strategic Outcome Addition of Strategic Outcome Revision of Strategic Outcome Emergency Revision of Strategic Outcome
POST DISTRIBUTION MONITORING
 POST DISTRIBUTION MONITORING West Nile Region, October 2017 PDM in West Nile Region October 2017 INTRODUCTION This PDM survey helps WFP to assess beneficiaries access to, use of, and satisfaction with
The Food Stamp Program A Secret History of the First Targeted Benefit in Mongolia. W. Walker SP Training - Pattaya
 The Food Stamp Program A Secret History of the First Targeted Benefit in Mongolia W. Walker SP Training - Pattaya A complicated story How successive crises: natural and man-made, A strong desire to protect
Fighting Hunger Worldwide. Emergency response to conflictaffected people in Eastern Ukraine. Monitoring and Evaluation Report
 Fighting Hunger Worldwide Emergency response to conflictaffected people in Eastern Ukraine Monitoring and Evaluation Report January - June 2016 Executive Summary This monitoring and evaluation report covers
TRANSITIONAL INTERIM COUNTRY STRATEGIC PLAN REVISION FOR APPROVAL BY THE COUNTRY DIRECTOR
 TRANSITIONAL INTERIM COUNTRY STRATEGIC PLAN REVISION FOR APPROVAL BY THE COUNTRY DIRECTOR Swaziland Transitional Interim Country Plan Revision Two 5) To: Initials In Date Out Date Reason for Delay Country
Emergency Social Safety Net (ESSN) Programme. Vulnerability Profiling Analysis Results
 Programme. Vulnerability Profiling Analysis Results") Emergency Social Safety Net (ESSN) Programme Vulnerability Profiling 2018 - Analysis Results Contents BACKGROUND & METHODOLOGY... 1 Classifying Vulnerability Criteria... 3 Productive Capacity Criteria...
Emergency Social Safety Net (ESSN) Programme Vulnerability Profiling 2018 - Analysis Results Contents BACKGROUND & METHODOLOGY... 1 Classifying Vulnerability Criteria... 3 Productive Capacity Criteria...
Terms of Reference (ToR) Business Potential survey in Doti District
 Business Potential survey in Doti District") Terms of Reference (ToR) Business Potential survey in Doti District 1. Background Good Neighbors International (GNI) is an international humanitarian and development NGO in general consultative status
Terms of Reference (ToR) Business Potential survey in Doti District 1. Background Good Neighbors International (GNI) is an international humanitarian and development NGO in general consultative status
BOTSWANA MULTI-TOPIC HOUSEHOLD SURVEY POVERTY STATS BRIEF
 BOTSWANA MULTI-TOPIC HOUSEHOLD SURVEY Private Bag 0024, Gaborone. Tel: 3671300 Fax: 3952201 Toll Free: 0800 600 200 E-mail: info@statsbots.org.bw Website: http://www.statsbots.org.bw Preface This Stats
Minimum Wage Review Public Consultation January 2008
 Presentation to the Parliamentary Secretary to the Minister of Human Resources, Labour and Employment MHA Keith Hutchings Department of Human Resources, Labour and Employment Government of Newfoundland
El Niño and Household Debts in Amhara National Regional State, Ethiopia
 Agriculture Knowledge, Learning, Documentation and Policy (AKLDP) Project Field Notes June 2016 El Niño and Household Debts in Amhara National Regional State, Ethiopia Introduction In Ethiopia in 2015
UNITED REPUBLIC OF TANZANIA NATIONAL AGEING POLICY
 UNITED REPUBLIC OF TANZANIA NATIONAL AGEING POLICY MINISTRY OF LABOUR, YOUTH DEVELOPMENT AND SPORTS September, 2003 TABLE OF CONTENTS CHAPTER ONE PAGE 1. INTRODUCTION. 1 1.1 Concept and meaning of old
Policy Implementation for Enhancing Community. Resilience in Malawi
 Volume 10 Issue 1 May 2014 Status of Policy Implementation for Enhancing Community Resilience in Malawi Policy Brief ECRP and DISCOVER Disclaimer This policy brief has been financed by United Kingdom (UK)
Commissioner General Of Samurdhi Ministry of Economic Development Si Sri Lanka
 Chandra Wickramasinghe Commissioner General Of Samurdhi Ministry of Economic Development Si Sri Lanka Country Profile The Democratic Socialist Republic of Sri Lanka A Picturesque Tropical Island in South
CBMS Network Evan Due, IDRC Singapore
 Community Based Monitoring System CBMS Network Evan Due, IDRC Singapore Outline of Presentation What is CBMS Rationale for Development of CBMS Key Features of CBMS Case Presentation: CBMS in the Philippines
Cost of the Nutritious Food Basket - Toronto 2008
 STAFF REPORT ACTION REQUIRED Cost of the Nutritious Food Basket - Toronto 2008 Date: October 7, 2008 To: From: Wards: Board of Health Medical Officer of Health All Reference Number: SUMMARY This report
The Proposal Guide: How to Prepare a Proposal for Support Through Canadian Foodgrains Bank
 The Proposal Guide: How to Prepare a Proposal for Support Through Canadian Foodgrains Bank Last Revised: November 30, 2004 TABLE OF CONTENTS WELCOME... 1 WHO WE ARE: AN INTRODUCTION TO CANADIAN FOODGRAINS
S. Hashemi and W. Umaira (2010), New pathways for the poorest: the graduation model from BRAC, BRAC Development Institute, Dhaka.
, New pathways for the poorest: the graduation model from BRAC, BRAC Development Institute, Dhaka.") 1 Introduction Since 211 Concern Worldwide-Rwanda, in partnership with a local partner, Services au Développement des Associations (SDA-IRIBA) and with financial support from Irish Aid, have implemented
1 Introduction Since 211 Concern Worldwide-Rwanda, in partnership with a local partner, Services au Développement des Associations (SDA-IRIBA) and with financial support from Irish Aid, have implemented
CORPORATE RESULTS FRAMEWORK ( )
") CORPORATE RESULTS FRAMEWORK (2017 2021) Informal Consultation 523 September 2016 World Food Programme Introduction 1. WFP is committed to attaining the highest standards of accountability. This means optimizing
CORPORATE RESULTS FRAMEWORK (2017 2021) Informal Consultation 523 September 2016 World Food Programme Introduction 1. WFP is committed to attaining the highest standards of accountability. This means optimizing
El Niño and Indebtedness in Ethiopia Impacts of drought on household debts in Tigray National Regional State
 Agriculture Knowledge, Learning, Documentation and Policy (AKLDP) Project Field Notes June 2016 El Niño and Indebtedness in Ethiopia Impacts of drought on household debts in Tigray National Regional State
Fighting Hunger Worldwide
 WFP LEBANON FOOD SECURITY OUTCOME MONITORING ROUND 6: APRIL 2017 Fighting Hunger Worldwide Highlights WFP assisted 673,038 displaced Syrians in April 2017, of which 23 percent were female-headed and 66
Good Practices in Anti-Poverty Family- Focused Policies and Programmes in Africa: Examples and Lessons Learnt
 Good Practices in Anti-Poverty Family- Focused Policies and Programmes in Africa: Examples and Lessons Learnt Zitha Mokomane, Human Sciences Research Council of South Africa Social science that makes a
Social Security a federal program that taxes workers to provide income support to the elderly
 Social Security a federal program that taxes workers to provide income support to the elderly Full Benefits Age The age at which a social security recipient receives full retirement benefits (primary insurance
41% of Palauan women are engaged in paid employment
 Palau 2013/2014 HIES Gender profile Executive Summary 34% 18% 56% of Palauan households have a female household head is the average regular cash pay gap for Palauan women in professional jobs of internet
Montana State Planning Grant A Big Sky Opportunity to Expand Health Insurance Coverage. Interim Report
 Montana State Planning Grant A Big Sky Opportunity to Expand Health Insurance Coverage Interim Report Submitted to Health Resources and Services Administration (HRSA) U.S. Department of Health and Human
Vulnerability to Poverty and Risk Management of Rural Farm Household in Northeastern of Thailand
 2011 International Conference on Financial Management and Economics IPEDR vol.11 (2011) (2011) IACSIT Press, Singapore Vulnerability to Poverty and Risk Management of Rural Farm Household in Northeastern
Palu, Indonesia. Local progress report on the implementation of the Hyogo Framework for Action ( )
") Palu, Indonesia Local progress report on the implementation of the Hyogo Framework for Action (2013-2014) Name of focal point: Yusniar Nurdin Organization: BNPB Title/Position: Technical Support Consultant
Palu, Indonesia Local progress report on the implementation of the Hyogo Framework for Action (2013-2014) Name of focal point: Yusniar Nurdin Organization: BNPB Title/Position: Technical Support Consultant
Providing Social Protection and Livelihood Support During Post Earthquake Recovery 1
 Providing Social Protection and Livelihood Support During Post Earthquake Recovery 1 A Introduction 1. Providing basic income and employment support is an essential component of the government efforts
Measuring Resilience at USAID. Tiffany M. Griffin, PhD
 Measuring Resilience at USAID Tiffany M. Griffin, PhD TOPS Knowledge Sharing Meeting Washington DC July 10, 2014 Defining and Conceptualizing Resilience USAID defines resilience as: The ability of people,
BACKGROUND PAPER ON COUNTRY STRATEGIC PLANS
 BACKGROUND PAPER ON COUNTRY STRATEGIC PLANS Informal Consultation 7 December 2015 World Food Programme Rome, Italy PURPOSE 1. This update of the country strategic planning approach summarizes the process
Contributing family workers and poverty. Shebo Nalishebo
 Contributing family workers and poverty Shebo Nalishebo January 2013 Zambia Institute for Policy Analysis & Research 2013 Zambia Institute for Policy Analysis & Research (ZIPAR) CSO Annex Building Cnr