2018 General Rate Case
|
|
|
- Jonas Garrison
- 5 years ago
- Views:
Transcription
 2018 General Rate Case Update Testimony Before the Public Utilities Commission of the State of California Rosemead, California December 8, 2017")
1 Application No.: Exhibit No.: Witnesses: A SCE-59 B. Anderson D. Bernaudo T. Cameron M. Childs D. Gunn T. Guntrip G. Henry C. Jacobs D. Kempf S. Menon D. Tessler (U 338-E) 2018 General Rate Case Update Testimony Before the Public Utilities Commission of the State of California Rosemead, California December 8, 2017
2 SCE-59: Update Testimony Table Of Contents Section Page Witness I. INTRODUCTION AND SUMMARY OF UPDATED REVENUE REQUIREMENT REQUEST...1 S. Menon II. RESULTS OF OPERATIONS...6 D. Tessler III. ESCALATION RATE CHANGES...10 T. Cameron A. Escalation Rates Based On The IHS Global Insight Power Planner Projection...10 B. Palo Verde Non-labor Escalation...14 C. Updating Escalation Rates For SCE s Post-Test Year Ratemaking Mechanism...14 IV. RECOVERY OF THE DECEMBER 31, 2017 BALANCES IN THE RRIMA, SOBA, AND THE EDRPMA...15 A. Summary...15 B. Recovery of the Residential Rate Implementation Costs in the Residential Rate Implementation Memorandum Account (RRIMA) Background Recorded Costs and Forecast Update...16 a) O&M Expenses...18 (1) TOU Pilots...18 b) Non-TOU Pilots...21 (1) Marketing, Education and Outreach (ME&O)...21 (2) Other Capital-Related Revenue Requirement Reasonableness of RRIMA Recorded O&M and Capital...23 B. Anderson -i-
3 SCE-59: Update Testimony Table Of Contents (Continued) Section Page Witness 5. Proposal to Modify the RRIMA Preliminary Statement to Seek Recovery of 2018, 2019, and 2020 Year-End Costs in Annual ERRA Review Proceeding...23 C. Recovery of Edison SmartConnect Opt-Out Costs in the SmartConnect Opt-Out Balancing Account (SOBA)...24 D. Bernaudo 1. Background Recorded Costs and Forecast Update Revenue from Opt-Out Fees O&M Expense Capital Expenditures Reasonableness of SOBA Recorded O&M and Capital Elimination of the SOBA...26 D. Recovery of the Energy Data Request Program Costs in the Energy Data Request Program Memorandum Account (EDRPMA)...27 B. Anderson 1. Background Recorded Costs and Forecast Update Reasonableness of EDRPMA Recorded O&M Proposal to Eliminate EDRPMA...28 V. POSTAGE EXPENSE FERC US POSTAL RATE INCREASE...30 D. Kempf VI. PENSION and PBOP UPDATED FORECASTS PLUS ACCOUNTING CHANGE...32 A. Background...32 B. Updated Pension Forecast...33 C. Updated PBOP Forecast...34 G. Henry -ii-
4 SCE-59: Update Testimony Table Of Contents (Continued) Section Page Witness D. Changes in Accounting Standards for Pensions and PBOP...35 VII. VIII. TRANSPORTATION SERVICES OPERATING COSTS FUEL TAX AND VEHICLE LICENSE FEE INCREASES...36 ACCOUNTING CHANGE FOR JOINT POLE ORGANIZATION REQUEST...38 A. Joint Pole Organization Overview of the Joint Pole Organization Accounting Background Study of Joint Pole Activities SCE s Revised Proposal for JPO Test Year...40 T. Guntrip C. Jacobs IX. STREET LIGHT SALES...41 D. Gunn X. CHANGES IN TAX ACCOUNTING METHODS...42 M. Childs XI. OLD-AGE, SURVIVORS, AND DISABILITY INSURANCE (OASDI) TAX...44 XII. ADDED FACILITIES RATES...45 D. Tessler Appendix A Witness Qualifications Appendix B Attachments for Chapter II Appendix C Attachments for Chapter III Appendix D Attachments for Chapter IV Appendix E Attachments for Chapter VI Appendix F Attachments for Chapter VII Appendix G Attachments for Chapter VIII Appendix H Attachments for Chapter XI Appendix I Attachments for Chapter XII -iii-
5 1 2 I. INTRODUCTION AND SUMMARY OF UPDATED REVENUE REQUIREMENT REQUEST In this exhibit, Southern California Edison Company (SCE) respectfully presents its testimony for the update phase of our Test Year 2018 General Rate Case. 1 The Commission s Rate Case Plan 2 outlines the criteria for update testimony: A. Known changes in cost of labor based on contract negotiations completed or known changes that result from updated data using the same indices used in the original presentation during the hearing. B. Changes in non-labor escalation factors based on the same indices the party used in its original presentation during hearings. C. Known changes due to governmental action such as changes in tax rates, postage rates, or assessed valuation. Table I-1 below summarizes the revenue requirement impact of the updates we have identified and supported in this testimony. The table is followed by a brief description of each line item. In addition, this exhibit includes updates related to the recovery of the December 31, 2017 balances in the Residential Rate Implementation Memorandum Account (RRIMA), the SmartConnect Opt-Out Balancing Account (SOBA), and the Energy Data Request Program Memorandum Account (EDRPMA). This exhibit also provides updated Added Facilities rates to incorporate the impact of the 2018 Cost of Capital Decision (D.) In addition, this exhibit also updates SCE s Pension and Benefits forecast for the period, sales of streetlighting assets, and some internal changes in accounting that have been identified since we originally filed our Application in September, 2016, so that the revenue requirement request reflects these known changes. SCE s GRC update filing reduces the 2018 Revenue Requirement by $186 million compared to our prior request. With this update, we are requesting an increase of only $33 million, an amount that is just 0.6% above 2017 authorized base revenues. The key drivers of this reduction are changes in Cost of Capital, Pensions and other Post Retirement Benefits, accounting methods, and escalation rates. Other increases and decreases make up the balance of the reduced revenue requirement. A complete list of changes included in this testimony is provided below. 1 As discussed at the last day of evidentiary hearings. See Evid. Hearing Transcript, Vol. 21, p (hearing date August 2, 2017). 2 See, e.g., D
6 Table I-1 Southern California Edison Company Change in GRC Revenue Requirement (Thousands of Dollars) CPUC Rebuttal Revenue Requirement 5,859,260 6,339,298 6,895, Update for Joint Comparison Joint Comparison Revenue Requirement 5,859,263 6,339,338 6,895, Update Changes 5. Joint Comparison Exhibit Errata (238) (207) (406) 6. Customer Deposits Concession 3,900 4,477 5, RO Model Updates (423) Escalation Rates (15,001) (14,888) (8,982) 9. Postage Rates Pension Forecast (17,667) (19,319) (21,457) 11. PBOP Forecast (13,840) (16,226) (19,130) 12. Pension/PBOP Accounting Change (39,015) (36,785) (33,699) 13. TSD Forecast JPO Accounting Change (9,724) (10,087) (9,614) 15. Street Light Sales (6,923) (4,629) (4,531) 16. Cost of Capital (80,717) (85,685) (93,539) 17. OASDI Tax Limits (436) (681) (781) 18. STIP Accounting Change Update (6,211) (6,129) (6,203) 19. Total Revenue Requirement Changes (185,950) (189,497) (192,305) 20. Update Revenue Requirement 5,673,313 6,149,841 6,703, Line 1: Line 2: Line 3: Line 5: provides SCE s revenue requirement request reflected in SCE Rebuttal Exhibit SCE- 25, Vol. 01, submitted on June 16, 2017; provides revenue requirement changes made in preparing the Joint Comparison Exhibit SCE-29; provides SCE s revenue requirement request reflected in the Joint Comparison Exhibit SCE-29, submitted on July 10, 2017; provides the revenue requirement change related to SCE s errata to the Joint Comparison Exhibit. This errata was designated Exhibit SCE-29A and submitted on September 6, 2017; 2
7 Line 6: provides the revenue requirement change related to accepting the Office of Ratepayer Advocates (ORA s) calculation method for customer deposits; 3 Line 7 provides the revenue requirement change for updates to the RO model that have been made consistent with SCE s request supported in testimony (e.g., Shareholder Assigned Cost update as described in Advice 3702-E filed on November 20, 2017); Line 8: provides the revenue requirement change related to updated capital escalation rates and O&M labor and non-labor escalation rates, as supported in Chapter III of this Update testimony; Line 9: provides the revenue requirement change related to an increase in postage rates, as supported in Chapter V of this Update testimony; Lines 10-11: provides the revenue requirement change related to decreases in SCE s Pension and Post-Employment Benefits Other Than Pensions (PBOPs) based on updated actuarial studies. This change is supported in Chapter VI of this Update testimony; Line 12: provides the revenue requirement change related to a Pension and PBOP accounting change, as supported in Chapter VI of this Update testimony; Line 13: provides the revenue requirement change related to a Transportation Services Division (TSD) vehicle law change, as supported in Chapter VII of this Update testimony; Line 14: provides the revenue requirement change related to a Joint Pole Organization (JPO) accounting change, as supported in Chapter VIII of this Update testimony; Line 15: provides the revenue requirement change related to the removal from rate base of streetlight assets that have been included in a section 851 application or advice letter that has received Commission approval, and that have completely (or will soon) transfer in terms of ownership and responsibility from SCE to the purchasing entity. This change is supported in Chapter IX of this Update testimony; Line 16: provides the revenue requirement decrease to reflect the new 2018 cost of capital, as adopted in D This decision revised SCE s currently authorized Return on Equity from 10.45% to 10.30% and reset the authorized costs of long-term debt and preferred stock beginning in Test Year As described and supported in Advice 3 Please refer to SCE-25, Volume 2, p. 26 and SCE-29A, p
8 Line 17: Line 18: Line 20: 3665-E filed on September 29, 2017, SCE s currently authorized Return on Rate Base (RORB) of 7.90% is reduced to 7.61% as a result of D This RORB reduction is effective January 1, 2018; provides the revenue requirement decrease related to Old-Age, Survivors, and Disability Insurance (OASDI) Tax limitations included in the 2017 OASDI Trustees Report. This decrease is supported in Chapter XI of this Update testimony; As discussed in SCE-24, Volume 2, page 21, SCE updated the proposed capitalization rate for the expenses related to the Short Term Incentive Plan (STIP) from the A&G capitalization rate to the P&B capitalization rate. SCE has implemented this change in Our intent in the rebuttal was to update our revenue requirement request for the years through the 2018 GRC, and make the 2017 adjustment through the currently authorized Results Sharing Memorandum Account (RSMA), since this funding for 2017 is already authorized through the 2015 GRC. While updating the RO Model for the rebuttal testimony SCE submitted on June 16, 2017, SCE inadvertently adjusted the STIP capitalization rate from the A&G capitalization rate to the P&B capitalization rate for years instead of The correction SCE proposes in this Update testimony reverses the STIP capitalization rate for , and has the RO model reflect the STIP capitalization at the P&B capitalization rate for only. provides SCE s updated revenue requirement request in this Update testimony as a result of the changes shown on Lines This exhibit is organized as follows: Chapter II sets forth SCE s requested 2018 GRC Results of Operations, as well as the Post-Test year Results of Operations for 2019 and Chapter III provides SCE s update testimony regarding the calculation of escalation rates used to project O&M and capital expenses for the years 2016 through Chapter IV provides testimony addressing the recovery of the December 31, 2017 balances in the RRIMA, SOBA, and the EDRPMA. Chapter V describes the changes resulting from an increase in postal rates. 4
9 Chapter VI addresses updated pensions and PBOPS forecast, including a related accounting change. Chapter VII describes the changes resulting from an increase in fuel taxes and vehicle license fees. Chapter VIII address a request for an accounting change in the Joint Pole Organization. Chapter IX describes the removal from rate base of streetlight assets that have been included in an 851 application or advice letter that has received Commission approval. Chapter X discusses a change in Tax Accounting Method included in SCE s 2016 tax return that expands the definition of capitalized software costs. SCE proposes that any recorded-to-forecast differences related to deductible capitalized software be recorded in the Tax Accounting Memorandum Account (TAMA). Chapter XI describes the changes resulting from updated OASDI Tax limitations included in the 2017 OASDI Trustees Report; Chapter XII provides SCE s update to its 2018 Added Facilities rates to reflect the new 2018 Cost of Capital. 5
10 II. RESULTS OF OPERATIONS This chapter presents our revised 2018 Test Year Results of Operations (RO) based on the updated information presented in Chapters III through XII. We respectfully request that the Commission adopt a 2018 revenue requirement of $5.673 billion. Table II-2 presents our revised Results of Operations for Test Year 2018 and Post-Test Years 2019 and Please refer to Appendix B for additional information. 6
11 Table II-2 Revised Results of Operations At Proposed Rates Commission Jurisdictional (Thousands of Dollars) GRC CPUC Line Item Total Operating Revenues 5,673,313 6,149,841 6,703, Operating Expenses: 3. Production 4. Steam 7,845 7,845 7, Nuclear 76,747 76,747 76, Hydro 41,446 41,446 41, Other 81,965 81,965 81, Total Production O&M 208, , , Transmission 91,118 91,118 91, Distribution 532, , , Customer Accounts 159, , , Uncollectibles 12,254 13,284 14, Customer Service & Information 21,007 21,007 21, Administrative & General 647, , , Franchise Requirements 51,877 56,234 61, Revenue Credits (164,722) (171,246) (182,285) 17. Total O&M 1,558,819 1,554,547 1,548, Escalation 103, , , Depreciation 1,752,338 1,872,039 2,048, Taxes Other Than On Income 21. Property Taxes 258, , , Payroll Taxes & Misc 66,350 68,453 70, Taxes Based On Income 187, , , Total Taxes 512, , , Total Operating Expenses 3,927,773 4,244,880 4,635, Net Operating Revenue 1,745,539 1,904,961 2,067, Rate Base 22,939,852 25,034,971 27,177, Rate Of Return 7.61% 7.61% 7.61% 7
12 The revenue change attributable to this proceeding is $117 million as identified in Table II-3 (line 18). 5 This revenue change takes into account a $33 million increase in Authorized Base Revenue Requirement (ABRR), a $43 million increase to account for a decline in 2018 forecast GWh sales, and a $42 million increase related to the recovery of the December 31, 2017 balances in five balancing and memorandum accounts. 6 Table II-3 also identifies the requested ABRR and CPUC-jurisdictional baserelated revenue changes estimated for Post-Test Years 2019 and As stated in SCE s rebuttal testimony, SCE-25, Volume 1, page 4, footnote 2, SCE revised the 2018 Present Revenue Requirement (Line 2) to reflect the 2017 Post-Test Year Revenue Requirement filed in Advice E. 6 In Chapter IV of this Update testimony, SCE updates and supports the year-end 2017 balances in the RRIMA, SOBA, and the EDRPMA. The Bark Beetle CEMA increase of $10.7 million (including FF&U) is for the period , and therefore no update is required. In addition, there has been no activity in the RSDMA since 2015, and accordingly an update is not necessary. The December 31, 2017 balances in these five accounts will be updated to reflect interest at the time of transfer. 8
13 Table II , 2019 and 2020 Revenue Changes Resulting From the 2018 Test Year and 2019 and 2020 PTYR GRC Request - Commission Jurisdictional (Thousands of Dollars) Cumulative SCE-9 Vol. 1 Reference 1. Proposed GRC Base Revenue Requirement 5,673,313 6,149,841 6,703,445 Update Testimony Table II-1 2. Es imated Present (Prior Year) Revenue Requirement 5,640,432 5,673,313 6,149,841 For 2018, AL 3514-E 3. GRC ABRR Change 32, , , Less: GRC Revenue Grow h GWhs GRC PRR 84,253 5,309,377 Table VI GRC PRR 83,572 5,266,462 Table VI GRC PRR 83,572 5,266,462 Table VI GRC PRR 83,470 5,260,034 Table VI GRC PRR 83,470 5,260,034 Table VI GRC PRR 82,567 5,203,130 Table VI GRC Revenue Grow h (42,915) (6,428) (56,904) 12. Residential Rate OIR Implementation MA 18,854 (18,854) Update Testimony CH IV, plus FF&U 13. SmartConnect Opt Out BA 11,457 (11,457) Update Testimony CH IV, plus FF&U Bark Beetle CEMA 10,675 (10,675) SCE-12, Table VI-3 + FF&U 15. Residential Service Disconnec ion MA 27 (27) Table IV-16 plus FF&U 16. Energy Data Request Program MA 458 (458) Update Testimony CH IV, plus FF&U 17. Subtotal - Balancing/Memo Account Recovery 41,471 (41,471) GRC Revenue Change (Line 3 - Line 11 + Line 17) 117, , ,508 1,169, Percent GRC Revenue Change 2.08% 7.78% 9.93% 19.79% 20. Total System PRR 11,417,570 11,393,715 11,277,777 Table VI GRC Revenue Change , ,266 Line 18 (2018) 22. GRC Revenue Change ,485 Line 18 (2019) 23. Total System PRR with GRC Revenue Changes 11,417,570 11,510,981 11,836,528 Line 20 + Line 21 + Line Percent Total Revenue Change 1.03% 3.84% 5.16% 10.02% Line 18 / Line
14 III. ESCALATION RATE CHANGES This chapter provides SCE s update testimony regarding the calculation of escalation rates used to project capital and O&M expenses (including Palo Verde) for the years 2016 through The escalation rates shown for 2019 and 2020 are revised projections of the escalation rates that will be used in SCE s proposed Post-Test Year ratemaking mechanism for 2019 and 2020, assuming SCE s escalation rates are adopted by the Commission. All indexes are set using 2015 as a base year (i.e, the 2015 index = 1.0). A. Escalation Rates Based On The IHS Global Insight Power Planner Projection The updated escalation rates include changes described in our application. The updated O&M labor, O&M non-labor, and capital escalation rates presented below in Table III-4, Table III-5, and Table III-6, respectively, are based on the IHS Global Insight Power Planner projection for the third quarter of Labor escalation rates also incorporate wage increases for all of SCE s employees through 2016 and wage increases for SCE s represented employees based upon ratified collective bargaining agreements, through Please refer to Appendix C for additional information. 10
15 Table III-4 O&M Labor Price Indexes And Escalation Rates Based Upon Average Hourly Earnings, Collective Bargaining Agreements, and IHS Global Insight Power Planner 2017 Third Quarter Projection; 2015=1.0 Line No Year Inflation Index Deflation Index %_Change Inflation Index Deflation Index %_Change Inflation Index Deflation Index %_Change % % % % % % % % % % % % % % % Line No Year Inflation Index Deflation Index %_Change Inflation Index Deflation Index %_Change Inflation Index Deflation Index %_Change % % % % % % % % % % % % % % % Line No Year Inflation Index Deflation Index %_Change Inflation Index Deflation Index %_Change Inflation Index Deflation Index %_Change % % % % % % % % % % % % % % % Line No Year Inflation Index Steam Generation Nuclear Generation Hydro Generation Other Generation Transmission Distribution Customer Accounts CS&I Sales A&G Deflation Index %_Change % % % % % 11
16 Table III-5 O&M Non-labor Price Indexes And Escalation Rates (Based Upon IHS Global Insight Power Planner 2017 Third Quarter Projection; 2015=1.0 Line No Year Inflation Index Deflation Index %_Change Inflation Index Deflation Index %_Change Inflation Index Deflation Index %_Change % % % % % % % % % % % % % % % Line No Year Inflation Index Deflation Index %_Change Inflation Index Deflation Index %_Change Inflation Index Deflation Index %_Change % % % % % % % % % % % % % % % Line No Year Inflation Index Steam Generation Hydro Generation Other Generation Transmission Distribution Customer Accounts A&G@H Deflation Index %_Change Inflation Index CS&I Deflation Index %_Change % % % % % % % % % % 12
17 Table III-6 Capital Price Indexes And Escalation Rates (Based Upon IHS Global Insight Power Planner 2017 Third Quarter Projection; 2015=1.0) Line No Year Inflation Index Deflation Index %_Change Inflation Index Deflation Index %_Change Inflation Index Deflation Index %_Change % % % % % % % % % % % % % % % % % % Line No Year Inflation Index Deflation Index %_Change Inflation Index Deflation Index %_Change Inflation Index Deflation Index %_Change % % % % % % % % % % % % % % % % % Line No Year Inflation Index Steam Generation Hydro Generation Other Generation Transmission Distribution Meters Installed Nuclear Palo Verde Deflation Index %_Change Inflation Index Nuclear SONGS Deflation Index %_Change Inflation Index General Plant Deflation Index %_Change % % % % % % % % % % % % % % % % % % Blended Capital Update Escalation Line Inflation Deflation Year %_Change No Index Index % % % % % % 13
18 B. Palo Verde Non-labor Escalation Table III-7 presents updated non-labor escalation rates for the Palo Verde nuclear generating station. As explained in SCE s direct testimony on escalation, these non-labor escalation rates are based on a weighted average of labor and non-labor escalation rates. 8 Table III-7 Palo Verde Escalation Line No Year Inflation Index C. Updating Escalation Rates For SCE s Post-Test Year Ratemaking Mechanism These labor and non-labor escalation rates will be updated in late 2018 and late 2019 to provide escalation factors for the 2019 and 2020 Post-Test Year advice letters, as specified in SCE s proposed Post- Test Year ratemaking mechanism. Currently, our unions have reached agreement through If the unions reach a collective bargaining agreement for 2020 before the GRC Phase 1 proposed decision is issued, the collective bargaining agreements will be incorporated into the labor escalation calculations for represented employees in the 2020 Post-Test Year. The remaining portion of the capital, labor and non-labor escalation rates will be updated to reflect the latest available IHS Global Insight Power Planner projections available at the time of the updates Deflation Index %_Change % % % % % 8 Please refer to SCE-09, Volume 1C, p. 83, lines through p. 84, line 2. 14
19 IV. RECOVERY OF THE DECEMBER 31, 2017 BALANCES IN THE RRIMA, SOBA, AND THE EDRPMA A. Summary In addition to SCE s updated 2018 Test Year revenue requirement request, SCE also requests recovery of the amounts recorded in the Residential Rate Implementation Memorandum Account (RRIMA), the SmartConnect Opt-Out Balancing Account (SOBA), and the Energy Data Request Program Memorandum Account (EDRPMA) as of December 31, In this update testimony, SCE provides and supports the updated year-end 2017 RRIMA, SOBA and EDRPMA balances based on recorded amounts through October 31, 2017, and forecast November through December 2017 amounts. Actual RRIMA, SOBA and EDRPMA December 31, 2017 balances will be provided in the advice letter implementing the 2018 GRC decision. B. Recovery of the Residential Rate Implementation Costs in the Residential Rate Implementation Memorandum Account (RRIMA) In this section, SCE updates its testimony to include recorded costs and support for RRIMA activity from July 2016 through October 2017, and forecast costs for November through December Background In July 2015, the Commission issued D , which adopts an optional two-tier residential rate structure, establishes a timeline to reform tiered residential electric rates during the years 2015 through 2020, and authorizes the future transition of residential customers to time-of-use (TOU) rates. RRIMA was established to track the verifiable incremental costs associated with: (1) TOU pilots, (2) TOU studies, including hiring of a consultant or consultants to assist in developing study parameters, (3) marketing, education and outreach (ME&O) costs associated with the rate changes approved in this decision, and (4) other reasonable expenditures. D also directs that SCE provide the RRIMA 9 Exhibit SCE-09, Volume 1, pages provides recorded costs and support for operating expenses that SCE incurred from inception in October 2015 through June
20 costs for review in its next GRC (i.e., the 2018 GRC) and to show that the expenses are incremental, verifiable, and reasonable. 2. Recorded Costs and Forecast Update SCE s forecast for RRIMA costs from October 2015 through December 2017 was $ million for O&M and no capital expenditures. 10 ORA s review of the RRIMA from October 2015 through June 2016 found the account to be appropriate, correctly stated, and in compliance with applicable Commission decisions. 11 Based on actual recorded amounts from July 2016 through October 2017, an estimate of November and December 2017 costs, and interest, SCE is decreasing its RRIMA forecast by $6.480 million to $ million. This comprises an O&M decrease of $7.378 million ($ $ million), offset by an addition of $0.739 million in capital-related revenue requirement, and the addition of interest in the amount of $159,000. As mentioned previously, SCE will provide the final RRIMA recorded balance with actual amounts for November and December 2017 in the advice letter implementing the 2018 GRC decision. Table IV-8 below summarizes the recorded revenue requirement from inception, October 2015, through October 2017 and provides an estimate for November through December 2017 for the operational expenses and the capital-related revenue requirement. 10 Please refer to Exhibit SCE-09, Volume 1, p Please refer to Exhibit ORA-22, pp
21 Table IV-8 Residential Rate Implementation Memorandum Account October December 2017 (Nominal $000) Line No. Description October June 2016 Recorded* July October 2017 Recorded Estimated November - December 2017 Revised Total 1. Beginning Balance - 3,679 16, Adjustments Adjusted Beginning Balance - 3,679 16, Operating Expenses 5. - TOU Pilot 6. ME&O 1,859 2, , TOU Studies , Other 140 1, , Non TOU Pilot 10. ME&O 1,299 6, , Other , Total Operating Expenses 3,677 11,743 2,323 17, Capital-Related Revenue Requirement Depreciation Property Taxes Income Taxes Return Total-Capital-Related Revenue Requirement (Over)/Under Collection 3,677 12,346 2,459 18, Interest Ending Balance 3,679 16,148 18,641 18, The O&M decrease of $7.378 million compared to the forecast included in direct testimony is primarily due to lower: (1) labor expenses, (2) ME&O costs, and (3) incentive payouts. SCE recorded lower than expected incremental labor costs in its call center and billing operations to support TOU pilot and non-tou pilot activities. SCE s ME&O cost projections are also less than forecast, as marketing activities were revised in response to feedback from the Investor Owned Utilities and Commission directives. For example, the ALJ ruling filed on September 5, 2017, directed SCE to 17
22 suspend sending the semi-annual bill comparison mailers pending further assessment. Additionally, incentive payouts were lower than projected, as pilot participants either opted out of the rate prior to completing the pilot, or did not complete the survey required to receive the payment. The RRIMA O&M expenses include $ million in recorded costs, excluding interest, from July 2016 through October 2017, and $2.323 million in estimated costs for November through December 2017, associated with TOU and non-tou pilots (i.e., all other Residential Rate Reform activities that are not TOU-pilot or TOU-full-launch related). Additionally, SCE recorded $603,000 in capital-related revenue requirement for July 2016 through October 2017, and estimates $136,000 in capital-related revenue requirement for November through December 2017, associated with system changes and development efforts needed to support residential rate reform activities. O&M expenses are tracked in cost categories for TOU pilot and non-tou pilot and grouped together by type of activity: Marketing, Education and Outreach (ME&O); TOU Studies; and Other activities. The O&M expenses for each cost category are provided in Appendix D. a) O&M Expenses (1) TOU Pilots SCE was directed in D to launch a TOU Opt-In and a TOU Default Pilot. In compliance with this directive, SCE launched a TOU opt-in pilot in June 2016 and is preparing to launch a TOU default pilot in March This update provides the recorded costs and forecasts for the default pilot, which were not available when SCE s 2018 GRC application was filed. Additionally, SCE provides an update to the recorded costs and forecasts for the opt-in pilot, which is described in direct testimony. 12 SCE s TOU pilot expenses include costs for planning and implementing activities to support the TOU pilots. (a) Marketing, Education and Outreach (ME&O) SCE conducted ME&O for both the Opt-In Pilot and Default TOU Pilot. The supporting details for each effort are summarized below. 12 Please refer to Exhibit SCE-09, Volume 1, pp
23 (i) Opt-In Pilot In June of 2016, SCE placed approximately 15,000 customers on a TOU rate per their request to participate in the TOU pilot. In addition to the ME&O activities described in direct testimony to recruit participants, SCE also conducted ongoing educational and outreach efforts for customers on the rate. These efforts included direct mail campaigns for welcome kits, seasonal (summer, winter, fall, spring) newsletters, letters alerting customers that bill protection is ending, and bi-monthly text message alerts with tips and peak-time reminders for those customers who opted to receive those notifications. This category also includes incentive payments for customers who completed the pilot and responded to a survey at the end. Recorded costs for Opt-In Pilot ME&O activities from July 2016 through October 2017 are $2.637 million, which include production, print, and postage for direct mailers, pilot incentive payouts, and market research. SCE forecasts $247,000 in November and December 2017 for educational direct mailers, which are needed to inform participants that the pilot is ending and that they are being placed back on their original rate. (ii) Default Pilot As part of SCE s effort to better understand how to implement the mass transition of residential customers to a TOU rate in late 2020, SCE will conduct a 90/60/30-day communication campaign to approximately 400,000 customers as part of the TOU Default Pilot. The pre-default Pilot communications will begin in December 2017, and will conclude when customers default onto the rate in March The 90-day communication campaign, which includes a postcard and , will commence in December 2017 and will advise pilot participants that they will be defaulted onto a TOU rate. Customers will also be provided with a website that will show all rate options available and highlight the two default rates. SCE s recorded costs for the Default Pilot ME&O activities from July 2016 through October 2017 are $202,000. SCE forecasts an additional $376,000 for the developing and sending of the 90-day communication postcard in December SCE will begin to incur charges for the remaining pre-notification communications in January
24 (b) TOU Studies Activities within TOU Studies include costs to develop, design, and implement the TOU Opt-In Pilot Evaluation Study. As described in direct testimony, 13 the costs associated with TOU studies include: consultant fees for performing overall project management of the study, load and bill impact analysis of participant usage and costs, and survey research. Recorded costs from July 2016 through October 2017 for the Opt- In Pilot TOU Studies activities are $607,000. This includes consultant fees, load and bill impact analysis, and research for the TOU Opt-In Pilot. Additionally, SCE forecasts expenses of $477,000 for November and December (c) Other Other activities include costs for SCE s incremental labor charges in support of the TOU pilot activities, as well as the associated employee-related expenses. Incremental labor charges related to this category include Billing Operations processing of rate changes and bill protection credits for Opt-In Pilot participants. In direct testimony, SCE forecast $4 million in employee expenses in addition to $200,000 in recorded costs from October 2015 through June SCE s recorded costs from July 2016 through October 2017 are $1.159 million, and SCE forecasts expenses of $587,000 for November through December (d) Opt-In Pilot SCE recorded $357,000 in the Opt-In Pilot expenses from July 2016 through October 2017, including incremental labor and employee-related expenses. SCE forecasts an additional $350,000 from November through December 2017 for labor expenses associated with the Opt-In Pilot project management, billing operations, and employee-related expenses. (e) Default Pilot SCE recorded $775,000 in the Default Pilot from July 2016 through October These expenses include costs for labor, employee expenses, consultant support, and IT charges. As part of the Default Pilot, SCE is making IT enhancements to the existing rate analysis and rate change tool to support those customers defaulting onto a time-of-use rate. Additionally, non-labor expenses for consultant work on the re-design of a new SCE bill to support the 13 Please refer to Exhibit SCE-09, Volume 1, p
25 implementation of time-of-use rates are included. Project management support, or incremental labor expenses, are included in this category as well. SCE forecasts $237,000 from November through December 2017 for labor expenses associated with the Default Pilot enhancements outlined above. b) Non-TOU Pilots The non-tou pilot costs include expenses associated with Residential Rate Reform activities that are not related to the TOU pilots, including the early planning for the Time-of-Use Full Rollout in As stated in direct testimony, SCE was directed in D to inform residential customers of the various rate reform changes, including development and delivery of educational materials that will help inform customers of these changes, which include Tier Collapse, High Usage Charge (HUC), and both online and paper rate comparisons. 14 This update describes the costs that were incurred from July 2016 through October 2017, and forecast for November and December 2017, in order to conduct these changes. Costs are provided by the following two activity types: (1) ME&O and (2) Other, which includes labor, nonlabor and employee expenses to support these efforts. (1) Marketing, Education and Outreach (ME&O) ME&O activities include non-labor expenses for preliminary planning of the TOU full launch, and developing, designing, and deploying the various other, non-tou pilot communications in support of the residential rate reform decision. When four tiers were collapsed into three tiers in June 2016, SCE sent a direct mailer to residential customers to advise them of this change, and also updated the content on sce.com to reflect the tier reduction. In January 2017, SCE completed the transition from three to two tiers, and also introduced the High Usage Charge (HUC). To support the final tier collapse and the introduction of the HUC, SCE sent a pre-notification mailer to approximately 750,000 customers who could potentially be impacted. Since January 1, SCE has sent approximately 431,000 automated letters to those customers who exceeded 400 percent of baseline. In addition, SCE sent 461,000 automated letters to those customers who were between 349 and 400 percent of baseline, informing customers that they breached (i.e., exceeded) or came close to breaching their allotted baseline amount. SCE also made 14 Please refer to Exhibit SCE-09, Volume 1, pp
26 changes to the HUC auto Pre-Breach letter and the Budget Assistant alert to include additional language related to the CARE verification process. 15 In addition, as directed in D , SCE is required to provide a rate comparison (online and/or paper) for all residential customers advising customers of their rate options as part of the TOU default. From October 2016 through July 2017, SCE conducted three test and learn marketing and outreach campaigns to better understand the design, development and execution required for implementing the rate comparison on a larger scale to all residential customers. SCE also conducted a media campaign in July This campaign consisted of radio, digital banner advertisements, and social media directed to residential customers to bring awareness of the different rate options and the available tools to help them manage their energy use. This campaign opened the rates-related conversation with customers in preparation for their ultimate default to time-of-use rates in Finally, SCE will be conducting a mass transition of residential customers to a TOU rate in late 2020, known as full launch. Although SCE will fully outline the TOU implementation plan in its Rate Design Window (RDW) filing on January 1, 2018, SCE has already begun to incur some expenses associated with planning for the full launch. The TOU full launch ME&O activities from July 2016 through October 2017 include marketing agency costs for strategy planning. Recorded costs from July 2016 through October 2017 for this category were $6.217 million. This amount includes non-labor expenses for general residential rate reform communications, including production, print, postage and deployment costs, as well as research and message testing fees. SCE s forecast for November and December 2017 expenses in this category is $374,000. (2) Other Other activities include the labor and non-labor costs for operational support and employee-related expenses to support tier collapse, HUC, rate comparison, other general residential rate activities, and the preliminary labor costs for the TOU full launch. These charges also include Business Customer Division labor for performing rate analysis calculations for the rate comparison test and learn activities, as well as labor and non-labor for general project management support and any employee-related expenses. 15 See D
27 Recorded costs from July 2016 through October 2017 for this category were $921,000. This amount includes labor and non-labor expenses to support the non-tou pilots and general residential rate communication changes such as tier collapse, HUC, and Rate Comparison. Recorded costs also include labor charges for the TOU full launch pre-planning activities. SCE forecasts an additional $262,000 in November and December 2017 for labor and non-labor expenses associated with general residential rate communications and non-tou pilot activities highlighted above. 3. Capital-Related Revenue Requirement SCE incurred capital-related expenses of $731,000 in 2016 and $2.193 million in 2017 to support the residential rate reform decision D This work included IT system changes to modify SCE s tier structure, including the development of the HUC, the building of new rates, online opt-out capability, and bill protection for the TOU pilots. The revenue requirement on these capital expenditures (depreciation, income taxes, and return) recorded for July 2016 through October 2017 was $603,000 and the forecast for November and December 2017 is $136, Reasonableness of RRIMA Recorded O&M and Capital As described in direct testimony and in this update testimony, the RRIMA O&M expenses include costs associated with TOU and non-tou pilots and capital expenditures for related IT systems that were necessary and reasonable to implement the Commission s directive on residential TOU rates. The TOU pilot expenses include costs for the TOU Opt-In Pilot and Default Pilot. The non- TOU pilot expenses are comprised of costs for all other Residential Rate Reform activities that are not TOU pilot-related. As required by R , SCE provides quarterly reports on the progress of its residential rate reform activities and costs that are recorded in RRIMA Proposal to Modify the RRIMA Preliminary Statement to Seek Recovery of 2018, 2019, and 2020 Year-End Costs in Annual ERRA Review Proceeding No party objected to SCE s proposal to modify the RRIMA Preliminary Statement to seek recovery of the 2018, 2019, and 2020 RRIMA year-end costs in SCE s annual ERRA review proceeding. The ERRA proceeding will provide interested parties the opportunity to review RRIMA 16 SCE s Ninth Quarterly report on Progress of residential Rate Reform, dated November 1, 2017, is available online at: SCE%209Q%20Rpt%20re%20RRR%20November% pdf. 23
28 recorded costs on a timely basis, and allow SCE to recover the approved costs annually instead of waiting until the next GRC proceeding. For a complete discussion on this proposal, please see the direct testimony on Proposed RRIMA Ratemaking in Exhibit SCE-09, Volume 1, page 39. C. Recovery of Edison SmartConnect Opt-Out Costs in the SmartConnect Opt-Out Balancing Account (SOBA) In this section, SCE updates its testimony and forecast to include recorded costs and support for SOBA activity from July 2016 through October 2017, and estimated forecast costs for November through December Background The Edison SmartConnect Opt-Out Memorandum Account (SOMA) was established in April of 2012 and then was superseded by the SmartConnect Opt-Out Balancing Account (SOBA) in December Both the SOBA and SOMA were established to record revenues and corresponding costs for providing residential customers the SmartConnect meter opt-out service. The SOBA and SOMA s background, recorded costs from inception in April 2012 through June 2016, and forecast costs for July 2016 through December 2017 are discussed in SCE s direct testimony at Exhibit SCE-03, Volume 1, pages and Exhibit SCE-09, Volume 1, pages The proposal to eliminate the balancing account is discussed in SCE s testimony at Exhibit SCE-09, Volume 1, page Recorded Costs and Forecast Update SCE s forecast for SOBA costs from April 2012 through December 2017 was $ million for O&M and $3.051 million in capital-related revenue requirement. 17 Based on actual recorded amounts from July 2016 through October 2017 and a forecast of November and December costs, the updated O&M forecast is $ million, an increase of $191,000, and the updated forecast for capital expenditures is $2.198 million, a decrease of $144,000. SCE will provide the final SOBA recorded balance with actual amounts for November and December 2017 in the advice letter implementing the 2018 GRC decision Please refer to Exhibit SCE-03, Volume 1, p The $ million in recorded/estimated O&M expenses and $2.198 million in recorded capital expenditures, for a total of $ million, is under the $ million cap set in D See D , p
29 1 2 Table IV-9 below summarizes the recorded costs from inception in December 2014 through October 2017 and provides estimated costs for November through December Line No. Description Table IV-9 SmartConnect Opt-Out Balancing Account Forecast April 2012 December 2017 (Nominal $000) April June 2016 Recorded July October 2017 Recorded Estimated November - December 2017 Revised Total 1. Revenues from Opt-Out Fees (9,312) (526) (60) (9,898) 2. Operation & Maintenance Expense 15,765 2, , Capital-Related Revenue Requirement* 1,737 1, , (Over)/Under Collection 8,190 2, , Interest Ending Balance 8,219 2, , *SCE's Capital-Related Revenue Requirement includes depreciation, return, and taxes. SCE's updated recorded/estimated captial expenditures from April 2012 through December 2017 is $2.198 million. 3. Revenue from Opt-Out Fees As shown in Table IV-9, SCE recorded $9.838 million in revenue from Opt-Out charges from April 2012 through October The recorded revenue is derived by multiplying the volume of Opt-Out customers by the respective Opt-Out initial and monthly fees for CARE and non-care customers. As of October 31, 2017, SCE had 19,465 Opt-Out customers (3,816 CARE, 15,649 Non- CARE). SCE estimates collecting approximately $60,000 in revenues from Opt-Out customers in November through December This estimate is based on the current levels of initial and monthly Opt-Out charges being collected by SCE Please refer to WP SCE-03, Ch. I-VI, pp for additional details regarding Edison SmartConnect Opt- Out forecast volumes. For additional details regarding SCE s Opt-Out tariff, please refer to SCE Schedule ESC-OO (Edison SmartConnect Opt-Out). 25
30 O&M Expense The recorded SOBA O&M expenses from inception through October 2017 are $17.9 million and reflects labor and non-labor expenses for the Opt-Out program support activities as described and supported in in Exhibit SCE-03, pages Capital Expenditures SCE recorded a capital-related revenue requirement of $2.9 million associated with $2.2 million of capital expenditures in the SOBA through October These costs include consulting expenses for designing, developing, and testing the ESC Opt-Out system infrastructure, and costs to train staff on the new Opt-Out system. 6. Reasonableness of SOBA Recorded O&M and Capital As described in direct testimony and in this update testimony, the SmartConnect Opt-Out revenues, O&M expenses and capital expenditures included in the SOBA for providing SmartConnect Opt-Out service were necessary and reasonable. The SmartConnect Opt-Out revenues, O&M expenses, and capital expenditures are described in testimony 20 and supported with workpapers. 21 The ongoing SmartConnect Opt-Out service revenues, O&M and capital requirements have been incorporated into the forecasts as a part of providing basic service. 7. Elimination of the SOBA No party objected to SCE s proposal to transfer the ending SOBA under-collected balance to the distribution sub-account of the Base Revenue Requirement Balancing Account (BRRBA) to be collected from residential customers through distribution rate levels. If this proposal is adopted in this proceeding, beginning on January 1, 2018, SCE will no longer record the revenue requirement in the SOBA, and the Preliminary Statement Part Q, SOBA, will be eliminated from SCE s tariffs. SCE has included the ongoing Opt-Out program O&M 22 and capital expenditure 23 in its 2018 Test Year revenue requirement. 20 Please refer to Exhibit SCE-03, pp and Please refer to WP SCE-03, Ch. I-VI, pp and Please refer to Exhibit SCE-03, p Please refer to Exhibit SCE-03, p
31 D. Recovery of the Energy Data Request Program Costs in the Energy Data Request Program Memorandum Account (EDRPMA) In this section, SCE updates the forecast EDRPMA costs from July 2016 through December 2017 with recorded costs from July 2016 through October 2017 and estimated costs for November and December 2017 for Commission review and approval. 1. Background The EDRPMA was established in late 2014 to record the incremental costs associated with providing access to energy usage and usage-related data to government entities and researchers. The EDRPMA s background, recorded costs from inception (December 2014 through June 2016), forecast costs for July 2016 through December 2017, and proposal to eliminate the memorandum account are discussed and supported in Exhibit SCE-09, Volume 1, pages Recorded Costs and Forecast Update In direct testimony, SCE s forecast for EDRPMA costs from December 2014 through December 2017 was $593, Now, based on actual recorded amounts from July 2016 through October 2017 and an estimate of November and December 2017 costs, the updated forecast is $453,000. This is $140,000 lower than SCE s initial forecast. In preparing this update testimony, SCE identified several labor expenses that were inadvertently charged to this account. The reduced forecast reflects the correction of those charges. SCE will provide the final EDRPMA recorded balance with actual amounts for November and December 2017 in the advice letter implementing the 2018 GRC decision. Table IV-10 below summarizes the recorded costs from inception in December 2014 through October 2017, and provides an estimate of costs for November through December Please refer to Exhibit SCE-09, Volume 1, p
32 Table IV-10 Operation of the EDRPMA December 2014 December 2017 (Nominal $000) Line No. Description December June 2016 Recorded July October 2017 Recorded Estimated November - December / Revised Total 1. Operation & Maintenance Expense (142) Capital-Related Revenue Requirement (Over)/Under Collection (142) Interest Ending Balance (141) / November - December estimate includes a $176 thousand O&M correction adjustment. 3. Reasonableness of EDRPMA Recorded O&M As described in SCE s direct testimony, the EDRPMA activities include both labor and non-labor expenses. 25 For labor expenses, SCE has dedicated one full-time program manager to support the program. This program manager s responsibilities include reviewing data requests, meeting with requestors for clarification, gathering data, transferring data, and planning and attending the Energy Data Access Committee (EDAC) meetings as mandated by the Commission. Non-labor expenses include travel to attend EDAC meetings across SCE s territory, hosting of EDAC meetings once a year, and costs associated with implementing some automated information systems capabilities. 4. Proposal to Eliminate EDRPMA No party objected to SCE s proposal to transfer the ending EDRPMA December 31, 2017 balance to the distribution sub-account of the Base Revenue Requirement Balancing Account (BRRBA) to be collected from customers through distribution rate levels. If this proposal is adopted in this proceeding, then beginning on January 1, 2018, SCE will no longer record the revenue requirement in 25 Please refer to Exhibit SCE-03, pp
33 1 2 3 the EDRPMA. The Preliminary Statement N.26., EDRPMA, will be eliminated from SCE s tariffs. SCE included 2018 forecast expenses for providing access to energy usage and usage-related data to local government entities, researchers, and state and federal agencies in FERC Account Please refer to Exhibit SCE-03, p
34 V. POSTAGE EXPENSE FERC US POSTAL RATE INCREASE This chapter provides an update to SCE s postage testimony, found in Exhibit SCE-03, pages 103 through 112. As stated in direct testimony, SCE s 2018 postage forecast was $ million, which is a decrease of 25.3 percent compared to the 2015 Base Year O&M postage expense of $ million. In this update, SCE is revising its 2018 postage forecast to reflect a postage rate increase that the Postal Regulatory Commission (PRC) approved on November 9, 2017, in Order No in Docket R This postal rate change will take effect on January 21, The United States Postal Service projects that the approved prices will raise mailing service product prices by approximately 1.9 percent, as mailing service price increases are linked to the Consumer Price Index. 27 SCE forecasts that this postal rate change will result in an increase of $187,000 to its 2018 Test Year postage forecast of $ million, resulting in a total 2018 postage forecast of $ million. Table V-11 below shows the calculation of the updated postage forecast based on the approved postage rates for January See Order No in Docket No. R2018-1, available at 30
35 Table V-11 Postage Rates and Total Expense by Type of Mailing FERC Account Postal Rate Forecast 2018 Postal Expense Forecast Original Forecast (2016 Rates) Updated Forecast (2018 Rates) Difference Original Forecast (2016 Rates) Updated Forecast (2018 Rates) Difference Line No. Type of Mailing Number of Mailings Digit 37,183, $13,869 $13,944 $ Digit 10,391, N/A NA $4,115 N/A -$4,115 4 AADC (Automated Area Distribution Center) 300, $119 $4,330 $4,211 5 Mixed AADC (Automated Area Distribution Center) 626, $260 $264 $3 6 Misc 1st Class $0 $0 $0 7 Misc 1st Class Overweights 3, $1 $1 $ 8 Full 1st Class Overweights 156, $73 $73 $1 9 Full 1st Class Overweights (Over 2oz) $4 $5 $0 10 Non-Manifest 1st Class 1 626, $250 $256 $6 11 Non-Manifest 1st Class Overweights $ 0 $ 0 $ 0 12 Summary 1st Class 2 N/A N/A N/A N/A N/A N/A 13 Summary 1st Class Overweights 2 152, $312 $359 $46 14 Late Notices 1,351, $539 $551 $12 15 Misc Pieces 957, $382 $390 $9 16 Sub-total 51,750,475 $19,922 $20,170 $ wieghted average cost Prepaid Meter Postage 3 $12 $12 $ 19 Other Mailings 4 $124 $124 $ 20 Other Postage related activities 5 $90 $90 $ 21 Sub-total 51,750,475 $20,148 $20,395 $ Online Billing Productivity Adjustment -12,569,467 -$4,839 -$4,899 -$60 23 Total 39,181,008 $15,309 $15,496 $187 1 Included all Non-Manifest, Late notices & Miscellaneous pieces 2 These pieces did not include late notices or Miscellaneous pieces 3 Adjusted amount in Pitney Bowes meters and bank account less roll over from previous year 4 Customer correspondence generated by Revenue Services and Customer Contact Center 5 Postage related costs associated with Intelligent Mail Barcode, Address Cleansing, EDI Charges, Timing of Bank Reconciliation, and USPS postage fee corrections/charges Forecast years postage expense calculated using 2016 postage rates which decreased effective April 10, 2016 New forecast provided in 2018 dollars, as postage rate change is proposed for January 2018 Results of Operations model updated to reflect 2018 postage forecast in 2018$ Note: - All historical recorded costs reflect actual postage rate increases - N/A's indicate mailing category did not exist in recorded year and on occasion new mailing rate will overlap with old rate - Negative amounts displayed for pre-paid meter postage indicate over budget expenses 31
36 1 2 VI. PENSION and PBOP UPDATED FORECASTS PLUS ACCOUNTING CHANGE This chapter provides testimony concerning SCE s updated expense forecasts for Pension and Postretirement Benefits Other than Pensions (PBOP). Based on these updated forecasts, SCE is significantly reducing its rate recovery requests for Test Year 2018 from $ million and $ million for Pension and PBOP, respectively, to $ million and $3.850 million, respectively. 28 A. Background Forecast pension and PBOP costs are based on the results of actuarial valuations of estimated liabilities for future plan benefits performed by the Plan actuary, Aon Hewitt. These valuations are based on January 1 member census data and actuarial assumptions which reflect the actuary s best judgment of future events likely to affect the Pension and PBOP benefits being valued. Each individual assumption should be reasonable on its own merits and consistent with the other assumptions used. In addition, some pension valuation assumptions are mandated by law. Plan liabilities fluctuate over time due to changes in plan benefit provisions, changes in prevailing interest rates, fluctuations in the member populations, and changes in other actuarial assumptions made by the actuary pursuant to developing plan experience. All actuarial assumptions not mandated by law must represent the actuary s best estimate of future plan experience. The actuary compares plan liabilities to the value of plan assets, which are generally measured at market value, but, for pension valuation purposes only, are then subject to asset smoothing techniques. Even with these smoothing techniques, strong investment performance, as in recent years, or other favorable experience can significantly reduce reported, unfunded liabilities, which will reduce plan cost and associated rate recovery. Since the 2006 GRC decision 29, rate recovery for Pension and PBOP costs have been subject to two-way (symmetrical) balancing account treatment. Under this mechanism, differences between authorized Pension and PBOP amounts and actual costs are amortized in subsequent years. This cost 28 Workpapers supporting this chapter are included in Appendix E. 29 See D , pp , and Conclusion of Law
37 recovery mechanism protects SCE s customers and shareholders alike, who would otherwise be subject to the volatility of windfalls in some years and shortfalls in others. The decreases in estimated Pension and PBOP costs reflected in the updated forecasts highlight the unpredictability and potential volatility of these costs, and the continuing importance of the existing two-way balancing account treatment. 30 B. Updated Pension Forecast The Pension cost forecast submitted by SCE in its application on September 1, 2016 included a Test Year 2018 request of $97.5 million, and costs for 2019 and 2020 of $161.7 million and $162.9 million, respectively. 31 The forecast was prepared by the Plan Actuary, Aon Hewitt, based on the final results of the January 1, 2015 actuarial valuation, which reflected January 1, 2015 member census data, December 31, 2015 asset market value, a 7.0% assumed interest rate, and other best estimate actuarial assumptions. ORA did not contest the specific forecast amount for 2018, but did object to the higher forecast amounts for 2019 and ORA instead recommended using the $ million test year amount as the annual authorized contribution for all three years. In rebuttal testimony submitted on June 16, 2017, SCE conceded to ORA s proposal, along with continuation of the two-way balancing account treatment. SCE s updated Test Year 2018 request of $57.7 million is based on a three-year average of the updated Pension forecast costs for 2018, 2019, and 2020 of $57.0 million, $57.4 million, and $58.8 million, respectively. The forecast is based on final results of the January 1, 2017 actuarial valuation, which reflected updated assumptions including a funding interest rate of 6.5%, December 31, 2016 asset value, and January 1, 2017 member census data. A number of factors contributed to the reduction in forecast costs since the initial General Rate Case filing in September These include: (a) excellent 2016 pension trust investment performance; (b) a decline in the 2017 active member population from the 2015 census population used in the initial GRC forecast (this decline is driven by SCE s ongoing Operational Excellence initiatives); and (c) changes in demographic and economic actuarial assumptions made, pursuant to a study of recent pension plan experience. 30 Pension and PBOP actuarial valuation results prepared by the Plan Actuary, Aon Hewitt, are appended hereto. 31 Please refer to Exhibit SCE-06, Volume 2, p
38 C. Updated PBOP Forecast In the GRC application, SCE s Test Year 2018 forecast was $ million for PBOP costs. Forecast costs for 2019 and 2020 were $ million for 2019, and $ million, respectively, for a three-year average of $36.41 million. 32 These amounts covered all forecast PBOP trust contributions and tax-deductible net PBOP costs for certain retirees. Note that they exclude the cost of actuarial fees, which are also recovered in rates, but which are forecast separately. The Plan actuary, Aon Hewitt, prepared the forecast on a total utility basis in accordance with requirements of ASC (formerly FAS106). The forecast was based on the PBOP assets and liabilities shown in December 31, 2015 corporate financial statement disclosure information, which reflected a discount rate of 4.55%, active and retiree census data measured as of January 1, 2015, postretirement health claims information for 2014 and prior years, PBOP trend rates, and other best estimate actuarial assumptions. ORA did not contest the initial forecast. SCE s updated Test Year 2018 forecast of $3.850 million is based on a three-year average of the updated PBOP forecast costs for 2018, 2019, and 2020 of $4.995 million, $3.443 million, and $1.861 million, respectively, for a three-year average of $3.433 million, plus $0.417 million for PBOP-related actuarial fees (no change from SCE s GRC application). The forecast is based on final results of the January 1, 2017 actuarial valuation, which reflected a PBOP discount rate of 4.29%, January 1, 2017 census data, December 31, 2016 asset value, and post-retirement health claims information for 2016 and prior years. As with the initial forecast, Aon Hewitt projected these costs on a total utility basis in accordance with ASC (formerly FAS106). Factors contributing to the reduction in the Test Year 2018 amount include 2016 investment performance, a declining active member population, changes in demographic actuarial assumptions (including mortality assumptions), a life insurance plan design change, and lower health claims experience than expected in both 2015 and 2016, especially under the prescription drug Employer Group Waiver Program introduced in This favorable claims experience highlights the success of SCE s efforts in recent years to limit annual increases in health care claims costs. 32 Please refer to Exhibit SCE-06, Volume 2, p
39 D. Changes in Accounting Standards for Pensions and PBOP The Financial Accounting Standard Board ( FASB ) issued authoritative guidance that will change the way Pension, PBOP, and Executive Retirement Plan costs are capitalized in SCE s financial statements. 33 The FERC has allowed, and SCE will make, a one-time election to adopt the new FASB guidance for regulatory filing purposes. Collectively, this election has increased the projected capitalized amounts and reduced SCE s revenue requirement in 2018, 2019, and Currently, SCE typically reflects Pension and PBOP costs in capital projects as labor cost overhead, such that each capital project bears its equitable share of these costs. Effective January 1, 2018, SCE will be required to separate Pension and PBOP costs into two components: Service costs: costs attributable, under FASB-required methodology, to benefits earned by employees for services performed during the current year; and Non-service costs: costs relating to a plan s current funded status, reflecting various aspects of SCE s Pension and PBOP financing, investing, accounting, and rate recovery policies. Both components are determined by the Plan Actuary, Aon Hewitt. Effective January 1, 2018, Executive Retirement Plan costs will also be separated into service and non-service costs components, due to the FASB accounting standards change. Under the new accounting guidance, the entire service cost, and only the service cost, will be subject to capitalization. Because SCE s Pension and PBOP plans are relatively well-funded, negative non-service costs (i.e., net gains) are forecast for 2018, 2019, and These large negative nonservice costs act as a credit against SCE s O&M forecast, which leads to a reduction in SCE s revenue requirement. 33 Please refer to WP SCE-08 Vol. 03, Bk A, pp for a copy of FERC Instruction 4, which is the basis for this discussion. Additional guidance is provided by ASU , available at 35
40 1 2 3 VII. TRANSPORTATION SERVICES OPERATING COSTS FUEL TAX AND VEHICLE LICENSE FEE INCREASES The Road Repair and Accountability Act of 2017, California Senate Bill 1 (CA SB1) was approved by Governor Jerry Brown and filed with the Secretary of State on April 28, CA SB1 calls for a $0.12 per gallon increase in motor vehicle fuel (gasoline) tax effective November 1, 2017, a $0.20 per gallon increase in diesel excise tax effective November 1, 2017, a four percent increase in diesel sales and use tax effective November 1, 2017, and a new transportation improvement fee included in the Vehicle License Fee that varies between $25 and $175 per vehicle based on vehicle value effective January 1, While this new legislation did not significantly impact SCE s 2016 and 2017 forecasts, SCE s 2018 forecast of related operating costs has increased due to the changes in fuel tax and vehicle license fees. SCE s original 2018 transportation related operating cost forecast was $ million (nominal dollars). 36 SCE revised its 2018 operating cost forecast to $ million to account for decreasing fuel cost forecasts. 37 Based upon this new legislation, SCE s current 2018 forecast of transportationrelated costs is $ million, an increase of $1.225 million. The amount of the forecast increase attributable to the gasoline tax increase is $282,000 and the amount attributable to the diesel excise tax increase is $432,000, as shown in Table VII-12 below. The amount of the forecast attributable to the increase in diesel sales and use tax is $159,062, as shown in Table VII-13 below. The amount of the forecast increase attributable to the new transportation improvement fee is $351,945 as shown in Table VII-14 below (or $81.00 average impact to SCE multiplied by 4,345 on-road vehicles). 34 Please refer to California Senate Bill 1, available at 35 Please refer to LAO Overview of the 2017 Transportation Funding Package, included in Appendix F. 36 Please refer to SCE-07, Volume 7, p In SCE s rebuttal to TURN s testimony on transportation operating costs (SCE-23, Volume 1, pp ), SCE accepted TURN s proposed estimates for the per gallon price of gasoline diesel, thereby reducing the original operating cost forecast by $2.699 million. In the same rebuttal testimony (at pp ), SCE proposed an alternative forecast for non-fuel operating costs. However, in briefs, TURN and SCE agreed to maintain SCE s original forecast for non-fuel operating costs. Please refer to TURN Opening Brief, pp ; SCE Reply Brief, p
41 1 2 3 The increased taxes and license fees are the only updated components of SCE s 2018 forecast of transportation-related operating costs. No other components of this forecast were modified (e.g., estimated fuel consumption and fleet size and composition). Table VII-12 Fuel Tax Increase Impact on Transportation Operating Cost Forecast Nominal Dollars Category Gallons Forecast Increase per Gallon Forecast Increase Gasoline 2,350,000 $0.12 $282,000 Diesel 2,160,000 $0.20 $432,000 Total $714,000 Table VII-13 Diesel Sales and Use Tax Impact on Transportation Operating Cost Forecast 38 Nominal Dollars Taxable Price per Category Gallons Forecast Increase per Gallon Forecast Increase Gallon Diesel 2,160,000 $1.84 $0.07 $159,062 Table VII-14 Vehicle License Fee Increase Impact on Transportation Operating Cost Forecast 39 Nominal $000 4 Category Average Registration Fee Increase Per Vehicle Number of Impacted Vehicles Forecast Increase Vehicle License Fees $ $351, Approximately 30% of SCE s invoice rate for diesel fuel is either tax or not taxable. Therefore, 70% of SCE s forecast invoice rate is used to derive the taxable price per gallon. 39 Please refer to Vehicle License Fee Increase Calculations. 37
42 1 2 VIII. ACCOUNTING CHANGE FOR JOINT POLE ORGANIZATION REQUEST A. Joint Pole Organization This section of testimony updates SCE s proposed forecast for its Joint Pole Organization. The Joint Pole Organization was described in SCE-02, Volume 9, and the costs associated with the organization are a portion of GRC activity SCE had requested $8.548 million in expenses for the Joint Pole Organization. 41 After a review of the activities of the Joint Pole Organization since filing the 2018 GRC Application and Rebuttal, SCE determined that a significant amount of the work performed is related to capital expenditures, and that $4.899 million should accordingly be charged as capital expenditures. As a result, SCE s request for expenses for the Joint Pole Organization will decline by a corresponding amount. While this topic does not fit neatly into the normal scope of issues covered in an Update hearing, TURN raised concerns about the timing of accounting changes to the extent they are implemented following adoption of O&M forecasts. 42 While SCE does not agree with TURN s position on the issue for the reasons stated in SCE-25, Volume 3, and believes any policy conclusion adopted in this decision on this issue should apply prospectively only, in order to promote transparency SCE is proposing to reduce its O&M forecast, and increase its capital forecast, to reflect this change in capitalization that will be implemented in Overview of the Joint Pole Organization As part of its request for funding pole-related activities, SCE included the expenses associated with the Joint Pole Organization (JPO). JPO is responsible for a number of activities, including the following: - Executes and administers all joint pole agreements where SCE shares ownership of poles with other utilities; - Executes and administers agreements to lease pole space to other utilities; 40 Please refer to SCE-02, Volume 9, pp Please refer to Issue ORA-112, p. 166 of the Joint Comparison Exhibit. The Joint Comparison Exhibit is found in SCE Please refer to TURN-03, pp Please refer to SCE-25, Volume 3, pp Please also see SCE Opening Brief, pp and SCE Reply Brief, pp
43 Generates invoices and processes payments for joint pole activities; - Participates in the Joint Pole Committee to establish policies and resolve issues; - Performs technical evaluation of third party requests for pole space; and - Identifies unauthorized attachments. In its application, SCE requested $8.548 million for test year funding. SCE s request was based on using the last year recorded as a base, and then adding costs associated with adding staff and converting existing contract employees to SCE employees. 44 ORA proposed test year funding of $7.442 million, based on SCE receiving only one-third of its requested increase in the test year. 2. Accounting Background SCE provided an extensive discussion on capitalization of costs and the use of overhead accounts in our Rebuttal, and will not repeat that material here. 45 The detailed discussion serves as relevant background to this issue. 3. Study of Joint Pole Activities After reviewing the activities of the Joint Pole Organization, SCE determined that a large portion of the work was done to support capital activities, such as pole installations or replacements. SCE performed a detailed study of each of the groups within the Joint Pole Organization to identify the activities that will continue to be treated as 100% O&M, and the activities that will record costs to an account that will be allocated 80% to capital and 20% to O&M. This results in $4.898 million being removed from our GRC Activity request. Since these costs will record as capital, SCE has adjusted the distribution capital expenditure request upwards by $ Please refer to Appendix G for the labor study and the activity summary. 44 Please refer to SCE-02, Volume 9, pp , and SCE-18, Volume 9, pp Please refer to SCE-25, Volume 3, pp
44 1 4. SCE s Revised Proposal for JPO Test Year Table VIII-15 Joint Pole Organization Portion of GRC Account Recorded and Adjusted /Forecast (Constant 2015 $000) Recorded Forecast Labor $3,142 $3,443 $3,973 $4,330 $5,212 $6,361 $6,927 $2,408 Non-Labor $200 $831 $1,964 $2,220 $1,677 $2,260 $1,621 $1,241 Total $3,342 $4,274 $5,938 $6,550 $6,889 $8,621 $8,548 $3,649 Ratio of Labor to Total 94% 81% 67% 66% 76% 74% 81% 66% Basis of Forecast: Itemized Forecast, adjusted for costs assigned to capital account in 2018 Basis of Labor/Non-Labor Split: Itemized Forecast 2 3 The $4.899 million removed from the account has been placed in a capital expenditure item in the RO model The costs have been placed in the CET-PD-CR-JD-MTW WBS element. This is a WBS element for the nonbalancing account pole credits. Please refer to SCE-02, Volume 9, pp
45 IX. STREET LIGHT SALES As discussed in section 11.9 of the SCE s Opening Brief, SCE is removing from rate base streetlight assets included in a section 851 Application or Advice Letter, subject to: (a) the Commission approving the Application or Advice Letter, and (b) the transfer of ownership and responsibility of the asset(s) entirely transitioning from SCE to the purchaser. Streetlight sales meeting these criteria include the communities of Lancaster, Huntington Beach, Rialto, and Rancho Cucamonga. As a result of these sales, SCE is removing from rate base $24.5 million of net plant in 2017, consisting of a $41.9 million decrease in plant-in-service, and a 17.4 million decrease in accumulated depreciation. Please refer to Table IX-16 below. Table IX As shown in Table I-1, this results in a revenue requirement reduction of $6.923 million in
46 1 2 X. CHANGES IN TAX ACCOUNTING METHODS For financial reporting purposes, costs associated with internally developed software are typically capitalized and amortized over their book lives. For income tax purposes, certain portions of those costs may be deducted when incurred. The remaining costs are capitalized and amortized for tax purposes under IRC Section 167(f) over a three-year period. Tax adjustments related to internallydeveloped capitalized software costs are subject to flow-through tax treatment. 47 In October 2017, SCE filed its 2016 tax return, which included an automatic change of accounting method. The change, effective January 1, 2016, expanded the definition of the capitalized software costs which may be deducted when incurred for tax purposes. The Company had previously treated contractor and consultant costs associated with computer software as capital expenditures that were amortized over 36 months from the date the software was placed in service. SCE now treats all eligible labor costs (both internal labor and contract labor) associated with computer software as a currently deductible expense in accordance with the provisions of Internal Revenue Code Section 162 and as described in Section 5.01(1) of Internal Revenue Service Revenue Procedure This accounting method change occurred between rate cycles. Therefore, on November 6, 2017 the Company filed Advice Filing 3610-E-A in accordance with the operation of the 2016 Tax Accounting Memorandum Account (TAMA). 48 The Company will continue to file yearly updates under the TAMA to reflect changes in the revenue requirement (both positive and negative) resulting from this accounting method change until these changes have been reflected in the next 2021 General Rate Case. To reflect this change in the 2018 General Rate Case, the following changes would need to be made: 1. Change the estimate of capitalized software costs deductible when incurred; 2. Change the tax amortization schedules to reflect lower capitalized software amounts; and 3. Change pre-2018 tax basis amounts and tax amortization to reflect the incremental tax benefits given to ratepayers through the TAMA. 47 Please refer to SCE-09, Volume 2C, Section III.B.1.b.8, p The Commission established the TAMA in its decision on SCE s Test Year 2015 GRC. See D , p. 558, Ordering Paragraph
47 SCE has not yet incorporated the revenue requirement impact of these changes into the Results of Operations model, but it wanted to make the Commission aware of the accounting change. In light of the date on which this update testimony is being served, SCE proposes that any recorded-to-forecast differences related to deductible capitalized software should continue to be recorded in the TAMA and trued up through balancing accounts through 2020, at which time the impacts will be incorporated into SCE s Test Year 2021 GRC. 43
48 XI. OLD-AGE, SURVIVORS, AND DISABILITY INSURANCE (OASDI) TAX The OASDI limitations for 2017 through 2020 have been updated to reflect the limitation amounts included in the 2017 OASDI Trustees Report. The 2017 limitation increased from $126,300 to $127,200; 2018 limitation decreased from $133,200 to $130,500; 2019 limitation decreased from $139,800 to $135,600; and 2020 limitation decreased from $146,700 to $142,
49 XII. ADDED FACILITIES RATES SCE s revenue requirement recovers the costs of owning, operating, and maintaining standard facilities. Customers may request facilities in addition to, or in substitution for, the standard facilities that SCE would normally install. SCE may accommodate these requests by building such additional facilities, which are called Added Facilities. Customers are charged for the cost of these additional facilities through Added Facilities rates. In SCE-09, Volume 1, we proposed 2018 Added Facilities Rates. To account for the 2018 Cost of Capital Decision (D.) , SCE has updated its Added Facilities rates as summarized in the following table. Table XII-17 Added Facilities Rate Components SCE Financed Customer Financed Replacement at Replacement for 20 Yrs Replacement (Perpetuity) Replacement at Replacement for 20 Yrs Replacement (Perpetuity) Additional Cost No Additional Cost No Additional Cost Additional Cost No Additional Cost No Additional Cost Line Rate (%) (%) (%) (%) (%) (%) No Components (1) (2) (3) (4) (5) (6) 1 Overhead: A&G, 2 Ad Val, & Ins Return, Depreciation, 5 and Income Taxes Replacement: Total Average O&M Annual Monthly One-Time- 16 Payment Factor N/A N/A
50 Appendix A Witness Qualifications
51 SOUTHERN CALIFORNIA EDISON COMPANY QUALIFICATIONS AND PREPARED TESTIMONY OF CYNTHIA JACOBS Q. Please state your name and business address for the record. A. My name is Cynthia Jacobs, and my business address is 3 Innovation Way, Pomona, California Q. Briefly describe your present responsibilities at the Southern California Edison Company. A. I am currently Senior Manager of Regulatory Policy and Internal Controls in SCE s Pole Program Management Department. I manage the regulatory involvement, capital and O&M budget, policies and procedures for the Pole Program Management Department. Q. Briefly describe your educational and professional background. A. I earned a Bachelor of Science degree in Engineering from the University of Illinois at Urbana-Champaign and a Master s degree in Business Administration from the University of California at Los Angeles. I have been employed by Southern California Edison Company and Edison International since At Southern California Edison I have held various positions in finance, risk management and regulatory policy. I was promoted to my current position in Prior to joining Southern California Edison, I held the position of Quality Manager at TRW Technar and the position of engineer at Delco Products Division of General Motors. Q. What is the purpose of your testimony in this proceeding? A. The purpose of my testimony in this proceeding is to sponsor portions of Exhibit SCE-59, entitled Update Testimony, as identified in the Table of Contents thereto. Q. Was this material prepared by you or under your supervision? A. Yes, it was. Q. Insofar as this material is factual in nature, do you believe it to be correct? A. Yes, I do. Q. Insofar as this material is in the nature of opinion or judgment, does it represent your best judgment? A. Yes, it does. Q. Does this conclude your qualifications and prepared testimony? A. Yes, it does.
52 Appendix B Attachments for Chapter II
53 EXHIBIT SCE-59 CHAPTER II RESULTS OF OPERATIONS
54 AUTHORIZED BASE REVENUE REQUIREMENT (ABRR) AND REVENUE CHANGES
55 Table III-5, SCE-9, Volume , 2019, and 2020 Revenue Changes Resulting From The 2018 Test Year and 2019 & 2020 PTYR GRC Request (thousands of dollars) ABRR and Revenue Change Including the Impact of Previously Approved and Forecasted ABRR Changes: Cumulative SCE-9 Vol. 1 Reference 1. Proposed GRC Base Revenue Requirement 5,673,313 6,149,841 6,703,445 Update Testimony Table II-1 2. Estimated Present (Prior Year) Revenue Requirement 5,640,432 5,673,313 6,149,841 For 2018, AL 3514-E 3. GRC ABRR Change 32, , , Less: GRC Revenue Growth GWhs GRC PRR 84,253 5,309,377 Table VI GRC PRR 83,572 5,266,462 Table VI GRC PRR 83,572 5,266,462 Table VI GRC PRR 83,470 5,260,034 Table VI GRC PRR 83,470 5,260,034 Table VI GRC PRR 82,567 5,203,130 Table VI GRC Revenue Growth (42,915) (6,428) (56,904) 12. Residential Rate OIR Implementation MA 18,854 (18,854) Update Testimony, CH IV, plus FF&U 13. SmartConnect Opt Out BA 11,457 (11,457) Update Testimony, CH IV, plus FF&U Bark Beetle CEMA 10,675 (10,675) SCE-12, Table VI-3 + FF&U 15. Residential Service Disconnection MA 27 (27) Table IV-16 plus FF&U 16. Energy Data Request Program MA 458 (458) Update Testimony, CH IV, plus FF&U 17. Subtotal - Balancing/Memo Account Recovery 41,471 (41,471) GRC Revenue Change (Line 3 - Line 11 + Line 17) 117, , ,508 1,169, Percent GRC Revenue Change 2.08% 7.78% 9.93% 19.79% 20. Total System PRR 11,417,570 11,393,715 11,277,777 Table VI GRC Revenue Change , ,266 Line 18 (2018) 22. GRC Revenue Change ,485 Line 18 (2019) 23. Total System PRR with GRC Revenue Changes 11,417,570 11,510,981 11,836,528 Line 20 + Line 21 + Line Percent Total Revenue Change 1.03% 3.84% 5.16% 10.02% Line 18 / Line 23
56 TOTAL COMPANY SUMMARY OF EARNINGS AT PROPOSED RATES (EXCLUDES RATE BASE ADJUSTMENT) 2015 THROUGH 2020
57 SOUTHERN CALIFORNIA EDISON TEST YEAR 2018 GENERAL RATE CASE SUMMARY OF EARNINGS ESTIMATED REVENUE REQUIREMENTS (Thousands of Dollars) Line Recorded Forecast Forecast Forecast Forecast Forecast No. Description Operating Revenues 2. Electric Revenues 6,080,010 6,236,137 6,606,307 6,769,689 7,306,534 7,926, Operating Expenses 4. Escalation 0 32,409 69, , , , Generation - Steam 7,338 7,444 7,124 7,845 7,845 7, Generation - Nuclear 79,681 76,747 76,747 76,747 76,747 76, Generation - Hydro 43,827 45,444 42,445 41,446 41,446 41, Generation - Other 78,825 80,993 79,346 81,965 81,965 81, Transmission 160, , , , , , Distribution 527, , , , , , Customer Accounts 165, , , , , , Customer Service and Information 23,327 20,638 21,074 21,007 21,007 21, Total O&M Expenses 1,086,465 1,127,053 1,154,782 1,211,040 1,265,039 1,317, Administrative and General 860, , , , , , Total A&G Expenses 860, , , , , , Revenue Credits 214, , , , , , Other Uncollectibles 11,755 14,842 15,723 14,623 15,782 17, Franchise Requirements 50,763 56,718 60,084 61,902 66,811 72, Subtotal 1,794,805 1,833,830 1,845,881 1,763,031 1,811,199 1,854,566
58 SOUTHERN CALIFORNIA EDISON TEST YEAR 2018 GENERAL RATE CASE SUMMARY OF EARNINGS (Continued) ESTIMATED REVENUE REQUIREMENTS (Thousands of Dollars) Line Recorded Forecast Forecast Forecast Forecast Forecast No. Description Depreciation - System 1,653,598 1,750,011 1,853,858 2,008,270 2,144,517 2,342, Taxes Other Than On Income - System 336, , , , , , Taxes Based On Income - System 326, , , , , , Total Taxes - System 663, , , , ,243 1,158, Total Operating Expenses - System 4,111,562 4,269,250 4,471,107 4,574,706 4,925,959 5,355, Net Operating Revenue - System 1,968,448 1,966,887 2,135,200 2,194,984 2,380,575 2,571, Rate Base - System (Average)-System 22,568,645 24,897,304 27,027,850 28,846,445 31,285,482 33,789, Rate of Return-System 8.72% 7.90% 7.90% 7.61% 7.61% 7.61%
59 SOUTHERN CALIFORNIA EDISON TEST YEAR 2018 GENERAL RATE CASE TAXES - OTHER ESTIMATED REVENUE REQUIREMENTS (Thousands of Dollars) Line Recorded Forecast Forecast Forecast Forecast Forecast No. Description Ad Valorem Taxes 2. Ad Valorem Taxes 262, , , , , , Total Ad Valorem Taxes 262, , , , , , Payroll Taxes 5. Federal Insurance Contribution Act (FICA) 66,100 64,872 66,769 62,916 64,997 67, Federal Unemployment Tax Act State Unemployment Tax Act 3,831 3,693 3,633 3,334 3,335 3, Total Payroll Taxes 70,296 68,917 70,749 66,568 68,650 71, Misc. Taxes 10. Federal - All Other 4,145 4,566 4,699 4,842 4,994 5, Total Miscellaneous Taxes 4,145 4,566 4,699 4,842 4,994 5, ITC Amortization on CTC Property (613) (613) (612) (594) (583) (571) 13. ARAM Expense on CTC Property Total Taxes Other Than Income 336, , , , , ,604
60 SOUTHERN CALIFORNIA EDISON TEST YEAR 2018 GENERAL RATE CASE INCOME TAX ADJUSTMENTS ESTIMATED REVENUE REQUIREMENTS (Thousands of Dollars) Line Recorded Forecast Forecast Forecast Forecast Forecast No. Description California Income Tax Adjustments 2. Tax Depreciation 1,447,676 1,561,462 1,598,288 1,678,443 1,733,478 1,862, Interest On Long-Term Debt 532, , , , , , Interest On Accumulated Deferred ITC (2,805) (2,506) (2,284) (1,878) (1,693) (1,515) 5. Uniform Capitalization 130, , , , , , Capitalized Software 10,319 26,126 42,287 51,477 43,706 24, Ad Valorem Lien Date Adjustment 8,226 7,196 13,506 8,547 12,061 13, Removal Costs 524, , , , , , Amortization of Land Rights Salvage Warehouse Expense CIAC Revenues (186,558) (198,876) (219,968) (269,318) (288,633) (304,702) 12. Non Deductible Meals (2,060) (2,070) (2,132) (2,102) (2,172) (2,217) 13. Excess Compensation 3,291 3,398 3,489 3,587 3,691 3, ESOP Dividends Leased Vehicles Repair Deduction 977, ,473 1,025,107 1,038,414 1,056,033 1,085, Total CCFT Adjustments 3,442,962 3,504,197 3,662,118 3,888,938 4,003,975 4,175,971
61 SOUTHERN CALIFORNIA EDISON TEST YEAR 2018 GENERAL RATE CASE INCOME TAX ADJUSTMENTS ESTIMATED REVENUE REQUIREMENTS (Thousands of Dollars) Line Recorded Forecast Forecast Forecast Forecast Forecast No. Description Federal Income Tax Adjustments 2. Tax Depreciation 2,149,543 2,000,105 1,990,325 1,997,802 2,010,997 1,633, Interest On Long-Term Debt 532, , , , , , Uniform Capitalization 130, , , , , , Capitalized Software 10,319 26,126 42,287 51,477 43,706 24, Ad Valorem Lien Date Adjustment 8,226 7,196 13,506 8,547 12,061 13, Repair Deduction 977, ,473 1,025,107 1,038,414 1,056,033 1,085, Removal Costs 524, , , , , , Amortization of Land Rights Salvage Warehouse Expense CIAC Revenues (185,136) (197,454) (218,658) (268,278) (287,949) (304,363) 12. Non Deductible Meals (2,060) (2,070) (2,132) (2,102) (2,172) (2,217) 13. Leased Vehicles ESOP Dividends Preferred Dividend Deduction Section 199 Manufacturer's Deduction 0 5,278 16,587 19,217 21,015 23, Medicare D Total FIT Adjustments 4,149,055 3,952,856 4,075,145 4,231,241 4,305,695 3,972,114
62 SOUTHERN CALIFORNIA EDISON TEST YEAR 2018 GENERAL RATE CASE ESTIMATED REVENUE REQUIREMENTS TAXES - INCOME ($000) Line Recorded Forecast Forecast Forecast Forecast Forecast No. Description California Corporation Franchise Tax 2. Operating Revenues 6,080,010 6,236,137 6,606,307 6,769,689 7,306,534 7,926, Operating Expenses 1,794,805 1,833,830 1,845,881 1,763,031 1,811,199 1,854, Taxes Other Than Income 336, , , , , , Subtotal Expenses 2,131,593 2,185,083 2,219,803 2,154,986 2,226,008 2,297, Income Tax Adjustments 3,442,962 3,504,197 3,662,118 3,888,938 4,003,975 4,175, California Taxable Income 505, , , ,766 1,076,551 1,453, CCFT Tax Rate % % % % % % 9. CCFT 44,682 48,342 64,036 64,158 95, , California Alternate Minimum Tax Arizona Income Tax Rate % % % % % % 12. New Mexico Income Tax Rate % % % % % % 13. Arizona Income Tax New Mexico Income Tax Total Other State State Income Taxes Total State Income Taxes 44,818 48,490 64,232 64,158 95, ,506
63 SOUTHERN CALIFORNIA EDISON TEST YEAR 2018 GENERAL RATE CASE ESTIMATED REVENUE REQUIREMENTS TAXES - INCOME ($000) Line Recorded Forecast Forecast Forecast Forecast Forecast No. Description Federal Income Tax 2. Operating Revenues 6,080,010 6,236,137 6,606,307 6,769,689 7,306,534 7,926, Operating Expenses 1,794,805 1,833,830 1,845,881 1,763,031 1,811,199 1,854, Taxes Other Than Income 336, , , , , , Total State Income Taxes 44,818 48,490 64,232 64,158 95, , Less: Current Year's CCFT 44,682 48,342 64,036 64,158 95, , Plus: Prior Year's CCFT 83,455 44,682 48,342 64,036 64,158 95, Subtotal - Expenses 2,215,184 2,229,913 2,268,341 2,219,022 2,290,166 2,392, Income Tax Adjustments (Sch M) 4,149,055 3,952,856 4,075,145 4,231,241 4,305,695 3,972, Federal Taxable Income (284,229) 53, , , ,673 1,562, FIT Tax Rate 35% 35% 35% 35% 35% 35% 12. Federal Income Tax (99,480) 18,679 91, , , , Federal Alternative Income Tax Taxes Deferred-current (Plant) 408, , , , , , Taxes Deferred-current (AFUDC Debt) Taxes Deferred-current (Cap. Int.) Contributions in Aid of Construction (20,632) (20,980) (22,884) (39,053) (48,852) (73,686) 18. Investment Tax Credit Amortization (7,968) (9,878) (9,685) (9,791) (9,456) (9,098) 19. Accrued Vacation 1,342 1,385 1,422 1,462 1,504 1, Total Federal Income Taxes 281, , , , , , Total Taxes-Income (State and Fed) 326, , , , , ,921
64 SOUTHERN CALIFORNIA EDISON TEST YEAR 2018 GENERAL RATE CASE DEPRECIATION EXPENSE ESTIMATED REVENUE REQUIREMENTS (Thousands of Dollars) Line Recorded Forecast Forecast Forecast Forecast Forecast No. Description Depreciation Expense 1,653,598 1,750,011 1,853,858 2,008,270 2,144,517 2,342,650
65 SOUTHERN CALIFORNIA EDISON TEST YEAR 2018 GENERAL RATE CASE WEIGHTED AVERAGE RATE BASE ESTIMATED REVENUE REQUIREMENTS (Thousands of Dollars) Line Recorded Forecast Forecast Forecast Forecast Forecast No. Description Fixed Capital 2. Plant in Service (Avg.) 38,342,620 40,832,678 43,743,307 46,537,145 49,818,535 53,123, Capitalized Software (Avg.) 1,518,581 1,434,610 1,358,394 1,209,818 1,261,255 1,589, Intangibles (Avg.) 196, , , , , , Property Held for Future Use (Avg.) Total Fixed Capital (Avg.) 40,057,476 42,479,255 45,324,604 47,973,921 51,316,486 54,951, Adjustments 8. Customer Advance for Construction (Avg.) (69,490) (69,089) (67,745) (72,308) (79,137) (84,762) 9. Total Adjustments (Avg.) (69,490) (69,089) (67,745) (72,308) (79,137) (84,762) 10. Working Capital 11. Materials and Supplies (Avg) 190, , , , , , Mountainview Emission Credits (Avg) 6,774 6,106 5,468 4,861 4,284 3, Working Cash (Avg.) 356, , , , , , Total Working Capital (Avg.) 553, , , , , , Total Before Deductions for Reserves (Avg) 40,541,718 42,947,186 45,811,860 48,485,305 51,885,023 55,571,790
66 SOUTHERN CALIFORNIA EDISON TEST YEAR 2018 GENERAL RATE CASE WEIGHTED AVERAGE RATE BASE (Continued) ESTIMATED REVENUE REQUIREMENTS (Thousands of Dollars) Line Recorded Forecast Forecast Forecast Forecast Forecast No. Description Deductions for Reserves 17. Depreciation Reserve (Avg) (12,145,461) (12,016,424) (12,561,022) (13,175,659) (13,873,335) (14,721,079) 18. Accum. Amort. - Capitalized Software (Avg.) (984,700) (883,979) (753,411) (666,900) (665,848) (801,957) 19. Accum. Taxes Def. - Plant ( Avg.) (4,891,502) (5,201,909) (5,527,653) (5,860,535) (6,138,874) (6,361,507) 20. Accum. Def. Taxes for Uniform Capitalization Accum. Taxes Def. - CIAC (Avg.) 99, , , , , , Accrued Vacation (Avg) 20,236 18,873 17,469 16,027 14,544 13, Unfunded Pension Reserve (Avg.) (71,129) (71,342) (73,401) (76,201) (79,645) (81,145) 24. Total Deductions for Reserves ( Avg.) (17,973,073) (18,049,882) (18,784,010) (19,638,860) (20,599,541) (21,782,554) 25. Total Rate Base (Avg) 22,568,645 24,897,304 27,027,850 28,846,445 31,285,482 33,789,236
67 SOUTHERN CALIFORNIA EDISON TEST YEAR 2018 GENERAL RATE CASE N-T-G MULTIPLIER ESTIMATED REVENUE REQUIREMENTS Line Recorded Forecast Forecast Forecast Forecast Forecast No. Description Revenues Uncollectibles Tax Rate Uncollectibles Amount Applied Subtotal Franchise Fees Tax Rate Franchise Fees Amount Applied Subtotal Arizona/New Mexico/D.C. Income Tax Rates Other State I.T. Amount Applied Subtotal S. I. T. Rate S. I. T. Amount Applied Subtotal Federal Income Tax Federal Income Tax Amount Applied Net Operating Revenues Uncollectible and Franchise Fees Factor N-T-G MULTIPLIER
68 SOUTHERN CALIFORNIA EDISON TEST YEAR 2018 GENERAL RATE CASE RATE OF RETURN ESTIMATED REVENUE REQUIREMENTS Line Recorded Forecast Forecast Forecast Forecast Forecast No. Description Cost Factor 2. Long-Term Debt 5.49% 5.49% 5.49% 4.98% 4.98% 4.98% 3. Preferred Stock 5.79% 5.79% 5.79% 5.82% 5.82% 5.82% 4. Equity 10.45% 10.45% 10.45% 10.30% 10.30% 10.30% 5. Capitalization Ratios 6. Long-Term Debt 43.00% 43.00% 43.00% 43.00% 43.00% 43.00% 7. Preferred Stock 9.00% 9.00% 9.00% 9.00% 9.00% 9.00% 8. Equity 48.00% 48.00% 48.00% 48.00% 48.00% 48.00% 9. Weighted Cost 10. Long-Term Debt 2.36% 2.36% 2.36% 2.14% 2.14% 2.14% 11. Preferred Stock 0.52% 0.52% 0.52% 0.52% 0.52% 0.52% 12. Equity 5.02% 5.02% 5.02% 4.94% 4.94% 4.94% 13. Return on Rate Base 7.90% 7.90% 7.90% 7.61% 7.61% 7.61%
69 SUMMARY OF ELECTRIC RATE BASE (EXCLUDES RATE BASE ADJUSTMENT)
70 Southern California Edison Summary of Electric Rate Base - Total Company Nominal $ in Thousands Total Company Rate Base Recorded Forecast Line Item Fixed Capital 1 Plant in Service 38,342,620 40,832,678 43,743,307 46,537,145 49,818,535 53,123,446 2 Capitalized Software 1,518,581 1,434,610 1,358,394 1,209,818 1,261,255 1,589,016 3 Other Intangibles 196, , , , , ,797 4 Total Fixed Capital 40,057,476 42,479,255 45,324,604 47,973,921 51,316,486 54,951,259 Adjustments 5 Customer Advances for Construction (69,490) (69,089) (67,745) (72,308) (79,137) (84,762) 6 Customer Deposits Total Adjustments (69,490) (69,089) (67,745) (72,308) (79,137) (84,762) Working Capital 8 Materials & Supplies 190, , , , , ,438 9 Mountainview Emission Credits 6,774 6,106 5,468 4,861 4,284 3, Working Cash 356, , , , , , Total Working Capital 553, , , , , ,293 Reserves 12 Accumulated Depreciation Reserve (12,145,461) (12,016,424) (12,561,022) (13,175,659) (13,873,335) (14,721,079) 13 Accumulated Amortization (984,700) (883,979) (753,411) (666,900) (665,848) (801,957) 14 Accum. Def. Taxes - Plant (4,891,502) (5,201,909) (5,527,653) (5,860,535) (6,138,874) (6,361,507) 15 Accum. Def. Taxes - Uniform Capitalization Accum. Def. Taxes - CIAC 99, , , , , , Accum. Def. Taxes - Vacation Accrual 20,236 18,873 17,469 16,027 14,544 13, Unfunded Pension Reserve (71,129) (71,342) (73,401) (76,201) (79,645) (81,145) 19 Total Deductions for Reserves (17,973,073) (18,049,882) (18,784,010) (19,638,860) (20,599,541) (21,782,554) 20 Rate Base 22,568,645 24,897,304 27,027,850 28,846,445 31,285,482 33,789, Depreciation and Amortization 1,653,598 1,750,011 1,853,858 2,008,270 2,144,517 2,342,650
71 Southern California Edison Summary of Electric Rate Base - CPUC Nominal $ in Thousands CPUC Rate Base Recorded Forecast Line Item Fixed Capital 1 Plant in Service 30,829,338 32,872,349 35,199,552 37,503,632 40,162,597 42,814,546 2 Capitalized Software 1,422,803 1,344,128 1,272,719 1,133,514 1,181,706 1,488,795 3 Other Intangibles 183, , , , , ,736 4 Total Fixed Capital 32,436,037 34,415,075 36,681,115 38,849,789 41,566,071 44,527,078 Adjustments 5 Customer Advances for Construction (69,490) (69,089) (67,745) (72,308) (79,137) (84,762) 6 Customer Deposits Total Adjustments (69,490) (69,089) (67,745) (72,308) (79,137) (84,762) Working Capital 8 Materials & Supplies 178, , , , , ,643 9 Mountainview Emission Credits 6,774 6,106 5,468 4,861 4,284 3, Working Cash 333, , , , , , Total Working Capital 519, , , , , ,045 Reserves 12 Accumulated Depreciation Reserve (10,720,526) (10,570,393) (10,963,163) (11,427,048) (11,965,497) (12,634,848) 13 Accumulated Amortization (922,594) (828,226) (705,892) (624,838) (623,853) (751,377) 14 Accum. Def. Taxes - Plant (3,595,222) (3,740,155) (3,917,255) (4,113,258) (4,276,618) (4,382,114) 15 Accum. Def. Taxes - Capitalized Interest Accum. Def. Taxes - CIAC 99, , , , , , Accum. Def. Taxes - Vacation Accrual 18,960 17,683 16,367 15,016 13,627 12, Unfunded Pension Reserve (66,643) (66,842) (68,772) (71,395) (74,622) (76,027) 19 Total Deductions for Reserves (15,186,542) (15,083,034) (15,524,706) (16,097,114) (16,783,345) (17,662,053) 20 Rate Base 17,699,240 19,766,486 21,609,006 23,227,552 25,310,683 27,441, Depreciation and Amortization 1,436,643 1,520,200 1,608,803 1,752,338 1,872,039 2,048,898
72 Southern California Edison Summary of Electric Rate Base - FERC Nominal $ in Thousands FERC Rate Base Recorded Forecast Line Item Fixed Capital 1 Plant in Service 7,513,282 7,960,329 8,543,755 9,033,513 9,655,938 10,308,900 2 Capitalized Software 95,778 90,482 85,675 76,304 79, ,220 3 Other Intangibles 12,379 13,369 14,059 14,314 14,929 15,061 4 Total Fixed Capital 7,621,439 8,064,180 8,643,488 9,124,132 9,750,415 10,424,182 Adjustments 5 Customer Advances for Construction Customer Deposits Total Adjustments Working Capital 8 Materials & Supplies 12, ,384 13,175 14,315 15,311 15,795 9 Mountainview Emission Credits Working Cash 22,463 21,101 21,485 22,192 25,268 28, Total Working Capital 34,497 33,485 34,659 36,507 40,579 44,248 Reserves 12 Accumulated Depreciation Reserve (1,424,935) (1,446,031) (1,597,859) (1,748,611) (1,907,838) (2,086,231) 13 Accumulated Amortization (62,106) (55,753) (47,518) (42,062) (41,996) (50,580) 14 Accum. Def. Taxes - Plant (1,296,281) (1,461,754) (1,610,399) (1,747,278) (1,862,256) (1,979,393) 15 Accum. Def. Taxes - Capitalized Interest Accum. Def. Taxes - CIAC Accum. Def. Taxes - Vacation Accrual 1,276 1,190 1,102 1, Unfunded Pension Reserve (4,486) (4,500) (4,629) (4,806) (5,023) (5,118) 19 Total Deductions for Reserves (2,786,531) (2,966,848) (3,259,303) (3,541,746) (3,816,195) (4,120,501) 20 Rate Base 4,869,405 5,130,817 5,418,845 5,618,893 5,974,799 6,347, Depreciation and Amortization 216, , , , , ,752
73 TOTAL COMPANY SUMMARY OF EARNINGS AT PRESENT RATES 2015 THROUGH 2020
74 SOUTHERN CALIFORNIA EDISON TEST YEAR 2018 GENERAL RATE CASE SUMMARY OF EARNINGS ESTIMATED REVENUE REQUIREMENTS AT AUTHORIZED BASE REVENUE REQUIREMENT (Thousands of Dollars) Line Recorded Forecast Forecast Forecast Forecast Forecast No. Description Operating Revenues 2. Electric Revenues 6,080,010 6,461,352 6,716,143 6,707,448 6,706,146 6,694, Operating Expenses 4. Escalation 0 32,409 69, , , , Generation - Steam 7,338 7,444 7,124 7,845 7,845 7, Generation - Nuclear 79,681 76,747 76,747 76,747 76,747 76, Generation - Hydro 43,827 45,444 42,445 41,446 41,446 41, Generation - Other 78,825 80,993 79,346 81,965 81,965 81, Transmission 160, , , , , , Distribution 527, , , , , , Customer Accounts 165, , , , , , Customer Service and Information 23,327 20,638 21,074 21,007 21,007 21, Total O&M Expenses 1,086,465 1,127,053 1,154,782 1,211,040 1,265,039 1,317, O&M Jurisdictional Factor % % % % % % 15. O&M Expenses Juris. 1,086,465 1,127,053 1,154,782 1,211,040 1,265,039 1,317, Administrative and General 860, , , , , , Total A&G Expenses 860, , , , , , Revenue Credits 214, , , , , , Other Uncollectibles 11,755 15,378 15,984 14,488 14,485 14, Franchise Requirements 50,763 58,766 61,083 61,333 61,321 61, Subtotal 1,794,805 1,836,414 1,847,141 1,762,328 1,804,412 1,840,637
75 SOUTHERN CALIFORNIA EDISON TEST YEAR 2018 GENERAL RATE CASE SUMMARY OF EARNINGS ESTIMATED REVENUE REQUIREMENTS AT AUTHORIZED BASE REVENUE REQUIREMENT (Thousands of Dollars) Line Recorded Forecast Forecast Forecast Forecast Forecast No. Description Depreciation 1,653,598 1,750,011 1,853,858 2,008,270 2,144,517 2,342, Taxes Other Than On Income 336, , , , , , Taxes Based On Income 325, , , , , , Total Taxes 661, , , , , , Total Operating Expenses 4,110,220 4,368,090 4,511,675 4,542,203 4,659,337 4,824, Net Operating Revenue 1,969,790 2,093,262 2,204,468 2,165,245 2,046,809 1,870, Rate Base - System (Average) 22,568,645 24,897,304 27,027,850 28,846,445 31,281,198 33,785, Rate of Return 8.73% 8.41% 8.16% 7.51% 6.54% 5.54%
76 SOUTHERN CALIFORNIA EDISON TEST YEAR 2018 GENERAL RATE CASE TAXES - OTHER ESTIMATED REVENUE REQUIREMENTS AT AUTHORIZED BASE REVENUE REQUIREMENT (Thousands of Dollars) Line Recorded Forecast Forecast Forecast Forecast Forecast No. Description Ad Valorem Taxes 2. Ad Valorem Taxes 262, , , , , , Total Ad Valorem Taxes 262, , , , , , Payroll Taxes 5. Federal Insurance Contribution Act (FICA) 66,100 64,872 66,769 62,916 64,997 67, Federal Unemployment Tax Act State Unemployment Tax Act 3,831 3,693 3,633 3,334 3,335 3, Total Payroll Taxes 70,296 68,917 70,749 66,568 68,650 71, Misc. Taxes 10. Federal - All Other 4,145 4,566 4,699 4,842 4,994 5, Total Miscellaneous Taxes 4,145 4,566 4,699 4,842 4,994 5, ITC Amortization on CTC Property (613) (613) (612) (594) (583) (571) 13. ARAM Expense on CTC Property Total Taxes Other Than Income 336, , , , , ,604
77 SOUTHERN CALIFORNIA EDISON TEST YEAR 2018 GENERAL RATE CASE INCOME TAX ADJUSTMENTS ESTIMATED REVENUE REQUIREMENTS AT AUTHORIZED BASE REVENUE REQUIREMENT (Thousands of Dollars) Line Recorded Forecast Forecast Forecast Forecast Forecast No. Description California Income Tax Adjustments 2. Tax Depreciation 1,447,676 1,561,462 1,598,288 1,678,443 1,733,478 1,862, Interest On Long-Term Debt 532, , , , , , Interest On Accumulated Deferred ITC (2,805) (2,506) (2,284) (1,878) (1,693) (1,515) 5. Uniform Capitalization 130, , , , , , Capitalized Software 10,319 26,126 42,287 51,477 43,706 24, Ad Valorem Lien Date Adjustment 8,226 7,196 13,506 8,547 12,061 13, Percentage Repair Allowance Removal Costs 524, , , , , , Amortization of Land Rights Salvage Warehouse Expense CIAC Revenues (186,558) (198,876) (219,968) (269,318) (288,633) (304,702) 13. Non Deductible Meals (2,060) (2,070) (2,132) (2,102) (2,172) (2,217) 14. Excess Compensation 3,291 3,398 3,489 3,587 3,691 3, ESOP Dividends Leased Vehicles Total CCFT Adjustments 3,442,962 3,504,197 3,662,118 3,888,938 4,003,975 4,175,971
78 SOUTHERN CALIFORNIA EDISON TEST YEAR 2018 GENERAL RATE CASE INCOME TAX ADJUSTMENTS ESTIMATED REVENUE REQUIREMENTS AT AUTHORIZED BASE REVENUE REQUIREMENT (Thousands of Dollars) Line Recorded Forecast Forecast Forecast Forecast Forecast No. Description Federal Income Tax Adjustments 2. Tax Depreciation 2,149,543 2,000,105 1,990,325 1,997,802 2,010,997 1,633, Interest On Long-Term Debt 532, , , , , , Uniform Capitalization 130, , , , , , Capitalized Software 10,319 26,126 42,287 51,477 43,706 24, Ad Valorem Lien Date Adjustment 8,226 7,196 13,506 8,547 12,061 13, Percentage Repair Allowance Repair Deduction 977, ,473 1,025,107 1,038,414 1,056,033 1,085, Removal Costs 524, , , , , , Amortization of Land Rights Salvage Warehouse Expense CIAC Revenues (185,136) (197,454) (218,658) (268,278) (287,949) (304,363) 13. Non Deductible Meals (2,060) (2,070) (2,132) (2,102) (2,172) (2,217) 14. Excess Compensation 3,291 3,398 3,489 3,587 3,691 3, Leased Vehicles ESOP Dividends Preferred Dividend Deduction Section 199 Manufacturer's Deduction 0 5,278 16,587 19,217 21,015 23, Medicare D Total FIT Adjustments 4,149,055 3,952,856 4,075,145 4,231,241 4,305,695 3,972,114
79 SOUTHERN CALIFORNIA EDISON TEST YEAR 2018 GENERAL RATE CASE ESTIMATED REVENUE REQUIREMENTS AT AUTHORIZED BASE REVENUE REQUIREMENT TAXES - INCOME ($000) Line Recorded Forecast Forecast Forecast Forecast Forecast No. Description California Corporation Franchise Tax 2. Operating Revenues 6,080,010 6,461,352 6,716,143 6,707,448 6,706,146 6,694, Operating Expenses 1,794,805 1,836,414 1,847,141 1,762,328 1,804,412 1,840, Taxes Other Than Income 336, , , , , , Subtotal Expenses 2,131,593 2,187,667 2,221,063 2,154,282 2,219,221 2,283, Income Tax Adjustments 3,442,962 3,504,197 3,662,118 3,888,938 4,003,975 4,175, California Taxable Income 505, , , , , , CCFT Tax Rate % % % % % % 9. CCFT 44,682 68,023 73,634 58,718 42,693 20, California Alternate Minimum Tax Arizona Income Tax Rate % % % % % % 12. New Mexico Income Tax Rate % % % % % % 13. Arizona Income Tax New Mexico Income Tax Total Other State State Income Taxes Total State Income Taxes 44,818 68,231 73,859 58,718 42,693 20,810
80 SOUTHERN CALIFORNIA EDISON TEST YEAR 2018 GENERAL RATE CASE ESTIMATED REVENUE REQUIREMENTS AT AUTHORIZED BASE REVENUE REQUIREMENT TAXES - INCOME ($000) Line Recorded Forecast Forecast Forecast Forecast Forecast No. Description Federal Income Tax 2. Operating Revenues 6,080,010 6,461,352 6,716,143 6,707,448 6,706,146 6,694, Operating Expenses 1,794,805 1,836,414 1,847,141 1,762,328 1,804,412 1,840, Taxes Other Than Income 336, , , , , , Taxes Other Than Income 336, , , , , , Total State Income Taxes 44,818 68,231 73,859 58,718 42,693 20, Less: Current Year's CCFT 44,682 68,023 73,634 58,718 42,693 20, Plus: Prior Year's CCFT 83,455 44,682 68,023 73,634 58,718 42, Subtotal - Expenses 2,215,184 2,232,557 2,289,311 2,227,916 2,277,939 2,325, Income Tax Adjustments (Sch M) 4,149,055 3,952,856 4,075,145 4,231,241 4,305,695 3,972, Federal Taxable Income (284,229) 275, , , , , FIT Tax Rate 35% 35% 35% 35% 35% 35% 13. Federal Income Tax (99,480) 96, ,091 86,902 42, , Federal Alternative Income Tax Taxes Deferred-current (Plant) 408, , , , , , Taxes Deferred-current (AFUDC Debt) Taxes Deferred-current (Cap. Int.) Contributions in Aid of Construction (20,632) (20,980) (22,884) (39,053) (48,852) (73,686) 19. Investment Tax Credit Amortization (7,968) (9,878) (9,685) (9,791) (9,456) (9,098) 20. Total Federal Income Taxes 280, , , , , , Total Taxes-Income (State and Fed) 325, , , , , ,643
81 SOUTHERN CALIFORNIA EDISON TEST YEAR 2018 GENERAL RATE CASE DEPRECIATION EXPENSE ESTIMATED REVENUE REQUIREMENTS AT AUTHORIZED BASE REVENUE REQUIREMENT (Thousands of Dollars) Line Recorded Forecast Forecast Forecast Forecast Forecast No. Description Depreciation Expense 1,653,598 1,750,011 1,853,858 2,008,270 2,144,517 2,342,650
82 SOUTHERN CALIFORNIA EDISON TEST YEAR 2018 GENERAL RATE CASE WEIGHTED AVERAGE RATE BASE ESTIMATED REVENUE REQUIREMENTS AT AUTHORIZED BASE REVENUE REQUIREMENT (Thousands of Dollars) Line Recorded Forecast Forecast Forecast Forecast Forecast No. Description Fixed Capital 2. Plant in Service (Avg.) 38,342,620 40,832,678 43,743,307 46,537,145 49,818,535 53,123, Capitalized Software (Avg.) 1,518,581 1,434,610 1,358,394 1,209,818 1,261,255 1,589, Intangibles (Avg.) 196, , , , , , Property Held for Future Use (Avg.) Total Fixed Capital (Avg.) 40,057,476 42,479,255 45,324,604 47,973,921 51,316,486 54,951, Adjustments 8. Customer Advance for Construction (Avg.) (69,490) (69,089) (67,745) (72,308) (79,137) (84,762) 9. Total Adjustments (Avg.) (69,490) (69,089) (67,745) (72,308) (79,137) (84,762) 10. Working Capital 11. Materials and Supplies (Avg) 190, , , , , , Mountainview Emission Credits (Avg) 6,774 6,106 5,468 4, Working Cash (Avg.) 356, , , , , , Total Working Capital (Avg.) 553, , , , , , Total Before Deductions for Reserves (Avg) 40,541,718 42,947,186 45,811,860 48,485,305 51,880,739 55,568,056
83 SOUTHERN CALIFORNIA EDISON TEST YEAR 2018 GENERAL RATE CASE WEIGHTED AVERAGE RATE BASE ESTIMATED REVENUE REQUIREMENTS AT AUTHORIZED BASE REVENUE REQUIREMENT (Thousands of Dollars) Line Recorded Forecast Forecast Forecast Forecast Forecast No. Description Deductions for Reserves 17. Depreciation Reserve (Avg) (12,145,461) (12,016,424) (12,561,022) (13,175,659) (13,873,335) (14,721,079) 18. Accum. Amort. - Capitalized Software (Avg.) (984,700) (883,979) (753,411) (666,900) (665,848) (801,957) 19. Taxes Def. - Plant ( Avg.) (4,891,502) (5,201,909) (5,527,653) (5,860,535) (6,138,874) (6,361,507) 20. Capitalized Interest (Avg) Taxes Def. - CIAC (Avg.) 99, , , , , , Accrued Vacation (Avg) 20,236 18,873 17,469 16,027 14,544 13, Unfunded Pension Reserve (Avg.) (71,129) (71,342) (73,401) (76,201) (79,645) (81,145) 24. Total Deductions for Reserves ( Avg.) (17,973,073) (18,049,882) (18,784,010) (19,638,860) (20,599,541) (21,782,554) 25. Total Rate Base (Avg) 22,568,645 24,897,304 27,027,850 28,846,445 31,281,198 33,785,502
84 SOUTHERN CALIFORNIA EDISON TEST YEAR 2018 GENERAL RATE CASE N-T-G MULTIPLIER ESTIMATED REVENUE REQUIREMENTS AT AUTHORIZED BASE REVENUE REQUIREMENT Line Recorded Forecast Forecast Forecast Forecast Forecast No. Description Revenues Uncollectibles Tax Rate Uncollectibles Amount Applied Uncollectibles Juris Subtotal Franchise Fees Tax Rate Franchise Fees Amount Applied Franchise Fees Juris Subtotal Arizona/New Mexico/D.C. Income Tax Rates Other State I.T. Amount Applied Other State I.T. Juris Subtotal S. I. T. Rate S. I. T. Amount Applied S. I. T. Juris Subtotal Federal Income Tax Federal Income Tax Amount Applied Federal Income Tax Juris Net Operating Revenues Uncollectible and Franchise Fees Factor N-T-G MULTIPLIER
85 SOUTHERN CALIFORNIA EDISON TEST YEAR 2018 GENERAL RATE CASE RATE OF RETURN ESTIMATED REVENUE REQUIREMENTS AT AUTHORIZED BASE REVENUE REQUIREMENT Line Recorded Forecast Forecast Forecast Forecast Forecast No. Description Cost Factor 2. Long-Term Debt 5.49% 5.49% 5.49% 4.98% 4.98% 4.98% 3. Preferred Stock 5.79% 5.79% 5.79% 5.82% 5.82% 5.82% 4. Equity 10.45% 10.45% 10.45% 10.30% 10.30% 10.30% 5. Capitalization Ratios 6. Long-Term Debt 43.00% 43.00% 43.00% 43.00% 43.00% 43.00% 7. Preferred Stock 9.00% 9.00% 9.00% 9.00% 9.00% 9.00% 8. Equity 48.00% 48.00% 48.00% 48.00% 48.00% 48.00% 9. Weighted Cost 10. Long-Term Debt 2.36% 2.36% 2.36% 2.14% 2.14% 2.14% 11. Preferred Stock 0.52% 0.52% 0.52% 0.52% 0.52% 0.52% 12. Equity 5.02% 5.02% 5.02% 4.94% 4.94% 4.94% 13. Return on Rate Base 7.90% 7.90% 7.90% 7.61% 7.61% 7.61%
86 CPUC JURISDICTIONALIZATION & FUNCTIONALIZATION 2018 THROUGH 2020
87 Southern California Edison Results of Operations - CPUC and FERC $ in Thousands Line Estimated 2018 % for 2018 No. Item Total FERC CPUC FERC CPUC Total 1. Total Operating Revenues 6,736,606 1,063,293 5,673, % 84.22% % 2. Operating Expenses: 3. Production 4. Steam 7,845-7, % % % 5. Nuclear 76,747-76, % % % 6. Hydro 41,446-41, % % % 7. Other 81,965-81, % % % 8. Total Production O&M 208, , % % % 9. Transmission 172,453 81,335 91, % 52.84% % 10. Distribution 539,618 7, , % 98.61% % 11. Customer Accounts 159, , % % % 12. Uncollectibles 14,551 2,297 12, % 84.22% % 13. Customer Service & Information 21,007-21, % % % 14. Administrative & General 691,464 43, , % 93.69% % 15. Franchise Requirements 61,600 9,723 51, % 84.22% % 16. Revenue Credits (215,998) (51,276) (164,722) 23.74% 76.26% % 17. Subtotal 1,652,026 93,208 1,558, % 94.36% % 18. Escalation 110,631 6, , % 93.96% % 19. Depreciation 2,008, ,933 1,752, % 87.26% % 20. Taxes Other Than On Income 21. Taxes Other Than On Income - Property 321,138 62, , % 80.52% % 22. Taxes Other Than On Income - Payroll 70,816 4,466 66, % 93.69% % 23. Taxes Based On Income 400, , , % 46.86% % 24. Total Taxes 792, , , % 64.68% % 25. Total Operating Expenses 4,563, ,741 3,927, % 86.07% % 26. Net Operating Revenue 2,173, ,553 1,745, % 80.33% % 27. Rate Base 28,558,745 5,618,893 22,939, % 80.33% % 28. Rate Of Return 7.61% 7.61% 7.61%
88 Southern California Edison Results of Operations - CPUC and FERC $ in Thousands Line Estimated 2019 % for 2019 No. Item Total FERC CPUC FERC CPUC Total 1. Total Operating Revenues 7,274,829 1,124,989 6,149, % 84.54% % 2. Operating Expenses: 3. Production 4. Steam 7,845-7, % % % 5. Nuclear 76,747-76, % % % 6. Hydro 41,446-41, % % % 7. Other 81,965-81, % % % 8. Total Production O&M 208, , % % % 9. Transmission 172,453 81,335 91, % 52.84% % 10. Distribution 539,618 7, , % 98.61% % 11. Customer Accounts 159, , % % % 12. Uncollectibles 15,714 2,430 13, % 84.54% % 13. Customer Service & Information 21,007-21, % % % 14. Administrative & General 688,120 43, , % 93.69% % 15. Franchise Requirements 66,521 10,287 56, % 84.54% % 16. Revenue Credits (224,553) (53,307) (171,246) 23.74% 76.26% % 17. Subtotal 1,646,211 91,663 1,554, % 94.43% % 18. Escalation 164,630 9, , % 93.96% % 19. Depreciation 2,144, ,478 1,872, % 87.29% % 20. Taxes Other Than On Income 21. Taxes Other Than On Income - Property 341,748 65, , % 80.90% % 22. Taxes Other Than On Income - Payroll 73,061 4,608 68, % 93.69% % 23. Taxes Based On Income 545, , , % 58.46% % 24. Total Taxes 959, , , % 69.13% % 25. Total Operating Expenses 4,915, ,354 4,244, % 86.36% % 26. Net Operating Revenue 2,359, ,634 1,904, % 80.73% % 27. Rate Base 31,009,769 5,974,799 25,034, % 80.73% % 28. Rate Of Return 7.61% 7.61% 7.61%
89 Southern California Edison Results of Operations - CPUC and FERC $ in Thousands Line Estimated 2020 % for 2020 No. Item Total FERC CPUC FERC CPUC Total 1. Total Operating Revenues 7,896,504 1,193,060 6,703, % 84.89% % 2. Operating Expenses: 3. Production 4. Steam 7,845-7, % % % 5. Nuclear 76,747-76, % % % 6. Hydro 41,446-41, % % % 7. Other 81,965-81, % % % 8. Total Production O&M 208, , % % % 9. Transmission 172,453 81,335 91, % 52.84% % 10. Distribution 539,618 7, , % 98.61% % 11. Customer Accounts 159, , % % % 12. Uncollectibles 17,056 2,577 14, % 84.89% % 13. Customer Service & Information 21,007-21, % % % 14. Administrative & General 686,835 43, , % 93.69% % 15. Franchise Requirements 72,206 10,909 61, % 84.89% % 16. Revenue Credits (239,029) (56,744) (182,285) 23.74% 76.26% % 17. Subtotal 1,637,478 88,915 1,548, % 94.57% % 18. Escalation 216,745 13, , % 93.96% % 19. Depreciation 2,342, ,752 2,048, % 87.46% % 20. Taxes Other Than On Income 21. Taxes Other Than On Income - Property 366,955 68, , % 81.21% % 22. Taxes Other Than On Income - Payroll 75,649 4,771 70, % 93.69% % 23. Taxes Based On Income 706, , , % 65.92% % 24. Total Taxes 1,148, , , % 72.64% % 25. Total Operating Expenses 5,345, ,034 4,635, % 86.72% % 26. Net Operating Revenue 2,551, ,026 2,067, % 81.07% % 27. Rate Base 33,525,511 6,347,929 27,177, % 81.07% % 28. Rate Of Return 7.61% 7.61% 7.61%
90 Southern California Edison 2018 Results of Operations $ in Thousands 2018 Results of Operations Line No. Item CPUC Generation Peakers Distribution 1. Total Operating Revenues 5,673, ,321 57,183 4,927, Operating Expenses: 3. Production 4. Steam 7,845 7, Nuclear 76,747 76, Hydro 41,446 41, Other 81,965 74,514 7, Total Production O&M 208, ,552 7, Transmission 91,118 91, Distribution 532, , Customer Accounts 159, , Uncollectibles 12,254 1, , Customer Service & Information 21,007 1,597 19, Administrative & General 647,853 83,915 4, , Franchise Requirements 51,877 6, , Revenue Credits (164,722) (1,836) (162,886) 17. Total O&M 1,558, ,008 12,549 1,254, Escalation 103,952 20, , Depreciation 1,752, ,863 14,531 1,555, Taxes Other Than On Income 21. Property Taxes 258,585 21,408 3, , Payroll Taxes & Misc 66,350 8, , Taxes Based On Income 187,730 11,362 7, , Total Taxes 512,664 41,769 11, , Total Operating Expenses 3,927, ,136 38,882 3,352, Net Operating Revenue 1,745, ,185 18,302 1,575, Rate Base 22,939,852 2,000, ,520 20,699, Rate Of Return 7.61% 7.61% 7.61% 7.61%
91 Southern California Edison 2019 Results of Operations $ in Thousands 2019 Results of Operations Line No. Item CPUC Generation Peakers Distribution 1. Total Operating Revenues 6,149, ,988 56,686 5,376, Operating Expenses: 3. Production 4. Steam 7,845 7, Nuclear 76,747 76, Hydro 41,446 41, Other 81,965 74,514 7, Total Production O&M 208, ,552 7, Transmission 91,118 91, Distribution 532, , Customer Accounts 159, , Uncollectibles 13,284 1, , Customer Service & Information 21,007 1,597 19, Administrative & General 644,719 83,335 4, , Franchise Requirements 56,234 6, , Revenue Credits (171,246) (1,908) (169,337) 17. Total O&M 1,554, ,680 12,696 1,250, Escalation 154,691 29, , Depreciation 1,872, ,625 14,804 1,668, Taxes Other Than On Income 21. Property Taxes 276,482 21,239 3, , Payroll Taxes & Misc 68,453 9, , Taxes Based On Income 318,667 21,898 7, , Total Taxes 663,602 52,421 11, , Total Operating Expenses 4,244, ,448 39,127 3,643, Net Operating Revenue 1,904, ,540 17,559 1,732, Rate Base 25,034,971 2,030, ,759 22,773, Rate Of Return 7.61% 7.61% 7.61% 7.61%
92 Southern California Edison 2020 Results of Operations $ in Thousands 2020 Results of Operations Line No. Item CPUC Generation Peakers Distribution 1. Total Operating Revenues 6,703, ,841 56,891 5,892, Operating Expenses: 3. Production 4. Steam 7,845 7, Nuclear 76,747 76, Hydro 41,446 41, Other 81,965 74,514 7, Total Production O&M 208, ,552 7, Transmission 91,118 91, Distribution 532, , Customer Accounts 159, , Uncollectibles 14,479 1, , Customer Service & Information 21,007 1,597 19, Administrative & General 643,516 83,036 4, , Franchise Requirements 61,296 6, , Revenue Credits (182,285) (2,032) (180,253) 17. Total O&M 1,548, ,675 12,833 1,244, Escalation 203,661 38, , Depreciation 2,048, ,059 15,456 1,830, Taxes Other Than On Income 21. Property Taxes 298,016 21,440 3, , Payroll Taxes & Misc 70,877 9, , Taxes Based On Income 465,434 32,110 7, , Total Taxes 834,327 63,163 10, , Total Operating Expenses 4,635, ,757 40,029 3,998, Net Operating Revenue 2,067, ,082 16,862 1,894, Rate Base 27,177,582 2,064, ,596 24,891, Rate Of Return 7.61% 7.61% 7.61% 7.61%
93 STREET LIGHT SALES
94 Southern California Edison 2018 GRC Street Lights Sales $ in Thousands Lancaster Huntington Rialto Rancho Beach Cucamonga Total Street Lights Net Book Value Plant Balance 17,088 5,391 4,754 14,686 41,919 Accumulated Reserve 7,120 3,062 1,939 5,287 17,407 Net Book Value 9,968 2,330 2,815 9,399 24,512 Distribution Lines Plant Balance Plant Balance 19,304,303 19,287,215 19,281,823 19,277,070 Less: Street Lights Plant Balances (17,088) (5,391) (4,754) (14,686) Distribution Lines Plant Balance (Excluding Street Lights) 19,287,215 19,281,823 19,277,070 19,262,384 Distribution Lines Reserve Balance Reserve Balance 6,532,796 6,525,676 6,522,615 6,520,676 Less: Street Lights Reserve Balances (7,120) (3,062) (1,939) (5,287) Distribution Lines Reserve Balance (After Adjustments) 6,525,676 6,522,615 6,520,676 6,515,389 Distribution Lines Net Book Value Plant Balance 19,287,215 19,281,823 19,277,070 19,262,384 Reserve Balance 6,525,676 6,522,615 6,520,676 6,515,389 Net Book Value (After Adjustments) 12,761,538 12,759,209 12,756,393 12,746,995
95 Appendix C Attachments for Chapter III
96 COST ESCALATION LABOR AND NONLABOR O&M ESCALATION
97 SOUTHERN CALIFORNIA EDISON COMPANY IHS GLOBAL INSIGHT LABOR ESCALATION INDEXES ANNUAL PERCENT CHANGES AND ESCALATION FACTOR TO 2015$ Steam Generation Nuclear Generation Hydro Generation Line No Year Inflation Inflation Inflation %_Change %_Change Index Index Index %_Change % % % % % % % % % % % % % % % Other Generation Transmission Distribution Line No Year Inflation Inflation Inflation %_Change %_Change Index Index Index %_Change % % % % % % % % % % % % % % % Customer Accounts CS&I Sales Line No Year Inflation Inflation Inflation %_Change %_Change Index Index Index %_Change % % % % % % % % % % % % % % % A&G Line No Year Inflation Index %_Change % % % % %
98 SOUTHERN CALIFORNIA EDISON COMPANY IHS GLOBAL INSIGHT LABOR ESCALATION INDEXES ANNUAL PERCENT CHANGES AND ESCALATION FACTOR TO 2015$ Base Year Base Year Base Year Employment Cost Index, Wages and Sal, Private, Management, Business, Financial (2005:4=100) Employment Cost Index, Wages and Sal, Private, Professional and Related (2005:4=100) Utility Price and Wage Indicators, AHE, Transmission and Distribution Workers, ($/hr.) O_ECIPWMBFNS % Change O_ECIPWPARNS % Change O_CEU % Change
99 SOUTHERN CALIFORNIA EDISON COMPANY COLLECTIVE BARGAINING AGREEMENTS Count Percent UWUA % 2.75% 2.75% n/a IBEW 3, % 3.00% 3.00% n/a TOTAL 3,980 Represented Wage % CHANGE 2.99% 2.99% n/a
100 SOUTHERN CALIFORNIA EDISON COMPANY IHS GLOBAL INSIGHT NONLABOR ESCALATION INDEXES ANNUAL PERCENT CHANGES AND ESCALATION FACTOR TO 2015$ Steam Generation Hydro Generation Other Generation Year Inflation Inflation Inflation %_Change %_Change Index Index Index %_Change % % % % % % % % % % % % % % % Transmission Distribution Customer Accounts Year Inflation Inflation Inflation %_Change %_Change Index Index Index %_Change % % % % % % % % % % % % % % % CS&I Year Inflation Inflation %_Change Index Index %_Change % % % % % % % % % %
101 SOUTHERN CALIFORNIA EDISON COMPANY IHS GLOBAL INSIGHT OPERATIONS AND MAINTENANCE VARIABLES SCE Variable Name Steam Generation Hydro Generation Other Generation Transmission Distribution Customer Accounts CS&I Sales A&G Global Insight Variable Name Global Insight Description Type JEFOMMS JEHOMMS JEOOMMS JETOMMS JEDOMMS JECAOMS JECSIOMS JESALOMS JEADGOMMS Total Steam Production O&M Cost Index (MS) Total Hydro Production O&M Cost Index (MS) Total Other Production O&M Cost Index (MS) Total Elec. Trans. O&M Index (MS) Total Elec. Distr. O&M Cost Index (MS) Elec. Customer Accounts Operation Cost Index (MS) Elec. Customer Services and Info. Operation Cost Index (MS) Elec. Sales Expenses Operation Cost Index (MS) Total Elec Admin. And General O&M Cost Index (MS) Total Elec. Admin. And General O&M Cost Index Without Healthcare Expenses (MS) Total Operation and Maintenance Total Operation and Maintenance Total Operation and Maintenance Total Operation and Maintenance Total Operation and Maintenance Operation Operation Operation Total Operation and Maintenance Total Operation and Maintenance
102 COMPOSITE WAGE ESCALATION
103 SOUTHERN CALIFORNIA EDISON COMPANY EMPLOYEE WAGE SHARE Function Total Wages 2015 Percent share Clerical Total $ 177,613, % Manager/Supervisor Tota $ 299,704, % Physical/Technical Total $ 428,183, % Professional/Technical $ 420,983, % Total $ 1,326,484, %
104 SOUTHERN CALIFORNIA EDISON COMPANY EMPLOYEE WAGE SHARE Line No. Employee Category IHS Global Insight Variable IHS Global Insight Variable Description Share of Total Wages 1 Physical Workers CEU Utility Price and Wage Indicators, AHE, Transmission and Distribution Workers % 2 Clerical Workers CEU Utility Price and Wage Indicators, AHE, Transmission and Distribution Workers % 3 Managers and Employment Cost Index, ECIPWMBFNS Administrators Managers and Administrators % 4 Professional and US, Wages and Sal, Private, Professional, ECIPWPSTNS Technical Workers Scientific, Technical, % 5 Total %
105 SOUTHERN CALIFORNIA EDISON COMPANY LABOR ESCALATION CALCULATION Employee Category Physical/ Technical Clerical Professional & Managers & Technical Administrators Workers All Employees Inflation Index Weight 32.3% 13.4% 22.6% 31.7% 100.0% % 1.51% 1.51% 1.51% 1.51% % 3.25% 3.25% 3.25% 3.25% % 2.68% 2.68% 2.68% 2.68% % 2.99% 2.74% 2.64% 2.82% % 2.99% 2.79% 2.80% 2.89% % 3.05% 2.95% 2.77% 2.94% = indicates collective bargaining agreement (UWUA and newly ratified IBEW) = indicates authorized Post Test Year attrition
106 PALO VERDE
107 SOUTHERN CALIFORNIA EDISON COMPANY IHS GLOBAL INSIGHT LABOR AND NONLABOR INDEXES AND PALO VERDE ESCALATION 5-year Average Palo Verde Labor % of Direct Costs 57.43% labor %_Change 4.96% 4.01% 2.19% 3.09% 3.05% Nuclear Generation Inflation Index Deflation Index nonlabor %_Change 0.29% 1.64% 1.26% 1.89% 2.36% Nuclear Generation Inflation Index Deflation Index Palo Verde Blended O&M %_Change 2.97% 3.00% 1.80% 2.58% 2.76% Palo Verde Blended Inflation Index O&M Deflation Index
108 SOUTHERN CALIFORNIA EDISON COMPANY IHS GLOBAL INSIGHT LABOR INDEXES AND PALO VERDE ESCALATION Mnemonic Long Label United States Average Hourly Earnings, Electric Power Generation Transmission and Distribution Source: Bureau of Labor Statistics (BLS) Units: $/Hr. Historic Data CEU A.FOP2 Edge: Index % Change 4.96% 4.01% 2.19% 3.09% 3.05%
109 CAPITAL ESCALATION
110 SOUTHERN CALIFORNIA EDISON COMPANY IHS GLOBAL INSIGHT CAPITAL ESCALATION INDEXES Steam Generation Hydro Generation Other Generation Line No Year Inflation Inflation Inflation %_Change %_Change Index Index Index %_Change % % % % % % % % % % % % % % % Transmission Distribution Meters Installed Line No Year Inflation Inflation Inflation %_Change %_Change Index Index Index %_Change % % % % % % % % % % % % % % % Nuclear Palo Verde Nuclear SONGS General Plant Line No Year Inflation Inflation Inflation %_Change %_Change Index Index Index %_Change % % % % % % % % % % % % % % % Blended Capital Update Escalation Line No Year Inflation Index %_Change % % % % %
111 SOUTHERN CALIFORNIA EDISON COMPANY BLENDED CAPITAL CALCULATION Blended Capital Update Escalation Line No Year Inflation Index %_Change % % % % % Line No Nuclear Steam Nuclear SONGS Palo Verde Hydro Other Blend Transmis Distribut General Blended sion ion Plant Capital Rate 0.000% 0.000% 0.821% 1.100% 0.245% % % % % % 0.000% 0.054% 0.036% 0.009% 0.679% 0.580% 0.085% 1.443% % 0.000% 0.029% 0.038% 0.011% 0.715% 1.581% 0.213% 2.586% % 0.000% 0.020% 0.027% 0.008% 0.671% 1.625% 0.231% 2.581% % 0.000% 0.018% 0.026% 0.009% 0.532% 1.880% 0.188% 2.652% % 0.000% 0.020% 0.028% 0.008% 0.636% 1.737% 0.226% 2.655%
112 SOUTHERN CALIFORNIA EDISON COMPANY IHS GLOBAL INSIGHT CAPITAL ESCALATION INDEXES Line No. GI Variable Weight JPGDP 2.9% % 1.84% 1.61% 1.80% 1.07% 1.32% 1.85% 2.14% 2.15% 2.25% 3 JPIFNREEMISCB 47.8% % 2.12% 0.68% 0.86% 0.87% 0.23% 0.93% 0.94% 1.22% 1.92% 5 JPIFNRESXF 15.0% % 2.72% 2.47% 3.35% 2.01% 1.67% 2.48% 2.52% 2.93% 3.20% 7 WPI11 5.0% % 1.10% 0.70% 0.81% 0.51% -0.07% 0.93% 0.75% 0.44% 0.91% 9 WPI % % 2.65% 0.35% 1.30% 0.92% 0.24% 1.08% 0.94% 0.64% 0.66% 11 WPI14 0.6% % 2.22% 1.16% 1.37% 1.39% 0.45% 1.17% 1.82% 1.33% 1.23% General Plant Index 2015= Index Percent Change 1.90% 2.30% 0.88% 1.36% 1.03% 0.47% 1.17% 1.27% 1.04% 1.25%
113 SOUTHERN CALIFORNIA EDISON COMPANY IHS GLOBAL INSIGHT INDEXES AND GENERAL PLANT WEIGHTS Line No. FERC Acct Percent GI Variable 1 Account , % JPGDP 2 Account ,688, % JPIFNRESXF 3 Account ,880, % WPI12 4 Account 392 1,739, % WPI14 5 Account 393 5,001, % WPI14 6 Account 394 (2,603,713) -0.31% WPI14 7 Account , % WPI14 8 Account ,358, % JPGDP 9 Account ,473, % WPI11 10 Account , % JPIFNREEMISCB 11 Account ,806, % JPIFNREEMISCB 12 Account ,846, % JPIFNREEMISCB Grand Total 845,213, %
114 Line No. Global Insight Variable SOUTHERN CALIFORNIA EDISON COMPANY IHS GLOBAL INSIGHT VARIABLES GENERAL PLANT CALCULATION Global Insight Variable Description 1 JPGDP Chained price index--gross domestic product, 2005=100, BEA 2 JPIFNREEMISCB Base for Chained price index--miscellaneous equipment, 2005=100, IHS Global Insight 3 JPIFNRESXF Chained price index--nonresidential construction of nonfarm buildings, 2005=100, BEA 4 WPI11 Producer price index--machinery & equipment, 1982=1.0, BLS 5 WPI12 Producer price index--furniture & household durables, 1982=1.0, BLS 6 WPI14 Producer price index--transportation equipment, 1982=1.0, BLS 7 Total
115 Appendix D Attachments for Chapter IV
116 Line No. TOU Pilot Residential Rate Implementation Memorandum Account July December 2017 (Nominal $000s) July October 2017 Recorded Estimated November - December ME&O 2, Opt-in Pilot 2, Default Pilot TOU Studies TOU studies Other 1, Opt-in Pilot Default Pilot Adjustment Subtotal - TOU Pilot 4, July October 2017 Recorded Estimated November - December Non-TOU Pilot 12 ME&O 6, ME&O 6, Other Other Subtotal - Non-TOU Pilot 7, O&M TOTAL 11,743 2,323
117 Appendix E Attachments for Chapter VI


118 Aon Retirement & Investment General Rate Case Report Southern California Edison Company Retirement Plan Projected Actuarial Valuation Results Plan Years 2018 Through 2020 Risk. Reinsurance. Human Resources.
119 Aon Retirement & Investment Southern California Edison Company Projected Actuarial Valuation Results This report presents actual actuarial valuation results for the 2017 Plan Year and projected actuarial valuation results for the Plan Years 2018 through 2020 for the Southern California Edison Company Retirement Plan. All results shown for 2018 through 2020 are estimates based on the results of the 2017 actuarial valuation and December 31, 2016 Plan assets. Actual valuation results for the projection period can be expected to differ from these estimates, potentially significantly. This report includes development of estimated Funding Policy Contributions and Rate Recovery Allowances, as well as Minimum Required Contributions and Maximum Tax Deductible Amounts under Internal Revenue Code (IRC) Sections 430 & 404 for the projection period. Determinations for purposes other than this may be significantly different from the results in this report. Thus, the use of this report for purposes other than those expressed here may not be appropriate. The report also includes data summary tables, summaries of actuarial methods and assumptions and principal Plan provisions. This report has been prepared using generally accepted actuarial practices and methods. The actuarial assumptions reflected in the 2017 actuarial valuation, upon which the projections were based, are individually reasonable and reasonable in aggregate. The Minimum Required Contributions and Maximum Tax Deductible Amounts shown have been calculated in accordance with the applicable sections of the Internal Revenue Code, Treasury Regulations, the Pension Protection Act of 2006, the Moving Ahead for Progress in the Twenty-First Century Act of 2012 (MAP-21), the Highway and Transportation Funding Act of 2014 (HATFA), and the Bipartisan Budget Act of 2015 (BBA 2015). We have relied on personnel information as of January 1, 2017 and plan design and asset information as of December 31, 2016, all supplied by Southern California Edison Company. While we cannot verify the accuracy of all the information, the supplied information was reviewed for consistency and reasonableness. As a result of this review, we have no reason to doubt the substantial accuracy or completeness of the information and believe that it has produced appropriate results. We have relied on actual and expected contributions as summarized within this report. Additionally, we have relied on elections to waive funding balances by Southern California Edison Company as of the date this report is issued and future elections as indicated in this report. The actuaries signing this report meet the Qualification Standards of the American Academy of Actuaries to render the actuarial opinion contained herein GENERAL RATE CASE REPORT.DOCX November 2017 i

120 Aon Retirement & Investment Southern California Edison Company Aon s relationship with the plan and plan sponsor is strictly professional. There are no aspects of the relationship, which may impair or appear to impair the objectivity of our work. We are available to answer any questions concerning this report. Respectfully submitted, Albert A. Kopec Jr., EA, FSA Grant T. Martin, EA, FSA, CERA Aon Aon al.kopec@aonhewitt.com grant.martin@aonhewitt.com November, GENERAL RATE CASE REPORT.DOCX November 2017 ii
121 Aon Retirement & Investment Southern California Edison Company Table of Contents Introduction 1 Summary of Results 1 Plan Amendments 1 Actuarial Methods and Assumptions 1 Funding Policy Contributions 4 Internal Revenue Code Requirements 4 Rate Recovery Allowances 4 Projection Methodology 4 Exhibits 6 Summary of Projected Contributions 7 Exhibit 1 Projected Funding Policy Contribution 8 Exhibit 2 Projected IRS Minimum and Maximum Contributions 10 Exhibit 3 Funding Balances 12 Exhibit 4 Projected Rate Recovery Allowances 13 Exhibit 5 Funding Policy Actuarial Value of Assets for Funding Policy Contributions 14 Exhibit 6 Actuarial Value of Assets for Minimum Funding Purposes 15 Appendix A 16 Actuarial Assumptions and Methods 17 Summary of Plan Provisions 26 Appendix B 32 Exhibit 7 Projected Funding Policy Contribution for Non-Regulated Companies 33 Exhibit 8 Projected Funding Policy Actuarial Value of Assets for Non-Regulated Companies 34 Exhibit 9 Projected IRS Minimum Contributions for Non-Regulated Companies 35 Exhibit 10 Projected Actuarial Value of Assets for Non-Regulated Companies GENERAL RATE CASE REPORT.DOCX November 2017 iii
122 Aon Retirement & Investment Southern California Edison Company Introduction This report presents projections of 2018 through 2020 Funding Policy Contributions, Rate Recovery Allowances, Minimum Required Contributions, and Maximum Tax Deductible Amounts for the Southern California Edison Company Retirement Plan. The projections are based on January 1, 2017 actuarial valuation results and December 31, 2016 Plan assets. The projections for the years 2018 through 2020 presented in this report are only estimates. Except as noted elsewhere in this report, they assume no future plan amendments, changes in actuarial assumptions, actuarial liability experience gains or losses, or any other potential subsequent events. Actual Funding Policy Contributions, Rate Recovery Allowances, Minimum Required Contributions, and Maximum Tax Deductible Amounts for the projection period can be expected to differ from these estimates, potentially significantly. As subsequent events become known, or as additional actuarial valuation results become available, we would be pleased to update these projections. Summary of Results Highlights of the estimated actuarial valuation results presented in this report are shown below. Detailed results are displayed in Tables 1 through 6. Highlights Year Funding Policy Contribution $57,001,000 $57,393,000 $58,829,000 Rate Recovery Allowance $57,001,000 $57,393,000 $58,829,000 Average Rate Recovery Allowance for 2018 through 2020 $57,741,000 Plan Amendments The Appendix provides a detailed summary of the principal Plan provisions for the January 1, 2017 actuarial valuation. The Plan has been amended to be closed to new entrants after December 31, We are not aware of any other significant plan amendments since the 2016 actuarial valuation report was issued. Actuarial Methods and Assumptions The projected 2018 through 2020 Plan Funding Policy Contributions and Rate Recovery Allowances developed in this report are estimates of the amounts necessary to provide benefits to Plan participants assuming continued funding of the Plan in a systematic manner. These estimates are based upon the Plan's funding policy, which reflects an actuarial method selected to allocate the total cost of the Plan to various years, and upon actuarial assumptions regarding the return on investments, salary increases, employee termination rates, retirement rates, mortality rates, and other factors. The actuarial cost method used to determine projected 2018 through 2020 actuarial liabilities and normal costs for Funding Policy Contribution and Rate Recovery Allowance purposes is the Frozen Initial Liability method, with additional amortization bases established only for ad hoc cost of living adjustments for GENERAL RATE CASE REPORT.DOCX November
123 Aon Retirement & Investment Southern California Edison Company retired participants. The actuarial value of assets is determined using a Four Year Moving Average Method adjusted in the aggregate to a range of 80% to 120% of the fair market value. This report also provides preliminary estimates of projected 2018 to 2020 Minimum Required Contributions and Maximum Tax Deductible Amounts. These reflect the Unit Credit actuarial cost method and other required actuarial methodology under the Pension Protection Act of 2006 (PPA), the Moving Ahead for Progress in the Twenty-First Century Act of 2012 (MAP-21), the Highway and Transportation Funding Act of 2014 (HATFA), and the Bipartisan Budget Act of 2015 (BBA 2015). The actuarial value of assets for this purpose is determined using a Two Year Averaging Method adjusted in the aggregate to a range of 90% to 110% of fair market value, as permitted by the PPA. Actuarial valuation results for Minimum Required Contribution and Maximum Tax Deductible Amount purposes reflect the statutory prescribed mortality assumptions, as well as use of 24-month average (three-segment) corporate bond interest rates, each adjusted as needed to fall within a 25-year average interest rate corridor under MAP-21, HATFA, and BBA For averaging purposes, no increases or decreases were assumed for spot segment rates after January HATFA extended the period during which the narrowest range around the 25-year average segment rates applies for purposes of determining the segment rates for minimum funding purposes. BBA 2015 further revised and extended this narrowest range, which now applies throughout the projection period. The Appendix gives detailed descriptions of the actuarial methods used to develop the 2017 Funding Policy Contribution, Rate Recovery Allowance, Minimum Required Contribution, and Maximum Tax Deductible Amount, and also provides a summary of actuarial assumptions. The following are the key actuarial assumptions reflected in the January 1, 2017 actuarial valuation for Funding Policy Contribution and Rate Recovery Allowance purposes, and any adjustments to these assumptions that have been made for projection purposes. (The actuarial assumptions reflected in the January 1, 2017 actuarial valuation results for Minimum Required Contribution and Maximum Tax Deductible Amount purposes are generally the same, unless different assumptions are required by statute.) Actuarial Liability Interest Rate The valuation interest rate reflected in January 1, 2017 actuarial valuation results for Funding Policy Contribution and Rate Recovery Allowance purposes was 6.50%. This rate was selected in accordance with the American Academy of Actuaries guidelines for selection of economic actuarial assumptions, based upon the Plan s investment policy. These guidelines were applied to the actual long term historical rates of real investment returns of the asset classes specified in the investment policy. Mortality Rates The January 1, 2017 actuarial valuation results for Funding Policy Contribution and Rate Recovery Allowance purposes reflected the RP-2014 mortality table incorporating blue and white collar adjustments, with MP-2016 fully generational projection GENERAL RATE CASE REPORT.DOCX November
124 Aon Retirement & Investment Southern California Edison Company Salary Increase Rates The salary increase assumption varies by age. It reflects anticipated inflation, productivity, merit, and seniority increases, consistent with current trends and future expectations. The average salary increase is approximately 4.00% per year. Rates of Employment Termination and Retirement These rates of in-service decrements have been established based on actual Plan experience and future expectations. The assumptions are subject to annual review as part of the actuarial valuation process to ensure that they continue to reflect ongoing emerging experience. Expense Load For Funding Policy Contribution and Rate Recovery Allowance purposes, Liabilities were loaded for anticipated administrative expenses during the plan year. This assumption reflects actual and anticipated future experience. Form of Benefit Payment For retirement, 80% of retirees elect lump sums. Of those assumed to elect an annuity, 75% elect the 50% joint and survivor annuity and 25% elect the single life annuity. All other benefits are assumed to be paid as a lump sum. Determination of Lump Sum Payments The 2017 actuarial valuation for Funding Policy Contribution and Rate Recovery Allowance purposes assumed that all future lump sum payments will be determined on the basis of a 5.25% effective average corporate bond (three-segment) interest rate and the (unisex) RP-2014 mortality table with MP-2016 fully generational projection. Interest Credits on Cash Balance Accounts Cash balance accounts are assumed to be credited with interest at a future rate that varies by year. The assumed crediting rate starts at 4.18% in 2017, the actual crediting rate for the forthcoming plan year, and phases to 5.75% by A detailed description of these methods and a summary of the assumptions reflected in the 2017 actuarial valuation are provided in the Appendix GENERAL RATE CASE REPORT.DOCX November
125 Aon Retirement & Investment Southern California Edison Company Funding Policy Contributions Since 1982, Southern California Edison Company's funding policy has been to contribute the annual Normal Cost plus amounts required to amortize certain book reserves, which are maintained for funding policy contribution purposes, and other liabilities due to ad hoc cost of living adjustments. The contribution determined on this basis is then adjusted so as not to exceed the maximum tax deductible amount or, if necessary, to meet legally required minimum funding requirements. Funding Policy Normal Cost The Funding Policy Normal Cost is determined under the Frozen Initial Liability actuarial cost method. Under this method, the present value of future normal costs is the difference between: 1. The present value of all benefits earned and to be earned under the Plan, and 2. The sum of total funding policy assets on hand (including Company book reserves) and any remaining Unfunded Frozen Initial Liability for ad hoc cost of living adjustments. The present value of future funding policy normal costs is then divided by the present value of anticipated future covered payrolls. The result is a Funding Policy Normal Cost percentage, which is applied to the current covered payroll. The projected Funding Policy Normal Cost percentages and Funding Policy Normal Costs based on the projected covered payrolls are shown in Table 1. Internal Revenue Code Requirements IRC Section 404 provides restrictions on the Maximum Tax Deductible Amount. IRC section 430 specifies the calculation of the Minimum Required Contribution. Projected amounts for the years 2017 through 2020 are developed in Table 2. Both the Minimum Required Contributions and Maximum Tax Deductible Amounts reflect the provisions of the Pension Protection Act of 2006, MAP-21, HATFA, and BBA Rate Recovery Allowances The Rate Recovery Allowance is based on the same actuarial methods and assumptions as the Funding Policy Contribution and reflects the same Funding Policy Normal Cost. However, the Rate Recovery Allowance differs in that interest only is reflected relative to the reserves. Similar to the Funding Policy Contribution, the Rate Recovery Allowance is adjusted so as not to exceed the Maximum Tax Deductible Amount or, if necessary, to meet legally required Minimum Funding requirements. A development of projected Rate Recovery Allowances is shown in Table 4. Projection Methodology Projected actuarial valuation results reflect Plan Liabilities and Normal Costs based on the January 1, 2017 actuarial valuation. Assumed new entrants are sufficient to maintain a level population through December 31, The active participant count declines thereafter, as no new employees are included in the Plan on or after January 1, GENERAL RATE CASE REPORT.DOCX November
126 Aon Retirement & Investment Southern California Edison Company Projected Funding Target Liabilities are expected liabilities determined using standard actuarial projection methodologies based on the January 1, 2017 actuarial valuation results and adjusted for expected changes in required discount rates. No other changes in actuarial assumptions are anticipated during the projection period. No future plan amendments are assumed, except for projected annual increases in the IRC section 401(a)(17) compensation limitation. No experience gains or losses, or other potential subsequent events are anticipated during the projection period. Projected actuarial values of assets are based on the December 31, 2016 Plan asset values supplied by Southern California Edison Company GENERAL RATE CASE REPORT.DOCX November
127 Aon Retirement & Investment Southern California Edison Company Exhibits GENERAL RATE CASE REPORT.DOCX November
128 Aon Southern California Edison Company Retirement & Investment Summary of Projected Contributions $70,000,000 $60,000,000 SCE Utility Contribution Projection $57,001,000 $57,393,000 $58,829,000 Contributions $50,000,000 $40,000,000 $30,000,000 $20,000,000 $10,000,000 $0 $0 $0 $ Plan Year Utility Funding Policy Contribution Utility Minimum Required Average Year Total Plan Contribution $ 63,300,000 $ 63,500,000 $ 64,811,000 SONGS after June 7, 2013 $ 1,550,000 $ 1,550,000 $ 1,600,000 Non-Utility Contribution $ 3,200,000 $ 3,000,000 $ 2,800,000 Utility Rate Recovery Allowance $ 57,001,000 $ 57,393,000 $ 58,829, Average $ 57,741, GENERAL RATE CASE REPORT.DOCX November
129 Aon Southern California Edison Company Retirement & Investment Exhibit 1 Projected Funding Policy Contribution A. Funding Policy Normal Cost 1. Total Present Value of Benefits at 1/1 $ 3,665,006,000 $ 3,603,019,000 $ 3,520,218,000 $ 3,431,420, Actuarial Value of Plan Assets (3,183,076,000) (3,185,821,000) (3,129,337,000) (3,041,402,000) 3. Book Reserves = (B8) (17,703,000) (16,241,000) (14,691,000) (13,134,000) 4. Present Value of Future Normal Cost $ 464,227,000 $ 400,957,000 $ 376,190,000 $ 376,884, Present Value of Future Covered Payrolls $ 11,235,540,000 $ 11,500,908,389 $ 10,867,732,731 $ 10,264,817, Normal Cost Percentage at 1/1 4.13% 3.49% 3.46% 3.67% 7. Total Covered Payroll $ 1,280,012,000 $ 1,300,263,589 $ 1,233,009,147 $ 1,171,523, Expenses included in Normal Cost $ 6,000,000 $ 13,000,000 $ 16,000,000 $ 17,000, Funding Policy Normal Cost = (6) x (7) + (8) a. Assuming Payment at 1/1 $ 58,865,000 $ 58,379,000 $ 58,662,000 $ 59,995,000 b. Assuming Payment at 12/31 $ 62,691,000 $ 62,174,000 $ 62,475,000 $ 63,895,000 c. Assuming Quarterly Payments $ 61,199,000 $ 60,695,000 $ 60,988,000 $ 62,375,000 B. Amortization of Book Reserves 1. Total Book Reserves Preceding 1/1 $ 18,986,000 $ 17,703,000 $ 16,241,000 $ 14,691, Interest on Book Reserves 1,329,000 1,151,000 1,056, , Payments to Retired Participants Amortization Payments (2,612,000) (2,613,000) (2,605,000) (2,512,000) 5. Reserves Adjustment Total Book Reserves 1/1 $ 17,703,000 $ 16,241,000 $ 14,691,000 $ 13,134, Portion Attributable to Non-Qualified Plan Book Reserves 1/1 Attributable to Qualified Plan $ 17,703,000 $ 16,241,000 $ 14,691,000 $ 13,134, Amortization Amount $ 2,613,000 $ 2,605,000 $ 2,512,000 $ 2,436, GENERAL RATE CASE REPORT.DOCX November
130 Aon Southern California Edison Company Retirement & Investment Exhibit 1 Projected Funding Policy Contribution (continued) C. Funding Policy Contribution 1. Funding Policy Normal Cost = (A9) a. Assuming Payment at 12/31 $ 62,691,000 $ 62,174,000 $ 62,475,000 $ 63,895,000 b. Assuming Quarterly Payments $ 61,199,000 $ 60,695,000 $ 60,988,000 $ 62,375, Amortization of Book Reserves = (B9) $ 2,613,000 $ 2,605,000 $ 2,512,000 $ 2,436, Amortization of Frozen Initial Liability a. Assuming Payment at 12/31 $ - $ - $ - $ - b. Assuming Quarterly Payments $ - $ - $ - $ - 4. Funding Policy Contribution before Adjustment for Minimum Contribution but not less than Minimum Required Contribution and not more than Maximum Tax Deductible Contribution = (1) + (2) or Minimum Required Contribution if larger a. Assuming Payment at 12/31 $ 65,304,000 $ 64,779,000 $ 64,987,000 $ 66,331,000 b. Assuming Quarterly Payments $ 63,812,000 $ 63,300,000 $ 63,500,000 $ 64,811, Funding Policy Contribution after Adjustment for Minimum Contribution a. Assuming Payments at 12/31 N/A N/A N/A N/A b. Assuming Quarterly/Actual Payments $ 63,812,000 $ 63,300,000 $ 63,500,000 $ 64,811, GENERAL RATE CASE REPORT.DOCX November
131 Aon Southern California Edison Company Retirement & Investment Exhibit 2 Projected IRS Minimum and Maximum Contributions A. Funding Shortfall/(Surplus) 1. Funding Target Liability at 1/1 $ 2,937,497,619 $ 2,962,618,214 $ 2,961,682,249 $ 2,943,778, Actuarial Value of Assets (3,294,171,692) (3,150,801,050) (3,091,569,055) (3,006,780,546) 3. Prefunding Balance 213,380, ,772, ,036, ,822, Funding Shortfall/(Excess) $ (143,294,055) $ 99,589,380 $ 103,149,246 $ 109,820,946 B. Shortfall Amortization Payment 1. 7 years remaining $ - $ 16,256,243 $ 2,435,700 $ 3,361, years remaining ,256,243 2,435, years remaining ,256, years remaining years remaining years remaining years remaining Total $ - $ 16,256,243 $ 18,691,943 $ 22,053, GENERAL RATE CASE REPORT.DOCX November
132 Aon Southern California Edison Company Retirement & Investment Exhibit 2 Projected IRS Minimum and Maximum Contributions (continued) C. Minimum Required Contribution 1. Target Normal Cost at 1/1 $ 101,800,429 $ 110,943,076 $ 111,373,422 $ 108,879, Credit for Excess Assets (101,800,429) Adjusted Target Normal Cost $ - $ 110,943,076 $ 111,373,422 $ 108,879, Shortfall Amortization Payment = (B8) - 16,256,243 18,691,943 22,053, Preliminary Minimum Required Contribution (MRC) - 127,199, ,065, ,932, Credit Balances Applied to MRC - (68,959,022) (112,987,473) (130,932,951) 7. Following Year Contribution Attributed to Current Year (57,183,009) (58,240,297) (59,304,056) - 8. Minimum Required Contribution at 1/1 (Not less than $0) $ - $ - $ - $ - 9. a. Minimum Required Contribution $ - $ - $ - $ - b. Assuming Quarterly/Actual Payments $ - $ - $ - $ - D. Maximum Tax-Deductible Amount 1. Funding Target at 1/1 $ 3,453,850,768 $ 3,458,868,730 $ 3,411,341,529 $ 3,364,673, Funding Target Normal Cost 123,844, ,469, ,561, ,097, Cushion Amount 1,842,519,672 1,836,501,325 1,802,530,579 1,770,506, Actuarial Value of Assets (3,294,171,692) (3,150,801,050) (3,091,569,055) (3,006,780,546) 5. Preliminary Maximum Deductible Amount $ 2,126,043,131 $ 2,277,038,793 $ 2,252,864,407 $ 2,254,497, Minimum Required Contribution $ - $ - $ - $ - 7. Maximum Tax-Deductible Contribution $ 2,126,043,131 $ 2,277,038,793 $ 2,252,864,407 $ 2,254,497, GENERAL RATE CASE REPORT.DOCX November
133 Aon Southern California Edison Company Retirement & Investment Exhibit 3 Funding Balances A. Carryover Balance 1. Carryover Balance at 1/1 $ - $ - $ - $ - 2. Amount Used to Offset Funding Requirement Adjustment for Investment Earnings to 12/ Elected Reduction in 12/31 Balance Carryover Balance at 12/31 $ - $ - $ - $ - B. Prefunding Balance 1. Prefunding Balance at 1/1 $ 213,380,018 $ 287,772,216 $ 233,036,052 $ 172,822, Amount Waived Amount Used to Offset Funding Requirement - (68,959,022) (112,987,473) (130,932,951) 4. Adjustment for Investment Earnings to 12/31* 13,869,701 14,222,858 7,803,158 2,722, Excess Contributions = (C4) + (C5) 57,183,009-42,226, Interest on Excess Contributions = (C6) 3,339,488-2,744, Prefunding Balance at 12/31 $ 287,772,216 $ 233,036,052 $ 172,822,602 $ 44,612,478 C. Excess Contributions 1. Contributions Discounted to Beginning of Year $ 57,183,009 $ 58,240,297 $ 59,304,056 $ - 2. Preliminary Minimum Required Contribution (MRC) $ - $ 127,199,319 $ 130,065,365 $ 130,932, Credit Balances Applied to MRC $ - $ 68,959,022 $ 112,987,473 $ 130,932, Excess Above MRC $ 57,183,009 $ - $ - $ - 5. Excess Due to Use of Credit Balances $ - $ - $ 42,226,164 $ - 6. Interest on Excess $ 3,339,488 $ - $ 2,744,701 $ - *Assumed investment earnings equal to 6.50% GENERAL RATE CASE REPORT.DOCX November
134 Aon Southern California Edison Company Retirement & Investment Exhibit 4 Projected Rate Recovery Allowances A. Funding Policy Normal Cost 1. Assuming Payment at 12/31 $ 62,691,000 $ 62,174,000 $ 62,475,000 $ 63,895, Assuming Quarterly Payments $ 61,199,000 $ 60,695,000 $ 60,988,000 $ 62,375,000 B. Interest Accrual at 6.50% per annum on Book Reserves $ 1,151,000 $ 1,056,000 $ 955,000 $ 854,000 C. Rate Recovery Allowance Before Adjsutment for Non-Utility Company = (A2) + (B), but not less than Minimum Required Contribution $ 62,350,000 $ 61,751,000 $ 61,943,000 $ 63,229,000 D. Non-Utility Normal Cost or Minimum Required ContributionWhatever Is Applicable 1. Assuming Payment at 12/31 N/A N/A N/A N/A 2. Assuming Quarterly Payments $ 3,399,000 $ 3,200,000 $ 3,000,000 $ 2,800,000 E. SONGS Post 7/6/13 Funding Policy or Funding Target Normal Cost Whatever Is Applicable $ 1,579,000 $ 1,550,000 $ 1,550,000 $ 1,600,000 F. Utility Rate Recovery Allowance 1. Assuming Payment at 12/31 N/A N/A N/A N/A = (C) - (D1) - (E) 2. Assuming Quarterly/Actual Payments $ 57,372,000 $ 57,001,000 $ 57,393,000 $ 58,829,000 = (C) - (D2) - (E) Average Rate Recovery Allowance $ 57,741, GENERAL RATE CASE REPORT.DOCX November
135 Aon Southern California Edison Company Retirement & Investment Exhibit 5 Funding Policy Actuarial Value of Assets for Funding Policy Contributions A Actuarial Value of Trust Fund Assets at Preceding 1/1 1. Actuarial Value of Assets at Preceding 1/1 $ 3,116,002,000 $ 3,183,076,000 $ 3,185,821,000 $ 3,129,337, Contributions Receivable at Preceding 1/ Net Actuarial Value of Assets = (1) - (2) $ 3,116,002,000 $ 3,183,076,000 $ 3,185,821,000 $ 3,129,337,000 B. Increases/Decreases during Preceding Year 1. Contributions $ 81,417,000 $ 63,812,000 $ 63,000,000 $ 64,000, Assumed Investment Income 213,415, ,269, ,779, ,154, Benefit Payments (237,043,203) (237,043,203) (287,567,721) (317,905,456) 4. Total (1) + (2) - (3) $ 57,789,585 $ 28,038,723 $ (24,787,807) $ (58,750,478) C. Unadjusted Actuarial Value of Assets at 1/1 = (A) + (B) $ 3,173,792,000 $ 3,211,115,000 $ 3,161,033,000 $ 3,070,587,000 D. Market Value of Assets at 1/1 1. Trust Fund Value $ 3,210,926,277 $ 3,109,937,680 $ 3,034,247,261 $ 2,953,848, Contributions Receivable Total (1) + (2) $ 3,210,926,277 $ 3,109,937,680 $ 3,034,247,261 $ 2,953,848,383 E. Actuarial Value of Assets at 1/1 1. Unadjusted Actuarial Value $ 3,173,792,000 $ 3,211,115,000 $ 3,161,033,000 $ 3,070,587, Adjustment Related to Market Value = 0.25 x [(D1) - (C)] 9,284,000 (25,294,000) (31,696,000) (29,185,000) 3. Contributions Receivable at 1/ Actuarial Value of Assets = (1) + (2) + (3) $ 3,183,076,000 $ 3,185,821,000 $ 3,129,337,000 $ 3,041,402,000 F. Adjusted Actuarial Value of Assets $ 3,183,076,000 $ 3,185,821,000 $ 3,129,337,000 $ 3,041,402,000 (E4) but within 80%/120% of (D3) GENERAL RATE CASE REPORT.DOCX November
136 Aon Southern California Edison Company Retirement & Investment Exhibit 6 Actuarial Value of Assets for Minimum Funding Purposes A. Market value of assets, January 1: 1. Trust fund value $ 3,210,931,001 $ 3,109,942,711 $ 3,034,252,619 $ 2,953,854, Contribution Receivable 62,055,028 60,522,496 61,554,169 62,584, Total = (1) + (2) $ 3,272,986,029 $ 3,170,465,207 $ 3,095,806,788 $ 3,016,438,224 B Prior year gains/(losses) 1. Initial asset gain/(loss) for year-2 $ (179,704,136) $ 58,073,574 $ 459,449 $ 6,126, Weight Unrecognized amount $ (59,901,379) $ 19,357,858 $ 153,150 $ 2,042, Initial asset gain/(loss) for year-1 $ 58,073,574 $ 459,449 $ 6,126,874 $ 11,423, Weight Unrecognized amount $ 38,715,716 $ 306,299 $ 4,084,583 $ 7,615, Total Amount unrecognized $ (21,185,663) $ 19,664,157 $ 4,237,733 $ 9,657, Preliminary Actuarial Value of Plan assets = (A3) - (B7) $ 3,294,171,692 $ 3,150,801,050 $ 3,091,569,055 $ 3,006,780,546 C. Market Value of Trust Fund Assets at 1/1/t 1. Lower Bound = 0.90 x (A3) $ 2,945,687,427 $ 2,853,418,687 $ 2,786,226,110 $ 2,714,794, Upper Bound = 1.10 x (A3) $ 3,600,284,631 $ 3,487,511,727 $ 3,405,387,466 $ 3,318,082, Actuarial Value of Assets at 1/1/t $ 3,294,171,692 $ 3,150,801,050 $ 3,091,569,055 $ 3,006,780,546 =Greater of (B8) and (C1), No greater than (C2) GENERAL RATE CASE REPORT.DOCX November
137 Aon Retirement & Investment Southern California Edison Company Appendix A Appendix A GENERAL RATE CASE REPORT.DOCX November
138 Aon Retirement & Investment Southern California Edison Company Actuarial Assumptions and Methods For Minimum Funding Valuation Actuarial Liability Interest Rates Minimum Funding 1st Segment Rate 4.16%. 2nd Segment Rate 5.72%. 3rd Segment Rate 6.48%. Based on segment rates with a no-month lookback (as of January 2017), each adjusted as needed to fall within the 25-year average interest rate corridor under MAP-21, HATFA, and BBA Maximum Deductible 1st segment rate 2nd segment rate 3rd segment rate Cash Balance Interest Crediting Rate Based on segment rates with a no-month lookback (as of January 2017), without regard to the interest rate stabilization. 1.57%. 3.77%. 4.73%. Actual rate for the forthcoming plan year phasing to 5.75% in Salary Increases See Table 1. Optional Payment Form Election Percentage Retirement 80% lump sum. Of those assumed to elect an annuity: 75% elect the 50% Joint and Survivor 25% elect the Single Life Annuity All Other Benefits Optional Payment Form Conversion Interest Rate Optional Payment Form Conversion Mortality 100% lump sum. Same as funding interest rates. Current IRC section 417(e) table. Retirement Age Active Participants See Table 2. Terminated Vested Participants See Table 3. Disabled Participants Earlier of age 65 and date of disability plus 2 years. Appendix A GENERAL RATE CASE REPORT.DOCX November
139 Aon Retirement & Investment Southern California Edison Company Actuarial Assumptions and Methods For Minimum Funding Valuation (continued) Mortality Rates Healthy and Disabled 2017 Static Mortality Table for Annuitants and Non- Annuitants per IRC section 1.430(h)(3)-1(e). Withdrawal Rates Non-Union See Table 4. Union See Table 5. Disability Rates See Table 6. Decrement Timing Surviving Spouse Benefit Benefit and Compensation Limits Valuation of Plan Assets Middle of year, except 100% retirement assumption which is beginning of year. It is assumed that 80% of males and 80% of females have an eligible spouse, and that males are three years older than their spouses. Projected benefits and compensation are limited by the current IRC section 415 maximum benefit of $215,000 and the IRC section 401(a)(17) compensation limit of $270,000. Smoothed fair market value of assets over the current and prior two years, adjusted for contributions, benefit payments, administrative expenses, and expected earnings. The average value of assets calculated in this manner is further limited to not less than 90% nor more than 110% of fair market value. Expected Return on Assets 2015 Plan Year 7.00%, limited to 6.81% Plan Year 7.00%, limited to 6.65% Plan Year 6.50%, limited to 6.48% Trust Expenses Included in Target Normal Cost Actuarial Method Average administrative expenses over the prior two years (excluding PBGC premiums), plus estimated PBGC premiums for the current plan year, rounded to the nearest $500,000. Standard Unit Credit Cost Method. Appendix A GENERAL RATE CASE REPORT.DOCX November
140 Aon Retirement & Investment Southern California Edison Company Actuarial Assumptions and Methods For Funding Policy Valuation Actuarial Liability Interest Rate 6.50%. Expected Return on Assets 6.50%. Optional Payment Form Conversion Interest Rate Optional Payment Form Conversion Mortality Rates Benefit and Compensation Limits 5.25%. RP-2014 employees and healthy annuitants unisex mortality table. Fully generational projection from 2006 using Scale MP The IRC section 415 benefit limit and the IRC section 401(a)(17) compensation limit have been projected at 3.00% per year. Mortality Rates Non-Union Union Actuarial Cost Method Value of Plan Assets All Other Assumptions RP-2014 employees and healthy annuitants mortality table with white collar adjustment. Fully generational projection from 2006 using Scale MP RP-2014 employees and healthy annuitants mortality table with blue collar adjustment. Fully generational projection from 2006 using Scale MP Frozen Initial Liability. Based on prior year final Value of Plan Assets, rolled forward with cashflow items and expected return at the Actuarial Liability Interest Rate. The adjusted Value of Plan Assets recognizes 25% of the difference between expected Value of Plan Assets and the fair market value of assets which excludes receivables. The final Value of Plan Assets is further limited to not less than 80% and not more than 120% of fair market value. Same as Minimum Funding assumptions. Appendix A GENERAL RATE CASE REPORT.DOCX November
141 Aon Retirement & Investment Southern California Edison Company Actuarial Assumptions and Methods Table 1 Salary Increases Age Rate % % % % % % % % Appendix A GENERAL RATE CASE REPORT.DOCX November
142 Aon Retirement & Investment Southern California Edison Company Actuarial Assumptions and Methods Table 2 Active Retirement Rates Age Rate % % % % % % % % % % % % % % % % Appendix A GENERAL RATE CASE REPORT.DOCX November
143 Aon Retirement & Investment Southern California Edison Company Actuarial Assumptions and Methods Table 3 Terminated Vested Retirement Rates Age Rate % % % % % % % % % % % Appendix A GENERAL RATE CASE REPORT.DOCX November
144 Aon Retirement & Investment Southern California Edison Company Actuarial Assumptions and Methods Table 4 Active Non-Union Withdrawal Rates Years of Service Age % 15.0% 14.0% 13.0% % 15.0% 14.0% 12.5% % 15.0% 14.0% 12.0% % 15.0% 14.0% 11.5% % 15.0% 14.0% 11.0% % 15.0% 14.0% 10.5% % 15.0% 14.0% 10.0% % 15.0% 14.0% 9.5% % 15.0% 14.0% 9.0% % 15.0% 14.0% 8.5% % 15.0% 14.0% 7.7% % 15.0% 14.0% 7.4% % 15.0% 14.0% 7.1% % 15.0% 14.0% 6.8% % 15.0% 14.0% 6.5% % 15.0% 14.0% 6.2% % 15.0% 14.0% 5.9% % 15.0% 14.0% 5.6% % 15.0% 14.0% 5.3% % 15.0% 14.0% 5.0% % 15.0% 14.0% 4.8% % 15.0% 14.0% 4.6% % 15.0% 14.0% 4.4% % 15.0% 14.0% 4.2% % 15.0% 14.0% 4.0% % 15.0% 14.0% 3.8% % 15.0% 14.0% 3.6% % 15.0% 14.0% 3.4% % 15.0% 14.0% 3.2% % 15.0% 14.0% 3.0% % 15.0% 14.0% 3.0% % 15.0% 14.0% 3.0% % 15.0% 14.0% 3.0% % 15.0% 14.0% 3.0% % 15.0% 14.0% 3.0% % 0.0% 0.0% 0.0% Appendix A GENERAL RATE CASE REPORT.DOCX November
145 Aon Retirement & Investment Southern California Edison Company Actuarial Assumptions and Methods Table 5 Active Union Withdrawal Rates Years of Service Age % 6.0% 4.5% 4.5% % 6.0% 4.5% 3.0% % 6.0% 4.5% 3.0% % 6.0% 4.5% 2.5% % 6.0% 4.5% 2.0% % 6.0% 4.5% 2.0% % 6.0% 4.5% 2.0% % 0.0% 0.0% 0.0% Appendix A GENERAL RATE CASE REPORT.DOCX November
146 Aon Retirement & Investment Southern California Edison Company Actuarial Assumptions and Methods Table 6 Active Disability Incidence Rates Age Male Female Age Male Female % 0.03% % 0.24% % 0.03% % 0.27% % 0.03% % 0.30% % 0.03% % 0.33% % 0.03% % 0.36% % 0.03% % 0.40% % 0.03% % 0.44% % 0.03% % 0.49% % 0.04% % 0.54% % 0.04% % 0.59% % 0.04% % 0.64% % 0.05% % 0.69% % 0.05% % 0.74% % 0.06% % 0.80% % 0.06% % 0.85% % 0.07% % 0.90% % 0.08% % 0.96% % 0.09% % 1.01% % 0.10% % 1.05% % 0.12% % 1.09% % 0.13% % 0.00% % 0.15% % 0.17% % 0.19% % 0.22% Appendix A GENERAL RATE CASE REPORT.DOCX November
147 Aon Retirement & Investment Southern California Edison Company Summary of Plan Provisions Effective Date of Plan July 1, Employees Eligible for Participation Definitions Base Monthly Pay Regular full-time, part-time and temporary benefit eligible employees hired prior to January 1, 2018 participate immediately. After April 1, 1999, new hires must be employees of Southern California Edison Company, Edison International, Edison Capital or Edison Material Supply LLC in order to participate in the plan. Base pay excluding overtime, bonuses, commissions, and any kinds of special pay. Normal Retirement Age Age 65. Early Retirement Age Hours of Service Credited Service Vesting Service Cash Balance Benefits Effective Date Application Age 55 and five years of service. Effective April 1, 1999 for non-union employees and December 31, 1999 for union employees, 190 hours of service are credited for any calendar month in which at least one hour is worked. A plan year during which a participant has completed at least 2,000 hours of service. A partial year of service is credited for 1,000 to 2,000 hours of service. A plan year during which a participant has at least 1,000 hours of service. April 1, 1999 for non-union employees (non-represented employees and employees represented by Teamsters), and December 31, 1999 for union employees (employees represented by IBEW Local 47, UWUA and SOFA). All benefit eligible employees. (As of the effective dates, employees who were not eligible for grandfathered benefits ceased to accrue benefits under the plan provisions previously in effect.) Appendix A GENERAL RATE CASE REPORT.DOCX November
148 Aon Retirement & Investment Southern California Edison Company Summary of Plan Provisions Cash Balance Benefits (continued) Initial Account Balance Actuarial value of accrued benefit payable at age 65 (reflecting a discount rate of 5.25% and the 1983 GAM mortality table, blended 50%/50% for males/females) plus, for non-union employees, the current value of accumulated unused sick leave benefits (reflecting an increased payout percentage of 45%). Pay Credits Application Amount Added to account balance at the end of each month for which the participant receives additional cash balance service. A percentage of base pay for the month determined in accordance with the following schedule: Age and Service Points Percentage Less than % % % % % % 75 or over 9.0% Transition Credits Application Amount Added to account balance at the end of each month beginning April 1, 1999, or December 31, 1999, and continued for as many months as the employee had months of credited service on April 1, 1999, or December 31, 1999, to a maximum of 96 months. A percentage of base pay for the month determined in accordance with the following schedule: Age and Service Points Percentage Less than % % % 55 and over 6.0% Appendix A GENERAL RATE CASE REPORT.DOCX November
149 Aon Retirement & Investment Southern California Edison Company Summary of Plan Provisions Interest Credits Application Amount Through January 2008 Amount Beginning February 2008 Supplemental Credits Application Amount Death Benefits Added to the cash balance account at the end of each month. All interest rates are applied to the account balance as of the first day of each month. Based on the average 30 year Treasury bond interest rate during the month of August of the preceding calendar year, divided by 12. Based on the third segment lump sum interest rate in effect for the calendar year (average August rates from the preceding year divided by 12), reflecting minimum funding five year phase-out of 30-year Treasury bond interst rates. Added to account balance at the end of each month for which pay credits are added. $150 per month. Minimum death benefit equal to the member s vested cash balance account is payable to designated beneficiary. Benefits for Employees of Certain Non- Regulated Companies Application Benefits Homer City Subsidiary Eligible non-union employees of Edison Mission Energy (including Edison Operations) and Edison Enterprises (and related subsidiaries). Initial balances, transition credits, and interest credits are the same as for all other eligible employees of participating companies. No pay credits or supplemental credits are provided. Employees eligible for grandfathered benefits receive ongoing accruals, offset by the benefits provided by applicable profit sharing plan account balances. New hires do not participate in the Retirement Plan. Non-union employees received initial balances based on all (pre and post-acquisition) accumulated sick leave and plan benefits accrued since acquisition (March 18, 1999). Transition credits were based on total service (pre and postacquisition). No pay credits or supplemental credits are provided. Eligibility for grandfathered benefits is the same as for other employees (reflecting total service) but benefit accruals reflect only post March 18, 1999 service. Appendix A GENERAL RATE CASE REPORT.DOCX November
150 Aon Retirement & Investment Southern California Edison Company Summary of Plan Provisions Benefits for Employees of Certain Non- Regulated Companies (continued) Midwest Power Generation Subsidiary Non-union employees received initial balances equal to 1% of final average pay for each year of pre-acquisition (December 15, 1999) service. Transition credits were based on total pre acquisition service. No pay credits or supplemental credits are provided. Eligibility for grandfathered benefits is the same as for other employees (reflecting total pre acquisition service) but benefit accruals reflect only post acquisition service. Pension Benefits at Normal Retirement ( Grandfathered Formula) Basic Pension Benefit Supplemental Pension Benefit For each year of credited service, a scheduled amount equal to 2% of base monthly pay less $3 (applicable to employees earning over $250 per month). A percentage of average base monthly pay during the highestpaid 36 consecutive months of service offset by a percentage (no more than 40%) of the primary Social Security benefit payable at the later of age 62 or retirement age. The percentage of average monthly earnings is 1¾% per year up to 30 years of service (52.5% maximum at 30 years), plus 1% for each year over 30 years. The percentage of primary Social Security benefit offset is 1 % per year up to 30 years. For participants in service as of September 1, 1978, the benefit will not be less than would have been payable under the prior formula, which is a percentage of average base monthly pay during the highest-paid 60 consecutive months of service offset by a percentage (no more than 45%) of the primary Social Security benefit. The percentage of average monthly pay is 3% per year for the first five years, 2% for each of the next 10 years, 1% for each of the next 15 years (50% maximum at 30 years), and ½% for each additional year thereafter. The offset percentage is 1½% per year up to 30 years. Normal Form of Payment Married participants: 50% joint and survivor annuity (unreduced). Single participants: Single life annuity. Application Effective April 1, 1999 for non-union employees and December 31, 1999 for union employees, ongoing application of these provisions is limited to employees with at least 60 age and service points, or who had attained age 50 as of those dates. Appendix A GENERAL RATE CASE REPORT.DOCX November
151 Aon Retirement & Investment Southern California Edison Company Summary of Plan Provisions Pension Benefits at Early Retirement ( Grandfathered Formula) (continued) Pnesion Benefit Deferred Vested Benefits ( Grandfathered Formula) Deferred Vested Pension Benefit A monthly benefit equal to the accrued benefit calculated as of the early retirement date under the grandfathered benefit formula, with the following reduction: No reduction if payments begin after age 61 1/4% for each full month payments begin before age 61, but after age 60 1/3% for each full month payments begin before age 60 Greater of the current basic pension or a prorata portion of the projected supplemental pension (based on current average basic monthly pay). The benefit is payable as a life annuity for single participants and as a reduced 50% joint and survivor annuity for married participants. Unused Sick Leave Benefits Eligibility Benefit Vesting Provisions The following groups of employees are eligible if they retire on or after their early retirement age: All union employees and grandfathered non-union employees, as well as nongrandfathered non-union employees who were Non-highly compensated employees (NHCEs) in 2005 and incurred a separation from service between January 1, 2005 and December 31, For each 22 days of unused sick leave, one-month payment equal to 20% of base monthly earnings during the highest-paid 36 consecutive months of service. If the number of payments would exceed 24, the monthly amount is increased so that all benefits are paid within 24 months. Eligible non-union employees receive the benefit, provided the value of their unused sick leave and regular grandfathered retirement benefits (for non-grandfathered employees, based on frozen pay and service in 1999) exceeds their cash balance accounts. Grandfathered union employees (except UWUA (including SOFA) employees) were credited with an additional 80 hours of unused sick leave at January 1, Accrued benefits vest at the rate of 20% per year of service, with full vesting after five years; provided, however, that cash balance participants credited with at least one hour of service on or after February 1, 2008 are 20% vested after one year, 40% vested after two years, and 100% vested after three years of service. Benefits may commence immediately upon employment termination. Appendix A GENERAL RATE CASE REPORT.DOCX November
152 Aon Retirement & Investment Southern California Edison Company Summary of Plan Provisions Disability Benefits Disability Benefit Ad Hoc Adjustments Special Terminated Vested Benefits ( Grandfathered Formula) Eligibility Eligibility Benefit A Benefit B Increased Retirement Benefits Pursuant to 1996 Plan Amendments Eligibility A disabled participant continues to accrue service while disabled for up to two years. The disability benefit is calculated based on the participant's base monthly pay as of date of disability. Benefits payable to plan retirees were increased on an ad hoc basis in 1967, 1971, 1974, 1976, 1979, 1982, 1985, 1989, 1995, and For Benefit A All non-union grandfathered employees, and non-union non-grandfathered employees who were NHCEs in 2005 and who terminated employment before age 55, but with 68 age and service points (age plus years of service). For Benefit B non-union employees terminating employment between ages 50 and 55 with 20 years of service and who also attain age 50 and complete 20 years of service by December 31, Immediate benefit commencement with accrued benefit reduced by 23% plus 1/6% each month of age below age 55. (For non-grandfathered employees, the benefit to which the reduction factor is applied is based on frozen pay and service in 1999.) Calculated as if the employee were eligible for early retirement. Payments may begin at any time after age 55. Benefit accruals for purposes of this benefit ceased as of December 31, Non-union, non-executive employees attaining age 47 and completing five years of vesting service by June 30, Union employees meeting these requirements by September 30, Benefit Eight years are added to age and/or service at June 30, 1996/September 30, 1996 to produce the largest early retirement benefit under supplemental pension formula A. Retirement benefit can never be less than this amount. Form of Payment Retirement benefit calculated pursuant to the amendment can be paid as an annuity, immediate lump sum, or 80% annuity/20% lump sum. Appendix A GENERAL RATE CASE REPORT.DOCX November
153 Aon Retirement & Investment Southern California Edison Company Appendix B Appendix B GENERAL RATE CASE REPORT.DOCX November
154 Aon Southern California Edison Company Retirement & Investment Exhibit 7 Projected Funding Policy Contribution for Non-Regulated Companies A. Funding Policy Normal Cost 1. Total Present Value of Benefits at 1/1 $ 72,953,000 $ 70,693,000 $ 69,987,000 $ 68,354, Actuarial Value of Plan Assets (44,386,000) (43,838,000) (44,734,000) (44,599,000) 3. Book Reserves Present Value of Future Normal Cost $ 28,567,000 $ 26,855,000 $ 25,253,000 $ 23,755, Present Value of Future Covered Payrolls N/A N/A N/A N/A 6. Normal Cost Percentage at 1/1 N/A N/A N/A N/A 7. Total Covered Payroll N/A N/A N/A N/A 8. Expenses included in Normal Cost N/A N/A N/A N/A 9. Funding Policy Normal Cost a. Assuming Payment at 1/1 $ 3,269,000 $ 3,100,000 $ 2,900,000 $ 2,700,000 b. Assuming Payment at 12/31 $ 3,482,000 $ 3,300,000 $ 3,100,000 $ 2,900,000 c. Assuming Quarterly Payments $ 3,399,000 $ 3,200,000 $ 3,000,000 $ 2,800, Funding Policy/Minimum Required Contribution, $ 3,399,000 $ 3,200,000 $ 3,000,000 $ 2,800,000 Assuming Quarterly Payments Appendix B GENERAL RATE CASE REPORT.DOCX November
155 Aon Southern California Edison Company Retirement & Investment Exhibit 8 Projected Funding Policy Actuarial Value of Assets for Non-Regulated Companies A Actuarial Value of Trust Fund Assets at Preceding 1/1 1. Actuarial Value of Assets at Preceding 1/1 $ 44,050,000 $ 44,386,000 $ 43,838,000 $ 44,734, Contributions Receivable at Preceding 1/ Net Actuarial Value of Assets = (1) - (2) $ 44,050,000 $ 44,386,000 $ 43,838,000 $ 44,734,000 B. Increases/Decreases during Preceding Year 1. Contributions $ 4,038,000 $ 3,399,000 $ 3,195,000 $ 3,005, Assumed Investment Income 3,004,000 2,775,045 2,786,361 2,810, Benefit Payments (6,785,000) (6,785,000) (5,136,822) (5,990,287) 4. Total (1) + (2) - (3) $ 257,000 $ (610,955) $ 844,539 $ (174,599) C. Unadjusted Actuarial Value of Assets at 1/1 = (A) + (B) $ 44,307,000 $ 43,775,000 $ 44,683,000 $ 44,559,000 D. Market Value of Assets at 1/1 1. Trust Fund Value $ 44,624,000 $ 44,029,000 $ 44,885,000 $ 44,721, Contributions Receivable Total (1) + (2) $ 44,624,000 $ 44,029,000 $ 44,885,000 $ 44,721,000 E. Actuarial Value of Assets at 1/1 1. Unadjusted Actuarial Value $ 44,307,000 $ 43,775,000 $ 44,683,000 $ 44,559, Adjustment Related to Market Value = 0.25 x [(D1) - (C)] 79,000 63,000 51,000 40, Contributions Receivable at 1/ Actuarial Value of Assets = (1) + (2) + (3) $ 44,386,000 $ 43,838,000 $ 44,734,000 $ 44,599,000 F. Adjusted Actuarial Value of Assets $ 44,386,000 $ 43,838,000 $ 44,734,000 $ 44,599,000 (E4), but within 80%/120% of (D3) Appendix B GENERAL RATE CASE REPORT.DOCX November
156 Aon Southern California Edison Company Retirement & Investment Exhibit 9 Projected IRS Minimum Contributions for Non-Regulated Companies A. Funding Shortfall/(Surplus) 1. Funding Target Liability at 1/1 $ 67,476,000 $ 69,827,823 $ 70,950,035 $ 71,196, Actuarial Value of Assets (48,536,000) (47,065,000) (47,916,000) (47,575,000) 3. Prefunding Balance 4,204,000 8,097,195 8,390,734 8,148, Funding Shortfall/(Excess) $ 23,144,000 $ 30,860,018 $ 31,424,769 $ 31,769,356 B. Shortfall Amortization Payment 1. 7 years remaining $ - $ 2,393,851 $ 269,970 $ 459, years remaining - - 2,393, , years remaining ,393, years remaining years remaining years remaining years remaining Total $ - $ 2,393,851 $ 2,663,821 $ 3,123,704 C. Minimum Required Contribution 1. Target Normal Cost at 1/1 $ 962,000 $ 1,019,720 $ 1,080,903 $ 1,145, Credit for Excess Assets (962,000) Adjusted Target Normal Cost $ - $ 1,019,720 $ 1,080,903 $ 1,145, Shortfall Amortization Payment = (B8) - 2,393,851 2,663,821 3,123, Preliminary Minimum Required Contribution (MRC) - 3,413,571 3,744,725 4,269, Prefunding Credit Balance Applied to MRC - (3,413,571) (3,744,725) (4,269,461) 7. Following Year Contribution Attributed to Current Year (3,399,000) (3,195,000) (3,005,000) - 8. Minimum Required Contribution at 1/1 (Not less than $0) $ - $ - $ - $ - Appendix B GENERAL RATE CASE REPORT.DOCX November
157 Aon Southern California Edison Company Retirement & Investment Exhibit 10 Projected Actuarial Value of Assets for Non-Regulated Companies A. Market value of assets, January 1: 1. Trust fund value $ 44,624,000 $ 44,029,000 $ 44,885,000 $ 44,721, Contribution Receivable 3,307,000 3,109,000 2,924,000 2,750, Total = (1) + (2) $ 47,931,000 $ 47,138,000 $ 47,809,000 $ 47,471,000 B Prior year gains/(losses) 1. Initial asset gain/(loss) for year-2 $ (2,680,000) $ 432,000 $ (108,000) $ (106,000) 2. Weight Unrecognized amount $ (893,000) $ 144,000 $ (36,000) $ (35,000) 4. Initial asset gain/(loss) for year-1 $ 432,000 $ (108,000) $ (106,000) $ (104,000) 5. Weight Unrecognized amount $ 288,000 $ (72,000) $ (71,000) $ (69,000) 7. Total Amount unrecognized $ (605,000) $ 72,000 $ (107,000) $ (104,000) 8. Preliminary Actuarial Value of Plan assets = (A3) - (B7) $ 48,536,000 $ 47,066,000 $ 47,916,000 $ 47,575,000 C. Market Value of Trust Fund Assets at 1/1/t 1. Lower Bound = 0.90 x (A3) $ 43,137,900 $ 42,424,200 $ 43,028,100 $ 42,723, Upper Bound = 1.10 x (A3) $ 52,724,100 $ 51,851,800 $ 52,589,900 $ 52,218, Actuarial Value of Assets at 1/1/t $ 48,536,000 $ 47,066,000 $ 47,916,000 $ 47,575,000 =Greater of (B8) and (C1), No greater than (C2) Appendix B GENERAL RATE CASE REPORT.DOCX November
158 SOUTHERN CALIFORNIA EDISON POSTRETIREMENT HEALTH & LIFE BENEFITS PROJECTED ACCOUNTING VALUATION RESULTS FOR PLAN YEARS 2017 THROUGH 2020 Exhibit 1 Determination of Net Periodic Postretirement Benefit Cost (ASC ) (in $ thousands) A. Service Cost (EOY) 1. Before Adjustment $ 30,858 $ 32,401 $ 31,606 $ 30, SONGS Adjustment ($ 795) ($ 835) ($ 814) ($ 794) 3. Total = (1) + (2) $ 30,063 $ 31,566 $ 30,792 $ 30,037 B. Interest Cost 1. APBO $ 87,038 $ 88,188 $ 89,296 $ 90, Expected Benefit Payments 1,893 $ 1,970 2,033 2, Total = (1) - (2) $ 85,145 $ 86,218 $ 87,263 $ 88,186 C. Expected Return on Assets * 1. Market Value of Assets $ 111,605 $ 113,605 $ 115,516 $ 117, Expected Benefit Payments 1,945 $ 2,047 2,135 2, Expected Contributions 0 $ Total = (1) - (2) + (3) $ 109,660 $ 111,558 $ 113,381 $ 115,131 D. Net Amortization Amounts 1. Transition (Asset)/Obligation $ 0 $ 0 $ 0 $ 0 2. Prior Service Cost ( 2,465) ($ 1,231) ( 1,231) ( 1,231) 3. Net (Gain)/Loss 0 $ Total = (1) + (2) + (3) ($ 2,465) ($ 1,231) ($ 1,231) ($ 1,231) E. Special Termination Charge $ 0 $ 0 $ 0 $ 0 F. Net Periodic Postretirement Benefit Cost = (A) + (B3) - (C4) + (D4) + (E) $ 3,083 $ 4,995 $ 3,443 $ 1,861 * Interest rate for return on assets for Union trust, 1992 VEBA trust and 1999 VEBA trust is 4.75%, and for other funding vehicles is 6.5%. 11/6/2017 1
159 SOUTHERN CALIFORNIA EDISON POSTRETIREMENT HEALTH & LIFE BENEFITS PROJECTED ACCOUNTING VALUATION RESULTS FOR PLAN YEARS 2017 THROUGH 2020 Exhibit 2 Development and Reconciliation of (Accrued)/Prepaid Benefit Cost (ASC ) (in $ thousands) A. Funded Status as of 1/ APBO $2,028,878 $2,055,673 $2,081,494 $2,104, Market Value of Assets 2,109,742 2,142,882 2,173,923 2,203, Funded Status = (2) - (1) $ 80,864 $ 87,209 $ 92,429 $ 98, Unrecognized Transition (Asset)/Obligation Unrecognized Prior Service Cost ( 13,795) ( 11,330) ( 10,099) ( 8,868) 6. Unrecognized Net (Gain)/Loss ( 198,158) ( 198,158) ( 198,158) ( 198,158) 7. (Accrued)/Prepaid Benefit Cost = (3) + (4) + (5) + (6) ($ 131,089) ($ 122,279) ($ 115,828) ($ 108,257) B. Reconciliation of Funded Status 1. (Accrued)/Prepaid Benefit Cost at 1/1/t-1 ($ 131,089) ($ 131,089) ($ 122,279) ($ 115,828) 2. NPPBC for t-1 19,132 3,878 5,830 4, Contributions for t-1 20,888 12,688 12,281 11, Adjustments for t-1 ( 1,756) (Accrued)/Prepaid Benefit Cost at 1/1/t = (1)-(2)+(3)+(4) ($ 131,089) ($ 122,279) ($ 115,828) ($ 108,257) 11/6/2017 2
160 SOUTHERN CALIFORNIA EDISON POSTRETIREMENT HEALTH & LIFE BENEFITS PROJECTED ACCOUNTING VALUATION RESULTS FOR PLAN YEARS 2017 THROUGH 2020 Exhibit 3 Development of Projected Market Value of Assets as of Year End (in $ thousands) A. Assets at 1/1 $2,109,742 $2,142,882 $2,173,923 $2,203,326 B. Additions 1. Contributions $ 12,688 $ 12,281 $ 11,828 $ 11, Investment Income 109, , , , Total Additions= (1) + (2) $ 122,348 $ 123,839 $ 125,209 $ 126,413 C. Benefit Payments $ 89,208 $ 92,798 $ 95,806 $ 98,910 D. Assets at 12/31 = (A) + (B3) - (C) $2,142,882 $2,173,923 $2,203,326 $2,230,829 11/6/2017 3
161 SOUTHERN CALIFORNIA EDISON POSTRETIREMENT HEALTH & LIFE BENEFITS PROJECTED ACCOUNTING VALUATION RESULTS FOR PLAN YEARS 2017 THROUGH 2020 Exhibit 4 Bases for Unrecognized Prior Service Cost (in $ thousands) Unrecognized Prior Service Cost at preceding 1/1 ($ 9,494) ($ 13,795) ($ 11,330) ($ 10,099) 2. Plan Amendment ( 6,840) Prior Service Cost Amortization Amount ( 2,539) ( 2,465) ( 1,231) ( 1,231) 4. Unrecognized Prior Service Cost at 1/1 = (1) + (2) - (3) ($ 13,795) ($ 11,330) ($ 10,099) ($ 8,868) 11/6/2017 4
162 SOUTHERN CALIFORNIA EDISON POSTRETIREMENT HEALTH & LIFE BENEFITS PROJECTED ACCOUNTING VALUATION RESULTS FOR PLAN YEARS 2017 THROUGH 2020 Exhibit 5 Projected Annual Postretirement Health and Life Claims (in $ thousands) Postretirement Health Represented Management Life Year Employees Employees Insurance Total ,063 57,395 1,750 89, ,249 59,791 1,758 92, ,209 61,832 1,765 95, ,066 64,072 1,772 98,910 11/6/2017 5
163 Southern California Edison 2018 GRC Impact of Accounting Change on Capitalization $ in Thousands Summary of Capitalization Impacts $ Change Original Forecast Before Accounting Change 70,700 Updated Forecast Before Accounting Change 37,416 (33,283) Updated Forecast After Accounting Change 71,842 34,426 Net Change in Capitalization 1,143 Detail of Capitalization Impact Original Forecast Before Split Updated Forecast Before Split Updated Forecast After Split Service Non-Service Total Service Non-Service Total Service Non-Service Total Executive Benefits 21,060 21,060 21,060 21,060 5,265 15,795 21,060 Capitalization % 45.5% 45.5% 45.5% Capitalization $ 9,582 9,582 9,582 9,582 2,396 2,396 PBOP 36,850 36,850 3,433 3,433 31,063 (27,630) 3,433 Capitalization % 45.5% 45.5% 45.5% Capitalization $ 16,767 16,767 1,562 1,562 14,134 14,134 Pensions 97,474 97,474 57,741 57, ,567 (63,826) 57,741 Capitalization % 45.5% 45.5% 45.5% Capitalization $ 44,351 44,351 26,272 26,272 55,313 55,313 Total Capitalization $ 70,700 70,700 37,416 37,416 71,842 71,842
164 Appendix F Attachments for Chapter VII
165
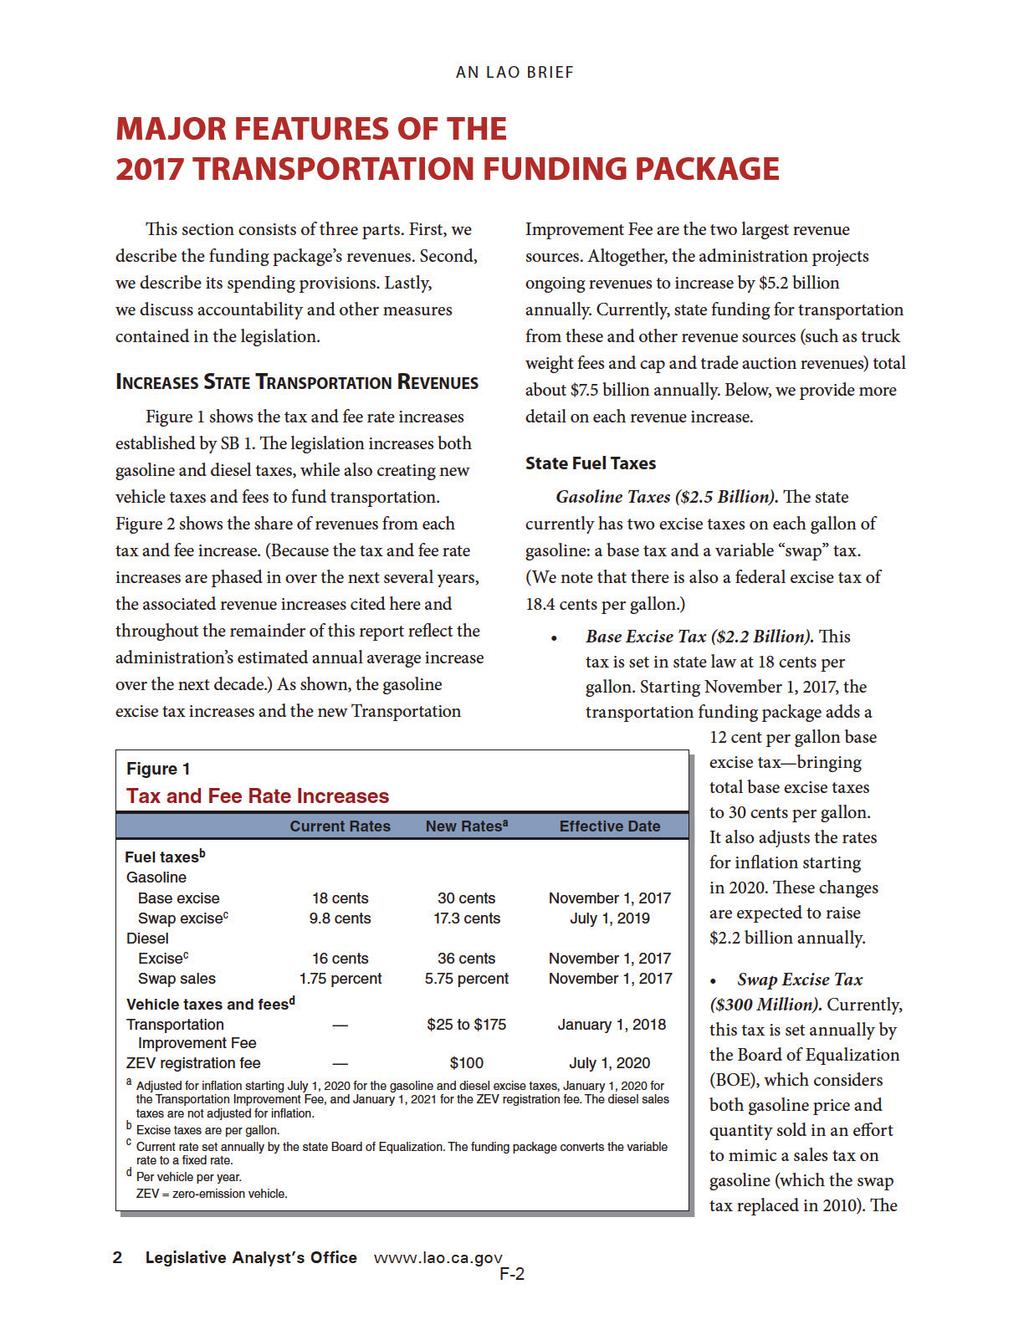
166
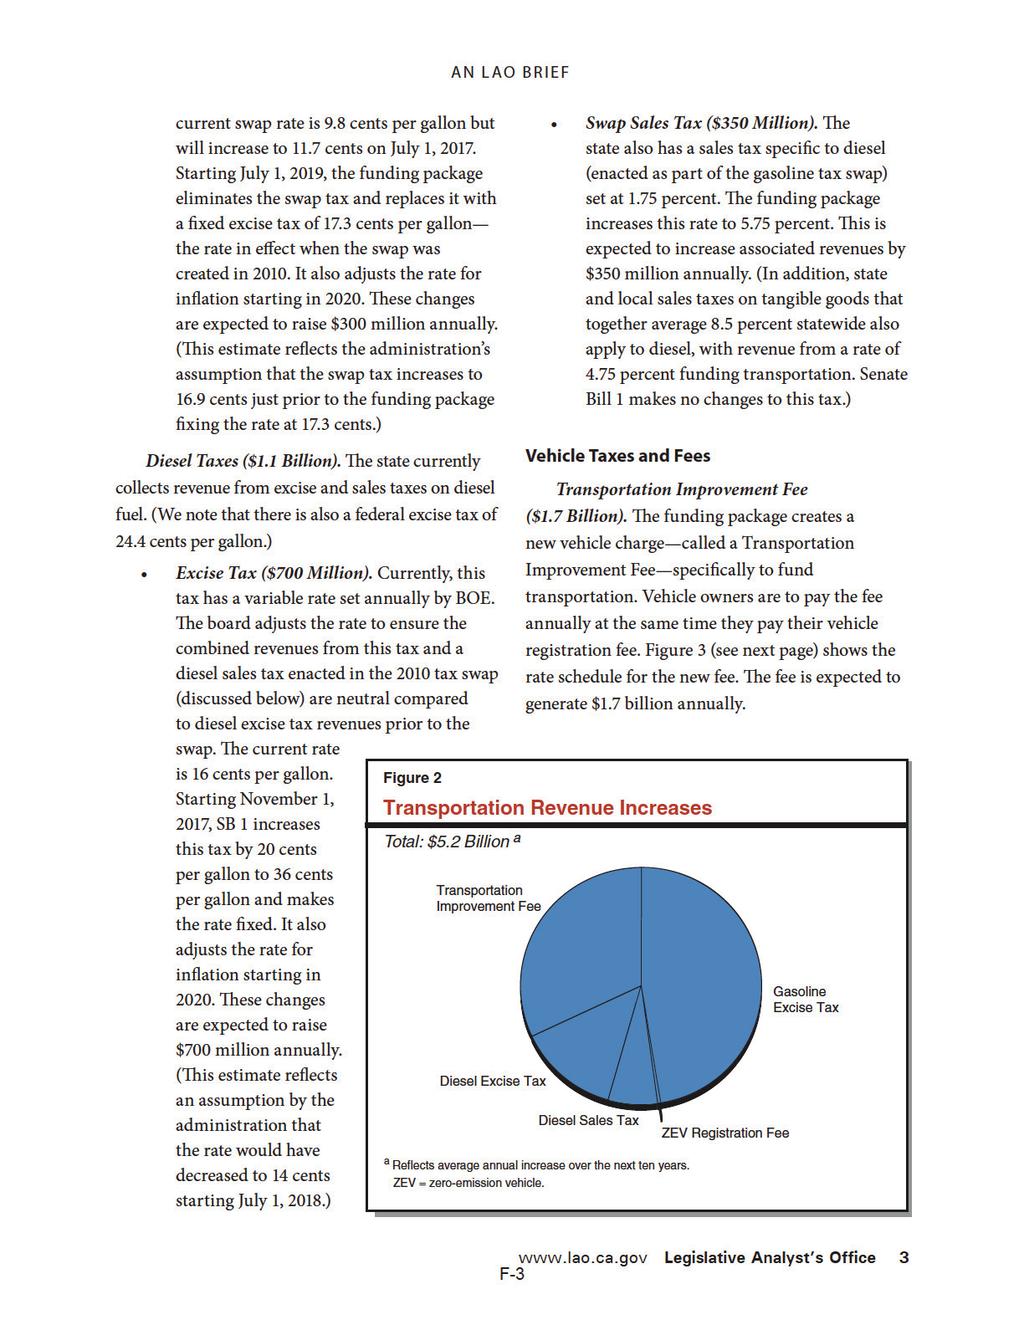
167
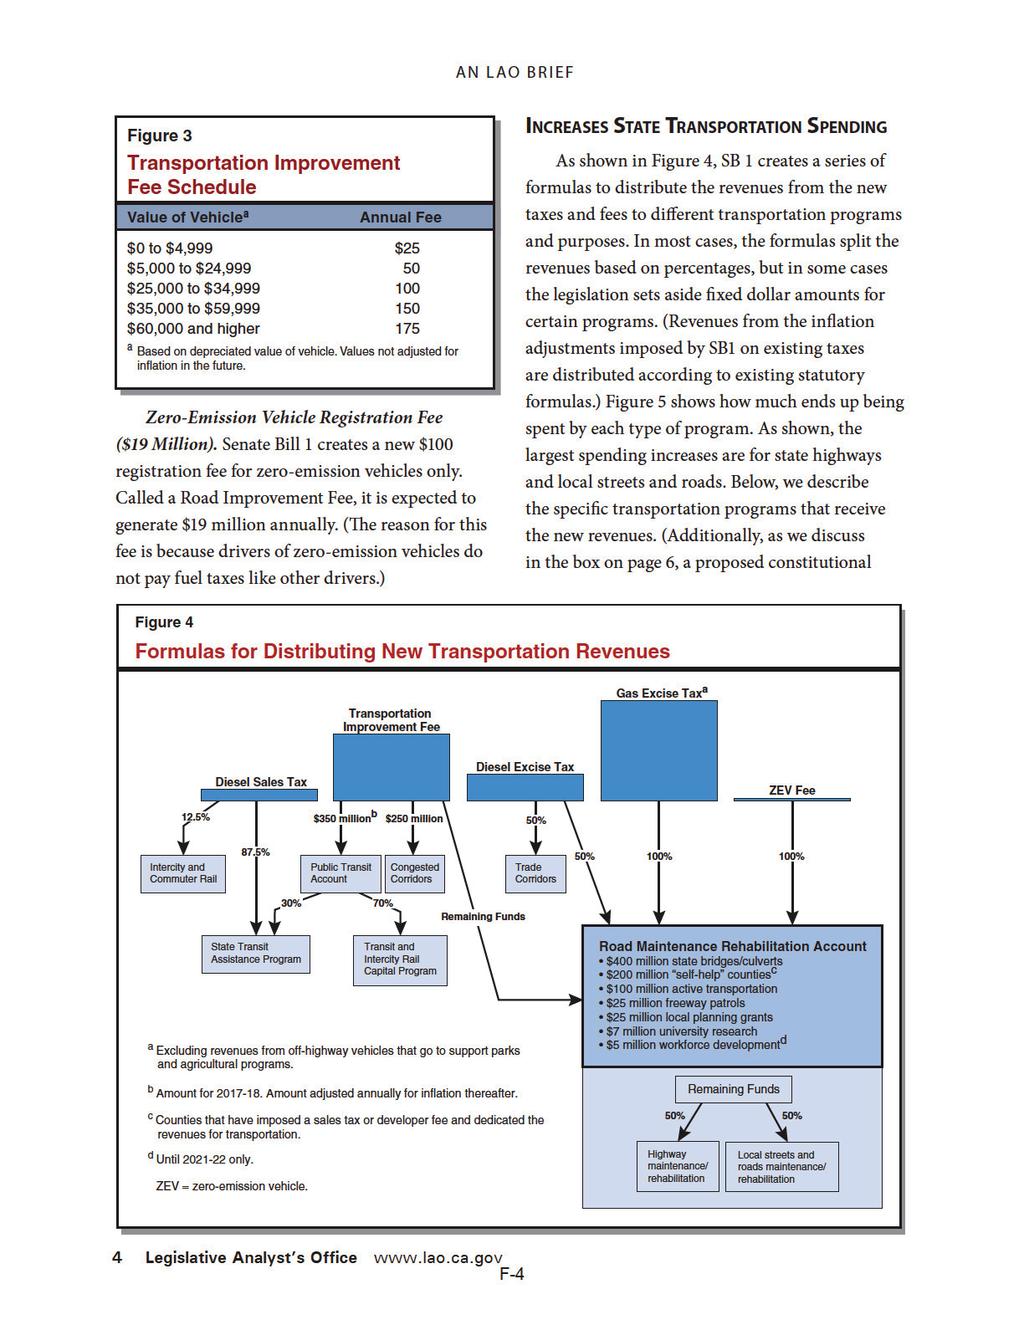
168
169
2015 General Rate Case
 Application No.: Exhibit No.: Witnesses: A.13-11-003 SCE-73 T. Cameron R. Fisher G. Henry C. Hu M. Marelli D. Snow P. Wong (U 338-E) 2015 General Rate Case PUBLIC VERSION Update Testimony Before the Public
2018 General Rate Case
 Application No.: Exhibit No.: Witnesses: A.16-09-001 SCE-60 M. Childs J. McCarson S. Menon D. Tessler (U 338-E) 2018 General Rate Case Tax Update Before the Public Utilities Commission of the State of
PRELIMINARY STATEMENT Sheet 1. J. Pole Loading and Deteriorated Pole Programs Balancing Account
 Southern California Edison Revised Cal. PUC Sheet No. 60654-E Rosemead, California (U 338-E) Cancelling Original Cal. PUC Sheet No. 57949-E PRELIMINARY STATEMENT Sheet 1 J. Pole Loading and Deteriorated
Southern California Edison Revised Cal. PUC Sheet No E Rosemead, California (U 338-E) Cancelling Revised Cal. PUC Sheet No.
 Cancelling Revised Cal. PUC Sheet No.") Southern California Edison Revised Cal. PUC Sheet No. 56089-E Rosemead, California (U 338-E) Cancelling Revised Cal. PUC Sheet No. 56203-E PRELIMINARY STATEMENT Sheet 2 N. MEMORANDUM ACCOUNTS 2. Definitions.
Southern California Edison Revised Cal. PUC Sheet No. 56089-E Rosemead, California (U 338-E) Cancelling Revised Cal. PUC Sheet No. 56203-E PRELIMINARY STATEMENT Sheet 2 N. MEMORANDUM ACCOUNTS 2. Definitions.
Supplemental Information
 Application No: Exhibit No: Witnesses: A.1-0-01 SCE- P. T. Hunt D. Snow (U -E) Supplemental Information Before the Public Utilities Commission of the State of California Rosemead, California June, 01 01
(U 338-E) 2018 General Rate Case A Workpapers. RO-Cost Escalation SCE-09 Volume 01, Chapter VII
 2018 General Rate Case A Workpapers. RO-Cost Escalation SCE-09 Volume 01, Chapter VII") (U 338-E) 208 General Rate Case A.6-09- Workpapers RO-Cost Escalation SCE-09 Volume 0, Chapter VII September 206 Workpaper Southern California Edison / 208 GRC 2 3 4 5 6 7 8 9 0 2 3 4 5 6 7 8 9 20 2 22
(U 338-E) 208 General Rate Case A.6-09- Workpapers RO-Cost Escalation SCE-09 Volume 0, Chapter VII September 206 Workpaper Southern California Edison / 208 GRC 2 3 4 5 6 7 8 9 0 2 3 4 5 6 7 8 9 20 2 22
2018 General Rate Case. Tax Update Rebuttal
 Application No.: Exhibit No.: Witnesses: A.16-09-001 SCE-61 M. Childs J. McCarson S. Menon (U 338-E) 2018 General Rate Case Tax Update Rebuttal Before the Public Utilities Commission of the State of California
Dynamic Pricing Proposals of Southern California Edison Company in Compliance with D
 Application No.: Exhibit No.: Witnesses: A.-0- SCE-01 Russ Garwacki Robert Thomas Lisa Vellanoweth (U -E) Dynamic Pricing Proposals of Southern California Edison Company in Compliance with D.0-0-0 Before
2018 General Rate Case
 Application No.: A.-0- Exhibit No.: SCE-0, Vol. A Witnesses: M. Bennett G. Henry C. Hernandez J. Trapp R. Worden (U -E) 0 General Rate Case ERRATA Human Resources (HR) Volume Benefits And Other Compensation
ADVICE LETTER (AL) SUSPENSION NOTICE ENERGY DIVISION
 SUSPENSION NOTICE ENERGY DIVISION") ADVICE LETTER (AL) SUSPENSION NOTICE ENERGY DIVISION Utility Name: Southern California Edison Co. Utility Number/Type: U 338-E Advice Letter Number(s): 3695-E Date AL(s) Filed: Nov. 16, 2017 Utility Contact
ADVICE LETTER (AL) SUSPENSION NOTICE ENERGY DIVISION Utility Name: Southern California Edison Co. Utility Number/Type: U 338-E Advice Letter Number(s): 3695-E Date AL(s) Filed: Nov. 16, 2017 Utility Contact
Southern California Edison Company s Supplemental Exhibit in Response to Administrative Law Judge s May 6, Ruling
 Application No.: Exhibit No.: Witnesses: A.1-11-00 SCE- Douglas Snow Melvin Stark (U -E) Southern California Edison Company s Supplemental Exhibit in Response to Administrative Law Judge s May, 01 Email
Southern California Edison Revised Cal. PUC Sheet No E Rosemead, California Cancelling Revised Cal. PUC Sheet No E
 Southern California Edison Revised Cal. PUC Sheet No. 35321-E Rosemead, California Cancelling Revised Cal. PUC Sheet No. 35307-E PRELIMINARY STATEMENT Sheet 1 ELECTRIC DISTRIBUTION REVENUE ADJUSTMENT BALANCING
SECOND REVISED SDG&E DIRECT TESTIMONY OF KENNETH J. DEREMER (POST-TEST YEAR RATEMAKING) April 6, 2018
 April 6, 2018") Company: San Diego Gas & Electric Company (U 0 M) Proceeding: 01 General Rate Case Application: A.1--00 Exhibit: SDG&E--R SECOND REVISED SDG&E DIRECT TESTIMONY OF KENNETH J. DEREMER (POST-TEST YEAR RATEMAKING)
Company: San Diego Gas & Electric Company (U 0 M) Proceeding: 01 General Rate Case Application: A.1--00 Exhibit: SDG&E--R SECOND REVISED SDG&E DIRECT TESTIMONY OF KENNETH J. DEREMER (POST-TEST YEAR RATEMAKING)
October 26, 2017 Advice Letter 3665-E
 STATE OF CALIFORNIA PUBLIC UTILITIES COMMISSION SAN FRANCISCO, CA 94102-3298 Edmund G. Brown Jr., Governor October 26, 2017 Advice Letter 3665-E Russell G. Worden Director, Regulatory Operations Southern
Amended Energy Resource Recovery Account (ERRA) Review Of Operations, 2017 Chapters VIII-XVI
 Review Of Operations, 2017 Chapters VIII-XVI") Application No.: A.18-03-016 Exhibit No.: SCE-02A Witnesses: G. Ahn T. Frontino J. Barrett G. Henry M. Bennett C. Jacobs K. Blebu K. Koyano T. Cameron M. Litos E. Castano J. Montanye D. Coher A. Quon E.
Application No.: A.18-03-016 Exhibit No.: SCE-02A Witnesses: G. Ahn T. Frontino J. Barrett G. Henry M. Bennett C. Jacobs K. Blebu K. Koyano T. Cameron M. Litos E. Castano J. Montanye D. Coher A. Quon E.
REVISED PREPARED DIRECT TESTIMONY OF JACK S. LEWIS ON BEHALF OF SOUTHERN CALIFORNIA GAS COMPANY
 Application of San Diego Gas & Electric Company (U0M) for Authority, Among Other Things, to Increase Rates and Charges for Electric and Gas Service Effective on January, 0. A.0--00 (Filed December, 00)
Southern California Edison Revised Cal. PUC Sheet No E Rosemead, California (U 338-E) Cancelling Revised Cal. PUC Sheet No.
 Cancelling Revised Cal. PUC Sheet No.") Southern California Edison Revised Cal. PUC Sheet No. 64087-E Rosemead, California (U 338-E) Cancelling Revised Cal. PUC Sheet No. 62826-E PRELIMINARY STATEMENT Sheet 1 Y. Demand Response Program Balancing
Southern California Edison Revised Cal. PUC Sheet No. 64087-E Rosemead, California (U 338-E) Cancelling Revised Cal. PUC Sheet No. 62826-E PRELIMINARY STATEMENT Sheet 1 Y. Demand Response Program Balancing
PREPARED DIRECT TESTIMONY OF JACK S. LEWIS ON BEHALF OF SOUTHERN CALIFORNIA GAS COMPANY
 Application of Southern California Gas Company for authority to update its gas revenue requirement and base rates effective on January 1, 01. (U0G) Application -1- Exhibit No.: (SCG-) PREPARED DIRECT TESTIMONY
Southern California Edison Revised Cal. PUC Sheet No E Rosemead, California (U 338-E) Cancelling Revised Cal. PUC Sheet No.
 Cancelling Revised Cal. PUC Sheet No.") Southern California Edison Revised Cal. PUC Sheet No. 60626-E Rosemead, California (U 338-E) Cancelling Revised Cal. PUC Sheet No. 58142-E PRELIMINARY STATEMENT Sheet 1 CC. Statewide Marketing, Education
Southern California Edison Revised Cal. PUC Sheet No. 60626-E Rosemead, California (U 338-E) Cancelling Revised Cal. PUC Sheet No. 58142-E PRELIMINARY STATEMENT Sheet 1 CC. Statewide Marketing, Education
2015 General Rate Case
 Application No.: Exhibit No.: SCE-0, Vol. 01, Pt. 1 Witnesses: A. Herrera G. Huckaby (U -E) 01 General Rate Case Financial, Legal, and Operational Services (FL&OS) Volume 1, Part 1 Financial Services Department
Southern California Edison Revised Cal. PUC Sheet No E Rosemead, California (U 338-E) Cancelling Revised Cal. PUC Sheet No.
 Cancelling Revised Cal. PUC Sheet No.") Southern California Edison Revised Cal. PUC Sheet No. 60626-E Rosemead, California (U 338-E) Cancelling Revised Cal. PUC Sheet No. 58142-E PRELIMINARY STATEMENT Sheet 1 CC. Statewide Marketing, Education
Southern California Edison Revised Cal. PUC Sheet No. 60626-E Rosemead, California (U 338-E) Cancelling Revised Cal. PUC Sheet No. 58142-E PRELIMINARY STATEMENT Sheet 1 CC. Statewide Marketing, Education
Advice Letters 3072-E and 3072-E-A
 STATE OF CALIFORNIA PUBLIC UTILITIES COMMISSION SAN FRANCISCO, CA 94102-3298 Edmund G. Brown Jr., Governor August 19, 2014 Advice Letters 3072-E and 3072-E-A Megan Scott-Kakures Vice President, Regulatory
2018 General Rate Case Rebuttal Testimony
 Application No.: A.1-09-001 Exhibit No.: -, Vol. 01 A Witnesses: D. Daigler D. McMullen T. Guntrip D. Neal P. Jeske S. Schuffels K. Landrith (U 8-E) 018 General Rate Case Rebuttal Testimony ERRATA Operational
BEFORE THE PUBLIC UTILITIES COMMISSION OF THE STATE OF CALIFORNIA ) ) ) ) ) ) ) )
 ) ) ) ) ) ) )") BEFORE THE PUBLIC UTILITIES COMMISSION OF THE STATE OF CALIFORNIA Application of Southern California Edison Company (U 338-E To Establish Marginal Costs, Allocate Revenues, And Design Rates In the Matter
BEFORE THE PUBLIC UTILITIES COMMISSION OF THE STATE OF CALIFORNIA Application of Southern California Edison Company (U 338-E To Establish Marginal Costs, Allocate Revenues, And Design Rates In the Matter
SECOND REVISED SOCALGAS DIRECT TESTIMONY OF JAWAAD A. MALIK (POST-TEST YEAR RATEMAKING) April 6, 2018
 April 6, 2018") Company: Southern California Gas Company (U 0 G) Proceeding: 01 General Rate Case Application: A.1--00 Exhibit: SCG--R SECOND REVISED SOCALGAS DIRECT TESTIMONY OF JAWAAD A. MALIK (POST-TEST YEAR RATEMAKING)
Company: Southern California Gas Company (U 0 G) Proceeding: 01 General Rate Case Application: A.1--00 Exhibit: SCG--R SECOND REVISED SOCALGAS DIRECT TESTIMONY OF JAWAAD A. MALIK (POST-TEST YEAR RATEMAKING)
Southern California Edison Revised Cal. PUC Sheet No E Rosemead, California (U 338-E) Cancelling Revised Cal. PUC Sheet No.
 Cancelling Revised Cal. PUC Sheet No.") Southern California Edison Revised Cal. PUC Sheet No. 21344-E Rosemead, California (U 338-E) Cancelling Revised Cal. PUC Sheet No. 18069-E PRELIMINARY STATEMENT Sheet 1 N. MEMORANDUM ACCOUNTS 1. Purpose.
Southern California Edison Revised Cal. PUC Sheet No. 21344-E Rosemead, California (U 338-E) Cancelling Revised Cal. PUC Sheet No. 18069-E PRELIMINARY STATEMENT Sheet 1 N. MEMORANDUM ACCOUNTS 1. Purpose.
SOCALGAS DIRECT TESTIMONY OF RYAN HOM (UPDATED RESULTS OF OPERATIONS REPORT) January 2018
 January 2018") Company: Southern California Gas Company (U 904 G) Proceeding: 2019 General Rate Case Application: A.17-10-008 Exhibit: SCG-48 SOCALGAS DIRECT TESTIMONY OF RYAN HOM (UPDATED RESULTS OF OPERATIONS REPORT)
Company: Southern California Gas Company (U 904 G) Proceeding: 2019 General Rate Case Application: A.17-10-008 Exhibit: SCG-48 SOCALGAS DIRECT TESTIMONY OF RYAN HOM (UPDATED RESULTS OF OPERATIONS REPORT)
SUBJECT: Establishment of the Transportation Electrification Portfolio Balancing Account Pursuant to D
 STATE OF CALIFORNIA Edmund G. Brown Jr., Governor PUBLIC UTILITIES COMMISSION 505 VAN NESS AVENUE SAN FRANCISCO, CA 94102-3298 February 26, 2018 Advice Letter 3734-E Russell G. Worden Director, State Regulatory
SOUTHERN CALIFORNIA GAS COMPANY ADVANCED METERING INFRASTRUCTURE CHAPTER VII SOCALGAS AMI BUSINESS CASE MODELING METHODOLOGY AND REVENUE REQUIREMENT
 Application No.: A.08-09-023 Exhibit No.: SCG 7 Date: March 6, 2009 Witness: Michael W. Foster SOUTHERN CALIFORNIA GAS COMPANY ADVANCED METERING INFRASTRUCTURE CHAPTER VII SOCALGAS AMI BUSINESS CASE MODELING
Excerpt of D On Test Year 2012 General Rate Case For Southern California Edison Company (Pages 1-5, 13-14, , & )
") Application No.: Exhibit No.: Witnesses: A.13-11-003 SCE-45 T. Godfrey (U 338-E) Excerpt of D.12-11-051 On Test Year 2012 General Rate Case For Southern California Edison Company (Pages 1-5, 13-14, 209-211,
Application No.: Exhibit No.: Witnesses: A.13-11-003 SCE-45 T. Godfrey (U 338-E) Excerpt of D.12-11-051 On Test Year 2012 General Rate Case For Southern California Edison Company (Pages 1-5, 13-14, 209-211,
Exhibit A Affidavit of Alan Varvis
 Affidavit of Alan Varvis Page 1 of 9 UNITED STATES OF AMERICA BEFORE THE FEDERAL ENERGY REGULATORY COMMISSION Southern California Edison Company ) Docket No. ER16- -000 AFFIDAVIT OF ALAN VARVIS FOR SOUTHERN
Southern California Edison Revised Cal. PUC Sheet No E Rosemead, California (U 338-E) Cancelling Revised Cal. PUC Sheet No.
 Cancelling Revised Cal. PUC Sheet No.") Southern California Edison Revised Cal. PUC Sheet No. 58914-E Rosemead, California (U 338-E) Cancelling Revised Cal. PUC Sheet No. 57616-E Schedule CPP Sheet 1 APPLICABILITY This Schedule is optional for
Southern California Edison Revised Cal. PUC Sheet No. 58914-E Rosemead, California (U 338-E) Cancelling Revised Cal. PUC Sheet No. 57616-E Schedule CPP Sheet 1 APPLICABILITY This Schedule is optional for
REVISED SOCALGAS DIRECT TESTIMONY OF RONALD M. VAN DER LEEDEN POST-TEST YEAR RATEMAKING. March 2015
 Company: Southern California Gas Company (U 0 G) Proceeding: 01 General Rate Case Application: A.1--00 Exhibit: SCG--R REVISED SOCALGAS DIRECT TESTIMONY OF RONALD M. VAN DER LEEDEN POST-TEST YEAR RATEMAKING
PRELIMINARY STATEMENT Sheet 1. NNN. Transportation Electrification Portfolio Balancing Account (TEPBA)
") Southern California Edison Revised Cal. PUC Sheet No. 64055-E Rosemead, California (U 338-E) Cancelling Original Cal. PUC Sheet No. 63233-E PRELIMINARY STATEMENT Sheet 1 NNN. Transportation Electrification
Southern California Edison Revised Cal. PUC Sheet No. 64055-E Rosemead, California (U 338-E) Cancelling Original Cal. PUC Sheet No. 63233-E PRELIMINARY STATEMENT Sheet 1 NNN. Transportation Electrification
Southern California Edison Revised Cal. PUC Sheet No E Rosemead, California (U 338-E) Cancelling Revised Cal. PUC Sheet No.
 Cancelling Revised Cal. PUC Sheet No.") Southern California Edison Revised Cal. PUC Sheet No. 28658-E Rosemead, California (U 338-E) Cancelling Revised Cal. PUC Sheet No. 27754-E INCREMENTAL SALES RATE AGREEMENT (To be inserted by utility) Issued
Southern California Edison Revised Cal. PUC Sheet No. 28658-E Rosemead, California (U 338-E) Cancelling Revised Cal. PUC Sheet No. 27754-E INCREMENTAL SALES RATE AGREEMENT (To be inserted by utility) Issued
2018 General Rate Case
 Application No.: A.1-0- Exhibit No.: SCE-0, Vol. Witnesses: M. Childs D. Gunn P. Hunt D. Lee J. McCarson (U -E) 01 General Rate Case Public Version Before the Public Utilities Commission of the State of
PREPARED DIRECT TESTIMONY OF JONATHAN B. ATUN CHAPTER 4 ON BEHALF OF SAN DIEGO GAS & ELECTRIC COMPANY
 Application No. A.1-0- Exhibit No.: Witness: Jonathan B. Atun Application of SAN DIEGO GAS & ELECTRIC ) COMPANY (U 0 E) For Approval of its ) Application No. 1-0- Electric Vehicle-Grid Integration Pilot
December 11, 2006 PUBLIC UTILITIES COMMISSION OF THE STATE OF CALIFORNIA ENERGY DIVISION
 Akbar Jazayeri Vice President, Revenue and Tariffs December 11, 2006 ADVICE 2072-E (U 338-E) PUBLIC UTILITIES COMMISSION OF THE STATE OF CALIFORNIA ENERGY DIVISION SUBJECT: Revision to the Base Revenue
Southern California Edison Revised Cal. PUC Sheet No E Rosemead, California (U 338-E) Cancelling Revised Cal. PUC Sheet No.
 Cancelling Revised Cal. PUC Sheet No.") Southern California Edison Revised Cal. PUC Sheet No. 62813-E Rosemead, California (U 338-E) Cancelling Revised Cal. PUC Sheet No. 61336-E Schedule TOU-DPP Sheet 1 APPLICABILITY This Schedule is available
Southern California Edison Revised Cal. PUC Sheet No. 62813-E Rosemead, California (U 338-E) Cancelling Revised Cal. PUC Sheet No. 61336-E Schedule TOU-DPP Sheet 1 APPLICABILITY This Schedule is available
REVISED WORKPAPERS TO PREPARED DIRECT TESTIMONY OF RONALD M. VAN DER LEEDEN ON BEHALF OF SOUTHERN CALIFORNIA GAS COMPANY
 Application of SOUTHERN CALIFORNIA GAS ) COMPANY for authority to update its gas revenue ) requirement and base rates ) effective January 1, 2016 (U 904-G) ) Application No. 14-11-004 Exhibit No.: (SCG-35-R-WP)
January 26, Advice Letter 3721-E
 STATE OF CALIFORNIA Edmund G. Brown Jr., Governor PUBLIC UTILITIES COMMISSION 505 VAN NESS AVENUE SAN FRANCISCO, CA 94102-3298 January 26, 2018 Advice Letter 3721-E Russell G. Worden Director, State Regulatory
UPDATE TESTIMONY OF SOUTHERN CALIFORNIA GAS COMPANY AND SAN DIEGO GAS & ELECTRIC COMPANY AUGUST 2018
 Company: Southern California Gas Company (U904G) San Diego Gas & Electric Company (U902M) Proceeding: 2019 General Rate Case Application: A.17-10-007/-008 (cons.) Exhibit: UPDATE TESTIMONY OF SOUTHERN
2018 General Rate Case
 Application No.: Exhibit No.: Witnesses: A.1-0-001 SCE-TURN-01 S. Menon (SCE) W. Marcus (TURN) (U -E) 01 General Rate Case SCE-TURN Joint Supplemental Testimony Regarding SPIDA Software Disallowance Scenarios
BEFORE THE PUBLIC UTILITIES COMMISSION OF THE STATE OF CALIFORNIA. (Appearances are listed in Appendix H.)
") ALJ/RAB/abw Mailed 12/22/2000 Decision 00-12-058 December 21, 2000 BEFORE THE PUBLIC UTILITIES COMMISSION OF THE STATE OF CALIFORNIA In the Matter of the Application of San Diego Gas & Electric Company
ALJ/RAB/abw Mailed 12/22/2000 Decision 00-12-058 December 21, 2000 BEFORE THE PUBLIC UTILITIES COMMISSION OF THE STATE OF CALIFORNIA In the Matter of the Application of San Diego Gas & Electric Company
Southern California Edison Revised Cal. PUC Sheet No E Rosemead, California (U 338-E) Cancelling Revised Cal. PUC Sheet No.
 Cancelling Revised Cal. PUC Sheet No.") Southern California Edison Revised Cal. PUC Sheet No. 62812-E Rosemead, California (U 338-E) Cancelling Revised Cal. PUC Sheet No. 62650-E Schedule TOU-D-T Sheet 1 APPLICABILITY Applicable as an option
Southern California Edison Revised Cal. PUC Sheet No. 62812-E Rosemead, California (U 338-E) Cancelling Revised Cal. PUC Sheet No. 62650-E Schedule TOU-D-T Sheet 1 APPLICABILITY Applicable as an option
Southern California Edison Revised Cal. PUC Sheet No E Rosemead, California (U 338-E) Cancelling Revised Cal. PUC Sheet No.
 Cancelling Revised Cal. PUC Sheet No.") Southern California Edison Revised Cal. PUC Sheet No. 65881-E Rosemead, California (U 338-E) Cancelling Revised Cal. PUC Sheet No. 64401-E Schedule CPP Sheet 1 APPLICABILITY This Schedule is optional for
Southern California Edison Revised Cal. PUC Sheet No. 65881-E Rosemead, California (U 338-E) Cancelling Revised Cal. PUC Sheet No. 64401-E Schedule CPP Sheet 1 APPLICABILITY This Schedule is optional for
Southern California Edison Revised Cal. PUC Sheet No E Rosemead, California (U 338-E) Cancelling Revised Cal. PUC Sheet No.
 Cancelling Revised Cal. PUC Sheet No.") Southern California Edison Revised Cal. PUC Sheet No. 62633-E Rosemead, California (U 338-E) Cancelling Revised Cal. PUC Sheet No. 61381-E PRELIMINARY STATEMENT Sheet 2 N. MEMORANDUM ACCOUNTS 2. Definitions.
Southern California Edison Revised Cal. PUC Sheet No. 62633-E Rosemead, California (U 338-E) Cancelling Revised Cal. PUC Sheet No. 61381-E PRELIMINARY STATEMENT Sheet 2 N. MEMORANDUM ACCOUNTS 2. Definitions.
Southern California Edison Revised Cal. PUC Sheet No E Rosemead, California (U 338-E) Cancelling Revised Cal. PUC Sheet No.
 Cancelling Revised Cal. PUC Sheet No.") Southern California Edison Revised Cal. PUC Sheet No. 49319-E Rosemead, California (U 338-E) Cancelling Revised Cal. PUC Sheet No. 46179-E PRELIMINARY STATEMENT Sheet 1 1. Purpose The purpose of the Public
Southern California Edison Revised Cal. PUC Sheet No. 49319-E Rosemead, California (U 338-E) Cancelling Revised Cal. PUC Sheet No. 46179-E PRELIMINARY STATEMENT Sheet 1 1. Purpose The purpose of the Public
2018 General Rate Case
 Application No.: A.1-0- Exhibit No.: SCE-0, Vol. Witnesses: S. Kempsey (U -E) 01 General Rate Case PUBLIC VERSION Administrative & General (A&G) Volume - Property & Liability Insurance Before the Public
BEFORE THE PUBLIC UTILITIES COMMISSION OF THE STATE OF CALIFORNIA
 BEFORE THE PUBLIC UTILITIES COMMISSION OF THE STATE OF CALIFORNIA Application of Pacific Gas and Electric Company for Approval of its Residential Rate Design Window Proposals, including to Implement a
JOINT SETTLEMENT COMPARISON EXHIBIT SOUTHERN CALIFORNIA GAS COMPANY TEST YEAR 2008 GENERAL RATE CASE
 Application of SOUTHERN CALIFORNIA GAS COMPANY for authority to update its gas revenue requirement and base rates effective January 1, 2008 (U 904-G). ) ) ) ) Application No. 06-12-010 Exhibit No.: (SCG-302)
Southern California Edison Revised Cal. PUC Sheet No E Rosemead, California (U 338-E) Cancelling Revised Cal. PUC Sheet No.
 Cancelling Revised Cal. PUC Sheet No.") Southern California Edison Revised Cal. PUC Sheet No. 62808-E Rosemead, California (U 338-E) Cancelling Revised Cal. PUC Sheet No. 61326-E APPLICABILITY Schedule D-CARE Sheet 1 Applicable to domestic service
Southern California Edison Revised Cal. PUC Sheet No. 62808-E Rosemead, California (U 338-E) Cancelling Revised Cal. PUC Sheet No. 61326-E APPLICABILITY Schedule D-CARE Sheet 1 Applicable to domestic service
December 14, Modifications to Regulatory Mechanisms Established in Accordance with Decision and Decision
 Akbar Jazayeri Director of Revenue and Tariffs December 14, 2005 ADVICE 1940-E (U 338-E) PUBLIC UTILITIES COMMISSION OF THE STATE OF CALIFORNIA ENERGY DIVISION SUBJECT: Modifications to Regulatory Mechanisms
2015 General Rate Case
 Application No.: Exhibit No.: SCE-, Vol. 0, Revision 1 Witnesses: J. Carrillo M. Childs P. Wong R. Fisher P. Hunt D. Lee K. Shimmel R. Worden (U -E) 01 General Rate Case Public Version ERRATA Results of
PREPARED DIRECT TESTIMONY OF KHAI NGUYEN ON BEHALF OF SOUTHERN CALIFORNIA GAS COMPANY
 Application of Southern California Gas Company for authority to update its gas revenue requirement and base rates effective on January 1, 2016. (U904G) Application 14-11-004 Exhibit No.: (SCG-40) PREPARED
SDG&E DIRECT TESTIMONY OF STEVEN P. DAIS (WORKING CASH) October 6, 2017 BEFORE THE PUBLIC UTILITIES COMMISSION OF THE STATE OF CALIFORNIA
 October 6, 2017 BEFORE THE PUBLIC UTILITIES COMMISSION OF THE STATE OF CALIFORNIA") Company: San Diego Gas & Electric Company (U 0 M) Proceeding: 01 General Rate Case Application: A.1-- Exhibit: SDG&E- SDG&E DIRECT TESTIMONY OF STEVEN P. DAIS (WORKING CASH) October, 01 BEFORE THE PUBLIC
Company: San Diego Gas & Electric Company (U 0 M) Proceeding: 01 General Rate Case Application: A.1-- Exhibit: SDG&E- SDG&E DIRECT TESTIMONY OF STEVEN P. DAIS (WORKING CASH) October, 01 BEFORE THE PUBLIC
Akbar Jazayeri Vice President, Regulatory Operations Southern California Edison Company P O Box 800 Rosemead, CA 91770
 STATE OF CALIFORNIA PUBLIC UTILITIES COMMISSION SAN FRANCISCO, CA 94102-3298 Edmund G. Brown Jr. Governor February 1, 2012 Advice Letter 2677-E Akbar Jazayeri Vice President, Regulatory Operations Southern
ORA. Office of Ratepayer Advocates California Public Utilities Commission
 ORA Office of Ratepayer Advocates California Public Utilities Commission http://ora.ca.gov 505 Van Ness Avenue San Francisco, California 94102 Tel: 415-703-2381 Fax: 415-703-2057 CPUC, Energy Division
2018 General Rate Case. Transmission & Distribution (T&D) Volume 3 R System Planning
 Volume 3 R System Planning") Application No.: Exhibit No.: Witnesses: A.1-0- A SCE-0, Vol. 0 R A E. Takayesu (U -E) 01 General Rate Case rd Errata ERRATA Transmission & Distribution (T&D) Volume R System Planning Before the Public
Application No.: Exhibit No.: Witnesses: A.1-0- A SCE-0, Vol. 0 R A E. Takayesu (U -E) 01 General Rate Case rd Errata ERRATA Transmission & Distribution (T&D) Volume R System Planning Before the Public
Southern California Edison Revised Cal. PUC Sheet No E Rosemead, California (U 338-E) Cancelling Revised Cal. PUC Sheet No.
 Cancelling Revised Cal. PUC Sheet No.") Southern California Edison Revised Cal. PUC Sheet No. 57616-E Rosemead, California (U 338-E) Cancelling Revised Cal. PUC Sheet No. 53885-E Schedule CPP Sheet 1 APPLICABILITY This Schedule is optional for
Southern California Edison Revised Cal. PUC Sheet No. 57616-E Rosemead, California (U 338-E) Cancelling Revised Cal. PUC Sheet No. 53885-E Schedule CPP Sheet 1 APPLICABILITY This Schedule is optional for
June 8, 2001 PUBLIC UTILITIES COMMISSION OF THE STATE OF CALIFORNIA ENERGY DIVISION. Restatement of the Transition Cost Balancing Account
 Akbar Jazayeri Director of Revenue and Tariffs June 8, 2001 ADVICE 1535-E-A (U 338-E) PUBLIC UTILITIES COMMISSION OF THE STATE OF CALIFORNIA ENERGY DIVISION SUBJECT: Restatement of the Transition Cost
Third Quarter 2017 Financial Results
 Third Quarter 2017 Financial Results October 30, 2017 Forward-Looking Statements Statements contained in this presentation about future performance, including, without limitation, operating results, capital
May 17, 2002 PUBLIC UTILITIES COMMISSION OF THE STATE OF CALIFORNIA ENERGY DIVISION
 Akbar Jazayeri Director of Revenue and Tariffs May 17, 2002 ADVICE 1622-E (U 338-E) PUBLIC UTILITIES COMMISSION OF THE STATE OF CALIFORNIA ENERGY DIVISION SUBJECT: Implementation of the Capital Additions
BEFORE THE PUBLIC UTILITIES COMMISSION OF THE STATE OF CALIFORNIA ) ) ) )
 ) ) )") BEFORE THE PUBLIC UTILITIES COMMISSION OF THE STATE OF CALIFORNIA Application of Southern California Edison Company (U 338-E) To Establish Marginal Costs, Allocate Revenues, Design Rates, and Implement
BEFORE THE PUBLIC UTILITIES COMMISSION OF THE STATE OF CALIFORNIA Application of Southern California Edison Company (U 338-E) To Establish Marginal Costs, Allocate Revenues, Design Rates, and Implement
2015 General Rate Case
 Application No.: Exhibit No.: Witnesses: A.--00 SCE-0, Vol. 0, Pt. 1 M. Bennett G. Henry J. Trapp R. Worden (U -E) 01 General Rate Case ERRATA Human Resources (HR) Volume, Part 1 Benefits and Other Compensation
Prepared Remarks of Edison International CEO and CFO First Quarter 2017 Financial Teleconference May 1, 2017, 1:30 p.m. (PDT)
") Prepared Remarks of Edison International CEO and CFO First Quarter 2017 Financial Teleconference May 1, 2017, 1:30 p.m. (PDT) Pedro Pizarro, President and Chief Executive Officer, Edison International
Prepared Remarks of Edison International CEO and CFO First Quarter 2017 Financial Teleconference May 1, 2017, 1:30 p.m. (PDT) Pedro Pizarro, President and Chief Executive Officer, Edison International
Application No.: A Exhibit No.: SCE-1, Vol. 3. S. DiBernardo S. Samiullah D. Hopper G. Golden (U 338-E) Before the
 Before the") Application No.: A.1-01- Exhibit No.: SCE-1, Vol. Witnesses: R. Thomas S. DiBernardo S. Samiullah D. Hopper G. Golden (U -E) SOUTHERN CALIFORNIA EDISON COMPANY S (U - E) TESTIMONY IN SUPPORT OF ITS APPLICATION
Application No.: A.1-01- Exhibit No.: SCE-1, Vol. Witnesses: R. Thomas S. DiBernardo S. Samiullah D. Hopper G. Golden (U -E) SOUTHERN CALIFORNIA EDISON COMPANY S (U - E) TESTIMONY IN SUPPORT OF ITS APPLICATION
SECOND REVISED SOCALGAS DIRECT TESTIMONY OF KAREN C. CHAN (WORKING CASH) APRIL 6, 2018
 APRIL 6, 2018") Company: Southern California Gas Company (U 0 G) Proceeding: 01 General Rate Case Application: A.1--00 Exhibit: SCG--R SECOND REVISED SOCALGAS DIRECT TESTIMONY OF KAREN C. CHAN (WORKING CASH) APRIL, 01
Company: Southern California Gas Company (U 0 G) Proceeding: 01 General Rate Case Application: A.1--00 Exhibit: SCG--R SECOND REVISED SOCALGAS DIRECT TESTIMONY OF KAREN C. CHAN (WORKING CASH) APRIL, 01
BEFORE THE PUBLIC UTILITIES COMMISSION OF THE STATE OF CALIFORNIA
 BEFORE THE PUBLIC UTILITIES COMMISSION OF THE STATE OF CALIFORNIA Application of Pacific Gas and Electric Company (U 39-E) for Approval of Demand Response Programs, Pilots and Budgets for Program Years
Load and Billing Impact Findings from California Residential Opt-in TOU Pilots
 Load and Billing Impact Findings from California Residential Opt-in TOU Pilots Stephen George, Eric Bell, Aimee Savage, Nexant, San Francisco, CA ABSTRACT Three large investor owned utilities (IOUs) launched
September 22, Advice Letter 3033-E
 STATE OF CALIFORNIA PUBLIC UTILITIES COMMISSION 505 VAN NESS AVENUE SAN FRANCISCO, CA 94102-3298 Edmund G. Brown Jr., Governor September 22, 2014 Advice Letter 3033-E Megan Scott-Kakures Vice President,
2018 General Rate Case
 Application No.: A.1-0- Exhibit No.: SCE-0, Vol. 0 Witnesses: R. Ramos J. Smolk R. Swartz S. Tran A (U -E) 01 General Rate Case ERRATA Administrative & General (A&G) Volume 0 Legal (Law, Claims, and Workers
Summary of Excess Liability Forecast
 Application No.: Exhibit No.: Witnesses: A.13-11-003-36 M. Marelli (U 338-E) Summary of Excess Liability Forecast Before the Public Utilities Commission of the State of California 1 1 Leading the Way in
SUBJECT: Establishment of Demand Response Load Shift Working Group Memorandum Account in Compliance with Decision
 STATE OF CALIFORNIA Edmund G. Brown Jr., Governor PUBLIC UTILITIES COMMISSION 505 VAN NESS AVENUE SAN FRANCISCO, CA 94102-3298 February 23, 2018 Advice Letter 3729-E Russell G. Worden Director, State Regulatory
(U 338-E) 2018 General Rate Case A Workpapers REVISED. RO- Rate Base SCE-09 Volume 02, Chapter IV, Book A
 2018 General Rate Case A Workpapers REVISED. RO- Rate Base SCE-09 Volume 02, Chapter IV, Book A") (U 338-E) 2018 General Rate Case A.16-09-001 Workpapers REVISED RO- Rate Base SCE-09 Volume 02, Chapter IV, Book A September 2016 1 SCE-9, VOLUME 2, CHAPTER IV Rate Base Overview Witness: David Gunn Adjustments
(U 338-E) 2018 General Rate Case A.16-09-001 Workpapers REVISED RO- Rate Base SCE-09 Volume 02, Chapter IV, Book A September 2016 1 SCE-9, VOLUME 2, CHAPTER IV Rate Base Overview Witness: David Gunn Adjustments
March 1, 2013 Advice Letter 2841-E
 STATE OF CALIFORNIA PUBLIC UTILITIES COMMISSION SAN FRANCISCO, CA 94102-3298 Edmund G. Brown Jr. Governor March 1, 2013 Advice Letter 2841-E Akbar Jazayeri Vice President, Regulatory Operations Southern
April 11, 2001 PUBLIC UTILITIES COMMISSION OF THE STATE OF CALIFORNIA ENERGY DIVISION
 Donald A. Fellows, Jr. Manager of Revenue and Tariffs April 11, 2001 ADVICE 1532-E (U 338-E) PUBLIC UTILITIES COMMISSION OF THE STATE OF CALIFORNIA ENERGY DIVISION SUBJECT: Revenue Requirement for SCE
Southern California Edison Company s Tehachapi Renewable Transmission Project (TRTP) -- Application Appendices. Application Nos.: Exhibit No.
 -- Application Appendices. Application Nos.: Exhibit No.") Application Nos.: Exhibit No.: Witnesses: Various (U 338-E) Southern California Edison Company s Tehachapi Renewable Transmission Project (TRTP) -- Application Appendices Before the Public Utilities Commission
Application Nos.: Exhibit No.: Witnesses: Various (U 338-E) Southern California Edison Company s Tehachapi Renewable Transmission Project (TRTP) -- Application Appendices Before the Public Utilities Commission
Exhibit No.: Witnesses: SCE-06 Paul Hunt 338-E) Before the. July 22, 2013
 Before the. July 22, 2013") Application No.: Exhibit No.: Witnesses: A.1-1-01 SCE-0 Paul Hunt David H. Opitz Todd Cameron (U -E) SUPPLEMENTAL TESTIMONY: SONGS & EARLY DECOMMISSIONING SCENARIO Before the Public Utilities Commission
Application No.: Exhibit No.: Witnesses: A.1-1-01 SCE-0 Paul Hunt David H. Opitz Todd Cameron (U -E) SUPPLEMENTAL TESTIMONY: SONGS & EARLY DECOMMISSIONING SCENARIO Before the Public Utilities Commission
SDG&E DIRECT TESTIMONY OF NORMA G. JASSO (REGULATORY ACCOUNTS) November 2014
 November 2014") Company: San Diego Gas & Electric Company (U0M) Proceeding: 01 General Rate Case Application: A.1--XXX Exhibit: SDG&E- SDG&E DIRECT TESTIMONY OF NORMA G. JASSO (REGULATORY ACCOUNTS) November 01 BEFORE
Company: San Diego Gas & Electric Company (U0M) Proceeding: 01 General Rate Case Application: A.1--XXX Exhibit: SDG&E- SDG&E DIRECT TESTIMONY OF NORMA G. JASSO (REGULATORY ACCOUNTS) November 01 BEFORE
FOR IMMEDIATE RELEASE Media relations contact: Charles Coleman, (626) Investor relations contact: Scott Cunningham, (626)
 Investor relations contact: Scott Cunningham, (626)") NEWS FOR IMMEDIATE RELEASE Media relations contact: Charles Coleman, (626) 302-7982 Investor relations contact: Scott Cunningham, (626) 302-2540 Edison International Reports Second Quarter 2016 Results;
NEWS FOR IMMEDIATE RELEASE Media relations contact: Charles Coleman, (626) 302-7982 Investor relations contact: Scott Cunningham, (626) 302-2540 Edison International Reports Second Quarter 2016 Results;
Pacific Gas and Electric Company Monthly Report On Interruptible Load and Demand Response Programs for March 2015
 Pacific Gas and Electric Company Monthly Report On Interruptible Load and Demand Response Programs for Public April 2, 205 Pacific Gas and Electric Company ( PG&E ) hereby submits this report on Interruptible
BEFORE THE PUBLIC UTILITIES COMMISSION OF THE STATE OF CALIFORNIA ) ) ) ) ) ) )
 ) ) ) ) ) )") BEFORE THE PUBLIC UTILITIES COMMISSION OF THE STATE OF CALIFORNIA Application of Southern California Edison Company (U 338-E For Applying the Market Index Formula And As-Available Capacity Prices Adopted
BEFORE THE PUBLIC UTILITIES COMMISSION OF THE STATE OF CALIFORNIA Application of Southern California Edison Company (U 338-E For Applying the Market Index Formula And As-Available Capacity Prices Adopted
Business Update Supplement SCE 2015 General Rate Case Decision
 Business Update Supplement SCE 2015 General Rate Case Decision November 9, 2015 Forward-Looking Statements Statements contained in this presentation about future performance, including, without limitation,
Southern California Edison Company (U 338-E) Smart Meter Opt-Out Phase 2 Rebuttal Testimony
 Smart Meter Opt-Out Phase 2 Rebuttal Testimony") Application No.: Exhibit No.: Witnesses: A.-0-00 K. Ellison G. Huckaby L. Letizia J. Lim L. Miller L. Oliva (U -E) Southern California Edison Company (U -E) Smart Meter Opt-Out Phase Rebuttal Testimony
Application No.: Exhibit No.: Witnesses: A.-0-00 K. Ellison G. Huckaby L. Letizia J. Lim L. Miller L. Oliva (U -E) Southern California Edison Company (U -E) Smart Meter Opt-Out Phase Rebuttal Testimony
April 20, 2001 PUBLIC UTILITIES COMMISSION OF THE STATE OF CALIFORNIA ENERGY DIVISION
 Donald A. Fellows, Jr. Manager of Revenue and Tariffs April 20, 2001 ADVICE 1534-E-A (U 338-E) PUBLIC UTILITIES COMMISSION OF THE STATE OF CALIFORNIA ENERGY DIVISION SUBJECT: Establishment of Four New
Superseding Sheet No. 96 REVISED SHEET NO. 96 Effective May 4, 2012 Effective June 1, 2013
 Superseding Sheet No. 96 REVISED SHEET NO. 96 Effective May 4, 2012 Effective June 1, 2013 RATE ADJUSTMENT MECHANISM PROVISION Rate Adjustment Mechanism ( RAM ) Provision Purpose This mechanism is subject
June 10, 2005 PUBLIC UTILITIES COMMISSION OF THE STATE OF CALIFORNIA ENERGY DIVISION
 Akbar Jazayeri Director of Revenue and Tariffs June 10, 2005 ADVICE 1896-E (U 338-E) PUBLIC UTILITIES COMMISSION OF THE STATE OF CALIFORNIA ENERGY DIVISION SUBJECT: Establishment of Application for California
April 8, 2005 PUBLIC UTILITIES COMMISSION OF THE STATE OF CALIFORNIA ENERGY DIVISION. Revision to the Energy Resource Recovery Account
 Akbar Jazayeri Director of Revenue and Tariffs April 8, 2005 ADVICE 1884-E (U 338-E) PUBLIC UTILITIES COMMISSION OF THE STATE OF CALIFORNIA ENERGY DIVISION SUBJECT: Revision to the Energy Resource Recovery
PRELIMINARY STATEMENT Sheet 2
 Southern California Edison Revised Cal. PUC Sheet No. 30251-E Rosemead, California Cancelling Revised Cal. PUC Sheet No. 28274-E PRELIMINARY STATEMENT Sheet 2 N. MEMORANDUM ACCOUNTS 2. Definitions. d.
November 22, 2002 PUBLIC UTILITIES COMMISSION OF THE STATE OF CALIFORNIA ENERGY DIVISION. Implementation of the Energy Resource Recovery Account
 Akbar Jazayeri Director of Revenue and Tariffs November 22, 2002 ADVICE 1665-E (U 338-E) PUBLIC UTILITIES COMMISSION OF THE STATE OF CALIFORNIA ENERGY DIVISION SUBJECT: Implementation of the Energy Resource
Southern California Edison Revised Cal. PUC Sheet No E Rosemead, California Cancelling Revised Cal. PUC Sheet No E
 Southern California Edison Revised Cal. PUC Sheet No. 29205-E Rosemead, California Cancelling Revised Cal. PUC Sheet No. 23729-E Schedule DM Sheet 1 APPLICABILITY Applicable to domestic service including
Residential Line and Service Extension Allowance Testimony. Application No.: Witnesses: C. Silsbee S. Reed J. Schichtl L. Vellanoweth (U 338-E)
") Application No.: Exhibit No.: Witnesses: SCE-1 C. Silsbee S. Reed J. Schichtl L. Vellanoweth (U -E) Residential Line and Service Extension Allowance Testimony Before the Public Utilities Commission of
Application No.: Exhibit No.: Witnesses: SCE-1 C. Silsbee S. Reed J. Schichtl L. Vellanoweth (U -E) Residential Line and Service Extension Allowance Testimony Before the Public Utilities Commission of
SDG&E REBUTTAL TESTIMONY OF NORMA G. JASSO (REGULATORY ACCOUNTS) June 2015
 June 2015") Company: San Diego Gas & Electric Company (U0M) Proceeding: 01 General Rate Case Application: A.1--00 Exhibit: SDG&E- SDG&E REBUTTAL TESTIMONY OF NORMA G. JASSO (REGULATORY ACCOUNTS) June 01 BEFORE THE
Company: San Diego Gas & Electric Company (U0M) Proceeding: 01 General Rate Case Application: A.1--00 Exhibit: SDG&E- SDG&E REBUTTAL TESTIMONY OF NORMA G. JASSO (REGULATORY ACCOUNTS) June 01 BEFORE THE
Southern California Edison Revised Cal. PUC Sheet No E Rosemead, California (U 338-E) Cancelling Revised Cal. PUC Sheet No.
 Cancelling Revised Cal. PUC Sheet No.") Southern California Edison Revised Cal. PUC Sheet No. 51720-E Rosemead, California (U 338-E) Cancelling Revised Cal. PUC Sheet No. 44454-E PRELIMINARY STATEMENT Sheet 1 CALIFORNIA ALTERNATE RATES FOR ENERGY
Southern California Edison Revised Cal. PUC Sheet No. 51720-E Rosemead, California (U 338-E) Cancelling Revised Cal. PUC Sheet No. 44454-E PRELIMINARY STATEMENT Sheet 1 CALIFORNIA ALTERNATE RATES FOR ENERGY
PUC DOCKET NO. BEFORE THE PUBLIC UTILITY COMMISSION OF TEXAS APPLICATION OF TEXAS-NEW MEXICO POWER COMPANY FOR AUTHORITY TO CHANGE RATES
 PUC DOCKET NO. BEFORE THE PUBLIC UTILITY COMMISSION OF TEXAS APPLICATION OF TEXAS-NEW MEXICO POWER COMPANY FOR AUTHORITY TO CHANGE RATES PREPARED DIRECT TESTIMONY AND EXHIBITS OF EMMANUEL J. LOPEZ ON BEHALF
Energy Resource Recovery Account (ERRA) 2018 Forecast of Operations Rebuttal Testimony Public Version
 2018 Forecast of Operations Rebuttal Testimony Public Version") Application No.: Exhibit No.: Witnesses: A.1-0-00 SCE-0 R. Sekhon D. Wong (U -E) Energy Resource Recovery Account (ERRA) 01 Forecast of Operations Rebuttal Testimony Public Version Before the Public Utilities
Application No.: Exhibit No.: Witnesses: A.1-0-00 SCE-0 R. Sekhon D. Wong (U -E) Energy Resource Recovery Account (ERRA) 01 Forecast of Operations Rebuttal Testimony Public Version Before the Public Utilities
2018 General Rate Case Rebuttal Testimony
 Application No.: A.16-09-001 Exhibit No.: SCE-23, Vol. 01 Witnesses: D. Daigler D. McMullen T. Guntrip D. Neal P. Jeske S. Schuffels K. Landrith (U 338-E) 2018 General Rate Case Rebuttal Testimony Operational
First Quarter 2017 Financial Results
 First Quarter 2017 Financial Results May 1, 2017 Forward-Looking Statements Statements contained in this presentation about future performance, including, without limitation, operating results, capital
SOUTHERN CALIFORNIA GAS COMPANY ADVANCED METERING INFRASTRUCTURE CHAPTER II SUMMARY OF AMI BUSINESS CASE
 Application No.: A.0-0-0 Exhibit No.: SCG Date: March, 00 Witness: Edward Fong SOUTHERN CALIFORNIA GAS COMPANY ADVANCED METERING INFRASTRUCTURE CHAPTER II SUMMARY OF AMI BUSINESS CASE Errata to Prepared