NATIONAL CEO SURVEY JANUARY Business prospects in 2018 Can 2018 be a stellar year? The Australian Industry Group
|
|
|
- Angelica Goodwin
- 6 years ago
- Views:
Transcription

1 NATIONAL CEO SURVEY Business prospects in 2018 Can 2018 be a stellar year? JANUARY 2018 The Australian Industry Group 1
2 ABOUT AiGROUP The Australian Industry Group (Ai Group) is a peak employer association which together with partner organisations represents the interest of 60,000 businesses employing more than 1 million Australians. Ai Group members are from a broad range of industry sectors including manufacturing; engineering; construction; food and beverage processing; transport and logistics; information and technology; telecommunication; labour hire; and defence. Ai Group is a leading advocate for good government policy that is in the best interest of business and the community. With more than 250 staff in offices across NSW, QLD, SA, VIC and WA, we have the resources and the expertise to meet the changing need of our members. AUSTRALIAN INDUSTRY GROUP CONTACT Peter Burn Head of Influence and Policy Australian Industry Group 51 Walker Street North Sydney, NSW 2060 Australia Tel: The Australian Industry Group, 2018 The copyright in this work is owned by the publisher, The Australian Industry Group, 51 Walker Sreet, North Sydney NSW All rights reserved. No part of this work is covered by copyright may be reproduced or copied in any form or by any means (graphic, electronic or mechanical) without the written permission of the publisher THE AUSTRALIAN INDUSTRY GROUP NATIONAL CEO SURVEY: BUSINESS PROSPECTS
3 CONTENTS CAN 2018 BE A STELLAR YEAR? KEY FINDINGS 1. OUTLOOK AND EXPECTATIONS 1.1 Economic outlook in Business conditions in Business expectations for Expected industry conditions in 2018 in manufacturing, services and construction 1.5 Challenges for business in Global competitiveness of Australia s business environment in Strategies for business in MANUFACTURING PROSPECTS IN Manufacturing conditions in Manufacturers expectations for Prospects for manufacturing exports 2.4 Challenges for manufacturers in Strategies for manufacturers in SERVICES BUSINESSES PROSPECTS IN Services business conditions in Services businesses expectations for Challenges for services businesses in Strategies for services businesses in CONSTRUCTION INDUSTRY PROSPECTS IN Construction industry conditions in Construction businesses expectations for Challenges for construction businesses in Strategies for construction businesses in APPENDIX: CEO BUSINESS PROSPECTS SURVEY 2018 PARTICIPANTS AND QUESTIONNAIRE 02

4 CAN 2018 BE A STELLAR YEAR? The 2018 Business Prospects report reveals that Australian CEOs are optimistic about the year ahead and keen to build on the stronger conditions experienced in Investment plans and expectations of employment growth are higher than at any time since If these plans and expectations are realised, 2018 would prove to be a decisive year for the Australian economy. For Australian CEOs, 2017 turned out to be stronger than anticipated. General business conditions, turnover, gross margins and employment were all higher in 2017 than they were in the previous year and they all turned out to be considerably better than was expected this time last year. Looking to the year ahead, CEO s renewed optimism has them anticipating a year of further advance on Expectations of general business conditions, turnover, employment growth and gross margins are all higher than at any time in the preceding five years. If these positive expectations can be turned into real outcomes, 2018 would turn out to be a defining year for the Australian economy. We would see strong business investment and spending on training, R&D and technologies reach post-gfc highs. And most importantly, we would see a year in which employment growth equalled or even exceeded the record jobs growth experienced in Given the strength of CEO expectations on employment, Australia could add more than 400,000 new jobs in An achievement of this magnitude would make critical inroads into both the rate of unemployment and the naggingly high rate of underemployment. While none of this is guaranteed, key steps can be taken to lift the chances of success: Policy measures to stem and reverse the rise in energy prices need to be effective. Expectations of high energy price rises are a clear negative for Australian CEOs. Moderate wages growth will need to continue: the record jobs growth of 2017 and the ability to meet expectations of still higher jobs growth are closely associated with the moderate wages outcomes of recent years and the continuation of this pattern into Enacting the proposal to make Australia s business tax system more competitive by lowering the company tax rate to 25 per cent would significantly strengthen the incentives to invest and reinvest in the domestic economy. We are on the cusp of a year in which businesses are looking to invest heavily in capital equipment, in technology, in R&D and in staff training. And we are on the cusp of a second consecutive year of record employment growth. If wage outcomes continue to be moderate; if progress can be made on reducing energy costs; and if the proposal to improve the competitiveness of our business tax system are enacted, 2018 could, indeed, be a stellar year. Innes Willox Chief Executive, Australian Indusrty Group THE AUSTRALIAN INDUSTRY GROUP NATIONAL CEO SURVEY: BUSINESS PROSPECTUS
5 KEY FINDINGS Ai Group s annual Business Prospects survey reveals that Australian CEOs are more optimistic heading into 2018 than they have been for any year since This has built on an actual performance in 2017 that exceeded CEO expectations of a year ago. This shift in CEO outlook echoes the displacement over the course of 2017 of the slower for longer view of broader economic performance with more positive forecasts for Australian an global GDP growth by the RBA, the OECD, the IMF and others. In the latest Business Prospects survey: General business conditions are expected to pick up in 2018 for more businesses than in any of the previous five years. Across all businesses, 42.3% of CEOs expect an improvement, 15.7% expect deteriorating conditions (+26.7% net balance) and 42.0% expect no change in conditions. Sales are expected to increase for 67.3% of businesses in 2018, with 19.8% expecting no change from 2017 levels and 13.0% expecting a decline in sales in This reflects clearly better sales growth than was expected in When asked one year earlier (in Ai Group s CEO survey conducted in November 2016), 51.0% of CEOs had expected higher sales revenue in Employment is expected to increase in the majority (57.6%) of businesses in This is the first time in at least five years that a majority of businesses has planned to employ more people. With 12.6% of businesses planning to shed staff in 2018, a net balance of 45.0% of CEOs plan to increase employment this year. This is around double the next best net balance for expected employment growth from the previous five years. This expectation of strong employment growth appears to be closely associated with an expectation of a continuation of the moderate wage rises experienced over the past couple of years. Wages pressure is identified by only 4.6% of respondents as their leading concern heading into This is sharply lower than in 2017 and below the levels reported in the previous four surveys. Although the majority (67.3%) of CEOs expect their total turnover to grow in 2018, gross profit margins are expected to grow in only 41.0% of businesses in % of CEOs are expecting deteriorating margins and 46.1% expect no change (giving a net balance of 27.9%). The low expectations of margin growth relative to expectations of sales growth is related to expectations of rising input prices and especially rising energy prices for the majority of businesses. This year s survey indicates that the large majority of CEOs plan to maintain or increase their spending on various types of business investment including staff training (with 50.1% of businesses planning to increase this in 2018); spending on new technologies (with 48.3% of businesses planning to increase their spending); R&D expenditure (26.0% of businesses plan to expand R&D spending); and physical investment (with 36.5% planning to lift physical capital expenditure in 2018). 04
6 1.OUTLOOK AND EXPECTATIONS IN 2018 Ai Group s annual survey of Australian CEOs experiences and expectations indicates that 2017 was a better year for most but not all businesses and that, overall, CEOs expect further improvements There are lower expectations of better margins or incomes due to input cost pressures and stiff local and global competition. The Australian economy strengthened over the first half of , with improvements across almost every major indicator including real and nominal GDP; housing; government and business investment; the terms of trade; export volumes; population growth; employment growth; unemployment and wages. Most pleasingly, the benefits of growth have spread more evenly with improvements across a wider range of industries and regions than in previous years. Some inter-related points of local weakness and vulnerability remain, including household debt and consumption levels; the residential construction cycle; the persistence of relatively high rates of underemployment; and business input cost pressures (especially energy costs) that are detracting from margins and competitiveness. As always, a wide range of business risks, challenges and opportunities are present in the global economy. 05

7 1.1 ECONOMIC OUTLOOK IN 2018 The Australian economy appeared to turn a corner during 2017, setting down a solid base for further growth and improvement in By Q3 of 2017: Real GDP growth picked up to 2.8% p.a. (after tracking below 2.0% in Q1 and Q2), with export volumes, house building, business investment and government investment all contributing to the acceleration; Nominal GDP growth accelerated to 5.9% p.a., supported by a recovery in the terms of trade and contributing to better incomes growth for both employees (wages) and businesses (profits); and Total employment growth accelerated to 3.3% p.a. in December 2017 and the national unemployment rate fell to 5.4% (trend). However, underemployment remains elevated at 8.4% of the labour force. In response, nominal wages growth (as measured by the ABS Wages Price Index) lifted only marginally to 2.0% p.a. in Q3 (1.9% in the private sector and 2.4% in the public sector) from a low of 1.9% p.a. in Q1 and Q2. The distribution of economic growth has also improved, with a greater range of industries and regions indicating expansion. Across industries, output and employment growth is strongest in residential construction and more recently in engineering and commercial construction. The big services sectors such as health, education and professional services are benefiting from strong population growth, while education is benefiting from the relatively competitive range of the Aussie dollar and is enjoying record numbers of international students. Recoveries were also evident in parts of manufacturing in 2017 despite the final exit of automotive assembly, with output, business income (profits) and exports recovering across several key manufacturing segments (see Chapter 2). Wholesale trade and transport expanded due to rising demand to distribute agricultural products, building materials and online purchases of consumer goods. There remain distinct weak pockets among more traditional retail segments. Across the states, NSW and Victoria had the strongest growth in population, jobs and investment during 2016 and 2017, but other states also expanded. The mining-dominated economy of Western Australia is lifting out of its post-boom slump, with state final demand (all consumption and investment, excluding net exports) growing in Q for the first time since the pre-2012 boom years is already a better year for all states than was NAB and other Australian forecasters expect to slow down again however, mainly because construction activity is likely to start slowing from current peaks (see Chart 1). CHART 1 LOCAL ECONOMIC GROWTH AND FORECASTS: GSP AND GDP* * Gross State Product and Gross Domestic Product. Sources: ABS State Accounts, Nov 2017, NAB States Overview, Oct
8 1.1 ECONOMIC OUTLOOK IN 2018 Externally, the global economy is providing better support for Australian business, with small but welcome accelerations in global GDP, trade and investment. By the end of 2017, the IMF (October) and the OECD (November) both lifted their forecasts for global GDP growth to 3.7% in 2018, due to improvements in Asia (mainly China and Japan), the Eurozone and Russia, which are helping to offset weaker trends elsewhere (e.g. the UK, India and the Middle East). The IMF notes this cyclical recovery comes after a decade of disappointment and remains fragile (see Chart 2). Global investment and trade are especially vulnerable to disruption. Growth therefore needs to be supported by structural reforms and growth-friendly fiscal policy measures [to] boost productivity and labour supply including in Australia. CHART 2 GLOBAL ECONOMIC GROWTH AND FORECASTS*, 2008 TO 2018 * Solid lines denote IMF estimates of real global GDP growth. Dotted lines denote IMF forecasts for real global GDP growth. Source: IMF, World Economic Outlook, various editions from January 2010 to October For Australia, both the RBA (November) and Treasury (December) expect real GDP growth to accelerate towards 3.0% in The RBA expects growth to strengthen to 3.5% in , before moderating to 3.25% towards the end of The Treasury is more cautiously expecting growth to accelerate to 3.0% in and to remain there until (see Table 1). The OECD is more cautious, with a forecast of 2.8% p.a. for Australian GDP in 2018 and 2.7% p.a. in 2019, due to anticipated slower growth in China. Importantly, the drivers of Australia s growth are now shifting further away from mining investment and exports, in favour of public-sector demand (government spending and investment, led by large-scale transport and telecommunications projects), housing and non-mining business investment. The latest private sector capital expenditure data (CAPEX) indicate total CAPEX rose by 2.3% p.a. in Q3 2017, with CAPEX by non-mining industries up by 8.7% p.a. Revised expectations for CAPEX in suggest annual spending could rise by a further 8.8% among non-mining businesses. If it eventuates, this will be a significant step up from just 1.8% p.a. growth in non-mining CAPEX in and a small fall in And after a lull in mid-2017, residential housing finance and building approvals both surged higher again in late This suggests residential construction activity will continue to contribute to growth in 2018 (in contrast to Treasury s anticipated fall), as will improving commercial and industrial building activity. 07
 is already better than RBA and Treasury expectations for 2018 (5.5%), so unemployment might fall below 5.25% sooner than anticipated. While underemployment remains high (around 8.")

9 1.1 ECONOMIC OUTLOOK IN 2018 For households, recently stronger employment growth is already supporting a gradual acceleration in wages growth. The national unemployment rate (5.4% in December 2017) is already better than RBA and Treasury expectations for 2018 (5.5%), so unemployment might fall below 5.25% sooner than anticipated. While underemployment remains high (around 8.4% of the labour force), other signals point to a tighter labour market in 2018 and upward pressure on wages is likely to intensify. Indeed, concerns about future skill shortages and wages are already spreading among Australia s CEOs, with pockets of shortage already apparent in construction and a handful of other sectors (see Section 1.4 and Chapter 4 below). Household consumption is likely to rise in line with stronger nominal incomes. TABLE 1 AUSTRALIAN ECONOMIC GROWTH AND FORECASTS f = forecast. p = projection. Sources: ABS various data; RBA SoMP, Nov 2017; Australian Treasury, MYEFO , Dec
10 1.2 BUSINESS CONDITIONS IN 2017 Ai Group conducted its annual survey of Australian CEOs in October and November 2017, asking about business experiences in 2017 and expectations for Responses were received from the CEOs of 269 businesses from across all Australian states and all non-farm private-sector industries. In aggregate, these businesses employed around 43,000 people and had an aggregate annual turnover of around $20 billion in Further details of respondents and the questionnaire are set out in the Appendix. Headline results of this year s survey are summarised in this section. Detail on each of the three major industry groups of manufacturing, services and construction is presented in chapters 2 to 4 below. Business expectations are generally shaped by recent experience. In line with improving local economic conditions through 2017 (see Section 1.1 above), Australian CEOs participating in this year s survey reported a better year in 2017 than in the previous five years across a range of indicators of business performance and investment (see Chart 3 and 4). General business conditions improved for 47% of survey respondents in 2017, remained the same for 31% and deteriorated for 22%, giving a net balance of 25%. This indicated a significant 1 improvement in general business conditions in 2017 compared to each of the previous five years. It also indicated that 2017 turned out better than expected for a significant proportion of CEOs; one year ago, one third of CEOs had expected their business conditions to improve in 2017 (versus 47% who reported an actual improvement in 2017) and 23% had expected a deterioration in 2017 (versus 22% who reported an actual deterioration in 2017). CHART 3 AUSTRALIAN CEOS REPORTED BUSINESS CONDITIONS, Net balance is the proportion of all survey respondents that improved minus the proportion that deteriorated. Aggregate results include respondents from all surveyed industries and are weighted by ABS estimates of output from each industry. 09
11 1.2 BUSINESS CONDITIONS IN 2017 The more detailed business performance indicators show that a higher proportion of businesses experienced improved turnover and profit margins in 2017 than in 2016 and in earlier years (see Chart 3). Survey respondents also reported stronger increases in employment in 2017 compared to earlier years. This is in line with ABS data indicating accelerating employment growth through 2017 (see Section 1.1). Capital expenditure on physical investments remained positive on a net balance basis (although it decelerated in 2017). Spending on staff training, R&D and new technologies seem to have risen instead with higher proportions of businesses reporting increases in these categories of investment in 2017 than in previous years (see Chart 4). This suggests a change in focus for Australian business investment in 2017, with a stronger emphasis on intangible investments (R&D, training and technologies) than on physical assets such as buildings and equipment. CHART 4 AUSTRALIAN CEOS REPORTED BUSINESS INVESTMENTS,
12 1.3 BUSINESS EXPECTATIONS FOR 2018 These improvements in business conditions in 2017 are reflected in a more optimistic outlook for 2018, compared to the previous five years, across most (but not all) of the key indicators (see Chart 5). In net balance terms, businesses are now more optimistic about their own conditions, turnover and profits. The single biggest caveat on this outlook is a strong expectation of rising input costs and especially energy costs in 2018, which is denting an otherwise positive outlook for sales and margins. Nevertheless, more CEOs are planning to grow employment and investment in 2018 than has been the case in previous years of this survey. CHART 5 AUSTRALIAN CEOS EXPECTED BUSINESS CONDITIONS, Expectations for 2018: business performance indicators General business conditions are expected to pick up in 2018 for more businesses than in any of the previous five years. Across all businesses, 42% of CEOs expect an improvement, 16% expect deteriorating conditions (+27% net balance) and 42% expect no change in conditions. This is the most optimistic set of expectations reported in this annual survey since at least As noted above, this improved outlook reflects the material improvements in conditions experienced by Australian business in Business turnover (sales) is expected to increase for 67% of businesses in 2018, with 20% expecting no change from 2017 levels and 13% expecting a decline in sales in This reflects clearly better sales growth than was expected in When asked one year earlier (in Ai Group s CEO survey conducted in November 2016), 51% of CEOs had expected higher sales revenue in One year on, 54% reported actually achieving higher sales revenue in This seems to have buoyed hopes for further sales growth in 2018 among a greater number and range of businesses. Although the majority of CEOs expect their total turnover to grow in 2018, most expect no growth in their own export revenue. This suggests that much of the turnover growth will be sought within Australian domestic markets rather than offshore in Of the businesses that indicated their expectations for export revenue in 2018 (around 85% of the total sample of respondents), 27% of CEOs expect an increase in export revenue in 2018 (a higher proportion than in any of the previous five years), 1% expect a decrease and the majority (73% of CEOs) expect no change. 11
13 1.3 BUSINESS EXPECTATIONS FOR 2018 Although the majority (67%) of CEOs expect their total turnover to grow in 2018, gross profit margins are expected to grow in only 41% of businesses in % of CEOs are expecting deteriorating margins and 46% expect no change (giving a net balance of 28% compared with the turnover net balance of 54%). This lower expectation of margin growth, despite higher turnover, appears to be related to rising input prices and especially rising energy prices for the majority of businesses in 2017, with further price rises expected in 2018 (see below). Employment (headcount) is expected to increase in the majority (58%) of businesses in This is the first time in at least five years that a majority of businesses have planned to employ more people. It is a significant step up from employment expectations over the past five years, in which between 34% and 37% of businesses planned to hire more people in each year. It is also a step up from actual headcount changes reported from 2013 to 2017; between 21% and 38% of businesses reported an increase in employment in each of these years. On the negative side, 13% of businesses plan to shed staff in 2018, while 30% do not plan to change their employment numbers in 2018 (giving a net balance of 45% of CEOs planning to increase employment). Expectations for 2018: business investment indicators This year s survey indicates that the large majority of CEOs plan to maintain or increase their spending on various types of business investment. Staff training will be the most popular area of increase, with 50% of businesses planning to increase training expenditure in 2018 closely followed by spending on new technologies, with 48% of businesses planning to increase their spending. R&D expenditure is less popular as an area of growth, with 26% of businesses planning to expand their R&D spending and 70% planning to maintain their R&D spending at the same level as in Just 7% of businesses plan to cut their spending on physical capital in 2018 (buildings, plant and equipment), 3% plan to cut their R&D spending, 6% plan to cut their spending on new technologies and 5% plan to cut their spending on staff training. The proportions of businesses planning to cut back on all of these types of investment are significantly lower than in any of the previous five years. Expectations for 2018: business pricing indicators On the pricing side, the majority of CEOs are expecting prices to rise for their inputs (51% of CEOs) and their outputs (51% of CEOs) in This is a higher proportion of businesses planning to implement price rises for their own goods and services in 2018 than in any of the preceding five years. In contrast, 11% of businesses plan to cut their selling prices in This is the same proportion who had planned to cut their prices in 2017 and lower than the proportions who had anticipated price cuts in each of 2014, 2015 and 2016 (around 16% in each year). Almost three quarters of CEOs (71%) expect energy input costs for their business to rise further in This comes on top of reported energy price increases for 65% of businesses in These significant input cost increases help to account for the more subdued expectations for profit margins than for turnover in 2018, with 67% of CEOs expecting their turnover to improve in 2018 but only 41% expecting their profit margins to improve. 12
14 1.3 BUSINESS EXPECTATIONS FOR 2018 CHART 6 EXPECTATIONS FOR PERFORMANCE, INVESTMENT AND PRICING,
15 1.4 EXPECTED INDUSTRY CONDITIONS IN 2018 IN MANUFACTURING, SERVICES AND CONSTRUCTION This year s Ai Group CEO Survey of Business Prospects included responses from all major non-farm private sector industries. Headline results for the three major industry groups of manufacturing, services and construction are below. Further detail is presented in chapters 2 to 4. Manufacturers are optimistic about 2018, with 67% of CEOs expecting an increase in turnover compared to 13% of CEOs expecting a decrease (+54% net balance). 51% expect their gross profit margins to increase and 22% expect their gross profit margins to decrease (+29 net balance). The low expectations of margin growth relative to expectations of sales growth are related to expectations of rising input prices and especially rising energy prices, with 85% of manufacturers anticipating their energy costs to increase in Australian manufacturing CEOs reported a better year in 2017 than in the previous five years. Australian manufacturing experienced a strong year in 2017 despite facing major headwinds such as the closure of passenger car assembly, high energy prices and growing skills shortages. For the first time in the survey s history more manufacturing CEOs in 2017 reported that business conditions improved instead of deteriorated (52% reported improving conditions while 24% reported deteriorating conditions). Manufacturing accounted for 5.9% of GDP (value added output) and 7% of employment in Services businesses are also more optimistic about 2018, expecting a continuation of the improved business conditions experienced in % of CEOs expect general business conditions to improve, while 17% expect a deterioration (+23% net balance). Energy prices remain a concern across the services industry with 68% of CEOs expecting their energy prices to increase. Services businesses reported improved conditions in 2017 compared to 2016: 43% of CEOs reported an improvement in business conditions compared to 25% that reported a decline in business conditions. The services industries included in this report are finance; healthcare; professional services; education; transport; retail trade; wholesale trade; IT and telecommunications; real estate services; administrative services; hospitality; personal services; and arts and recreation. Together these industries accounted for around 54.8% of GDP (value added output) and 72% of employment in As is the case for manufacturers and service providers, construction businesses are optimistic about 2018 although rising energy prices and input costs remain a concern. An encouraging 84% of construction CEOs expect their sales turnover to increase in 2018 and 55% expect an improvement in business conditions. Energy prices are expected to continue to rise in 2018, with 80% of construction CEOs expecting energy prices to rise and 20% expecting no change. 2. Public administration (government services) is another large services industry but it is excluded from the scope of this report. Public administration accounted for around 5.5% of GDP and 6.0% of employment in
16 1.5 CHALLENGES FOR BUSINESS IN 2018 When asked about the factors expected to inhibit growth prospects in 2018, 44% of CEOs identified lack of customer demand as their most significant constraint. This was up from 33% of CEOs in 2017, but lower than the proportion nominating customer demand as their top concern in 2016 and Labour market concerns feature prominently for CEOs in The second most pressing concern for CEOs in 2018 is skill shortages, with 17% of CEOs nominating this as their top concern. This is more than double the proportion identifying skill shortages as an impediment in 2017 (8%) and triple the proportion in 2016 (5%). A further 4% of CEOs said the flexibility of industrial relations is their top concern in 2018, up from 2% in These concerns reflect rising demand for labour in 2017 and 2018, as indicated across a range of data sources including the monthly ABS labour force surveys and Ai Group s Australian PMI, PSI and PCI. As noted above, over half of businesses (58%) in this year s CEO survey plan to increase employment in their business in 2018, so rising concerns about skill shortages are not out of place. Wage pressures were not an immediate concern for many businesses in 2018, with only 5% of CEOs ranking wage pressures as their highest concern in 2018, down from 12% of CEOs in Reflecting the lower trading range for the dollar in 2017, concerns about high and/or variable exchange rates, competition from imports and competition from internet sales all abated in 2018, compared to previous years. Concerns about imports and online competition dropped to 11% of CEOs in 2018, compared to 28% in Concerns about the exchange rate dropped to 3% of CEOs in CHART 7 EXPECTED IMPEDIMENTS TO BUSINESS GROWTH*, 2013 TO 2018 * Highest ranked answer in response to What factors do you expect will inhibit your business growth in 2018? 15
17 1.6 GLOBAL COMPETITIVENESS OF AUSTRALIA S BUSINESS ENVIRONMENT IN 2018 The global competitiveness of Australian business was assisted by a lower trading range for the Australian dollar (AUD) through 2016 and 2017, at around its long-term average of 75 US cents (Chart 8). The high dollar was a key difficulty for Australia s manufacturing sector from 2010 to 2015 (the domestic dollar traded at well over 90 US cents for most of this extended period) and its return to a more normal trading range has been instrumental to the recovery of some manufacturing sectors during 2016 and 2017, allowing them to build up their exports and to replace imports in the domestic market (see Chapter 2). Australia is a major resources exporter (iron ore, coal, LNG), so the AUD is heavily influenced by these global commodity prices (which also affect Australia s terms of trade). Commodity prices fell to a recent low in early 2016 but have since made a partial recovery. This saw the AUD and Australia s terms of trade drift higher again through 2017, but it has generally stayed below 80 US cents. Further rises in global commodity prices or a more bullish outlook for domestic interest rates could see the dollar hold above 80 US cents, which would erode the cost competitiveness of Australia s exports and of import-competing items. Forecasts for the Australia dollar always vary widely, but as of December 2017, the Commonwealth Bank (CBA), UBS, HSBC and the ANZ Banking Group were tipping the AUD to rise to 81 or 82 US cents by mid CBA, UBS and HSBC all forecast the AUD to remain above 80 US cents to the end of 2018, while ANZ Banking Group sees it settling back to 74 US cents by year end. Other AUD forecasters including Westpac, NAB, JP Morgan and Macquarie are less upbeat however (mainly due to a weaker outlook for global commodities) and expect the AUD to stay around 74 to 77 cents through CHART 8 AUSTRALIAN DOLLAR, COMMODITY PRICES AND TERMS OF TRADE Sources: ABS National Accounts, Sep 2017; RBA commodities index to Dec 2017; RBA exchange rates, to Dec
18 1.6 GLOBAL COMPETITIVENESS OF AUSTRALIA S BUSINESS ENVIRONMENT IN 2018 Relative costs and the exchange rate are not the only factors influencing the global competitiveness of Australian businesses and the Australian business environment. The World Economic Forum s (WEF) annual Global Competitiveness Report examines hundreds of indicators of competitiveness 3 and then compares and ranks them across 144 countries. In (the latest year available), Australia dropped one place to rank as the 22nd most competitive economy globally, indicating a slight deterioration in national business competitiveness compared to one year earlier (Chart 9). This equals Australia worst ranking which was previously recorded in This year s slide in Australia s ranking occurred despite Australia s Global Competitiveness Index (CGI) score edging up by 0.1 points to 5.2 out of a possible 7 points in This was the first change in Australia s score since (see Chart 9). This combination of a better score but a worsening ranking indicates that although Australia s competitiveness score improved slightly, other countries improved by a greater extent, thus pushing Australia down one place in the rankings. CHART 9 AUSTRALIA S GLOBAL COMPETITIVENESS INDEX SCORE AND RANK Source: WEF Global Competitiveness Report and database, Sep WEF global competitiveness indicators are derived from IMF, OECD, World Bank and other global databases, supplemented with an annual executive opinion survey that is conducted globally. The Ai Group conducts the annual executive opinion survey in Australia on behalf of the WEF. These indicators are then arranged into twelve themes or pillars including: institutions; infrastructure; education; health; efficiency; labour markets; technology; business sophistication and innovation. 17
; higher education and training (9th); and health and primary education (10th).")
19 1.6 GLOBAL COMPETITIVENESS OF AUSTRALIA S BUSINESS ENVIRONMENT IN 2018 The more detailed indicators and pillars indicate that Australia s competitive strengths in were: financial market development (6th); higher education and training (9th); and health and primary education (10th). Australia s weaknesses (with some unwelcome deteriorations) include rankings for: goods market efficiency (27th), reflecting our relatively high company tax burden (for which we rank 100th) and weaker tax incentives for business investment; technological readiness (24th); business sophistication (28th); and innovation (26th). Australia continues to rank relatively poorly on labour market efficiency, but saw some improvement in this indicator, up 8 places to 28th place. This is a big improvement from 56th place for labour market efficiency for Australia in The WEF Report also identifies the five most problematic factors for doing business in Australia in , as identified by CEOs participating in the WEF s Global Executive Opinion Survey (see Chart 10). These are: Restrictive labour regulations (reflecting labour and skill inflexibilities rather than high labour costs), which have been identified as the most problematic factor for Australian business since Inefficient government bureaucracy; High tax rates; Complexity of tax regulations; and Insufficient capacity to innovate, which is becoming a more prominent issue for Australian business. CHART 10 AUSTRALIA S MOST PROBLEMATIC FACTORS FOR DOING BUSINESS IN AND * * From this list of factors, respondents were asked to select the five most problematic factors for doing business in their country and to rank them between 1 (most problematic) and 5 (least problematic). The score corresponds to the responses weighted according to their rankings. Source: WEF Global Competitiveness Report and database, Sep
, Japan (8th), the UK (7th), the US (3rd) and Singapore (2nd). Australia s largest trade partner, China, was ranked the 28th most competitive economy, the same as in in 2015-16.")
20 1.6 GLOBAL COMPETITIVENESS OF AUSTRALIA S BUSINESS ENVIRONMENT IN 2018 Australia s ranking of 22nd most competitive economy in lags behind most of our peers including Canada (15th), New Zealand (13th), Japan (8th), the UK (7th), the US (3rd) and Singapore (2nd). Australia s largest trade partner, China, was ranked the 28th most competitive economy, the same as in in The top three competitive economies in are Switzerland (1st), Singapore (2nd) and the US (3rd), unchanged from A similar global ranking is produced regularly by the World Bank, comparing a smaller number of competitiveness indicators across 190 countries globally. In 2017, the World Bank ranked Australia the 15th best economy for doing business, down from 13th best economy in In the World Bank s list, Australia ranked behind New Zealand (1st), Hong Kong (4th), the UK (7th) and the US (8th) but ahead of Canada (22nd) and Japan (34th) in The more detailed findings indicate that Australia s business environment ranked well for starting a business, obtaining construction permits and obtaining credit, but ranked poorly for cross-border trade, insolvency procedures, taxation procedures, property transfer procedures and investor protections (see Chart 11). The World Bank ranking does not include indicators of labour market performance, skills and education, business sophistication or business innovation. CHART 11 AUSTRALIA S GLOBAL RANKINGS FOR DOING BUSINESS, 2017 Source: World Bank, Doing Business Economy profile: Australia, May
21 1.7 STRATEGIES FOR BUSINESS IN 2018 Business planning and strategy are important tools in responding to the business environment. In 2017, 56% of CEOs said they changed their business model, plan or strategy during the year in response to changing conditions (up from 47% in 2016). Just 6% of CEOs said they didn t have a plan or strategy in 2017 (down from 15% in 2016, 10% in 2015 and 12% in 2014). This suggests a clear improvement in the rate of businesses using formal plans and strategies to assist their business growth. Among survey respondents, 40% of CEOs plan to concentrate on introducing new products or services to their customers in % plan to focus instead on improving sales of their current offering of goods and services. More plan to develop new markets within Australia (10% of CEOs) than plan to work on developing new export markets (2% of CEOs). Downsizing and/or reducing operational costs is the top priority for 8% of CEOs in 2018, down from 11% in 2017 but still higher than in earlier previous years. Many other CEOs listed cost reductions as one of many strategies they will utilize each year, but not their single highest priority. This heightened focus on internal cost reductions in 2017 and 2018 appears to be in response to rising energy input costs. Fewer CEOs rank advertising/marketing and increasing online capabilities as their top business strategy in 2018 than in previous years, choosing to focus on their products and services instead. CHART 12 TOP PRIORITIES FOR BUSINESS STRATEGY*, * Highest ranked answer in response to What is the most important growth strategy that you plan to implement in your business in the year ahead? 20
22 2.MANUFACTURING PROSPECTS IN 2018 Australian manufacturing businesses produce a very wide range of goods and services including food, beverages, transport and other equipment, machinery, metal products, petroleum-based products, rubbers, chemicals, pharmaceuticals, non-metallic mineral products (mainly building materials), wood and paper products, textiles, clothing, furniture, household goods, printed materials and recorded media. 21
23 2.1 MANUFACTURING CONDITIONS IN 2017 Australian manufacturing experienced a strong year in 2017 despite facing major headwinds such as the closure of passenger car assembly, high energy prices and growing skills shortages. After experiencing a sustained period of shrinkage since Australia s most recent peaks in 2008, manufacturing output and employment appear to have stabilised. The most recent data suggests that manufacturing output continued to grow in 2017 with manufacturing investment relatively strong. However, employment in the sector lost some of the gains made in Manufacturing value-added (the ABS preferred measure of real output volumes) improved by 2.4% p.a. in the September quarter (Q3) of Total employment peaked at 927,100 in November 2016 before sliding to 885,500 in November 2017, just above the trough of early 2016 of 878,100 (trend). Wages in the manufacturing sector were above the average across the economy, growing by 2.2% p.a. compared to 2.0% p.a. for all industries in Q (see Chart 13). CHART 13 MANUFACTURING KEY INDICATOR GROWTH, 2017 Notes: Output, CAPEX and profits are seasonally adjusted, exports are non-adjusted 12-month rolling sum of the FOB value, employment is trend and wages are the non-adjusted wage price index. Source: ABS Ai Group s Australian PMI indicated stable or expanding activity in every month of 2017 and has now been growing or stable for fifteen consecutive months, the longest run since 2005 (see Chart 14). Although manufacturers reported an increase in activity throughout 2017, this did not translate into higher profits, with margins being squeezed by higher input prices largely relating to energy costs. The input prices sub-index drifted upwards in 2017 to a six-year high in November, while the selling price index expanded moderately for most of 2017, signalling that only some manufacturers were able to pass on cost increases to their customers. 22
.")

24 2.1 MANUFACTURING CONDITIONS IN 2017 CHART 14 MANUFACTURING KEY INDICATOR GROWTH, 2017 Source: Ai Group, ABS The large food, beverages and tobacco sub-sector continued to expand in 2017 benefiting from growing demand from Asia (partly facilitated by Free Trade Agreements). Sub-sectors exposed to residential construction appear to be decelerating, although large infrastructure projects are filling some of the gaps. The large metal products sub-sector experienced a strong recovery early in 2017, benefiting from construction and engineering activity, before cooling towards the end of year. The machinery and equipment sub-sector indicated a healthy rate of recovery throughout 2017 although the pace of growth eased towards the end of the year. This sector previously included passenger car assembly which invested heavily in local facilities and capabilities but has now exited Australia. Non-automotive respondents from this sub-sector in the Australian PMI noted increased demand for specialist equipment from food processing, agriculture, mining, transport utilities and construction customers in TABLE 2 MANUFACTURING INDUSTRIES: OUTPUT AND EMPLOYMENT, Note: The ABS has consolidated four manufacturing sub-sectors: non-metallic mineral products; wood and paper products; textile clothing and other manufacturing; and printing and recorded media into the other manufacturing sub-sector in the National Accounts. Sources: ABS Australian National Accounts Sep 2017; ABS Labour Force Australia, Detailed Quarterly, Nov
25 2.1 MANUFACTURING CONDITIONS IN 2017 Australian manufacturing CEOs participating in this year s survey reported a better year in 2017 than in the previous five years (see Chart 15). For the first time in the survey s history more manufacturing CEOs reported that business conditions improved instead of deteriorated. In 2017, a net balance of 28% of manufacturing CEOs stated business conditions were better in 2017 (52% reported improving conditions while 24% reported deteriorating conditions), compared to a net balance of 9% reporting worse conditions in 2016 (34% reported improving conditions, 43% reported worse conditions). CHART 15 NET BALANCE OF REPORTED MANUFACTURING CONDITIONS Manufacturing CEOs reported improving performance measures compared to In particular, 60% of manufacturing CEOs said their turnover increased in 2017 while 25% reporting decreased turnover (+35% net balance). There was a moderate improvement in gross profits margins in 2017, with 49% CEOs reporting improving gross profit margins in 2017 with an average increase of 16% and 25% reporting a decline, with an average decrease of 21%. Business conditions in 2017 exceeded expectations (see Chart 16). A net balance of 13% of manufacturers had expected better conditions in 2017, whereas a net balance of 28% reported better conditions in Manufacturing CEOs reported input, energy and selling prices were higher than expectations in 2017 with these cost rises exceeding expectations more so than for selling prices. For 2017, 80% of manufacturers reported increasing energy costs with an average increase in their energy costs of 31%, 67% reported increasing input prices with an average increase of 7% and 52% reported increases in their selling prices with an average increase of 4%. This highlights that margin pressures are an ongoing issue for manufacturers. This could also explain why business conditions exceeded expectations in 2017 while performance measures such as turnover, gross profit margin and export revenue fell short of expectations. 24
26 2.1 MANUFACTURING CONDITIONS IN 2017 CHART 16 MANUFACTURING EXPECTED VS REPORTED CONDITIONS, 2017 On the investment side, the number of CEOs that reported an increase in investment out numbered those that reported a decrease across the four investment questions (see Chart 17). Investment on capital expenditure and technology exceeded expectations in 2017, with 35% and 43% of respondents reporting an increase in investment with an average increase of 111% and 43%, respectively. Spending on R&D and staff training also increased from 2016 but failed to meet expectations from the start of the year. Of those that reported an increase in R&D expenditure (36%), the average increase was 18%. Of those that reported a decrease in R&D expenditure (4%), the average decrease was 32%. The average decrease in staff training expenditure was higher than the average increase in expenditure on staff training, with 29% of respondents reporting an average increase of 23% expenditure on staff training and 4% of respondents reporting an average decrease of 43% of expenditure on staff training. CHART 17 CHANGE IN REPORTED MANUFACTURING CONDITIONS,
. For this year, 48% expect business conditions to improve, while 20% expect a deterioration (+28% net balance).")
27 2.2 MANUFACTURERS EXPECTATIONS FOR 2018 Manufacturing CEOs are optimistic about business conditions for 2018, expecting a continuation of the favourable business conditions experienced in 2017 (see Chart 18). For this year, 48% expect business conditions to improve, while 20% expect a deterioration (+28% net balance). Regarding their own specific conditions, manufacturing CEOs expect broad-based improvement in In particular, 67% of CEOs expect an increase in their own sales turnover and 51% expect an improvement in their gross profit margins in 2018, while 13% expect a decline in sales (+54% net balance) and 22% expect a decline in profitability (+29% net balance). CEOs expectations for turnover are significantly higher than they were for 2017 but profitability expectations are similar. Manufacturers expect input price pressures to continue in 2018, with a tellingly high 85% expecting a further increase in energy prices and only 3% expecting a decline (+82% net balance). Energy intensive manufacturers are among the businesses hardest hit by rising energy prices and some are highly trade exposed with little ability to pass through cost increases to customers. Input prices are expected to continue increasing with 73% of CEOs expecting an increase in 2018 compared to 51% expecting an increase in selling prices. CHART 18 EXPECTED CHANGE IN MANUFACTURING CONDITIONS,
28 2.3 PROSPECTS FOR MANUFACTURING EXPORTS Australia s manufacturing sector is diverse and comprised of multiple sub-sectors that are continuing to adapt to changes in their operating environments. The partial recovery in 2017 was despite Australia bidding farewell to the passenger car assembly sector, which contributed so prominently to Australia s advanced manufacturing activities for at least 70 years. Intense pressure from global competition, a high AUD during the mining investment boom, high labour costs and disruptive technological change have meant manufacturing firms have had to innovate and invest, with many looking to sell on the global stage. Reflecting the strong performance of the Australian PMI exports sub-index, manufacturing exports increased 6.6% through the year to November 2017, to a record $103.8bn 4 (see Chart 19 and Chart 20). The increase in exports was largely driven by the most export oriented sub-sectors: food and beverages (up 13.2% p.a. to $29.2bn p.a.) and metal products (up 8.3% to $39.4bn p.a.). All sub-sectors experienced increases in exports except for transport equipment (-14.9% p.a.) and textiles and clothing (-0.3% p.a.). Interestingly, the two sub-sectors with a relatively high share of imported intermediate products the machinery and equipment (up 2.0% p.a. to $14.1bn) and the petroleum, coal & chemicals (up 5.9% to $11.3bn) sub-sectors - also experienced increases in exports. CHART 19 AUSTRALIAN PMI EXPORT SUB-INDEX VS RBA AUD TRADE WEIGHTED INDEX (AUD TWI), All exports are FOB value. 27
.")

29 2.3 PROSPECTS FOR MANUFACTURING EXPORTS CHART 20 MANUFACTURING EXPORTS, TO NOVEMBER 2017 Source: ABS, International Trade in Goods and Services, November 2017 The increase in manufacturing exports was also reflected in this year s survey, with 29% of manufacturing CEOs reporting an increase in export revenue in 2017 (+19 net balance). For those manufacturers that increased their export revenue during the year, the average increase was a significant 36%, suggesting that the manufacturers exploring export opportunities are unlocking significant new sales opportunities. Export revenue should continue to play a key role in manufacturers growth. An encouraging 35% of CEOs expect an increase in export revenue in 2018, while only 4% expect a decrease (+31% net balance). Key to this ongoing export growth for a large chunk of manufacturing will be the future trajectory of the dollar. In many cases, exporters are also importers, and so the dollar is genuinely a double-edged sword. For export markets, nearly all manufacturers expect to be competitive below US 70 cents and 90% expect to be competitive at or below US 80 cents (see Table 3). However, above this point, most manufacturers expect to be uncompetitive in export revenue, with only 39% expecting to be competitive in the US cent range and only 9% in the over US 91 cent range. Manufacturers competing with imports generally require a lower exchange rate, with the majority of these manufacturers competitive up to US 80 cents (76%), but significantly less remain competitive past this point. Perhaps reflecting the greater intensity of global competition, the proportion of manufacturers competitive past this point has fallen significantly in recent years. TABLE 3 MANUFACTURERS COMPETITIVE EXCHANGE RATES,
30 2.4 CHALLENGES FOR MANUFACTURERS IN 2018 When asked about the challenges expected to inhibit business growth in 2018, 31% of manufacturing CEOs identified a lack of customer demand as their most significant impediment. This was down from 42% of CEOs in 2017, and substantially down from 49% of respondents in 2016 (see Chart 21). CHART 21 EXPECTED IMPEDIMENTS TO GROWTH FOR MANUFACTURERS, 2018 The second most concerning constraint for manufacturers in 2018 is competition from overseas and online businesses, with 18% of respondents ranking this as their primary concern. This is comparable to 2017 and higher than 2016 and earlier years. Skills shortages emerged as a considerable concern with 16% of respondents nominating this as their top inhibitor to business growth. Labour force skills and capabilities have increased as a concern for manufacturers since In 2017 it was the primary impediment to business growth for 10% of respondents - up from 5% in Wages pressures were a top concern for 8% of respondents, as was a high or variable exchange rate. A high and/or volatile exchange rate is also a concern for businesses importing inputs, exporting or both. A further 7% of CEOs said government regulatory burden is their top concern in 2018, up from 4% in
31 2.5 STRATEGIES FOR MANUFACTURERS IN 2018 Manufacturing businesses expect their growth in 2018 to occur primarily from improving sales of current products and services, with 35% of respondents ranking it as their main strategy for growth. This is down from 42% of manufacturers who rated it their principal strategy in 2017, and a similar proportion of respondents (34%) in 2016 (see Chart 22). CHART 22 BUSINESS STRATEGIES FOR MANUFACTURERS, 2018 Introducing new products and services is the second most popular strategy for businesses with 32% of manufacturers expecting to grow their business in this way. This is up from a quarter of respondents in 2017 but down from the 39% of manufacturers who favoured this option in Over the past couple of years there has been a slight change of strategy for manufacturers as more have moved to better leverage growth from existing products and services, than have focused on developing new items. Together these two strategies account for two thirds of the growth plans for manufacturers in Developing new domestic markets is the leading growth strategy for 10% of manufacturing businesses, the same proportion as in 2017, and up from 6% in 2016, while downsizing and reducing operational costs has fallen consistently for manufacturers as their primary strategy down to 8% in 2018, from a high of 17% in
32 3.SERVICES BUSINESSES PROSPECTS IN 2018 Services industries that mainly distribute and sell goods to businesses and consumers include transport, storage, wholesale trade and retail trade. Services industries that mainly provide services to consumers include hospitality (cafes, restaurants, hotels and accommodation), education, healthcare, arts, recreation and personal services (such as hairdressing, mechanics and cleaning). Services industries that provide services to both consumers and other businesses include IT, media, telecommunications, finance, professions (e.g. legal, accounting and engineering services), administrative services, rental and real estate services Public administration (government services) is another large services industry but it is excluded from the scope of this report. Public administration accounted for around 5.5% of GDP and 6.0% of employment in
 improved 3.4% p.a. compared to 2.8% p.a. for the Australian economy. Professional services had the strongest annual growth (+6.")
33 3.1 SERVICES BUSINESS CONDITIONS IN 2017 The services sector outpaced the rest of the economy terms of output and employment growth in 2017 (see Chart 23). Services value-added (the ABS preferred measure of real output volumes) improved 3.4% p.a. compared to 2.8% p.a. for the Australian economy. Professional services had the strongest annual growth (+6.0% p.a.), followed by health services (+4.6% p.a.) and the financial and insurance sector (+4.5% p.a.). Employment growth in the services sector was one of the main drivers behind the improving labour market in 2017, rising 4.1% p.a. compared to 3.3% p.a. for the entire labour market (trend). Employment growth in the services sector was largely concentrated in predominately lower-wage sectors such as health, retail and food and accommodation services (see Table 4). Ai Group s Australian PSI experienced a relatively strong year, reflecting an improvement in broader economic conditions (see Chart 24). Differences between services sectors remain apparent, with conditions better in the business-oriented sub-sectors than in the consumer-oriented sub-sectors. Business-oriented sub-sectors noted good levels of demand from the construction, infrastructure and mining sectors, while consumer-oriented sub-sectors reported hesitant consumer spending in The transport and storage sub-sector faced challenging headwinds from reduced volumes and sharp rises in energy costs. The large health, education and the community services sub-sector contracted in 2017 and probably suggests a pausing or slight reduction in growth rates after a strong period of expansion between 2013 to In contrast, conditions in personal and recreational services, property and business services, finance and insurance services and wholesale trade were particularly strong. CHART 23 SERVICES KEY INDICATOR GROWTH, 2017 Sources: Ai Group and ABS Australian National Accounts Sep


34 3.1 SERVICES BUSINESS CONDITIONS IN 2017 TABLE 4 SERVICES INDUSTRIES: OUTPUT AND EMPLOYMENT, 2017 Sources: ABS Australian National Accounts Sep 2017; ABS Labour Force Australia, Detailed Quarterly, Nov CHART 24 AUSTRALIAN PSI AND ABS HOUSEHOLD CONSUMPTION Sources: Ai Group and ABS Australian National Accounts Sep
35 3.1 SERVICES BUSINESS CONDITIONS IN 2017 In 2017, services sector CEOs reported improvements across several key performance measures after reporting deteriorating conditions In particular, business conditions improved substantially and outperformed expectations from the start of Turnover rebounded after a poor performance in 2016 with 52% of CEOs reporting an increase in turnover while 19% reported declining turnover in 2017 (+33% net balance). Similarly, gross profit margins expanded for a greater proportion of services businesses in 2017 than in the previous two years (see Chart 25). The number of CEOs reporting expanding gross profit margins (36%) outnumbered the proportion of CEOs that reported declining gross profit margins (21%, +15% net balance). Employment numbers did not change for the majority (50%) of services businesses in 2017 although more businesses in the services sector increased their employment numbers (38%) than decreased their employment numbers (13%) in Export revenue fell for a greater number of businesses than those reporting increases with 22% reporting an average decline in export revenue of 16% and 13% reporting an increase in export revenue (-9% net balance). CHART 25 SERVICES BUSINESS KEY PERFORMANCE INDICATORS, Looking at various types of business investment in 2017, spending on technology and staff training increased for 48% and 35% of businesses respectively, mostly in line with expectations at the start of the year (see Chart 26). For businesses reporting an increase in spending on technology, the average increase was 36% while the average increase for businesses reporting an increase in spending on staff training was 11%. R&D expenditure was slightly above expectations in 2017, with 23% of CEO s reporting an increase in spending and most respondents reported no change from 2016 (77%). In 2017, the number of CEOs reporting an increase in spending on physical capital fell to 21%, while the number of CEO s reporting a decrease in spending increased to 12% (+8% net balance). 34
36 3.1 SERVICES BUSINESS CONDITIONS IN 2017 As with manufacturers, energy prices increased for more service businesses in 2017 (see Chart 26), with 63% of CEO s reporting an increase in energy prices (+54% net balance), with an average price increase of 9.4%. Input prices for services were better in 2017 than in 2016, with 40% reporting an increase in input prices in 2017, compared to 45% in 2016 and slightly more respondents reporting declining input prices in 2017 (13%) compared to 2016 (9%). Selling prices improved from 2017, increasing for 41% of CEO s and decreasing for 17% (+23% net balance). This net balance is in line with CEO expectations at the start of CHART 26 SERVICES EXPECTED VS REPORTED CONDITIONS, 2017 CHART 27 CHANGE IN SERVICES CONDITIONS,
37 3.2 SERVICES BUSINESSES EXPECTATIONS FOR 2018 Services sector CEOs are more optimistic about business condition for 2018 than they were a year earlier, expecting a continuation of the improved business conditions experienced in Heading into 2018, 40% of CEOs expect general business conditions to improve, while 17% expect a deterioration (+23% net balance). This is more optimistic than a year earlier, when 32% of service industry CEOs expected improving business conditions and 22% expected declining business conditions (+10% net balance). Encouragingly, the majority of service industry CEOs expect an increase in turn over (+65%) and employment (56%) as a result of an increase in activity. The proportion of CEOs that are expecting profit margins to increase has remained steady, but the proportion of CEOs expecting their gross profit margins to decline has decreased from 26% in 2017 to 13% in The majority (74%) of CEOs expect no change in the export revenue, while 24% are expecting export revenue to increase. CEOs expect energy prices and input prices to rise in Energy prices remain a concern across the services industry with 68% of CEOs expecting their energy prices to increase and none expect prices to decline. Some 47% of service industry CEOs expect other input prices to rise in 2018 and 51% expect no change. More CEOs are expecting to pass on the expected price increases to customers with 48% expecting to increase selling prices, 40% expecting no change and 13% expecting to decrease their selling prices. Services industry CEOs expect to increase investment on staff training and physical capital expenditure in 2018, with 50% of CEOs expecting to increase spending on staff training an 34% expecting to increase spending on physical capital expenditure. This is up from 38% of CEOs expecting to increase spending on staff training and 27% expecting to increase spending on physicals capital expenditure in Expectations are similar to 2017 for spending on R&D expenditure and technology. CHART 28 EXPECTED CHANGE IN SERVICES BUSINESS CONDITIONS,
38 3.3 CHALLENGES FOR SERVICES BUSINESSES IN 2018 Services sector businesses consider a lack of customer demand to be the largest impediment to growth in 2018, with almost half (49%) of services CEOs identifying it as their main concern. This was up from 29% of CEOs in 2017, but a similar level to that seen in 2016 (46%) and 2015 (42%). It is however, the highest level recorded in the six years the CEO survey of business prospects has been conducted. CHART 29 EXPECTED INHIBITORS TO GROWTH FOR SERVICES BUSINESSES IN 2018 The second most concerning constraint for services businesses in 2018 is skills shortages, this is a primary concern for 18% of services businesses, up from 6% in 2017 and 5% in While other issues have dominated concerns for services businesses in the past few years, the re-emergence of skills as a primary concern signals a new focus on the expectations that business have for skilled staff. From the introduction of new technologies to online capabilities, businesses are once again feeling pressures of skills shortages much as they did in 2013, meanwhile issues such as the exchange rate, wage pressures and competition from imports and online selling have fallen back for Competition from overseas and online businesses, has fallen as a major concern for 2018 with 9% of businesses ranking it their primary concern, down from 32% in 2017, back to the levels seen in 2016 and 2015 (10% each year). Government regulatory burdens are a primary concern for 9% of services respondents, up slightly from 2017 (8%) but down from a survey high of 18% in Wage pressures have dropped as a primary concern for services businesses as have industrial relations and the value of the Australian dollar. 37
39 3.4 STRATEGIES FOR SERVICES BUSINESSES IN 2018 Services businesses expect their growth in 2018 to occur primarily from introducing new services, with 44% of respondents ranking it as their principal strategy for development. This has increased from 37% of services businesses who considered it their main plan in 2017, and a much smaller proportion (20%) in CHART 30 BUSINESS STRATEGIES FOR SERVICES BUSINESSES 2018 Improving sales of current products and services is the second most popular strategy for businesses with 33% of services businesses planning to leverage existing offerings, up from around a quarter (24%) in 2017, and the same level (33%) of services businesses who favoured this as an option in Combined, introducing new products and services and focusing on existing outputs, account for the large majority (78%) of the growth plans for services businesses in 2018, more so than other industry sectors. Downsizing and reducing operational costs is a first priority for 9% of services businesses, up from 6% in 2017 but well down on the 18% and 17% seen in 2016 and 2015 respectively. Developing new domestic markets has also fallen slightly to 7%, down from 8% in the previous year. While developing new markets, marketing and developing their online presence have a place in the growth plans of services businesses, they are not at the forefront of their development policies. In 2018 Services CEOs are anticipating focusing on their product offering first, before other measures are considered. 38
40 4.CONSTRUCTION INDUSTRY PROSPECTS IN 2018 Australian construction activities include engineering construction (mining and transport infrastructure projects including roads, bridges and ports); commercial construction (offices, shopping centres, schools, hospitals and other public buildings); industrial construction (factories and warehouses); houses and multi-unit residences (flats, units and apartments). Mining services CEO responses were aggregated within the construction industry responses. Australian mining services businesses include mining equipment providers (e.g. mining extraction equipment and specialised machinery and equipment for mining construction, extraction and production) and mining services providers (e.g. exploration, engineering and project management services). 39
,")
.")
41 4.1 CONSTRUCTION INDUSTRY CONDITIONS IN 2017 Construction industry output accounted for 7.4% of total GDP in Q Real construction output (in inflation adjusted terms) rose 3.0% p.a., driven by an increase in engineering construction (+9.4% p.a.), followed by building construction (+1.6% p.a.) and construction services (+1.1% p.a.). Engineering work has tapered off since the peak of the mining investment boom but appears to be rebounding from the most recent trough in 2016, as large transport and infrastructure projects in the eastern states come online. Despite warnings of a downturn in building investment, housing and non-residential building construction is poised to strengthen in the first half of 2018 with the value of residential and non-residential building approvals increasing in every month of 2017 (m/m, trend until to November 2017). Employment growth has been strong for the construction industry, up 8.5% p.a. in November 2017, compared to 3.3% p.a. for the whole economy (trend). The sector employs well over one million people, accounting for 9.4% of the workforce. Only health services and retail trade employ more people nationwide, but both have high rates of part-time workers (49.7% in retail and 44.1% in health, versus 15.0% in construction), so the construction industry employs more full-time workers (around 960,000) than any other industry. CHART 31 CONSTRUCTION KEY INDICATOR GROWTH, 2017 Notes: Output and profits are seasonally adjusted, employment is trend and the WPI is original. Source: ABS TABLE 5 CONSTRUCTION INDUSTRIES: OUTPUT AND EMPLOYMENT, 2017 Sources: ABS Australian National Accounts Sep 2017; ABS Labour Force Australia, Detailed Quarterly, Nov
42 4.1 CONSTRUCTION INDUSTRY CONDITIONS IN 2017 Ai Group s Australian PCI shows construction businesses experienced a positive year in 2017, after two years of struggling to gain traction (see Chart 32). Apart from January, the Australian PCI recorded expansion in every month of 2017, peaking mid-year before the industry s overall growth momentum slowed in the final months of Apartment building activity retreated in 2017 with builders citing soft new orders and reduced investor activity as a steady widening of foreign investor penalties came in across a number of states. Even with the steady retreat in apartment building, construction activity was robust through the year. Reflecting the ABS data, the engineering construction sub-index remained elevated throughout The sub-sector recorded an 11½-year high in November on the back of rising momentum in the roll-out of large-scale infrastructure projects. Builders and constructors reported higher input costs throughout 2017 with energy, construction materials and wages all on the rise. An elevated wages sub-index in the Australian PCI, along with a drop in the underemployment rate in the sector (from 6.4% in November 2016 to 4.4% in November 2017) provides further evidence of a steady pick-up in wages. CHART 32 AUSTRALIAN PCI AND ABS CONSTRUCTION OUTPUT VOLUMES Source: Ai Group and ABS National Accounts. Construction industry CEOs reported improved business conditions in 2017, with 63% of CEOs reporting improved conditions and only 3% reporting deteriorating conditions (+60% net balance). This compares to 30% of CEOs who had reported improving conditions in 2016 and 39% who had reported deteriorating conditions in 2016 (-9% net balance). The net balance of other key indicators in 2017 including turnover, gross profit margins and employment were higher than the previous 5 years (see Chart 33). Similarly, 36% of construction CEOs said their profit margin improved in 2017 and 21% reported a decline (+15% net balance). For those with an increased profit margin in 2017, their margin increased by an average of 10%. For those with a shrinking margin, their profit margin contracted by an average of 16%. 41
43 4.1 CONSTRUCTION INDUSTRY CONDITIONS IN 2017 CHART 33 CONSTRUCTION INDUSTRY BUSINESSES INDICATORS, Other performance measures improved for construction businesses but fell short of expectations at the start of the year (see Chart 34). 52% of construction industry CEOs reported an increase in turnover and 19% reported a decline in 2017 (+33% net balance) compared to 62% of CEOs at the start of the year who had expected an increase in turnover and only 9% that expected a decline in turnover. Even though expectations were not met, 2017 was an improvement from 2016 with only 19% of CEOs reporting declining conditions in 2017 compared to 37% in A number of other key measures failed to meet expectations in 2017 including staff training, capital expenditure, spending on technology and selling prices. In 2017, a greater proportion of CEOs reported an increase in investment spending than the proportion that reported declining investment spending across the four investment factors. However, most CEOs reported no change in staff training (65%), capital expenditure (67%) and R&D expenditure (77%). Continuing the positive trend from 2016 was the increase in spending on technology by construction businesses (see Chart 35). 48% of construction CEOs reported increasing spending on technology with an average increase in spending on technology of 36%, while only 6% reported a decrease in spending. Of those that decreased spending on technology, the average decrease was 9%. As with the manufacturing and services industry, the majority of CEOs in the construction industry reported rising energy costs in % of CEOs reported rising energy prices with an average increase of 9%, while only 9% reported a decline in energy prices. Selling prices increased for 40% of CEOs in the construction sector and declined for 17% of construction CEOS. On net, this fell below CEO expectations from the start of the year where 42% expected an increase in selling prices and 3% of CEOs expected a decline in selling prices. 42
44 4.1 CONSTRUCTION INDUSTRY CONDITIONS IN 2017 CHART 34 CONSTRUCTION INDUSTRY, EXPECTED VS ACTUAL CONDITIONS, 2017 CHART 35 CHANGE IN CONSTRUCTION INDUSTRY CONDITIONS,

45 4.2 CONSTRUCTION BUSINESSES EXPECTATIONS FOR 2018 Construction CEOs are optimistic about 2018 although rising energy prices and input costs remain a concern (see Chart 36). An encouraging 84% of construction CEOs expect their sales turnover to increase in 2018 and 55% expect an improvement in business conditions. Employment is expected to increase for most construction businesses, with 74% of CEOs indicating they expect to increase employment in Construction CEOs expect to continue to invest in new technologies in Most CEOs expect to increase spending on staff training (61%), physical capital expenditure (50%) and technology (52%). 57% of CEOs expect no change to their R&D expenditure while 37% expect to increase R&D expenditure. Energy prices are expected to continue to rise in 2018, with 80% of construction CEOs expecting energy prices to rise and 20% expecting no change. It appears, that many but not all expect to be able to pass on these costs, with 71% of CEOs expecting to increase their selling prices and 29% expecting no change. The majority of CEOs (59%) expect input prices to rise, 38% expect no change and 3% expect declining input prices. CHART 36 EXPECTED CHANGE IN CONSTRUCTION CONDITIONS,
46 4.3 CHALLENGES FOR CONSTRUCTION BUSINESSES IN 2018 Just over a third (34%) of construction CEOs identified the largest risk to business growth in 2018 as a lack of customer demand. As in previous years this was the most commonly identified hindering factor facing construction CEOs in the year ahead, however it has fallen from over half of respondents in 2017 (53%) and more than two-thirds (69%) of CEOs in CHART 37 EXPECTED CHANGE IN CONSTRUCTION CONDITIONS, 2018 Flexibility of industrial relations in 2018 was a primary concern for 19% of respondents, a substantial increase from 3% in 2017 and 4% in As skills shortages have lessened as a primary concern for respondents (down to 9% for 2018, compared to 13% in 2017) and wage pressures have also eased as a principal constraint (3% compared to 9% for 2017), it has made way for other issues surrounding employment to emerge. Competition from imports for businesses supplying to other businesses within the construction industry rose to 13%, up from 9% in 2017 and While this affected 13% of respondents as their foremost inhibitor, it is a factor that has been increasing since Government regulations were a concern for 9% of respondents for 2018, much the same as they were for 2017 stable, after drifting up slightly the previous few years. 45
47 4.4 STRATEGIES FOR CONSTRUCTION BUSINESSES IN 2018 As in previous years, construction firms plan to focus on improving sales of their current products and services. However, after steadily increasing across the previous years the survey was conducted, this strategy has decreased as a primary strategy down to 36% of construction businesses from a survey high in 2017 of 56%. CHART 38 BUSINESS STRATEGIES FOR CONSTRUCTORS 2018 Developing new domestic markets is the first priority for 29% of construction businesses, lifting from 16% in 2017 and 13% in Australian constructors are focusing on local markets in 2018 in response to infrastructure spending and strong building approvals in some states. Introducing new products and services is the foremost plan for 19% of constructors up from 16% in 2017 and well up from 4% in Increasing advertising and marketing activity has lifted as a strategy for 13% of respondents, up from 3% in 2017 prior to 2018 it did not really rate as a primary strategy for builders, but has risen in line with the desire to develop local markets. As was the case for 2017, downsizing and reducing operational costs was a focus for 3% of respondents. After four years of considering it a primary strategy for a much greater proportion of constructors, the approach has alternated from one of constraining costs, to a focus on growth plans. 46
 and had an aggregate annual turnover of around $20 billion in 2017.")
. Victoria was somewhat over-represented in the sample, relative to other states.")
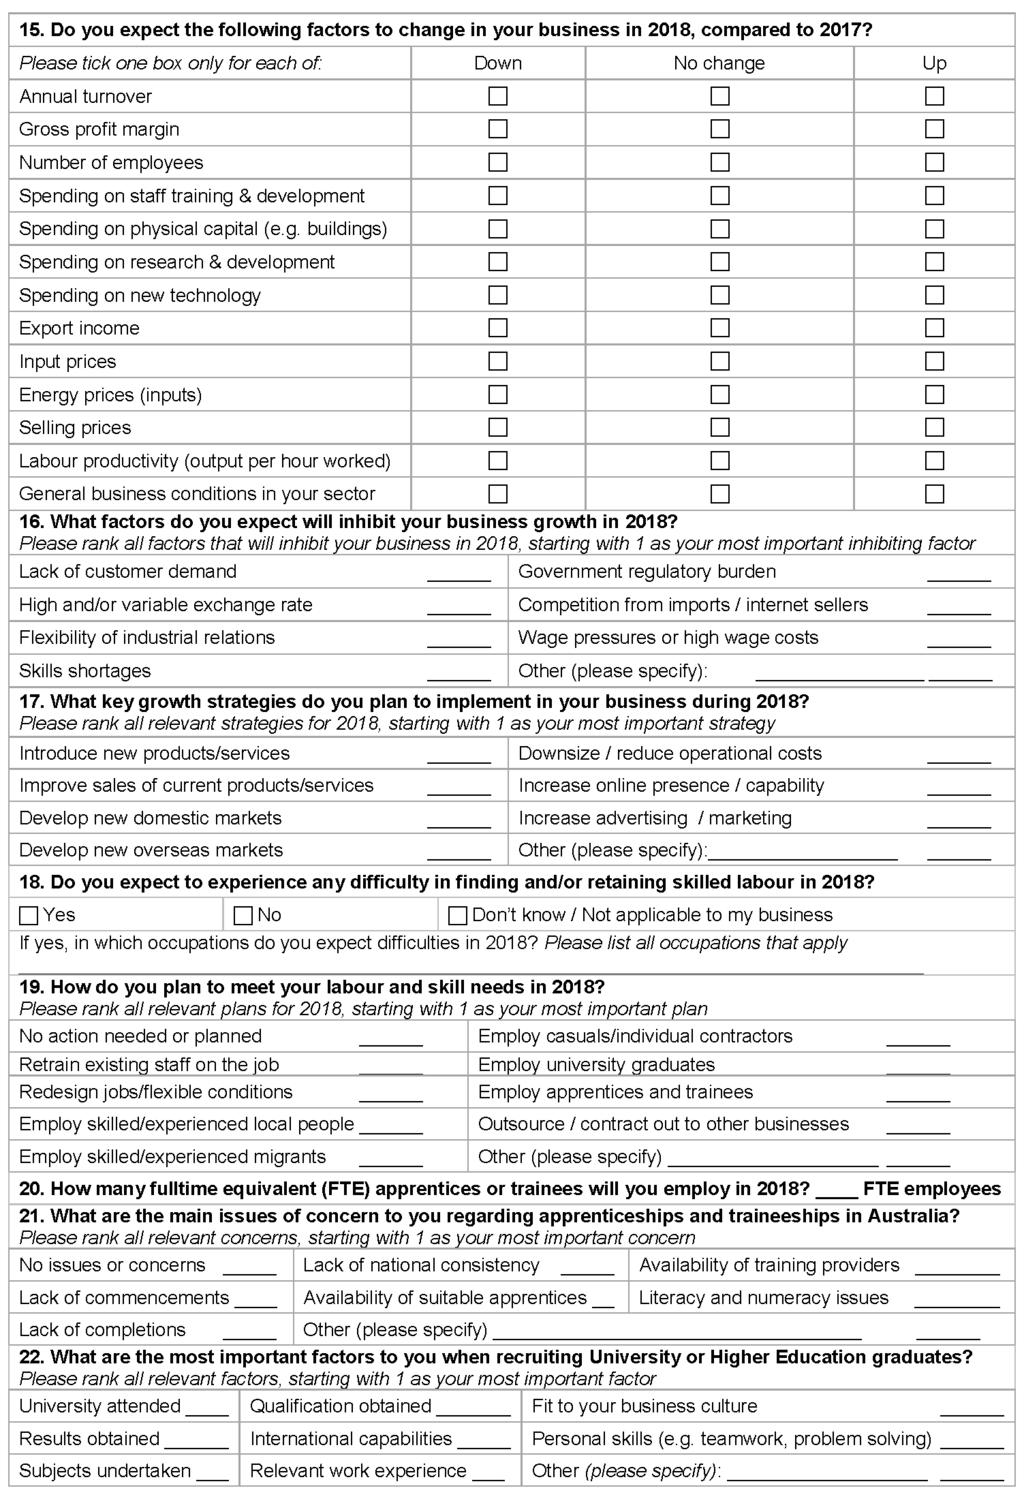
48 APPENDIX: CEO BUSINESS PROSPECTS SURVEY 2018 PARTICIPANTS AND QUESTIONNAIRE Responses were received from the CEOs of 269 private-sector businesses across Australia in October and November Together, these businesses employed around 43,000 people (170 people each on average) and had an aggregate annual turnover of around $20 billion in All Australian states and all major non-farm private-sector industries are represented in this year s CEO survey. The manufacturing sector contributed the highest proportion of respondents (69%). Manufacturing s share of this sample is higher than its share of national production (5.8%). Victoria was somewhat over-represented in the sample, relative to other states. The data presented in the summary section of this report were weighted by industry (based on ABS estimates of their value-added contribution to GDP in ) in order to adjust for these characteristics of the sample. The analysis for each of the industry groups is not affected by the sample composition. *only includes construction value added output. ** These industries do not sum to GDP due to the exclusion of utilities (2.4% of GDP), public administration and safety services (5.5%), agriculture (2.4%), mining other than mining services (5.8% of GDP), ownership of dwellings (8.7% of GDP) and other additional statistical items that are included in GDP. The services sectors represented in this sample include: IT, communications and media services; transport, post and storage services; wholesale trade; retail trade; finance and insurance; real estate and property services; professional services; administrative services; health and welfare services; education; hospitality (food and accommodation services); arts and recreation services; and personal services. 47

49 APPENDIX: CEO BUSINESS PROSPECTS SURVEY 2018, PARTICIPANTS AND QUESTIONNAIRE 1. Record Number: 2. Postcode: 48
50 49
9 March 2018 AUSTRALIAN ECONOMIC DEVELOPMENTS. Services and construction stay on track in February
 AUSTRALIAN ECONOMIC DEVELOPMENTS 9 March 2018 This week the Reserve Bank of Australia (RBA) left the cash rate on hold at a record low of 1.50%, where it has been since August 2016. The accompanying statement
NAB MONTHLY BUSINESS SURVEY JUNE 2018
 EMBARGOED UNTIL: 11:3AM AEST, 1 JULY 218 NAB MONTHLY BUSINESS SURVEY JUNE 218 CONFIDENCE AND CONDITIONS HOLD STEADY NAB Australian Economics There was little change in headline business conditions and
NATIONAL CEO SURVEY Business Prospects for 2019 Leadership needed as economy softens
 The Australian Industry Group NATIONAL CEO SURVEY Business Prospects for 2019 Leadership needed as economy softens January 2019 Business prospects JANUARY 2019 The Australian Industry Group ABOUT Ai GROUP
NAB MONTHLY BUSINESS SURVEY NOVEMBER 2018
 EMBARGOED UNTIL: 11:3AM AEDT, 11 DECEMBER 218 NAB MONTHLY BUSINESS SURVEY NOVEMBER 218 DOWNWARD TREND CONTINUES NAB Australian Economics Key Messages from the Survey: Both business conditions and confidence
9 November 2018 AUSTRALIAN ECONOMIC DEVELOPMENTS
 9 November 2018 AUSTRALIAN ECONOMIC DEVELOPMENTS This week the Reserve Bank of Australia (RBA) left the cash rate at a record low of 1.50%. The RBA expects inflation and wages to accelerate gradually from
NAB MONTHLY BUSINESS SURVEY APRIL 2018 BUSINESS CONDITIONS AT RECORD LEVELS
 EMBARGOED UNTIL: 11:3AM AEST, 7 MAY 218 NAB MONTHLY BUSINESS SURVEY APRIL 218 BUSINESS CONDITIONS AT RECORD LEVELS NAB Australian Economics There was a significant improvement in business conditions in
Australian Economy April Julie Toth Chief Economist Australian Industry Group
 Australian Economy April 2018 Julie Toth Chief Economist Australian Industry Group No recession in 26 years (since 1991) but we re still quite slow and fragile. Real GDP grew by only 2.4% in Q4 of 2017
Monthly Bulletin of Economic Trends: Review of the Australian Economy
 MELBOURNE INSTITUTE Applied Economic & Social Research Monthly Bulletin of Economic Trends: Review of the Australian Economy December 7 Released on December 7 Outlook for Australia Economic Activity Actual
16 November 2018 AUSTRALIAN ECONOMIC DEVELOPMENTS
 16 November 2018 AUSTRALIAN ECONOMIC DEVELOPMENTS Australia s labour market continues to expand strongly in 2018. Jobs growth seems to be stronger than had been anticipated by the RBA, Government and financial
OUTLOOK WESTERN AUSTRALIA S TURNING POINT ABOUT OUTLOOK
 OUTLOOK February 2018 I Chamber of Commerce and Industry of Western Australia (Inc) WESTERN AUSTRALIA S TURNING POINT ABOUT OUTLOOK Outlook is CCIWA s biannual analysis of the Western Australian economy.
Victorian Economic Outlook
 Thursday, November 1 Victorian Economic Outlook Summary The Victorian economy has been through difficult conditions over the past few years. GSP grew by.% in 11-1, easing from growth of.7% in 1-11, and
Future Business Index Update. March 2014
 Future Business Index Update March 2014 02 Contents A focus on the future 03 Economic perspective 04 Optimism remains strong 05 States and industries 06 Amid patchy growth, conditions are set to stay unchanged
Inflation reaches the lower end of RBA target band at 2.1% p.a. in Q2 2018
 27 July 2018 AUSTRALIAN ECONOMIC DEVELOPMENTS Australia s consumer price index (CPI) accelerated to 2.1% p.a. in the June quarter of 2018 (Q2), reaching the lower end of the RBA s target band of 2 to 3%
June Summary. Business investment weighs on growth. 1Q15 GDP Growth. Components of GDP
 Mar 95 Jul 96 Nov 97 Mar 99 Jul 00 Nov 01 Mar 03 Jul 04 Nov 05 Mar 07 Jul 08 Nov 09 GDP Australian 1Q15: GDP: An Export XXX Story June 2015 June 2015 Summary Business investment weighs on growth GDP grew
NAB QUARTERLY BUSINESS SURVEY 2018 Q2 FAVOURABLE BUSINESS CONDITIONS PERSIST
 EMBARGOED UNTIL: 11:3AM AEST, 19 JULY 218 NAB QUARTERLY BUSINESS SURVEY 218 Q2 FAVOURABLE BUSINESS CONDITIONS PERSIST NAB Australian Economics After strengthening to historically high levels in Q1, business
NAB MONTHLY BUSINESS SURVEY JANUARY 2018 FURTHER CONFIRMATION OF BUSINESS STRENGTH
 EMBARGOED UNTIL: :3AM AEDT, 3 FEBRUARY 28 NAB MONTHLY BUSINESS SURVEY JANUARY 28 FURTHER CONFIRMATION OF BUSINESS STRENGTH NAB Australian Economics Strong trend business conditions provide further confirmation
Monthly Bulletin of Economic Trends: Economic Activity in the Major States
 MELBOURNE INSTITUTE Applied Economic & Social Research Monthly Bulletin of Economic Trends: Economic Activity in the Major States January 2018 Monthly Bulletin of Economic Trends January 2018 Released
CPA Australia Management accounting conference Australian economy Julie Toth Chief Economist Australian Industry Group. aigroup.com.
 CPA Australia Management accounting conference 2016 Australian economy 2016-17 Julie Toth Chief Economist Australian Industry Group Events & opportunities for Australian business in 2016-17: Global and
March June Summary. A sharp improvement in nominal growth. Components of GDP. 4Q16 GDP Growth
 GDP Australian 4Q16: GDP: A return XXX to growth June 2015 March 2017 Summary The economy returned decisively to growth in the final quarter of 2016, recording 1.1% growth q-q. This was boosted by household
23 February 2018 AUSTRALIAN ECONOMIC DEVELOPMENTS. IMF updates assessment and forecasts for Australia
 AUSTRALIAN ECONOMIC DEVELOPMENTS 23 February 2018 This week the IMF updated its assessment of Australia s economy. It noted Australia has been relatively successful in adjusting to the end of the mining
EMBARGOED UNTIL: 11:30AM AEDT, 30 JANUARY 2018 NAB MONTHLY BUSINESS SURVEY
 EMBARGOED UNTIL: 11:3AM AEDT, 3 JANUARY 18 NAB MONTHLY BUSINESS SURVEY THE STATE OF PLAY ACCORDING TO BUSINESS - DECEMBER 17 NAB Australian Economics The NAB Monthly Business Survey indicate a strong business
Julie Toth. Advanced Manufacturing: Beyond the production line. Chief Economist Australian Industry Group. Connect with
 Connect with us: @ceda_news Advanced Manufacturing: Beyond the production line Follow the conversation: #Manufacturing P R E S E N T A T I O N B Y Julie Toth Chief Economist Australian Industry Group S
Inflation remains below RBA target band at 1.9% p.a. in Q1 2018
 27 April 2018 AUSTRALIAN ECONOMIC DEVELOPMENTS Australia s consumer price index (CPI) held steady at 1.9% p.a. in the March quarter (Q1) of 2018, remaining below the RBA target band of 2 to 3% over the
Services sector: slow start to 2019 as sales drop
 January 2019 Media Contact: Tony Melville, Australian Industry Group. 0419 190 347 Services sector: slow start to 2019 as sales drop The Australian Industry Group Australian Performance of Services Index
National Accounts - GDP A Game Changer?
 Wednesday, March 1 National Accounts - GDP A Game r? GDP growth was stronger than expected, rising by.% in the December quarter. Moreover, September s quarterly growth was revised upwards from.9% to 1.1%.
NAB MONTHLY BUSINESS SURVEY FEBRUARY 2018 BUSINESS CONDITIONS SURGE
 EMBARGOED UNTIL: 11:3AM AEDT, 13 MARCH 18 NAB MONTHLY BUSINESS SURVEY FEBRUARY 18 BUSINESS CONDITIONS SURGE NAB Australian Economics Business conditions were at a record high in February, with the broad-based
Monthly Bulletin of Economic Trends: Review of the Australian Economy
 MELBOURNE INSTITUTE Applied Economic & Social Research Monthly Bulletin of Economic Trends: Review of the Australian Economy March 2018 Released on 22 March 2018 Outlook for Australia 1 Economic Activity
VICTORIAN BUILDING & CONSTRUCTION INDUSTRY OUTLOOK
 VICTORIAN BUILDING & CONSTRUCTION INDUSTRY OUTLOOK MARCH 2017 QUARTERLY UPDATE 15 JUNE 2017 PREPARED FOR THE MASTER BUILDERS ASSOCIATION OF VICTORIA STAFF RESPONSIBLE FOR THIS REPORT WERE: Director Senior
Services sector slows down as year ends
 December 2018 Media Contact: Tony Melville, Australian Industry Group. 0419 190 347 Services sector slows down as year ends The Australian Industry Group Australian Performance of Services Index (Australian
28 October 2016 AUSTRALIAN ECONOMIC DEVELOPMENTS. Inflation remains weak in the Q3 2016
 28 October 2016 AUSTRALIAN ECONOMIC DEVELOPMENTS This week s ABS inflation data (CPI) for the September quarter (Q3) showed headline inflation picking up to 1.3% p.a. (from 1.0% p.a.). Fruit and electricity
Ontario Economic Accounts
 SECOND QUARTER OF 2017 April, May, June Ontario Economic Accounts ONTARIO MINISTRY OF FINANCE Table of Contents ECONOMIC ACCOUNTS Highlights 1 Ontario s Economy Continues to Grow Expenditure Details 2
20 July 2018 AUSTRALIAN ECONOMIC DEVELOPMENTS
 20 July 2018 AUSTRALIAN ECONOMIC DEVELOPMENTS This week the RBA reiterated its view that there is no case for a near-term change in the cash rate. Eventually the next move in the cash rate would more likely
20 April 2018 AUSTRALIAN ECONOMIC DEVELOPMENTS. IMF upgrades forecasts for Australian economic growth
 20 April 2018 AUSTRALIAN ECONOMIC DEVELOPMENTS This week the RBA reiterated its view that there is no case for a near-term adjustment in the cash rate but that eventually it is likely that the next move
AUSTRALIAN ECONOMIC UPDATE
 AUSTRALIAN ECONOMIC UPDATE GDP Q 1 Another decent outcome NAB Group Economics 5 September 1 Bottom line: GDP recorded another solid outcome in Q (+.9% q/q and +3.% y/y). Growth was again supported by domestic
Market Overview. Australian Shares
 Market Overview Australian Shares Australian shares were weakening even before the global late August squall and were always likely to travel badly when market conditions turned bumpy: o For the quarter,
Future Business Index Update
 Future Business Index Update June 2014 02 Contents Investing for growth 3 Economic perspective 4 As confidence dips, the mid-market seeks new opportunities 5 States and industries 6 Seeking new opportunities
Services activity bounces in November
 November 2018 Media Contact: Tony Melville, Australian Industry Group. 0419 190 347 Services activity bounces in November The Australian Industry Group Australian Performance of Services Index (Australian
Victorian Economic Outlook
 Wednesday, August 1 Victorian Economic Outlook Summary The Victorian economy has performed well over the past couple of years. The combination of low interest rates and a still-low Australian dollar has
Economic activity gathers pace
 Produced by the Economic Research Unit October 2014 A quarterly analysis of trends in the Irish economy Economic activity gathers pace Positive data flow Recovery broadening out GDP growth revised up to
Ai GROUP SUBMISSION. Fair Work Commission. Annual Wage Review
 Ai GROUP SUBMISSION Fair Work Commission Annual Wage Review 2015-2016 30 March 2016 About Australian Industry Group The Australian Industry Group (Ai Group) is a peak industry association in Australia
SME Monitor Q aldermore.co.uk
 SME Monitor Q1 2014 aldermore.co.uk aldermore.co.uk Contents Executive summary UK economic overview SME inflation index one year review SME cost inflation trends SME business confidence SME credit conditions
Global PMI. Global economy buoyed by rising US strength. June 12 th IHS Markit. All Rights Reserved.
 Global PMI Global economy buoyed by rising US strength June 12 th 2018 2 Global PMI rises but also brings signs of slower future growth At 54.0 in May, the headline JPMorgan Global Composite PMI, compiled
Monthly Bulletin of Economic Trends: Economic Activity in the Major States
 MELBOURNE INSTITUTE Applied Economic & Social Research Monthly Bulletin of Economic Trends: Economic Activity in the Major States October 2018 Released at 11AM on 25 October 2018 Economic Activity in the
Global PMI. Global economy suffers loss of momentum in March. April 10 th IHS Markit. All Rights Reserved.
 Global PMI Global economy suffers loss of momentum in March April 10 th 2018 2 Global economy suffers marked loss of growth momentum Global economic growth slowed sharply to the weakest for over a year
Economic Outlook. William Strauss Senior Economist and Economic Advisor Federal Reserve Bank of Chicago
 Economic Outlook CRF Credit & A/R Forum & EXPO Salt Lake City, UT October 23, 218 William Strauss Senior Economist and Economic Advisor Federal Reserve Bank of Chicago What I said In August The outlook
AUSTRALIAN ECONOMIC UPDATE
 AUSTRALIAN ECONOMIC UPDATE Business and government led growth NAB Group Economics December 17 Bottom line: Moderate growth momentum in Q3, mainly led by business and government investment. Households are
Svein Gjedrem: The conduct of monetary policy
 Svein Gjedrem: The conduct of monetary policy Introductory statement by Mr Svein Gjedrem, Governor of Norges Bank (Central Bank of Norway), at the hearing before the Standing Committee on Finance and Economic
South Korea: new growth model emerging?
 ING Business Opportunity Report Economics Department South Korea: new growth model emerging? Summary conclusions The growth outlook for Korea in the short to medium term is positive. ING forecasts economic
Victorian Economic Outlook
 Tuesday, August 1 Victorian Economic Outlook Summary The Victorian economy has had its fair share of headwinds in recent years, but the tide may be turning. For some time, we have been optimistic that
GLOBAL ENTERPRISE SURVEY REPORT 2009 PROVIDING A UNIQUE PICTURE OF THE OPPORTUNITIES AND CHALLENGES FACING BUSINESSES ACROSS THE GLOBE
 GLOBAL ENTERPRISE SURVEY REPORT 2009 PROVIDING A UNIQUE PICTURE OF THE OPPORTUNITIES AND CHALLENGES FACING BUSINESSES ACROSS THE GLOBE WELCOME TO THE 2009 GLOBAL ENTERPRISE SURVEY REPORT The ICAEW annual
Global PMI. Solid Q2 growth masks widening growth differentials. July 7 th IHS Markit. All Rights Reserved.
 Global PMI Solid Q2 growth masks widening growth differentials July 7 th 2017 2 Widening developed and emerging world growth trends The global economy enjoyed further steady growth in June, according to
Economic Outlook. Wednesday, 23 August The Australian and Global Economic Outlook:
 Economic Outlook Wednesday, 23 August 2017 Wednesday, 23 August 2017 The Australian and Global Economic Outlook: Australia s economy has enjoyed 25 ½ years of economic growth without a recession. It is
SA Economic Outlook. Tuesday, 23 December State Report SA
 Tuesday, 2 December 2014 SA Economic Outlook Summary The South Australian economy has been through challenging times in recent years. Unfortunately, good news has remained scarce and economic growth has
LETTER. economic COULD INTEREST RATES HEAD UP IN 2015? JANUARY Canada. United States. Interest rates. Oil price. Canadian dollar.
 economic LETTER JANUARY 215 COULD INTEREST RATES HEAD UP IN 215? For six years now, that is, since the financial crisis that shook the world in 28, Canadian interest rates have stayed low. The key interest
Svein Gjedrem: The outlook for the Norwegian economy
 Svein Gjedrem: The outlook for the Norwegian economy Address by Mr Svein Gjedrem, Governor of Norges Bank (Central Bank of Norway), at the Bergen Chamber of Commerce and Industry, Bergen, 11 April 2007.
Global PMI. Global economy set for robust Q2 growth. June 8 th IHS Markit. All Rights Reserved.
 Global PMI Global economy set for robust Q2 growth June 8 th 2017 2 PMI indicates robust global growth in Q2 The global economy is on course for a robust second quarter, according to PMI survey data. The
LETTER. economic. Global economy will be weaker than expected OCTOBER bdc.ca
 economic LETTER OCTOBER Global economy will be weaker than expected The International Monetary Fund (IMF) has scaled down its projections for the global economy for and 212 for two major reasons. First,
OCTOBER 2017 CONTENTS. Key points:
 EMBARGOED UNTIL: 11.3AM TUESDAY 14 NOVEMBER 217 NAB MONTHLY BUSINESS SURVEY OCTOBER 217 Key points: Table 1: Key monthly business statistics * All data seasonally adjusted and subject to revision. Cost
WA ECONOMIC OUTLOOK Friday, 22 June 2012
 WA ECONOMIC OUTLOOK Friday, 22 June 12 Summary: Western Australia has been an engine of growth for the Australian economy over the past few years. State final demand grew at an annual pace of 1.% in the
VICTORIAN ECONOMIC OUTLOOK
 VICTORIAN ECONOMIC OUTLOOK Wednesday, May 1 Prior to 11, Victoria had been one of the country s strong State performers. A key factor underpinning Victoria s success story has been firm population growth
Q3 SME Cost Inflation Report November 2013
 Q3 SME Cost Inflation Report November 2013 Helping your business stay one step ahead through our insight Research Contents Executive Summary 3 4 6 20 22 Executive Summary UK Economic Overview SME Cost
AUGUST 2017 CONTENTS. Key points:
 EMBARGOED UNTIL: 11.3AM TUESDAY 12 SEPTEMBER 217 NAB MONTHLY BUSINESS SURVEY AUGUST 217 Key points: Table 1: Key monthly business statistics * All data seasonally adjusted and subject to revision. Cost
Strengths (+) and weaknesses ( )
 and weaknesses ( )") Country Report Australia Country Report Marcel Weernink Economic growth in Australia decelerates due to lower mining investments. The outlook depends heavily on demand from China for its commodities and
Country Report Australia Country Report Marcel Weernink Economic growth in Australia decelerates due to lower mining investments. The outlook depends heavily on demand from China for its commodities and
The Big Picture. Long-Term Trends in Global Infrastructure Investment and Commodity Prices. Warren Hogan. Chief Economist.
 The Big Picture Long-Term Trends in Global Infrastructure Investment and Commodity Prices Warren Hogan Chief Economist May 212 Outline Global Infrastructure Spending Trends Catching up for the industrialised
Colombia. 1. General trends. The Colombian economy grew by 2.5% in 2008, a lower rate than the sustained growth of
 Economic Survey of Latin America and the Caribbean 2008-2009 129 Colombia 1. General trends The Colombian economy grew by 2.5% in 2008, a lower rate than the sustained growth of recent years. Indicators
Australian Business Expectations Survey
 Australian Business Expectations Survey Dun & Bradstreet Q2 2017 PRELIMINARY RESULTS RELEASED 7 FEBRUARY 2017 Index BUSINESS CONFIDENCE IS SOLID, BUT WHERE ARE THE JOBS? Employment expectations for the
NAM MANUFACTURERS OUTLOOK SURVEY FIRST QUARTER 2019 MARCH 5, 2019
 NAM MANUFACTURERS OUTLOOK SURVEY FIRST QUARTER 2019 MARCH 5, 2019 Percentage of Respondents Positive About Their Own Company s Outlook 89.5% (December: 88.7%) Small Manufacturers: 87.7% (Dec.: 87.9%) Medium-Sized
Australian Equity IMPROVING OUTLOOK FOR A TRANSITIONING ECONOMY
 FOR INVESTMENT PROFESSIONALS ONLY. NOT FOR FURTHER DISTRIBUTION. PRICE POINT December 2015 Timely intelligence and analysis for our clients. Australian Equity IMPROVING OUTLOOK FOR A TRANSITIONING ECONOMY
Queensland Economic Update
 Queensland Economic Update March 2017 www.cciq.com.au Chamber of Commerce & Industry Queensland Conditions across Queensland appear to be improving despite poor jobs data. State final demand has started
Jan F Qvigstad: Outlook for the Norwegian economy
 Jan F Qvigstad: Outlook for the Norwegian economy Address by Mr Jan F Qvigstad, Deputy Governor of Norges Bank (Central Bank of Norway), at Sparebank 1 Fredrikstad, 4 November 2009. The text below may
The Economic Outlook of Taiwan
 The Economic Outlook of Taiwan by Ray Yeutien Chou and An-Chi Wu The Institute of Economics, Academia Sinica, Taipei October 2017 1 Prepared for Project LINK 2017 Fall Meeting, Geneva, Oct. 3-5, 2017 2
Victorian Economic Outlook
 Wednesday, 9 May Victorian Economic Outlook Summary The Victorian economy has been through difficult conditions over the past few years. Victoria s key sectors, manufacturing, education and tourism are
Australian Business Expectations Survey
 Australian Business Expectations Survey Dun & Bradstreet Q4 2017 PRELIMINARY RESULTS RELEASED 1 AUGUST 2017 Index UPLIFT IN BUSINESS SENTIMENT Australian businesses are looking ahead to the final quarter
AUSTRALIAN INFRASTRUCTURE METRIC
 AUSTRALIAN INFRASTRUCTURE METRIC December Quarter 216 The IPA/BIS Oxford Economics Australian Infrastructure Metric (the Metric) is the leading indicator of real investment in Australia s civil infrastructure.
AUSTRALIAN INDUSTRY DATA SUMMARY
 ECONOMICS & MARKETS RESEARCH Australian industry data summary December 9 / of AUSTRALIAN INDUSTRY DATA SUMMARY DECEMBER 9 DATA FOR THE SEPTEMBER QUARTER 9 Australia s economy grew by.% in Q 9 (.% p.a.),
Retail turnover accelerates: Can recent consumer spending growth be sustained?
 Australia Retail White Paper MARCH 2014 Retail turnover accelerates: Can recent consumer spending growth be sustained? NORA FARREN Director, Research Retail There has been clear improvement in the retail
Monthly Bulletin of Economic Trends: Households and Household Saving
 MELBOURNE INSTITUTE Applied Economic & Social Research Monthly Bulletin of Economic Trends: Households and Household Saving August 2018 Released at 11am on 23 August 2018 Housing and households Consumption
Business Expectations Survey September 2017 Summary Review
 Business Expectations Survey September 2017 Summary Review 1. Introduction The BES summarises views of the business community regarding their perceptions about the current and future state of the economy.
Key statistics for Sensis Business Index (September 2018) SM B confidence: National average +42 7
 SM B confidence: National average +42 7") Key statistics for Sensis Business Index (September 2018) The Sensis Business Index is a quarterly survey of 1,000 small and medium businesses, which commenced in 1993. Note: This survey was conducted
Key statistics for Sensis Business Index (September 2018) The Sensis Business Index is a quarterly survey of 1,000 small and medium businesses, which commenced in 1993. Note: This survey was conducted
Sensis Business Index December 2018
 Sensis Business Index ember 20 A survey of confidence and behaviour of Australian small and medium businesses Released February 2019 OPEN www.sensis.com.au/sbi Join the conversation: @sensis #SensisBiz
Moderating External Trade Caused IPI to Hit 3-Month Low at 3%
 12 July 2018 ECONOMIC REVIEW May 2018 Industrial Production Index Moderating External Trade Caused IPI to Hit 3-Month Low at 3% IPI meets market estimates. Malaysia s industrial production expands by 3%yoy
Are Financial Markets Signalling Recession? August 2018
 Are Financial Markets Signalling Recession? August 2018 Executive Summary The flattening of the US yield curve has led some to forecast a US recession (with an inverted curve seen as an accurate recession
Antonio Fazio: Overview of global economic and financial developments in first half 2004
 Antonio Fazio: Overview of global economic and financial developments in first half 2004 Address by Mr Antonio Fazio, Governor of the Bank of Italy, to the ACRI (Association of Italian Savings Banks),
Australian Dollar Outlook
 Tuesday, 31 March 015 Australian Dollar Outlook Still Under Pressure We have revised our AUD forecasts for this year down slightly to reflect developments over recent months. We now expect the AUD to end
QUEENSLAND SUNCORP GROUP CCIQ PULSE SURVEY OF BUSINESS CONDITIONS
 QUEENSLAND SUNCORP GROUP CCIQ PULSE SURVEY OF BUSINESS CONDITIONS DECEMBER QUARTER 16 SECTION 1 The CCIQ Pulse Survey of Business Conditions is the largest survey of businesses, providing critical insights
NSW ECONOMIC OUTLOOK Monday, 26 March 2012
 NSW ECONOMIC OUTLOOK Monday, March 1 Summary: Over the past year the NSW economy has grown at a modest but below average pace. Looking forward, reduced financial market volatility, stable house prices
Federal Budget : This Time It s Personal. May 2018
 Federal Budget 2018-19: This Time It s Personal May 2018 Executive Summary The Federal Government and the nation s fiscal position have become the beneficiaries of an unexpected windfall primarily in the
Philip Lowe: Changing relative prices and the structure of the Australian economy
 Philip Lowe: Changing relative prices and the structure of the Australian economy Address by Mr Philip Lowe, Assistant Governor of the Reserve Bank of Australia, to the Australian Industry Group 11th Annual
Business Expectations Survey March 2014 Summary Review
 Business Expectations Survey March 2014 Summary Review 1. Introduction The BES reports on current confidence levels among local businesses as well as their expectations of movements in key economic indicators.
Australia s productivity performance
 Australia s productivity performance Seminar Presentation to Australian Treasury Canberra, 22 nd September 2010 Saul Eslake Grattan Institute Australia s productivity growth has slowed over the last five
Economic Views Brief OPTIMISM DOMINATES THE 2018 OUTLOOK.
 Economic Views Brief Russell T. Price, CFA, Senior Economist December 14, 2017 OPTIMISM DOMINATES THE 2018 OUTLOOK. The U.S. economy appears set to enter 2018 with good momentum and solid fundamentals.
February market performance. Index. Index. Global economies
 March 2016 Global equity markets continued to correct through February but stage an early March recovery Oil prices staged a strong recovery from mid-february up 37% China economic data continued to consolidate
Australia: Economic and Financial Outlook
 Australia: Economic and Financial Outlook Greg Noonan Head of Business Markets Queensland & Agribusiness 5 June 2015 Australian economy and financial markets continue to be impacted by a large number of
Quarterly Economic Monitor
 Overview of Quarterly Economic Monitor December 214 Queenstown s economy boomed during 214, with ' provisional estimate of GDP showing that the Queenstown-Lakes District economy grew by 4.5% over the year
State of the States October 2016 State & territory economic performance report. Executive Summary
 State of the States October 2016 State & territory economic performance report. Executive Summary NSW, VICTORIA AND ACT LEAD How are Australia s states and territories performing? Each quarter CommSec
61.0% (June: 61.7%) 41.8 (June: 42.3) 1.9% 2.1% 0.4% 0.8% 0.4% 0.8% 0.7% 1.7% 8.5% Manufacturing Outlook. Expected Growth Rate Over the Next 12 Months
 41.8 (June: 42.3) 1.9% 2.1% 0.4% 0.8% 0.4% 0.8% 0.7% 1.7% 8.5% Manufacturing Outlook. Expected Growth Rate Over the Next 12 Months") Manufacturing Outlook PERCENTAGE OF RESPONDENTS POSITIVE IN THEIR OWN COMPANY S OUTLOOK 61.0% (June: 61.7%) Small Manufacturers: 48.7% (June: 56.1%) Medium-Sized Manufacturers: 64.0% (June: 64.2%) Large
Manufacturing Outlook PERCENTAGE OF RESPONDENTS POSITIVE IN THEIR OWN COMPANY S OUTLOOK 61.0% (June: 61.7%) Small Manufacturers: 48.7% (June: 56.1%) Medium-Sized Manufacturers: 64.0% (June: 64.2%) Large
Vietnam. HSBC Global Connections Report. October 2013
 HSBC Global Connections Report October 2013 Vietnam The pick-up in GDP growth will be modest this year, with weak domestic demand and exports still dampening industrial confidence. A stronger recovery
LETTER. economic. Is Canada less dependent on the United States than it used to be? DECEMBER 2011 JANUARY bdc.ca
 economic LETTER DECEMBER JANUARY 212 Is less dependent on the United States than it used to be? weathered the last recession better than the United States. The decline in real GDP in was less pronounced
Quarterly Labour Market Report. February 2015
 Quarterly Labour Market Report February 2015 MB13090_1228 March 2015 Ministry of Business, Innovation and Employment (MBIE) Hikina Whakatutuki - Lifting to make successful MBIE develops and delivers policy,
State of the States July 2015 State & territory economic performance report. Executive Summary
 State of the States July 2015 State & territory economic performance report. Executive Summary NT Housing finance The Northern Territory is pushed back into third spot in the rankings of best performing