The Metropolitan Community College
|
|
|
- Rosamond Welch
- 5 years ago
- Views:
Transcription

1 Independent Auditor s Report and Financial Statements
2 Contents Independent Auditor s Report... 1 Management s Discussion and Analysis... 4 Financial Statements Statements of Net Position Statements of Revenues, Expenses and Changes in Net Position Statements of Cash Flows Financial Statements of Foundation (Discretely Presented Component Unit) Statements of Financial Position Statements of Activities Statements of Cash Flows Notes to Financial Statements Required Supplementary Information Schedule of Changes in the College s Total OPEB Liability and Related Ratios (GASB 75) Schedule of Funding Progress for OPEB Plan (GASB 45) Schedules of the College s Proportionate Share of the Net Pension Liability and College Contributions Other Supplementary Information Combining Schedule of Net Position Combining Schedule of Revenues, Expenses and Changes in Net Position Schedule of Revenues, Expenses and Changes in Fund Balances Schedule of Expenses by Functional and Natural Classification Schedule of Fund Transfers From/(To) Notes to Other Supplementary Financial Information... 91
3 Contents (Continued) Compliance Schedule of Expenditures of Federal Awards Notes to the Schedule of Expenditures of Federal Awards Report on Internal Control Over Financial Reporting and on Compliance and Other Matters Based on an Audit of Financial Statements Performed in Accordance with Government Auditing Standards Independent Auditor s Report Report on Compliance for the Major Federal Program and Report on Internal Control Over Compliance Independent Auditor s Report Schedule of Findings and Questioned Costs Summary Schedule of Prior Audit Findings
4 Independent Auditor s Report Board of Trustees Kansas City, Missouri Report on the Financial Statements We have audited the accompanying financial statements of the business-type activities and the discretely presented component unit of The Junior College District of Metropolitan Kansas City, Missouri (d/b/a, the College ) as of and for the years ended June 30, 2018 and 2017, and the related notes to the financial statements, which collectively comprise the College s basic financial statements as listed in the table of contents. Management s Responsibility for the Financial Statements Management is responsible for the preparation and fair presentation of these financial statements in accordance with accounting principles generally accepted in the United States of America; this includes the design, implementation and maintenance of internal control relevant to the preparation and fair presentation of financial statements that are free from material misstatement, whether due to fraud or error. Auditor s Responsibility Our responsibility is to express opinions on these financial statements based on our audits. We conducted our audits in accordance with auditing standards generally accepted in the United States of America and the standards applicable to financial audits contained in Government Auditing Standards, issued by the Comptroller General of the United States. Those standards require that we plan and perform the audit to obtain reasonable assurance about whether the financial statements are free from material misstatement. The financial statements of Foundation, the discretely presented component unit, were not audited in accordance with Government Auditing Standards. An audit involves performing procedures to obtain audit evidence about the amounts and disclosures in the financial statements. The procedures selected depend on the auditor s judgment, including the assessment of the risks of material misstatement of the financial statements, whether due to fraud or error. In making those risk assessments, the auditor considers internal control relevant to the entity s preparation and fair presentation of the financial statements in order to design audit procedures that are appropriate in the circumstances, but not for the purpose of expressing an opinion on the effectiveness of the entity s internal control. Accordingly, we express no such opinion. An audit also includes evaluating the appropriateness of accounting policies used and the reasonableness of significant accounting estimates made by management, as well as evaluating the overall presentation of the financial statements. We believe that the audit evidence we have obtained is sufficient and appropriate to provide a basis for our audit opinions.
5 Board of Trustees Page 2 Opinions In our opinion, the financial statements referred to above present fairly, in all material respects, the respective financial position of the business-type activities and the discretely presented component unit of, as of, and the respective changes in financial position and where applicable, cash flows thereof for the years then ended in accordance with accounting principles generally accepted in the United States of America. Emphasis of Matter As discussed in Note 1 to the financial statements, in 2018, the College adopted GASB Statement No. 75, Accounting and Financial Reporting for Postemployment Benefits Other Than Pensions. Our opinions are not modified with respect to this matter. Other Matters Required Supplementary Information Accounting principles generally accepted in the United States of America require that the management s discussion and analysis, pension and other postemployment information, as listed in the table of contents, be presented to supplement the basic financial statements. Such information, although not a part of the basic financial statements, is required by the Governmental Accounting Standards Board, who considers it to be an essential part of financial reporting for placing the basic financial statements in an appropriate operational, economic or historical context. We have applied certain limited procedures to the required supplementary information in accordance with auditing standards generally accepted in the United States of America, which consisted of inquiries of management about the methods of preparing the information and comparing the information for consistency with management s responses to our inquiries, the basic financial statements and other knowledge we obtained during our audit of the basic financial statements. We do not express an opinion or provide any assurance on the information because the limited procedures do not provide us with sufficient evidence to express an opinion or provide any assurance. Supplementary Information Our audits were conducted for the purpose of forming opinions on the financial statements that collectively comprise the College s basic financial statements. The accompanying other supplementary financial information and the schedule of expenditures of federal awards as required by Title 2 U.S. Code of Federal Regulations Part 200, Uniform Administrative Requirements, Cost Principles and Audit Requirements for Federal Awards, as listed in the table of contents, are presented for purposes of additional analysis and are not a required part of the basic financial statements. The schedule of expenditures of federal awards is the responsibility of management and was derived from and relates directly to the underlying accounting and other records used to prepare the basic financial statements. Such information has been subjected to the auditing procedures applied in the audit of the basic financial statements and certain additional procedures, including comparing and reconciling such information directly to the underlying accounting and other records used to prepare the basic financial statements or to the basic financial statements themselves, and other additional procedures in accordance with auditing standards generally accepted in the United States of America. In our opinion, the information is fairly stated in all material respects in relation to the basic financial statements as a whole.
6 Board of Trustees Page 3 The other supplementary financial information listed in the table of contents has not been subjected to the auditing procedures applied in the audit of the basic financial statements, and accordingly, we do not express an opinion or provide any assurance on it. Other Reporting Required by Government Auditing Standards In accordance with Government Auditing Standards, we have also issued our report dated November 14, 2018, on our consideration of the College s internal control over financial reporting and on our tests of its compliance with certain provisions of laws, regulations, contracts and grant agreements and other matters. The purpose of that report is solely to describe the scope of our testing of internal control over financial reporting and compliance and the results of that testing, and not to provide an opinion on the effectiveness of the College s internal control over financial reporting or on compliance. That report is an integral part of an audit performed in accordance with Government Auditing Standards in considering the College s internal control over financial reporting and compliance. Kansas City, Missouri November 14, 2018
7 Management s Discussion and Analysis Years Ended Introduction This section of s (the College or MCC) annual financial report presents a discussion and analysis of the financial performance of the College during the fiscal year ended June 30, 2018, with comparative data for the fiscal years ended June 30, 2017 and It should be read in conjunction with the financial statements and notes that follow. The College prepared the financial statements in accordance with Government Accounting Standards Board (GASB) Statement No. 35, Basic Financial Statements and Management s Discussion and Analysis for Public Colleges and Universities. GASB Statement No. 35 establishes standards for external financial reporting for public colleges and universities and requires that the financial statements be presented to focus on the College as a whole. As defined by generally accepted accounting principles established by GASB, the financial reporting entity consists of the accompanying combined financial statements of the College including the accounts of The Junior College District of Metropolitan Kansas City, Missouri (the District), the Kansas City Metropolitan Community Colleges Building Corporation (the Building Corporation), as well as its discretely presented component unit, The Metropolitan Community College Foundation (the Foundation). In 2018, the College adopted GASB Statement No. 75, Accounting and Financial Reporting for Postemployment Benefits Other Than Pensions, which revises accounting and financial reporting standards for other post-employment benefits that are provided to the employees of state and local governmental employers through health care benefits that are administered through trusts and equivalent arrangements in which specific criteria are met. This statement establishes standards for measuring and recognizing liabilities, deferred outflows of resources, deferred inflows of resources and expenditures. For defined benefit postemployment benefits, this statement identifies the methods and assumptions that should be used to project benefit payments, discount projected benefit payments to the actuarial present value and attribute that present value to periods of employee service. Information for the year ended June 30, 2017, was not restated for the application of GASB Statement No. 75 as it was deemed impractical to do so. Using This Annual Report One of the most important questions asked about the College s finances is whether the College, as a whole, is better off or worse off as a result of the year s activities. The Statements of Net Position; the Statements of Revenues, Expenses and Changes in Net Position; and the Statements of Cash Flows provide information on the College as a whole and present a long-term view of the College s finances. These statements present financial information in a form similar to that used by private corporations. Over time, increases or decreases in net position (the difference between assets and deferred outflows of resources and liabilities and deferred inflows of resources) is one indicator of the improvement or erosion of the College s financial health when considered with nonfinancial facts such as enrollment levels and the condition of the facilities. In addition to these three basic financial statements, this report contains notes to the financial statements, required supplementary information and other supplementary schedules as appropriate. 4
8 Financial Highlights for Fiscal Year Ended June 30, 2018 In fiscal year 2018, the College s financial position declined slightly, with total assets and deferred outflows of resources at $260.1 million versus $261.2 million in 2017 and $241.5 million in Net position, which represents the residual interest in the College s assets and deferred outflows of resources after liabilities and deferred inflows of resources are deducted, was $112.7 million at June 30, This represents a 1.2 percent decrease from 2017 s net position of $114.1 million. The College s unrestricted net position showed a decrease from $50.2 million to $46.6 million. Financial operations were better than originally budgeted, with an overall increase in net position of $11.7 million. The positive results can be attributed to increased revenue from local taxes and investments, additional contributions from the Institute for Workforce Innovation, lapsed salaries and continued conservative spending across the District. This increase in net position helped to offset the adoption of GASB 75, Accounting and Financial Reporting for Postemployment Benefits Other Than Pensions, which increased the College s liabilities by $13.2 million. Financial Highlights for Fiscal Year Ended June 30, 2017 The College s financial position improved at June 30, 2017, with total assets and deferred outflows of resources increasing $19.7 million to $261.2 million compared to $241.5 million at June 30, Total liabilities and deferred inflows of resources for the College also increased by $8.2 million, as of June 30, 2017, from $138.9 million to $147.1 million. Net position, which represents the residual interest in the College s assets and deferred outflows of resources after liabilities and deferred inflows of resources are deducted, was $114.1 million at June 30, This represents an 11.2 percent increase from 2016 s net position of $102.6 million. The College s unrestricted net position showed an increase growing from $41.0 million to $50.2 million or 22.4 percent. Financial operations were better than originally budgeted, with an overall increase in net position of $11.5 million. These positive results can be attributed to lapsed salaries, open vacant positions, continued conservative spending across the District and additional contributions from special projects and the Institute of Workforce Innovation. Financial Highlights for Fiscal Year Ended June 30, 2016 As of June 30, 2016, the College s financial position improved with total assets and deferred outflows of resources increasing $10.0 million to $241.5 million on June 30, 2016 compared to $231.5 million as of June 30, Total liabilities and deferred inflows decreased by $3.6 million to $138.9 million at June 30, 2016 from $142.5 million at June 30, The College s operations were better than originally budgeted resulting in the College s total net position increasing by $13.6 million, a 15.3 percent increase. This resulted in an increase of unrestricted net position, from $30.0 million to $41.0 million, an increase of $11.0 million. This is attributable to a pension expense credit, lapsed salaries and a continued decline in spending across the District. Statements of Net Position The Statements of Net Position presents the financial position of the College at the end of the fiscal year and includes all assets and liabilities of the College. Total assets and deferred outflows of resources less total liabilities and deferred inflows of resources net position is one indicator of the current financial condition of the College, while the change in net position is an indicator of whether the overall financial condition has improved or worsened during the year. Assets and liabilities are generally measured using current values or historical costs. 5
9 From the data presented, readers of the Statements of Net Position are able to determine the assets available to continue the operations of the College. They are also able to determine how much the College owes vendors and lending institutions. Finally, the Statements of Net Position provide a picture of assets available for expenditure by the College. Assets and liabilities are categorized as current or noncurrent. The difference is that current assets and liabilities mature or become payable within the normal 12-month accounting cycle versus noncurrent, which mature or become payable after 12 months. For example, at June 30, 2018, the College s current assets consisted primarily of cash and cash equivalents, short-term investments, net accounts receivable and other assets. Noncurrent assets consist primarily of long-term investments and property and equipment. Property and equipment are the capital assets owned by the College and the Building Corporation. Net position is presented in three major categories. The first category, net investment in capital assets, provides the College s/building Corporation s equity in capital assets the property, plant and equipment owned by the College/Building Corporation. The second category is restricted net position, which is restricted for debt retirement. The third category is titled unrestricted net position, which includes amounts designated by board direction for specific purposes. Condensed Statements of Net Position June 30, 2018, 2017 and 2016 (Dollars in Millions) Change from Change from 2018 Prior Year 2017 Prior Year 2016 Assets Current $ 82.0 $ (24.0) $ $ 19.5 $ 86.5 Capital (1.9) (0.8) Other (12.2) 18.9 Total assets Deferred outflows of resources 24.2 (4.6) Total assets and deferred outflows of resources $ $ (1.1) $ $ 19.7 $ Liabilities Current $ 19.0 $ (0.9) $ 19.9 $ (1.9) $ 21.8 Noncurrent Total liabilities Deferred inflows of resources 7.4 (1.9) 9.3 (0.5) 9.8 Total liabilities and deferred inflows of resources $ $ 0.3 $ $ 8.2 $ Net Position Invested in capital, net of related debt $ 66.1 $ 2.2 $ 63.9 $ 2.3 $ 61.6 Unrestricted 46.6 (3.6) Total net position $ $ (1.4) $ $ 11.5 $
10 70 Comparison of Net Position In Millions Net Investment in Capital Assets Unrestricted & Designated Significant assets consist of cash and cash equivalents, short-term and long-term investments, accounts receivable and capital assets. Significant liabilities include accounts payable and accrued liabilities, long-term bonded debt, other postemployment benefit liability, net pension liability, compensated absences and deferred revenue. Fiscal Year 2018 compared to Fiscal Year 2017 As of June 30, 2018, total assets and deferred outflows of resources decreased $1.1 million. The decrease in assets is due to a decrease of $28.7 million in short-term investments offset by an increase of $29.4 million in long-term investments. The GASB 68 actuarial evaluation of the College s portion of the unfunded pension liability resulted in a decrease of $4.6 million in deferred outflows. Cash and cash equivalents also increased $5.6 million. The remaining changes were a decrease in other assets and a decrease in capital assets. Total liabilities and deferred outflows of resources increased $.3 million in fiscal year The adoption of GASB 75 required the College to recognize $9.9 million in post-employment benefits (not related to pension). This was offset by the GASB 68 actuarial evaluation of the College s portion of the unfunded pension liability resulting in a decrease of $1.8 million in the pension liability and a decrease of $1.9 million in the deferred inflows of resources. The annual bond payments for the Series 2014 bonds decreased the bonds payable by $4.2 million. The remaining changes were a decrease in accounts payable and capital lease liability. Net investment in capital assets, which represents 58.7 percent of total net position at June 30, 2018, represents the assets historical costs, net of accumulated depreciation and outstanding principal balances of debt attributable to the acquisition, construction or improvement of those assets. Expendable restricted net position is subject to externally imposed restrictions governing their use. This category of net position represents the debt service reserve funds as mandated by the trust indentures. The College is not required to maintain a debt service reserve with the Series 2014 bonds. The Board of Trustees has elected to designate a portion of unrestricted net position for the purpose of deferred maintenance and information technology. Designated net position is not subject to externally imposed restrictions and therefore is not considered restricted net position. 7
11 Unrestricted net position is not subject to externally imposed stipulations and is available to the College for any legal purpose. Fiscal Year 2017 compared to Fiscal Year 2016 In fiscal year 2017, total assets and deferred outflows of resources increased $19.7 million while total liabilities and deferred inflows of resources increased $8.2 million; for a total net position increase of $11.5 million. The College s total assets and deferred outflows of resources increase of $6.4 million is due to an increase in cash and cash equivalents of $10.7 million with an offsetting net decrease in investments of $4.3 million. In addition, deferred outflows of resources increased $13.2 million as a result of the annual GASB 68 actuarial evaluation. The total liabilities and deferred inflows of resources increase is a result of the annual GASB 68 actuarial evaluation resulting in an increase in MCC s share of the Missouri retirement system net pension liability of $15.1 million. This is offset by a decrease in bonds payable of $4.1 million and a decrease in accounts payable and other accruals decreased $1.6 million. Net investment in capital assets, which represents 56.0 percent of total net position at June 30, 2017, represents the assets historical costs, net of accumulated depreciation and outstanding principal balances of debt attributable to the acquisition, construction or improvement of those assets. Designated net position is not subject to externally imposed restrictions and therefore is not considered restricted net position. Rather, the Board of Trustees has elected to designate a portion of unrestricted net position for the purpose of deferred maintenance and information technology. The Board of Trustees has elected to designate a portion of unrestricted net position for the purpose of deferred maintenance and information technology. Designated net position is not subject to externally imposed restrictions and therefore is not considered restricted net position. Unrestricted net position is not subject to externally imposed stipulations and is available to the College for any legal purpose. Statements of Revenues, Expenses and Changes in Net Position The Statements of Revenues, Expenses and Changes in Net Position disclose the College s financial results for each of the fiscal years presented. The purpose of the statements are to present the revenues earned by the College, both operating and nonoperating and the expenses incurred by the College, operating and nonoperating and any other revenues, expenses, gains and losses earned or incurred by the college. Under the accrual basis of accounting, all of the current year s revenue and expenses are taken into account regardless of when the cash is received or paid. Generally speaking, operating revenues are received for providing goods and services to the students and various constituencies of the College. Operating expenses are those expenses incurred to acquire or produce the goods and services provided in return for the operating revenues, and to carry on the mission of the College. Nonoperating revenues are revenues earned for which goods and services are not provided. For example, the state appropriations, Pell grant revenue and county property tax collections are nonoperating because they represent revenue provided to the College for which no direct goods or services were provided directly by the College to the state legislature or the local taxpayers. 8
12 One of the College s strengths is its diverse streams of revenue, which allow it the flexibility to weather difficult economic times. The statements below provide an illustration of revenues by source (both operating and nonoperating), which were used to fund the College s operating activities for the years ended June 30, 2018, 2017 and Condensed Statements of Revenues, Expenses and Changes in Net Position Years Ended June 30, 2018, 2017 and 2016 (Dollars in Millions) Change from Change from 2018 Prior Year 2017 Prior Year 2016 Operating revenues $ 46.2 $ (3.5) $ 49.7 $ 0.9 $ 48.8 Operating expenses Operating loss (80.2) (3.5) (76.7) (1.9) (74.8) Non-operating revenues, net (0.2) 88.4 Increase in net assets (2.1) 13.6 Net assets, beginning of year Change in accounting principle (13.2) (13.2) Net assets, end of year $ $ (1.4) $ $ 11.5 $ Total revenues $ $ (0.2) $ $ 1.2 $ Total expenses $ $ (0.5) $ $ 3.3 $
13 The following table of revenues by source (both operating and nonoperating) shows revenues used to fund the College s operating activities for the years ended June 30, 2018, 2017 and Revenues by Source Years Ended June 30, 2018, 2017 and 2016 (Dollars in Millions) Change from Change from 2018 Prior Year 2017 Prior Year 2016 Operating revenues Student tuition and fees $ 25.1 $ 0.9 $ 24.2 $ 1.7 $ 22.5 Contract and grants 14.5 (5.5) Auxiliary services 1.7 (0.2) 1.9 (2.5) 4.4 Other (0.7) 4.3 Total operating revenues 46.2 (3.5) Non-operating revenues Federal Pell Grant (1.0) 21.7 State appropriations 31.1 (0.9) 32.0 (0.9) 32.9 County property tax revenues Investment income Other non-operating revenue Total non-operating revenues Total revenue $ $ (0.2) $ $ 1.2 $ Fiscal Year 2018 compared to Fiscal Year 2017 Total revenues decreased by $.2 million from prior year. All tuition rates remained unchanged from prior year. The fiscal year enrollment was slightly below budget projections but tuition and fees revenue was up by $.9 million due to an increase in out-of-district tuition. This was offset by state appropriations which decreased $.9 million from prior year. Tax revenues increased by $1.4 million, or 4.1 percent, from fiscal year 2017 due to an increase in the collection of back taxes and an increase in new construction. Contracts and grants (excluding Federal Pell Grants), which comprise 10.3 percent and 14.2 percent of total revenue respectively, decreased by $5.5 million from prior year. 10
14 The following graphic illustrates the College s total revenues for the years ended June 30, 2018 and Other Operating 3.5% State Appropriations 22.2% 2018 Tax Revenue 25.3% Investment 0.9% Auxiliary Services1.2% Grants and Contracts 25.9% State Appropriations 22.7% 2017 Other Nonoperating 3.1% Tuition and Fees, Net 17.9% Tax Revenue 24.3% Other Operating 2.6% Investment 0.5% Auxiliary Services1.4% Grants and Contracts 28.9% Other Nonoperating 2.4% Tuition and Fees, Net 17.2% Fiscal Year 2017 compared to Fiscal Year 2016 Total revenues increased by $1.2 million from fiscal year Contracts and grants (including Federal Pell Grants) increased $1.4 million. This revenue source now comprises 28.9 percent of total revenue, which is up from 28.3 percent in the prior year. Tax Revenue which is 24.3 percent of total revenues, increased $1.4 million. State appropriations decreased $0.9 million or 2.9 percent from prior year. Tuition rates continued to remain unchanged from the prior year. For the year ending June 30, 2017, the College projected a 1.5 percent decline in enrollment, which was offset by an increase in out-of-district enrollment. This resulted in an increase of $1.7 million and now represents 17.2 percent of total revenue. Auxiliary services revenue declined by $2.5 million which is directly related to books sales ending after the College outsourced the bookstore operations to Follett in fiscal year
15 The following graphic illustrates the College s total revenues for the years ended June 30, 2017 and State Appropriations 22.7% 2017 Tax Revenue 24.3% Other Operating 2.6% Investment 0.5% Auxiliary Services1.4% Grants and Contracts 28.9% State Appropriations 23.6% 2016 Other Nonoperating 2.4% Tuition and Fees, Net 17.2% Tax Revenue 23.5% Investment 0.4% Other Operating 3.1% Auxiliary Services3.2% Grants and Contracts 28.2% Other Nonoperating 1.8% Tuition and Fees, Net 16.2% 12
16 Expenses Operating expenses can be displayed in two formats, natural (object) classification and functional classification. Both formats are presented in the following tables for the years ended June 30, 2018, 2017 and Operating Expenses by Natural Classification Years Ended June 30, 2018, 2017 and 2016 (Dollars in Millions) Change from Change from 2018 Prior Year 2017 Prior Year 2016 Operating expenses Salaries and benefits $ 85.1 $ 0.4 $ 84.7 $ 4.6 $ 80.1 Supplies and services 31.0 (0.1) 31.1 (1.1) 32.2 Depreciation (0.1) 6.4 Scholarships and fellowships 3.7 (0.6) 4.3 (0.6) 4.9 Total operating expenses $ $ - $ $ 2.8 $ Operating Expenses by Functional Classification Years Ended June 30, 2018, 2017 and 2016 (Dollars in Millions) Change from Change from 2018 Prior Year 2017 Prior Year 2016 Operating expenses Instructional $ 44.4 $ - $ 44.4 $ 1.0 $ 43.4 Academic support (1.3) 15.2 Student services 15.1 (0.2) Plant ops and maintenance (0.2) 10.7 Institutional support 23.5 (0.1) Scholarships and fellowships 3.7 (0.6) 4.3 (0.6) 4.9 Public service 5.3 (1.5) Depreciation (0.1) 6.4 Auxiliary enterprise 1.1 (0.2) 1.3 (2.8) 4.1 Total operating expenses $ $ - $ $ 2.8 $ Nonoperating Expenses Years Ended June 30, 2018, 2017 and 2016 (Dollars in Millions) Change from Change from 2018 Prior Year 2017 Prior Year 2016 Interest on debt relating to capital assets $ 2.0 $ (0.5) $ 2.5 $ 0.5 $ 2.0 Total expenses $ $ (0.5) $ $ 3.3 $
17 Fiscal Year 2018 compared to Fiscal Year 2017 In fiscal year 2018, total operating and nonoperating expenses decreased by $.5 million or.4 percent from prior year. The salaries and benefits comprise 66.3 percent and 65.6 percent of total expenses for years ended, respectively. Supplies and services remained flat from the prior year. The following graphic illustrates expenses by natural (object) classification for the years ended Benefits 17.0% Salaries49.3% Supplies and Services 21.0% Utilities3.1% Scholarships 2.9% Interest 1.6% Depreciation 5.1% 2017 Benefits 16.9% Salaries48.7% Supplies and Services 21.0% Utilities3.1% Scholarships 3.4% Interest 2.0% Depreciation 4.9% 14
18 Fiscal Year 2017 compared to Fiscal Year 2016 The College s fiscal year 2017 total operating and nonoperating expenses increased by $3.3 million or 2.6 percent from the prior year. Salaries and benefits are the largest categories and comprise 65.6 percent and 63.8 percent of total expenses for the fiscal years ended June 30, 2017 and 2016, respectively. The expenses in salaries increased $1.4 million due in part to a salary increase for fiscal year The Benefits category increased $3.1 million due to pension expense related to the GASB 68 pronouncement. The second largest category, supplies and services decreased $1.1 million or 3.3 percent from the prior year primarily due to more capitalized expenses as a result of spending the remaining funds of $2.8 million from the 2015 Board of Public Buildings bonds. The following graphic illustrates expenses by natural (object) classification for the years ended June 30, 2017 and Benefits 16.9% Salaries48.7% Supplies and Services 21.0% Utilities3.1% Scholarships 3.4% Interest 2.0% Depreciation 4.9% 2016 Benefits 14.9% Salaries 48.9% Supplies and Services 22.9% Utilities 2.7% Scholarships 3.9% Interest 1.6% Depreciation 5.1% 15
19 Statements of Cash Flows The Statements of Cash Flows provides information about cash receipts and cash payments during the year. This statement also assists users in assessing the College s ability to generate net cash flows, its ability to meet its obligations as they come due and its need for external financing. The Statements of Cash Flows is divided into five parts, each examining a different source of and use for cash. The first part, Operating activities, examines the source and use of cash from ordinary operating activities. The second part, Noncapital financing activities, reflects cash flows received and spent for nonoperating, noninvesting and noncapital financing activities. An example of this would be cash received from state appropriations and county property tax. The third section, Capital and related financing activities, deals with cash flows from capital and related financing activities. The section reflects the cash used in the acquisition, construction and financing of capital and related items. The fourth section, Investing activities, reveals the cash flows from investing activities and shows the purchases, proceeds and interest received from investing activities. The fifth and last section reconciles the net cash used in operating activities to the operating gain or (loss) reflected on the Statements of Revenues, Expenses and Changes in Net Position. Condensed Statements of Cash Flows Years Ended June 30, 2018, 2017 and 2016 (Dollars in Millions) Change from Change from 2018 Prior Year 2017 Prior Year 2016 Cash provided (used) by Operating activities $ (76.5) $ (4.3) $ (72.2) $ (2.4) $ (69.8) Noncapital financing activities (0.3) 89.4 Capital and related financing activities (10.8) 0.4 (11.2) (2.8) (8.4) Investing activities 0.6 (4.4) (13.0) Net change in cash 5.6 (5.1) (1.8) Cash, beginning of year (1.8) 40.8 Cash, end of year $ 55.3 $ 5.6 $ 49.7 $ 10.7 $ 39.0 The major sources of cash included state aid, county property tax revenues, student tuition, federal contracts and grants and proceeds from maturities of investments. Significant uses of cash included payments to employees including benefits, payments to vendors and suppliers, payments for scholarships and financial aid, capital assets and purchases of investments. Fiscal Year 2018 compared to Fiscal Year 2017 The cash position of the College increased by $5.6 million for the fiscal year ended June 30, Cash used for operating activities increased $4.3 million which was attributable to an increase in contracts and grants, most notably is the MoSTEM grant. Noncapital financing activities were up $3.2 million due to an increase in Federal Pell grants and an increase in property tax collection. Capital and related financing activities decreased by $.4 million which is attributable to a decrease in purchase of capital assets. Investing activities used an additional $4.4 million over In fiscal year 2018, the College increased long-term investments as part of the continued three year laddering strategy. 16
20 Fiscal Year 2017 compared to Fiscal Year 2016 The cash position of the College decreased by $10.7 million for the fiscal year ended June 30, Cash used for operating activities increased $2.4 million tied to employee salary and benefits. Noncapital financing activities remained comparable with the prior year. Capital and related financing activities increased by $2.8 million which is attributable to purchases of an additional $3.4 million in capital assets which are described in the next section. Investing activities resulted in a generation of $5.0 million, an increase of $18 million over The College is moving toward a more laddered investment approach looking out to three years. College investments matured sooner as the result of more short-term investment purchases due to economic conditions and more competitive rates. Capital Assets Net Capital Assets Years Ended June 30, 2018, 2017 and 2016 (Dollars in Millions) Change from Change from Capital Assets - Net of Accumulated Depreciation 2018 Prior Year 2017 Prior Year 2016 Land $ 8.3 $ - $ 8.3 $ (0.1) $ 8.4 Buildings and improvements (1.0) (3.9) Equipment/Construction/Software in progress 2.0 (1.6) Equipment (0.3) 2.8 Software Total capital assets $ $ (1.9) $ $ (0.8) $ Additional information concerning capital assets is provided in Note 3 to the financial statements. Fiscal Year 2018 compared to Fiscal Year 2017 As of June 30, 2018, the College had recorded $117.8 million in net capital assets, a decrease of $1.9 million from the prior year. Additions to capital assets consisted of improvements to boilers /chillers, an LED lighting project across the district and administrative center garage repairs. The Penn Valley Student Success Center was completed in fiscal year 2018 and placed into service. No additional debt was issued to finance these projects. Fiscal Year 2017 compared to Fiscal Year 2016 As of June 30, 2017, the College had recorded $119.7 million in net capital assets, a decrease of $.8 million from the prior year. Additions to capital assets consisted of roof repairs at Penn Valley, HVAC improvements across the district, sidewalk and garage repairs at the administrative center, equipment across the district and virus protection software. The remaining funds from the 2015 Board of Public Buildings bonds were used in fiscal year No additional debt was issued to finance these projects. 17
21 Long-term Debt Long term Debt Years Ended June 30, 2018, 2017 and 2016 (Dollars in Millions) Change from Change from Outstanding Debt 2018 Prior Year 2017 Prior Year 2016 Capital lease purchase $ 0.9 $ (0.5) $ 1.4 $ 0.1 $ 1.3 Leasehold revenue bonds 53.4 (4.2) 57.6 (4.0) 61.6 Total long-term debt $ 54.3 $ (4.7) $ 59.0 $ (3.9) $ 62.9 Additional information concerning long-term debt is provided in Note 4 to the financial statements. Economic Outlook Based on the Missouri Economic Research & Information Center (MERIC), from June 2017 to June 2018, Missouri added over 34,300 jobs, a 1.2 percent employment growth for Missouri. The Missouri unemployment rate fell to 3.5 percent as of June 2018, its lowest level since September Missouri s per capita personal income increased by 1.7 percent from The final fiscal year 2017 revenue report for the Office of Administration for the State of Missouri indicated that net general revenue collections increased 3.3 percent from fiscal year 2016, from 8.79 billion to 9.08 billion. MCC has three main revenue streams: state appropriations, local taxes and tuition. In fiscal year 2019, MCC is estimating that approximately 27 percent of general fund revenue will come from MCC s state aid appropriation to Missouri Community Colleges. For this reason, MCC monitors statewide economic and political activity closely. State appropriations are estimated to decrease less than 1 percent in fiscal year 2019 due to a projected statewide decrease in revenue. Local tax revenue collections, making up 32 percent of the general fund budget, are projecting a minimal increase of.5 percent for fiscal year The local levy rate for fiscal year 2019 is $ cents per $100 of assessed valuation which is up from the fiscal year 2018 rate of $ cents per $100 of assessed valuation. The increase in the local levy rate was due to a decrease in adjusted current year assessed valuation, which resulted in a decrease to the tax base. Adjusted current year assessed valuation includes changes in assessed value for real estate, personal property and new construction. New construction has increased over the last several years. The last five years included new construction of $217.7 million, $176.4 million, $156.0 million, $94.5 million and $98.7 million. 18
22 Enrollment has been trending downward for the last several years. In fiscal year 2018, MCC enrollment was projected to remain flat but due to an increase in out-of-district enrollment, MCC experienced an overall increase in tuition revenue for the year. Enrollment is again projected to remain flat in fiscal year 2019 and then grow modestly in the future years. Enrollment growth and its relationship to tuition and fees is significant because tuition and fee revenue is the only major source of revenue driven by enrollment. Tuition and fees must support the growth in both teaching and other enrollment driven support costs, especially during periods of significant enrollment growth. MCC did not increase its tuition and fee structure in fiscal year The Board of Trustees approved extending a tuition change for high school dual credit students, charging 50 percent of the applicable tuition rate, in January This should have minimal impact to revenue for fiscal year The in-district credit hour tuition rate is $103, out-of-district credit hour tuition rate is $183, and out-of-state credit hour tuition rate is $237. The total credit hours for fiscal year 2019 are estimated at 318,455. Tuition and fee revenue in the general fund for fiscal year 2019 is estimated at approximately $41.4 million, an increase of approximately 1 percent from fiscal year 2018 due to the increase in out-of-district enrollment. This revenue source makes up approximately 37 percent of the general fund revenue. Requests for Information These financial statements and discussions are designed to provide a general overview of the College s finances for all those with an interest in the entity s finances. Questions concerning any information provided in this report should be addressed to Financial Services Department, 3200 Broadway, Kansas City, Missouri
23 Statements of Net Position Assets Current Assets Cash and cash equivalents $ 55,335,227 $ 49,697,225 Short-term investments 18,412,000 47,106,090 Accounts receivable, net of allowance; 2018 $263,025, 2017 $369,589 7,680,525 7,196,272 Other assets 569,456 2,051,103 Total current assets 81,997, ,050,690 Noncurrent Assets Long-term investments 36,105,000 6,709,000 Capital assets Nondepreciable 10,335,057 11,884,210 Depreciable, net 107,434, ,788,273 Total noncurrent assets 153,874, ,381,483 Total assets 235,871, ,432,173 Deferred Outflows of Resources Loss on debt refundings 2,587,341 3,106,588 Pensions 21,304,422 25,674,988 Other postemployment benefits 259,628-24,151,391 28,781,576 Total $ 260,022,992 $ 261,213,749 See Notes to Financial Statements 20
24 Statements of Net Position (Continued) Liabilities Current Liabilities Accounts payable, accrued and other liabilities $ 8,414,086 $ 9,155,265 Compensated absences 2,217,858 2,232,421 Current portion of long-term debt 4,250,000 4,160,000 Unearned revenue 3,627,666 3,602,675 Unearned revenue - contracts 50, ,991 Capital lease purchases 452, ,913 Total current liabilities 19,012,083 19,948,265 Noncurrent Liabilities Bond payable 49,145,000 53,395,000 Compensated absences 508, ,721 Other postemployment benefit liability 9,868,047 - Net pension liability 60,736,716 62,582,048 Capital lease purchases 452, ,949 Unearned revenue - contracts 300, ,000 Total noncurrent liabilities 121,010, ,885,718 Total liabilities 140,023, ,833,983 Deferred Inflows of Resources Pensions 6,794,502 9,293,533 Other postemployment benefits 583,396 - Net Position 7,377,898 9,293,533 Net investment in capital assets 66,056,786 63,870,209 Unrestricted 46,565,283 50,216,024 Total net position $ 112,622,069 $ 114,086,233 See Notes to Financial Statements 21
25 Statements of Revenues, Expenses and Changes in Net Position Years Ended Operating Revenues Tuition and fees $ 46,918,390 $ 43,786,225 Less sholarship allowance 21,774,143 19,602,210 Student tuition and fees, net 25,144,247 24,184,015 Federal grants and contracts 11,317,308 13,187,261 State and local grants and contracts 3,172,059 6,856,234 Auxiliary services revenues 1,672,756 1,903,317 Other 4,871,673 3,618,392 Total operating revenues 46,178,043 49,749,219 Operating Expenses Salaries and wages 63,306,546 62,821,160 Fringe benefits 21,819,736 21,855,508 Supplies and other services 27,038,160 27,066,026 Utilities 4,014,870 4,046,578 Scholarships and fellowships 3,698,154 4,345,899 Depreciation 6,559,048 6,278,918 Total operating expenses 126,436, ,414,089 Operating Loss (80,258,471) (76,664,870) Nonoperating Revenues (Expenses) Federal Pell Grant revenue 21,666,105 20,655,330 State appropriations 31,115,709 31,950,751 County property tax revenue 35,529,587 34,145,207 Investment income 1,291, ,904 Other nonoperating revenues 4,402,403 3,329,416 Interest on debt related to capital assets (2,030,247) (2,538,652) Net nonoperating revenues 91,974,955 88,179,956 Increase in Net Position 11,716,484 11,515,086 Net Position, Beginning of Year, as Previously Reported 114,086, ,571,147 Cumulative Effect of Change in Accounting Principle (13,180,648) Net Position, Beginning of Year, as Restated 100,905,585 Net position, End of Year $ 112,622,069 $ 114,086,233 See Notes to Financial Statements 22
26 Statements of Cash Flows Years Ended Operating Activities Student tuitions and fees $ 25,424,779 $ 24,162,968 Payments to suppliers (30,721,623) (25,528,180) Payments to utilities (4,014,870) (4,046,578) Payments to employees (63,412,062) (62,130,615) Payments for benefits (22,034,233) (25,782,871) Payments for financial aid and scholarships (3,698,154) (4,345,899) Auxiliary enterprise charges, bookstore and vending 1,672,756 1,903,317 Contracts and grants 15,543,783 19,899,739 Other operating receipts 4,754,535 3,663,546 Net cash used in operating activities (76,485,089) (72,204,573) Noncapital Financing Activities Federal Pell Grant revenue 21,666,105 20,655,330 State aid and grants appropriations 31,115,709 31,950,751 County property tax 35,529,587 34,145,207 Other nonoperating revenue 4,053,412 2,385,751 Net cash provided by noncapital financing activities 92,364,813 89,137,039 Capital and Related Financing Activities Purchases of capital assets (4,655,958) (6,391,242) Loss on disposal of capital assets - 220,355 Proceeds from disposal of capital assets - 1,078,734 Debt payments (4,608,914) (4,400,849) Interest paid on debt related to capital assets (1,557,893) (1,648,645) Net cash used in capital and related financing activities (10,822,765) (11,141,647) Investing Activities Proceeds from sales and maturities of investments 47,151,000 22,893,000 Interest on investments 1,238, ,524 Purchases of investments (47,808,000) (18,675,000) Net cash provided by investing activities 581,043 4,956,524 Increase in Cash and Cash Equivalents 5,638,002 10,747,343 Cash and Cash Equivalents, Beginning of Year 49,697,225 38,949,882 Cash and Cash Equivalents, End of Year $ 55,335,227 $ 49,697,225 See Notes to Financial Statements 23
27 Statements of Cash Flows (Continued) Years Ended Reconciliation of Operating Loss to Net Cash Used in Operating Activities Operating loss $ (80,258,471) $ (76,664,870) Depreciation 6,559,048 6,278,918 Changes in operating assets and liabilities Accounts receivable (475,808) (403,459) Inventories - 82,479 Other assets (30,574) (597,981) Deferred outflows of resources 4,110,938 (14,096,243) Accounts payable, accrued and other liabilities (853,866) (1,556,218) Unearned revenue 24, ,931 Other postretirement benefits liability (1,800,380) - Net pension liabilitly (1,845,332) 15,092,769 Deferred inflows of resources (1,915,635) (472,899) Net Cash Used in Operating Activities $ (76,485,089) $ (72,204,573) Noncash Investing Activity Change in fair value of investments $ 44,910 $ (130,542) See Notes to Financial Statements 24
28 Foundation (Discretely Presented Component Unit) Statements of Financial Position Assets Cash and cash equivalents $ 716,226 $ 742,724 Marketable securities 12,593,683 12,086,386 Contributions receivable, net of allowance; $1,527, $7,486 74, ,677 Accrued interest receivable 33,327 3,730 Prepaid expense 6,000 - Total assets $ 13,423,311 $ 13,192,517 Liabilities and Net Assets Liabilities Due to $ 616,068 $ 25,070 Accrued liabilities 1,265 1,552 Total liabilities 617,333 26,622 Net Assets Unrestricted 3,905,402 3,633,951 Temporarily restricted 3,698,589 4,356,223 Permanently restricted 5,201,987 5,175,721 Total net assets 12,805,978 13,165,895 Total liabilities and net assets $ 13,423,311 $ 13,192,517 See Notes to Financial Statements 25
29 Foundation (Discretely Presented Component Unit) Statement of Activities Year Ended June 30, 2018 Temporarily Restricted Permanently Restricted Unrestricted Total Revenues, Gains and Other Support Contributions $ 162,902 $ 318,811 $ 26,266 $ 507,979 Contributed services 490, ,536 Investment return 380, , ,573 Other income 9,520 30,913-40,433 Net assets released from restrictions 1,594,425 (1,594,425) - - Total revenues, gains and other support 2,637,889 (657,634) 26,266 2,006,521 Expenses Scholarships and grants 568, ,183 Foundation projects 1,307, ,307,719 Fundraising 294, ,321 Management and general 196, ,215 Total expenses 2,366, ,366,438 Change in Net Assets 271,451 (657,634) 26,266 (359,917) Net Assets, Beginning of Year 3,633,951 4,356,223 5,175,721 13,165,895 Net Assets, End of Year $ 3,905,402 $ 3,698,589 $ 5,201,987 $ 12,805,978 See Notes to Financial Statements 26
30 Foundation (Discretely Presented Component Unit) Statement of Activities Year Ended June 30, 2017 Temporarily Restricted Permanently Restricted Unrestricted Total Revenues, Gains and Other Support Contributions $ 142,183 $ 308,012 $ 80,380 $ 530,575 Contributed services 373, ,903 Investment return 498, ,750-1,217,696 Other income 4,315 28,081 1,771 34,167 Net assets released from restrictions 487,273 (487,273) - - Total revenues, gains and other support 1,506, ,570 82,151 2,156,341 Expenses Scholarships and grants 332, ,982 Foundation projects 299, ,950 Fundraising 224, ,342 Management and general 149, ,561 Total expenses 1,006, ,006,835 Change in Net Assets 499, ,570 82,151 1,149,506 Net Assets, Beginning of Year 3,134,166 3,788,653 5,093,570 12,016,389 Net Assets, End of Year $ 3,633,951 $ 4,356,223 $ 5,175,721 $ 13,165,895 See Notes to Financial Statements 27
31 Foundation (Discretely Presented Component Unit) Statements of Cash Flows Years Ended Operating Activities Change in net assets $ (359,917) $ 1,149,506 Items not requiring (providing) operating activities cash flows Contributions restricted for long-term investments (26,266) (80,380) Net realized and unrealized gains on investments (736,216) (1,001,160) Changes in Contributions receivable 285,602 92,387 Accrued interest receivable (29,597) 1 Prepaid assets (6,000) - Due to 590,998 (45,153) Accrued liabilities (287) 278 Net cash provided by (used in) operating activities (281,683) 115,479 Investing Activities Purchase of marketable securities (3,534,054) (2,945,092) Sale of marketable securities 3,762,973 2,246,298 Net cash provided by (used in) investing activities 228,919 (698,794) Financing Activities Contributions restricted for long-term investments 26,266 80,380 Net cash provided by financing activities 26,266 80,380 Decrease in Cash and Cash Equivalents (26,498) (502,935) Cash and Cash Equivalents, Beginning of Year 742,724 1,245,659 Cash and Cash Equivalents, End of Year $ 716,226 $ 742,724 See Notes to Financial Statements 28
32 Notes to Financial Statements Note 1: Summary of Significant Accounting Policies Organization The Junior College District of Metropolitan Kansas City, Missouri (the District) was created in May 1964 by the voters of seven suburban school districts and the Kansas City School District to provide comprehensive higher educational programs through its area colleges. The District also offers courses, which meet the needs of persons who desire enrichment or retraining in the areas of liberal arts, occupational education, continuing education and community services. The District is now comprised of twelve school districts: Belton, Center, Grandview, Hickman Mills, Lee s Summit, North Kansas City, Raytown, Kansas City, Blue Springs, Independence, Fort Osage and Park Hill. Five primary colleges have been established to serve the patrons of the District: Blue River, Longview, Maple Woods, Penn Valley and the Business & Technology College. The financial statements of (the College) for the years presented, include the combined accounts and operations of the District and the Kansas City Metropolitan Community Colleges Building Corporation (the Building Corporation), which is a blended component unit. This summary of significant accounting policies of the College is presented to assist in understanding the College s financial statements. The financial statements and notes are representations of the College s management, who are responsible for their integrity and objectivity. These accounting policies conform to accounting principles generally accepted in the United States as applicable to governmental colleges and universities and have been consistently applied in the preparation of the financial statements. The following is a summary of the more significant policies. Reporting Entity The College is governed by a six-member Board of Trustees. As required by accounting principles generally accepted in the United States, the College s financial statements present the District (the primary government), its blended component unit (the Building Corporation) and its discretely presented component unit, Foundation (the Foundation). The component units are included in the College s reporting entity because of the significance of their operations and financial relationships with the College. Blended Component Unit The Building Corporation is a not-for-profit corporation formed in 1984, which is governed by a four-member board. Although it is legally separate from the District, the Building Corporation is reported as if it were part of the primary government because its sole purpose is to provide for the construction and financing of educational facilities used by the College. The Building Corporation has the authority to issue Leasehold Development Bonds for the purposes of refunding previous bond issues or constructing new facilities. The buildings are owned by the Building Corporation, which, in turn, leases the buildings to the District under annually renewable lease agreements. The lease payments are equal to the principal and interest debt service payments required to service the related bond issuances. As the Building Corporation is a blended component unit, all balances and transactions between the District and Building Corporation have been eliminated. The Building Corporation has a June 30 fiscal year end. 29
33 Notes to Financial Statements Discretely Presented Component Unit The Foundation is a non-profit corporation and is considered to be a related organization to the District. The District s Board of Trustees approves nominations to the Foundation s Board of Directors, but the District s accountability does not extend beyond approval of board members. The District is not financially accountable for the Foundation. Although the District does not control the timing or amount of receipts from the Foundation, the majority of resources or income thereon, which the Foundation holds and invests, is restricted to the activities of the District by the donors. As these restricted resources can only be used by, or for the benefit of, the District, the Foundation is considered a component unit of the College and is discretely presented in the College s financial statements. During the years ended, the District received direct contributions from the Foundation of $154,929 and $97,526, respectively. The Foundation has a June 30 fiscal year end. Separate financial statements for the Foundation can be obtained at The Metropolitan Community College, 3200 Broadway, Kansas City, Missouri, The Foundation is presented on the accrual basis of accounting. Change in Accounting Principle In 2018, the College adopted GASB Statement No. 75, Accounting and Financial Reporting for Postemployment Benefits Other Than Pensions. This statement established standards for measuring and recognizing liabilities, deferred outflows and inflows of resources and expenses for postemployment benefits that are provided to retirees. The College has not restated its financial statements as of and for the year ended June 30, 2017 because the actuarial information was not readily available for that period, thus making restatement of the 2017 financial statements impractical. As a result of the implementation, unrestricted net position as of July 1, 2017 was restated as follows: Unrestricted net position, as previously reported $ 50,216,024 Cumulative effect of change in accounting principle Net OPEB liability (measurement date of June 30, 2017) (13,180,648) Total cumulative effect of change in accounting principle (13,180,648) Unrestricted net position, as restated $ 37,035,376 30
34 Notes to Financial Statements Basis of Accounting For financial reporting purposes, the College is considered a special purpose government engaged only in business-type activities. Accordingly, the College s financial statements have been presented using the economic resources measurement focus and the accrual basis of accounting. Under the accrual basis, revenues are recognized when earned, and expenses are recorded when an obligation has been incurred. All significant inter-company transactions have been eliminated. Cash Equivalents Cash includes deposits held at banks and all highly liquid instruments purchased with an original maturity of three months or less. Cash equivalents represent excess operating cash swept into an overnight repurchase agreement account, which are readily converted back to cash, on a daily basis, as operating funds are needed. Investments It is the College s policy to invest in obligations of the U.S. Treasury, repurchase agreements, bank certificates of deposit and agencies of the federal government and instrumentalities and top-rated commercial paper, which are permissible under Missouri statutes. The Building Corporation is allowed to invest in permitted investments as defined by applicable bond indentures. Investments are reported at fair value, except for investments in nonnegotiable certificates of deposit, which are carried at amortized cost. In addition to the investment tools available to the College, the Foundation s marketable securities consist of equity securities, mutual fund shares, corporate bonds and government notes reported at fair value. 31
35 Notes to Financial Statements Accounts Receivable Accounts receivable consists of tuition and fee charges to students and charges for auxiliary enterprise services provided to students, faculty and staff. Accounts receivable is recorded net of estimated uncollectible amounts. Accounts receivable also includes amounts due from the federal government, state and local governments or private sources, in connection with reimbursement of allowable expenditures made pursuant to the College s grants and contracts. Capital Assets Land, construction in progress, buildings and improvements, software and equipment are recorded at cost for assets purchased and at appraised value at date of grant for items acquired by donation. Capital assets are defined by the College as assets with an initial, individual cost in excess of $5,000 (equipment) or $50,000 (building and improvements; infrastructure and software) estimated useful lives in excess of one year. Interest costs on construction in progress are capitalized when amounts are significant. Buildings and improvements and equipment are being depreciated on the straight-line basis over their estimated useful lives as follows: buildings-40 years, improvements-15 years, software- 3 years and equipment, 3 to 10 years and rental textbooks are capitalized at cost and depreciated over 3 years. The College s investment in infrastructure assets, which is not material to the total of capital assets, is recorded at cost and included in the costs of the related property. Deferred Outflows of Resources The College reports the consumption of net position that is applicable to a future period as deferred outflows of resources in a separate section of its statements of net position. Deferred Inflows of Resources The College reports an acquisition of net position that is applicable to a future period as deferred inflows of resources in a separate section of its statements of net position. Loss on Refunding of Bonds Losses incurred on the refunding of bond issues have been deferred and are being amortized over the life of the bonds and are included in deferred outflows of resources. The net amount as of was $2,587,341 and $3,106,588, respectively. 32
36 Notes to Financial Statements Compensated Absences College employees accumulate a limited amount of earned but unused vacation and sick leave for subsequent use. Earned, but unused vacation is paid to the employee upon termination, or retirement. Earned, but unused sick leave is paid to an active employee s beneficiary upon death if occurring during active employment. Unearned Revenue Half of the summer school tuition revenue and all tuition for school sessions starting after June 30 have been deferred to the next fiscal year. Unearned Revenue - Contracts Unearned revenue contracts includes the difference between rent on a straight-line basis, as required by generally accepted accounting principles, and the actual scheduled payments for the lease as well as unearned revenue on a bookstore vending contract. Defined Benefit Other Postemployment Benefit Plan The College participates in a single-employer other postemployment benefit plan (the OPEB Plan) that provides life insurance, medical, vision and dental benefits. For purposes of measuring the net OPEB liability, deferred outflows of resources and deferred inflows of resources related to OPEB, and OPEB expense, information has been determined on the same basis as they are reported by the OPEB Plan. For this purpose, benefit payments are recognized when due and payable in accordance with the benefit terms. The College funds benefits on a pay-as-you-go basis and there are no assets accumulated in the Plan. Classification of Revenues The College has classified revenues as either operating or non-operating revenues according to the following criteria: Operating revenues Operating revenues include activities that have the characteristics of exchange transactions, such as (1) student tuition and fees, net of scholarship discounts and allowances, (2) sales and services of auxiliary enterprises and (3) federal, state and local grants and contracts. Non-operating revenues Non-operating revenues include activities that have the characteristics of non-exchange transactions, such as contributions and other revenue sources that are defined as nonoperating revenues by GASB No. 9, Reporting Cash Flows of Proprietary and Nonexpendable Trust Funds and Government Entities that use Proprietary Fund Accounting and GASB No. 34, such as state appropriations, investment income and county property taxes. 33
37 Notes to Financial Statements Tuition and Fees Tuition and fees revenues are reported net of scholarship allowances, while stipends and other payments made directly to students are presented as scholarship expenses. County Property Tax Revenues The four counties in which the District lies, bill the residents for real and personal property taxes due the District. Bills are sent in November and are delinquent after December 31. The taxes are collected by the counties primarily from November through the end of January. Substantially all amounts are received by the end of March. Taxes are remitted to the District throughout the collection period net of a 1.6 percent charge for the years ended, for assessment and collection services on an as-collected basis and no accrual is made for delinquent property taxes. State Appropriations State appropriations earned for general operating purposes are determined on a fiscal year basis ending June 30 based upon the state aid funding formula. Using this formula, fiscal year is a base year and following years are adjusted for inflation or any major state-approved additions to programs. Income Tax Status The College is exempt from income tax as a local governmental unit. The Building Corporation and the Foundation have qualified for exemption from income tax under Section 501(c)3 of the Internal Revenue Code. However, the College is subject to federal income tax on any unrelated business taxable income. Net Position Net position represents the difference between assets and deferred outflows of resources and liabilities and deferred inflows of resources. Net position is presented in three major categories. The first is net investment in capital assets, which represents the College s equity in property, plant and equipment. The second is restricted. The third is unrestricted, including amounts designated by the Board. Net investment in capital consists of capital assets, net of accumulated depreciation, reduced by the outstanding balances of any borrowings used for the acquisition, construction or improvement of those assets. Net position is reported as restricted when there are limitations imposed on their use through enabling legislation or through external restrictions imposed by creditors, grantors or laws or regulations of other governments. The College first applied restricted resources when an expense is incurred for purposes for which both restricted and unrestricted assets are available. 34
38 Notes to Financial Statements Use of Estimates The preparation of financial statements in conformity with accounting principles generally accepted in the United States of America requires management to make estimates and assumptions that affect the reported amounts of assets and deferred outflows of resources and liabilities and deferred inflows of resources and disclosure of contingent assets and liabilities at the date of the financial statements and the reported amounts of revenues, expenses and other changes in net position during the reporting period. Actual results could differ from those estimates. Scholarship Allowances and Student Aid Financial aid to students is reported in the financial statements, as prescribed by the National Association of College and University Business Officers (NACUBO). Certain aid (loans, funds provided to students as awarded by third parties and Federal Direct Lending) is accounted for as third-party payments (credited to the student s account as if the student made the payment). All other aid is reflected in the financial statements as operating expenses or scholarship allowances, which reduce revenue. The amount reported as operating expenses represents the portion of aid that was provided to the student in the form of cash. Scholarship allowances represent the portion of aid provided to the student in the form of reduced tuition. Pensions The College participates in two cost-sharing multiple employer defined benefit pension plans: the Public Education Employee Retirement System of Missouri ( PEERS ) and Public School Retirement System of Missouri ( PSRS ). The fiduciary net position, as well as additions to and deductions from the fiduciary net position, of PEERS and PSRS have been determined on the same basis as they are reported by PEERS and PSRS. The financial statements were prepared using the accrual basis of accounting. Member and employer contributions are recognized when due, pursuant to formal commitments and statutory requirements. Benefits and refunds of employee contributions are recognized when due and payable in accordance with the statutes governing PSRS. Expenses are recognized when the liability is incurred, regardless of when payment is made. Investments are reported at fair value on a trade date basis. The fiduciary net position is reflected in the measurement of the College s net pension liability, deferred outflows and inflows of resources related to pensions and pension expense. Subsequent Events In September 2018, the College sold the Longview Recreation Center for $4,100,000 resulting in a gain on sale of approximately $2,000,
39 Notes to Financial Statements Note 2: Deposits and Investments Missouri statutes require depository banks to pledge securities as collateral for public funds on deposit, except funds covered by federal depository insurance. Missouri statutes do not extend to the Building Corporation regarding collateralization of funds not covered by federal depository insurance. The College deposits were not exposed to custodial credit risk as of June 30, 2018 and The College has the following deposits and investments: Deposits Carrying value Cash $ 158,969 $ 138,900 Certificates of deposits 54,517,000 28,859,101 Investments Maturities in Years $ 54,675,969 $ 28,998,001 Cost or Fair Value Less Than Year Ended June 30, 2018 District Repurchase agreement $ 50,721,000 $ 50,721,000 $ - Less outstanding checks and deposits/withdrawals in transit (549,260) (549,260) - Total District 50,171,740 50,171,740 - Building Corporation Money market mutual funds 5,004,518 5,004,518 - Total Building Corporation 5,004,518 5,004,518 - Total investments $ 55,176,258 $ 55,176,258 $ - 36
40 Notes to Financial Statements Cost or Fair Value Less Than Year Ended June 30, 2017 District Repurchase agreement $ 45,115,000 $ 45,115,000 $ - Less outstanding checks and deposits/withdrawals in transit (517,188) (517,188) - Federal Home Loan Bank 8,985,590 8,985,590 - Federal National Mortgage Association 15,969,500 15,969,500 - Total District 69,552,902 69,552,902 - Building Corporation Money market mutual funds 4,961,412 4,961,412 - Total Building Corporation 4,961,412 4,961,412 - Total investments $ 74,514,314 $ 74,514,314 $ - A summary of carrying values of investments and deposits at June 30 were as follows: Deposits $ 54,675,969 $ 28,998,001 Investments 55,176,258 74,514,314 $ 109,852,227 $ 103,512,315 The investments and deposits at June 30 are shown on the statements of net position as follows: Cash and cash equivalents $ 55,335,227 $ 49,697,225 Short-term investments 18,412,000 47,106,090 Long-term investments 36,105,000 6,709,000 Total $ 109,852,227 $ 103,512,315 State law limits investments in government and municipal bonds and top rated commercial paper as recognized by national rating organizations. The College has no investment policy that would further limit its investment choices. As of June 30, 2018, the College s repurchase agreement is invested in government agencies that are all rated Aaa, AA+ and AAA by Moody s Investors Services, Standards & Poor s and Fitch s ratings, respectively. The District s and Building Corporation s investments in money market mutual funds are invested in Treasury Obligations which is rated Aaa, AA+ and AAA by Moody s Investors Services, Standard & Poor s and Fitch s 37
41 Notes to Financial Statements ratings, respectively. All other investments held by the District and the Building Corporation are rated Aaa, AA+ and AAA by Moody s Investors Service, Standard & Poor s and Fitch s ratings, respectively. The College places no limit on the amount the College may invest in any one issuer. In fiscal year 2017, more than five percent of the College s investments were invested in government agencies, Federal Home Loan Bank (FHLB) and Federal National Mortgage Association (FNMA). These investments were 46 percent of total investments. The College s deposit and investment balances were not exposed to custodial credit risk as of. Note 3: Capital Assets Capital assets consist of the following categories: 2018 Beginning Balance Additions Disposals Transfers Ending Balance Capital assets not being depreciated Land $ 8,254,361 $ - $ - $ - $ 8,254,361 Art 56, ,000 Construction in progress 2,836,649 3,589,017 - (4,400,970) 2,024,696 Equipment in progress 269,998 1,056,189 - (1,326,187) - Software in progress 467, (467,202) - Total assets not being depreciated 11,884,210 4,645,206 - (6,194,359) 10,335,057 Capital assets being depreciated Building and improvements 217,525, ,227, ,752,587 Infrastructure 7,251,348 - (1,919) 1,173,437 8,422,866 Equipment 20,839,643 12,670 (687,372) 1,326,187 21,491,128 Software 683, ,202 1,150,891 Total assets being depreciated 246,299,734 12,670 (689,291) 6,194, ,817,472 Less accumulated depreciation Building and improvements 116,272,765 4,960, ,233,205 Infrastructure 3,248, , ,642,534 Equipment 18,306,014 1,036,355 (687,373) - 18,654,996 Software 683, , , ,511,461 6,559,048 (687,373) - 144,383,136 Net capital assets $ 119,672,483 $ (1,901,172) $ (1,918) $ - $ 117,769,393 38
42 Notes to Financial Statements 2017 Beginning Balance Additions Disposals Transfers Ending Balance Capital assets not being depreciated Land $ 8,414,239 $ - $ (159,878) $ - $ 8,254,361 Art 56, ,000 Construction in progress - 5,108,427 - (2,271,778) 2,836,649 Equipment in progress 59,271 1,228,797 (59,271) (958,799) 269,998 Software in progress - 467, ,202 Total assets not being depreciated 8,529,510 6,804,426 (219,149) (3,230,577) 11,884,210 Capital assets being depreciated Building and improvements 217,312,175 - (1,630,761) 1,843, ,525,054 Infrastructure 6,823, ,139 7,251,348 Equipment 20,226,782 - (345,937) 958,798 20,839,643 Software 683, ,689 Total assets being depreciated 245,045,855 - (1,976,698) 3,230, ,299,734 Less accumulated depreciation Building and improvements 112,036,218 4,734,747 (498,200) - 116,272,765 Infrastructure 2,906, , ,248,993 Equipment 17,450,723 1,201,227 (345,936) - 18,306,014 Software 683, , ,076,679 6,278,918 (844,136) - 138,511,461 Net capital assets $ 120,498,686 $ 525,508 $ (1,351,711) $ - $ 119,672,483 The College elected not to capitalize their collection of library books. This collection adheres to the College s policy to (a) maintain them for public exhibition, education or research; (b) protect, keep unencumbered, care for, and preserve them; and (c) require proceeds from their sale to be used to acquire other collection items. Generally accepted accounting principles permit collections maintained in this manner to be charged to operations at the time of purchase rather than be capitalized. 39
43 Notes to Financial Statements Note 4: Long-term Liabilities Long-term liability activity for the District and the Building Corporation were as follows: 2018 Beginning Ending Current Balance Additions Deductions Balance Portion District Compensated absences $ 2,886,142 $ 1,942,070 $ 2,101,650 $ 2,726,562 $ 2,217,858 Other postemployment benefit obligations (1,512,221) 13,429,268 2,049,000 9,868,047 - Net pension liability 62,582,048 4,630,486 6,475,818 60,736,716 - Capital lease purchases 1,353, , , ,473 Unearned revenue - contracts 698, , ,000 50,000 Building Corporation Bonds payable Leasehold revenue bonds, Series 2014A Principal 37,895, ,895,000 - Leasehold revenue bonds, Series 2014B Principal 19,660,000-4,160,000 15,500,000 4,250,000 Total long-term liabilities $ 123,563,822 $ 20,001,824 $ 15,584,373 $ 127,981,273 $ 6,970, Beginning Ending Current Balance Additions Deductions Balance Portion District Compensated absences $ 2,841,147 $ 2,253,529 $ 2,208,534 $ 2,886,142 $ 2,232,421 Net pension liability 47,489,279 21,375,971 6,283,202 62,582,048 - Capital lease purchase 1,329, , ,849 1,353, ,913 Unearned revenue - contracts 1,645, , , ,991 Building Corporation Bonds payable Leasehold revenue bonds, Series 2014A Principal 37,895, ,895,000 - Leasehold revenue bonds, Series 2014B Principal 23,725,000-4,065,000 19,660,000 4,160,000 Total long-term liabilities $ 114,925,538 $ 23,990,062 $ 13,839,557 $ 125,076,043 $ 7,190,325 Insurance replacement cost for buildings subject to lien under the Building Corporation s and the District s debt agreements are $51,669,432. The Building Corporation constructs the educational facilities for the College and leases them to the College on annually renewable leases. The College has agreed to appropriate the amount required by the individual bond principal and interest requirements. This is subject to annual appropriation from the College s budget. The Building Corporation s Series 2014A and Series 2014B fall under this arrangement. Total principal and interest remaining on this debt was $62,607,542 and $68,323,470 as of, respectively, with final payment in fiscal Interest paid during the years ended June 30, 2018 and 2017 was $1,555,928 and $1,648,645, respectively. 40
44 Notes to Financial Statements Building Corporation Series 2014 On September 25, 2014, the Building Corporation issued Leasehold Revenue Refunding Bonds Series 2014A, $37,895,000 non-taxable and Series 2014B, $27,450,000 taxable bond issuance, with a weighted average interest rate of 3.06 percent for Series 2014A and percent for Series 2014B. The bonds were issued for the purpose of the advance refunding and legal defeasance of the balances of the Leasehold Revenue and Improvement Bonds Series 2006 of $58,460,000 and Lease Certificates of Participation Bonds Series 2008 of $29,535,000. At, the current outstanding balance of these defeased bonds was $52,055,000 and $57,440,000, respectively. In accordance with accounting principles generally accepted in the United States of America, the outstanding balances of the defeased bonds Series 2006 and Series 2008 bonds are not reflected on the statements of net position of Building Corporation. As provided in the bond indenture and the certificates, the Series 2014A and Series 2014B shall be subject to the redemption and payment prior to the stated maturity, upon instructions from the District, due to certain conditions or events affecting title, as a whole or in part on any date, at par (100 percent), plus accrued interest (if any) to the redemption date. During the years ended, none of the Series 2014A and Series 2014B were retired. Series 2014A Total to Principal Interest Interest Year Ending be Paid Maturities Expense Rate 2019 $ 1,159,587 $ - $ 1,159, % ,159,587-1,159, % ,159,587-1,159, % ,217,610 2,090,000 1,127, % ,689,259 4,665,000 1,024, % ,407,122 25,550,000 2,857, % ,675,527 5,590,000 85, % $46,468,279 $37,895,000 $ 8,573,279 41
45 Notes to Financial Statements Series 2014B Total to Principal Interest Interest Year Ending be Paid Maturities Expense Rate Capital Lease 2019 $ 4,551,539 $ 4,250,000 $ 301, % ,554,596 4,350, , % ,550,454 4,445, , % ,482,674 2,455,000 27, % $16,139,263 $15,500,000 $ 639,263 Capital lease purchases can be summarized as follows: Dell Equipment (A) $ 664,573 $ 996,862 Dell Virus Protection Software (B) 240, , ,948 1,353,862 Less current maturities (452,473) (448,913) $ 452,475 $ 904,949 (A) (B) On March 27, 2014, the College entered into a capital lease agreement with Dell Financial Services. The lease includes an interest-free $1,976,942 agreement. The lease included wiring, wireless connectivity, security and other technology updates. In June 2017, the College entered into a capital lease agreement with Dell Financial Services. The lease includes an interest-free $360,562 agreement. The lease included virus protection software. 42
46 Notes to Financial Statements Aggregate future minimum lease payments at June 30, 2018 were: Year Ending Principal Maturities 2019 $ 452, ,475 $ 904,948 Unearned Revenue - Contracts Unearned revenue contracts can be summarized as follows: Sprint lease unearned revenue (A) $ - $ 298,991 Follett agreement unearned revenue (B) 350, , , ,991 Less current maturities (50,000) (348,991) $ 300,000 $ 350,000 (A) The College entered into a lease agreement with Sprint (Nextel Spectrum Acquisition Corporation) for Sprint to lease educational broadband lines (EBS) from the College. The initial lease period is November 2007 through October 2017, with an initial renewal term through October The lease agreement provides for Sprint to make accelerated rental payments over the term of the lease. The lease required a payment of $3,793,945 in fiscal year 2008, annual payments of $1,293,945 through June 30, 2013 and monthly payments ranging from approximately $80,000 to $100,000 through October In 2018, Sprint made a one-time fee of $1,000,000 that was non-refundable. The difference between the lease income on a straight-line basis and the actual scheduled lease payments reported as unearned revenue contracts was $0 and $298,991 as of, respectively. Total rental income earned for years ended was $1,933,319 and $896,973, respectively. (B) On July 1, 2015, the College entered into a 10-year agreement with Follett Higher Education Group, Inc. ( Follett ) to outsource bookstores for the College on five campuses terminating in The agreement required Follett to provide a one-time payment of $500,000, which was received by the College during If the agreement is terminated before expiration, the College is to return the unamortized value of the one-time payment. As of, the unamortized value of the payment was $350,000 and $400,000, respectively. 43
47 Notes to Financial Statements Note 5: Other Postemployment Benefits In 2018, the College adopted GASB Statement No. 75, Accounting and Financial Reporting for Postemployment Benefits Other Than Pensions, and in 2017, the College reported under GASB Statement No. 45, Accounting and Financial Reporting by Employers for Postemployment Benefits Other Than Pensions, which require the following measurement and recognition disclosures: Plan Description The College sponsors a single-employer defined benefit other postemployment benefit (OPEB) plan that provides life insurance, medical, vision and dental benefits to all qualifying retirees and their dependents. Under the College s plan, an employee who meets the retirement criteria must have opted to retire before July 1, 2013 to receive these benefits. The criteria for retirement is the active employee must either be at least age 55 with 10 years of consecutive full-time service, or have 30 years of full-time service. Eligible retirees and their dependents receive coverage through a fully-insured plan, the same plans that are available for active employees. No assets are accumulated in a trust that meets the criteria in paragraph 4 of GASB Statement No. 75. Benefits Provided The life insurance benefit is two times final salary at retirement. The retiree pays no premiums on this coverage until age 65. If the retiree elects to continue this coverage from age 65 to age 70, they must pay the full premium. After age 70, this benefit is no longer available. The retiree is eligible to continue coverage of other benefits upon retirement by paying no premium until age 65 and the COBRA premium from age 65 onward. The employee can choose which benefits, medical, vision and/or dental they will continue to receive. The employees covered by the OPEB Plan at June 30 are: 2018 Inactive employees or beneficiaries currently receiving benefit payments 601 Active employees 801 1,402 44
48 Notes to Financial Statements GASB 75 Disclosures (2018) Total OPEB Liability The College s total OPEB liability of $9,868,047 was measured as of June 30, 2018 and was determined by an actuarial valuation as of July 1, 2016, rolled forward to June 30, The total OPEB liability in the July 1, 2016 actuarial valuation was determined using the following actuarial assumptions, applied to all periods included in the measurement: Discount rate 3.30% per annum (end of period) 3.35% per annum (beginning of period) Salary increases 2.0% per year Medical cost trend rates 8.0% for 2018, decreasing 0.5% per year for 5 years then decreasing 0.25% per year for an ultimate rate of 5.0% for 2026 and later years Dental cost trend rate 3.5% per year Vision cost trend rate 2.5% per year H.S.A and F.S.A. contribution trend rate 2.0% per year The discount rate used for the plan was the 20-year, tax-exempt municipal bond rate as there are no assets in the Plan. Mortality rates were based on the RPH-2014 Adjusted to 2006 Total Dataset Headcount-weighted Mortality table with MP-2017 Full Generational Improvement. The actuarial assumptions used in the July 1, 2016 valuation were based on the results of an actuarial experience study from Net OPEB Asset The College s net OPEB asset at June 30, 2017 of $1,512,221 is calculated based on the annual required contribution (ARC) of the employer, an amount actuarially determined in accordance to the parameters of GASB Statement No. 45. The ARC represents a level of funding that, if paid on an ongoing basis, is projected to cover the normal cost each year and amortize any unfunded actuarial liabilities over a period not to exceed thirty years. In the July 1, 2016 actuarial valuation, the project unit credit method was used. The actuarial assumptions included a 3.5 percent discount rate, an annual health care cost trend rate of 8.0 percent reduced annually to an ultimate rate of 5 percent. Mortality rates were based on the RPH Adjusted to 2006 White Collar Headcount-weighted Mortality table with MP-2016 Full Generational Improvement. 45
49 Notes to Financial Statements Changes in Total OPEB Liability Changes in total OPEB liability are: 2018 Service cost $ 258,494 Interest 365,040 Changes in assumptions or other inputs (374,914) Benefit payments (2,049,000) Net change in OPEB (1,800,380) Net OPEB asset under GASB 45, beginning of year, as previously reported (1,512,221) Cumulative Effect of Change in Accounting Principle 13,180,648 Total OPEB liability under GASB 75, beginning of year, as restated 11,668,427 Total OPEB liability, end of year $ 9,868,047 Sensitivity of the Total OPEB Liability to Changes in the Discount Rate and Health Care Cost Trend Rates The total OPEB liability of the College has been calculated using a discount rate of 3.30 percent (3.35 percent in prior year). The following presents the total OPEB liability using a discount rate 1 percent higher and 1 percent lower than the current discount rate. 1% Decrease Current Discount 1% Increase (2.30%) Rate (3.30%) (4.30%) College's total OPEB liability $ 10,342,322 $ 9,868,047 $ 9,429,680 46
50 Notes to Financial Statements The total OPEB liability of the College has been calculated using health care cost trend rates of 8.00 percent decreasing to 5.00 percent. The following presents the total OPEB liability using health care cost trend rates 1 percent higher and 1 percent lower than the current health care cost trend rates. Healthcare Cost Trend Rate (8.00% 1% Decrease decreasing to 5.00%) 1% Increase College's total OPEB liability $ 9,209,581 $ 9,868,047 $ 10,609,131 OPEB Expense and Deferred Outflows of Resources and Deferred Inflows of Resources Related to OPEB For the year ended June 30, 2018, the College recognized OPEB expense of $572,386. For the year ended June 30, 2018, the College recognized revenue of $0 for support provided by nonemployer contributing entities. At June 30, 2018, the College reported deferred outflows of resources and deferred inflows of resources related to OPEB from the following sources: 2018 Deferred Deferred Outflows of Inflows of Resources Resources Differences between expected and actual experience $ 259,628 $ - Changes of assumptions - 583,396 Total $ 259,628 $ 583,396 Amounts reported as deferred outflows of resources and deferred inflows of resources at June 30, 2018, related to OPEB will be recognized in OPEB expense as follows: Fiscal Year Ending Amount 2019 $ (51,148) 2020 (51,148) 2021 (51,148) 2022 (51,148) 2023 (51,148) Thereafter (68,028) $ (323,768) 47
51 Notes to Financial Statements GASB 45 Disclosures (2017) Funding Policy The College establishes and amends contribution requirements. A retiree s coverage shall be no greater than the insurance coverage afforded College employees. The current funding policy of the College is to fund benefits on a pay-as-you-go basis. Retirees who retire prior to July 1, 2013 upon retirement pay the same premium amount as the active employees until they attain age 65. Otherwise, retirees and dependents must pay COBRA rates to maintain medical coverage with the College. Annual OPEB Cost and Net OPEB Obligation The College s annual OPEB cost (expense) is calculated based on the annual required contribution (ARC) of the employer, an amount actuarially determined in accordance to the parameters of GASB Statement No. 45. The ARC represents a level of funding that, if paid on an ongoing basis, is projected to cover the normal cost each year and amortize any unfunded actuarial liabilities over a period not to exceed thirty years. The following table shows the components of the College s annual OPEB cost for the year, the amount actuarially contributed to the Plan, and changes in the College s annual OPEB obligation (asset), included in other assets at June 30, 2017: 2017 Annual required contribution $ 1,611,495 Interest on net OPEB oligation (35,597) Adjustement to annual required contribution 103,936 Annual OPEB cost/expense 1,679,834 Less contributions and payments made 2,175,000 Decrese in net OPEB obligation (495,166) Net OPEB asset, beginning of year (1,017,055) Net OPEB asset, end of year $ (1,512,221) The College s annual OPEB cost, the percentage of annual OPEB cost contributed to the Plan and the net OPEB obligation for fiscal year 2017 were as follows: Year Ending Annual Percentage of Annual OPEB Net OPEB June 30, OPEB Cost Cost Contributed Asset 2017 $ 1,679, % $ (1,512,221) 48
52 Notes to Financial Statements Funded Status and Funding Progress Funded stats and funding progress can be summarized as follows: 2017 Most recent actuarial valuation date July 1, 2016 Actuarial accrual liability (AAL) $ 12,845,610 Unfunded actuarial accrued liability 12,845,610 Funded ratio - Covered payroll 45,438,106 UAAL as a percentage of covered payroll 28% Actuarial estimates of an ongoing plan involve estimates of the value of reported amounts and assumptions about the probability of occurrence of events far into the future. Examples include assumptions about the future employment, mortality and the healthcare cost trend. Amounts determined regarding the funded status of the Plan and the annual required contributions of the employer are subject to continual revision as actual results are compared with past expectations and new estimates are made about the future. The schedule of funding progress, presented as required supplementary information following the notes to the financial statements, presents multi-year information about whether the actuarial value of plan assets is increasing or decreasing over time relative to the actuarial accrued liabilities for benefits. Actuarial Methods and Assumptions Projections of benefits for financial reporting purposes are based on the substantive plan (the plan as understood by the employer and the plan members) and included the types of benefits provided at the time of each valuation and the historical pattern of sharing of benefit costs between the employer and plan members to that point. The actuarial methods and assumptions used include techniques that are designed to reduce the effects of short-term volatility in actuarial accrued liabilities and the actuarial value of assets, consistent with the long-term perspective of the calculations. In the July 1, 2016 actuarial valuation, the project unit credit method was used. The actuarial assumptions included a 3.5 percent discount rate, an annual health care cost trend rate of 8.0 percent reduced annually to an ultimate rate of 5 percent. The UAAL is being amortized as a level of percentage of pay on an open basis over 10 years. 49
53 Notes to Financial Statements Note 6: Retirement Plan and Net Pension Liability General Information about the Pension Plan All full-time and certain part-time employees of the College participate either in the Public School Retirement System ( PSRS ) or the Public Education Employee Retirement System ( PEERS ), both of which are cost sharing multiple-employer public employee retirement systems, as required by the retirement law set forth in Chapter 169, Revised Statutes of Missouri. PEERS Plan Description. PEERS is a mandatory cost-sharing multiple-employer retirement system for all public school district employees (except the school districts of St. Louis and Kansas City), employees of the Missouri Association of School Administrators and community college employees (except the Community College of St. Louis). Employees of covered districts who work 20 or more hours per week on a regular basis and who are not contributing members of the Public School Retirement System of Missouri (PSRS) must contribute to PEERS. Employees of PSRS who do not hold Missouri educator certificates also contribute to PEERS. PEERS was established as a trust fund by an Act of the Missouri General Assembly effective October 13, Statutes governing the System are found in Sections and Sections RSMo. The statutes place responsibility for the operation of PEERS on the Board of Trustees of the Public School Retirement System of Missouri. A Comprehensive Annual Financial Report ( CAFR ) can be obtained at PSRS Plan Description. PSRS is a mandatory cost-sharing multiple employer retirement system for all full-time certificated employees and certain part-time certificated employees of all public school districts in Missouri (except the school districts of St. Louis and Kansas City) and all public community colleges. PSRS also includes certificated employees of PSRS, Missouri State Teachers Association, Missouri State High School Activities Association and certain employees of the state of Missouri who elected to remain covered by PSRS under legislation enacted in 1986, 1987 and The majority of PSRS members are exempt from Social Security contributions. In some instances, positions may be determined not to be exempt from Social Security contributions. Any PSRS member who is required to contribute to Social Security comes under the requirements of Section (9) RSMo, known as the 2/3s statute. PSRS members required to contribute to Social Security are required to contribute two-thirds of the approved PSRS contribution rate and their employer is required to match the contribution. The members benefits are further calculated at two-thirds the normal benefit amount. A CAFR can be obtained at PEERS Benefits Provided. PEERS is a defined benefit plan providing service retirement and disability benefits to its members. Members are vested for service retirement benefits after accruing five years of service. Individuals who (a) are at least age 60 and have a minimum of five years of service, (b) have 30 years of service or (c) qualify for benefits under the Rule of 80 (service and age total at least 80) are entitled to a monthly benefit for life, which is calculated using a 1.61 percent benefit factor. Members qualifying for Rule of 80 or 30-and-out are entitled to an additional temporary 0.8 percent benefit multiplier until reaching minimum Social Security age (currently age 62). Actuarially age-reduced retirement benefits are available with five years of service at age 55. Members who are younger than age 55 and who do not qualify under the Rule of 80 but have between 25 and 29.9 years of service may retire with a lesser benefit factor. 50
54 Notes to Financial Statements Members that are three years beyond normal retirement can elect to have their lifetime monthly benefits actuarially reduced in exchange for the right to also receive a one-time partial lump sum (PLSO) payment at retirement equal to 12, 24 or 36 times the Single Life benefit amount. A Summary Plan Description detailing the provisions of the plan can be found on PSRS website at PSRS Benefits Provided. PSRS is a defined benefit plan providing retirement, disability and death/survivor benefits. Members are vested for service retirement benefits after accruing five years of service. Individuals who (a) are at least age 60 and have a minimum of 5 years of service, (b) have 30 years of service or (c) qualify for benefits under the Rule of 80 (service and age total at least 80) are entitled to a monthly benefit for life, which is calculated using a 2.5 percent benefit factor. Beginning July 1, 2001, and ending July 1, 2014, a 2.55 percent benefit factor is used to calculate benefits for members who have 31 or more years of service. Actuarially age-reduced benefits are available for members with five to 24.9 years of service at age 55. Members who are younger than age 55 and who do not qualify under the Rule of 80 but have between 25 and 29.9 years of service may retire with a lesser benefit factor. Members that are three years beyond normal retirement can elect to have their lifetime monthly benefits actuarially reduced in exchange for the right to also receive a one-time PLSO payment at retirement equal to 12, 24 or 36 times the Single Life benefit amount. A Summary Plan Description detailing the provisions of the plan can be found on PSRS website at Since the prior valuation date, the benefit provisions were amended to make permanent an early retirement benefit allowing members to retire at any age after 25 years of service. PEERS Cost-of-Living Adjustments (COLA). The PEERS Board has established a policy of providing a 0.00 percent COLA for years in which the CPI increases between 0.00 percent and 2.00 percent, a 2.00 percent COLA for years in which CPI increases between 2.00 percent and 5.00 percent, and a COLA of 5.00 percent if the CPI increase is greater than 5.00 percent. If the CPI decreases, no COLA is provided. For any member, such adjustments commence on the fourth January after commencement of benefits and occur annually thereafter. The total of such increases may not exceed 80 percent of the original benefit for any member. PSRS Cost-of-Living Adjustments (COLA). The PSRS Board has established a policy of providing a 0.00 percent COLA for years in which the CPI increases between 0.00 percent and 2.00 percent, a 2.00 percent COLA for years in which CPI increases between 2.00 percent and 5.00 percent, and a COLA of 5.00 percent if the CPI increase is greater than 5.00 percent. If the CPI decreases, no COLA is provided. For any member retiring on or after July 1, 2001, such adjustments commence on the second January after commencement of benefits and occur annually thereafter. The total of such increases may not exceed 80 percent of the original benefit for any member. PEERS Contributions. PEERS members were required to contribute 6.86 percent of their annual covered salary and employer cost of medical, dental and vision premiums during fiscal years 2018 and Employers were required to match the contributions made by employees. The contribution rate is set each year by the PSRS Board of Trustees upon the recommendation of the independent actuary within the contribution restrictions set in Section RSMo. The annual statutory increase in the total contribution rate may not exceed 0.5 percent of pay. 51
55 Notes to Financial Statements PSRS Contributions. PSRS members were required to contribute 14.5 percent of their annual covered salary and employer cost of medical, dental and vision premiums during fiscal years 2018 and Employers were required to match the contributions made by employees. The contribution rate is set each year by the PSRS Board of Trustees upon the recommendation of the independent actuary within the contribution restrictions set in Section RSMo. The annual statutory increase in the total contribution rate may not exceed 1 percent of pay. Contributions for employees of the State of Missouri were made by the state in accordance with the actuarially determined contribution rate needed to fund current costs and prior service costs of state employees as authorized in Section RSMo. Contributions. The College s contributions to PEERS were $2,097,934 and $2,040,287 and to PSRS were $4,377,884 and $4,242,915 for the years ended, respectively. Pension Liabilities, Pension Expense and Deferred Outflows of Resources and Deferred Inflows of Resources Related to Pensions. At, the College recorded a liability of $14,518,955 and $15,452,978 for PEERS and $46,217,761 and $47,129,070, respectively, for PSRS for its proportionate share of the net pension liability. The net pension liability for the plan in total was measured as of June 30, 2017 and 2016 and determined by an actuarial valuation as of that date. At, the College s proportionate share was percent and percent, respectively, for PSRS and percent and percent, respectively, for PEERS. For the years ended, the College recognized a pension expense of $2,389,737 and $2,501,093 for PEERS and $4,130,286 and $4,892,813 for PSRS, respectively, its proportionate share of the total pension expense. 52
56 Notes to Financial Statements At June 30, 2018, the College reported deferred outflows of resources and deferred inflows of resources from the following sources related to PEERS and PSRS pension benefits: Deferred Deferred Outflows of Inflows of Resources Resources Balance of deferred outflows and inflows due to: Differences between expected and actual experience - PEERS $ 231,503 $ 588,160 Differences between expected and actual experience - PSRS 2,745,258 2,942,781 Changes in assumptions - PEERS 2,499,604 - Changes in assumptions - PSRS 7,292,376 - Net difference between projected and actual earnings on pension plan investments - PEERS 312,394 - Net difference between projected and actual earnings on pension plan investments - PSRS 956,083 - Changes in proportion and differences between employer contributions and proportionate share of contributions - PEERS 65, ,155 Changes in proportion and differences between employer contributions and proportionate share of contributions - PSRS 708,207 2,775,406 Employer contributions subsequent to the measurement date - PEERS 2,075,850 - Employer contributions subsequent to the measurement date - PSRS 4,417,861 - Total $ 21,304,422 $ 6,794,502 53
57 Notes to Financial Statements At June 30, 2017, the College reported deferred outflows of resources and deferred inflows of resources from the following sources related to PEERS and PSRS pension benefits: Deferred Deferred Outflows of Inflows of Resources Resources Balance of deferred outflows and inflows due to: Differences between expected and actual experience - PEERS $ 447,302 $ 905,681 Differences between expected and actual experience - PSRS 3,390,915 3,600,952 Changes in assumptions - PEERS 920,380 - Changes in assumptions - PSRS 533,047 - Net difference between projected and actual earnings on pension plan investments - PEERS 3,522,582 - Net difference between projected and actual earnings on pension plan investments - PSRS 9,766,229 - Changes in proportion and differences between employer contributions and proportionate share of contributions - PEERS 124, ,921 Changes in proportion and differences between employer contributions and proportionate share of contributions - PSRS 494,186 3,935,979 Employer contributions subsequent to the measurement date - PEERS 2,097,934 - Employer contributions subsequent to the measurement date - PSRS 4,377,777 - Total $ 25,674,988 $ 9,293,533 54
58 Notes to Financial Statements Contributions subsequent to the measurement date of of $6,493,711 and $6,475,711, respectively, were reported as deferred outflows of resources related to pensions and will be recognized as a reduction to the net pension liability in the years ending June 30, 2019 and 2018, respectively. Other amounts reported as collective deferred (inflows)/outflows of resources are to be recognized in pension expense as follows: Year ending June $ 531, ,578, ,792, (1,370,971) ,285,808 Thereafter 199,128 $ 8,016,209 Actuarial Assumptions. Actuarial valuations of PEERS and PSRS involves estimates of the reported amount and assumptions about probability of occurrence of events far into the future. Examples include assumptions about future employment, mortality and future salary increases. Amounts determined regarding the total pension liability are subject to continual revision as actual results are compared with past expectations and new estimates are made about the future. The actuarial assumptions used in the June 30, 2017 and 2016 valuations were based on the results of an actuarial experience study for the period 2010 to 2015 for both PEERS and PSRS dated June
59 Notes to Financial Statements The total pension liability as of June 30, 2018 was determined based on an actuarial valuation prepared as of June 30, 2017 rolled forward one year, using the following actuarial assumptions: Expected Return on Investments 7.60%, net of investment expenses and including 2.25% inflation. Inflation 2.25% Total Payroll Growth PEERS: 3.25% per annum, consisting of 2.25% inflation, 0.50% additional inflation due to the inclusion of health care costs in pension earnings and 0.50% of real wage growth. PSRS: 2.75% per annum, consisting of 2.25% inflation, 0.25% additional inflation due to the inclusion of health care costs in pension earnings and 0.25% of real wage growth. Future Salary Increases PEERS: 4.00% %, depending on service and including 2.25% inflation, 0.5% additional inflation due to the inclusion of health care costs in pension earnings and 0.5% of real wage growth. PSRS: 3.00% %, depending on service and including 2.25% inflation, 0.25% additional inflation due to the inclusion of health care costs in pension earnings and 0.25% of real wage growth. Cost-of-Living Increases The annual cost-of-living adjustment (COLA) assumed in the valuation increases from 1.20% to 1.65% over nine years, beginning January 1, The COLA reflected for January 1, 2018 is 1.63%, in accordance with the actual COLA approved by the Board. This COLA assumption reflects an assumption that general inflation will increase from 1.80% to a normative inflation assumption of 2.25% over nine years. It is also based on the current policy of the Board to grant a COLA on each January 1 as follows: If the June to June change in the CPI-U is less than 2% for consecutive one year periods, a cost-of-living increase of 2% will be granted when the cumulative increase is equal to or greater than 2%, at which point the cumulative increase in the CPI-U will be reset to zero. For the following year, the starting CPI-U will be based on the June value immediately preceding the January 1 at which the 2% cost-of-living increase is granted. If the June to June change in the CPI-U is greater than or equal to 2%, but less than 5%, a cost-of-living increase of 2% will be granted. If the June to June change in the CPI-U is greater than or equal to 5%, a cost-of-living increase of 5% will be granted. If the CPI decreases, no COLA is provided. The COLA applies to service retirements and beneficiary annuities. The COLA does not apply to the benefits for in-service death payable to spouses (where the spouse is over 60), and does not apply to the spouse with children pre-retirement death benefit, the dependent children pre-retirement death benefit, or the dependent parent death benefit. The total lifetime COLA cannot exceed 80% of the original benefit. PSRS members receive a COLA on the second January after retirement, while PEERS members receive a COLA on the fourth January after retirement. 56
60 Notes to Financial Statements Mortality Assumption Actives: Non-Disabled Retirees, Beneficiaries and Survivors: Disabled Retirees: Changes in Actuarial Assumptions and Methods Fiduciary Net Position Long-term Expected Rate of Return PEERS: RP 2006 Total Dataset Employee Mortality Table, multiplied by an adjustment factor of.75 at all ages for both males and females, with static projection using the 2014 SSA Improvement Scale to PSRS: RP 2006 White Collar Employee Mortality Table, multiplied by an adjustment factor of.75 at all ages for both males and females, with static projection using the 2014 SSA Improvement Scale to PEERS: RP 2006 Total Dataset Employee Mortality Tables with plan-specific experience adjustments and static projection to 2028 using the 2014 SSA Improvement Scale. PSRS: RP 2006 White Collar Mortality Tables with plan-specific experience adjustments and static projection to 2028 using the 2014 SSA Improvement Scale. RP 2006 Disabled Retiree Mortality Tables with static projection to 2028 using the 2014 SSA Improvement Scale. PEERS and PSRS: The Board adopted a new COLA policy during fiscal 2017 resulting in a change in the future COLA assumption from an increasing assumption of 1.00%-1.50% over nine years to an increasing assumption of 1.20%-1.65% over nine years, beginning January 1, The investment return assumption was lowered from 7.75% to 7.60% per year. PEERS and PSRS issue a publicly available financial report that can be obtained at The long-term expected rate of return on PEERS and PSRS investments was determined using a building-block method in which best-estimate ranges of expected future real rates of returns (expected returns, net of investment expense and inflation) are developed for each major asset class. These ranges are combined to produce the long-term expected rate of return by weighting the expected future real rates of return by the target asset allocation percentage and by adding expected inflation. Best estimates of arithmetic real rates of return for each major asset class included in PEERS and PSRS target allocations as of June 30, 2017 are summarized below. Target Asset Long-term Expected Real Asset Class Allocation Rate of Return U.S. public equity 27.0% 5.16% Public credit 7.0% 2.17% Hedged assets 6.0% 4.42% Non-U.S public equity 15.0% 6.01% U.S. Treasuries 16.0% 0.96% U.S. TIPS 4.0% 0.80% Private credit 4.0% 5.60% Private equity 12.0% 9.86% Private real estate 9.0% 3.56% Total 100% 57
61 Notes to Financial Statements The total pension liability as of June 30, 2017 was determined based on an actuarial valuation prepared as of June 30, 2016 rolled forward one year, using the following actuarial assumptions: Expected Return on Investments 7.75%, net of investment expenses and including 2.25% inflation. Inflation 2.25% Total Payroll Growth PEERS: 3.25% per annum, consisting of 2.25% inflation, 0.50% additional inflation due to the inclusion of health care costs in pension earnings and 0.50% of real wage growth. PSRS: 2.75% per annum, consisting of 2.25% inflation, 0.25% additional inflation due to the inclusion of health care costs in pension earnings and 0.25% of real wage growth. Future Salary Increases PEERS: 4.00% %, depending on service and including 2.25% inflation, 0.5% additional inflation due to the inclusion of health care costs in pension earnings and 0.5% of real wage growth. PSRS: 3.00% %, depending on service and including 2.25% inflation, 0.25% additional inflation due to the inclusion of health care costs in pension earnings and 0.25% of real wage growth. Cost-of-Living Increases The long-term cost-of-living adjustment (COLA) assumed in the valuation is 1.50% per year, based on the current policy of the Board to grant a 0.00% COLA when annual inflation, as measured by the CPI-U index for a fiscal year, increases between 0.00% and 2.00% and to grant 2.00% when the increase is between 2.00% and 5.00%. The actuarial assumption increases from 1.00% to 1.50% over ten years (from fiscal year 2017 to fiscal year 2027). The COLA applies to service retirements and beneficiary annuities. The COLA does not apply to the benefits for in-service death payable to spouses (where the spouse is over 60), and does not apply to the spouse with children pre-retirement death benefit, the dependent children pre-retirement death benefit, or the dependent parent death benefit. The total lifetime COLA cannot exceed 80% of the original benefit. PSRS members receive a COLA on the second January after retirement, while PEERS members receive a COLA on the fourth January after retirement. Mortality Assumption Actives: PEERS: RP 2006 Total Dataset Employee Mortality Table, multiplied by an adjustment factor of.75 at all ages for both males and females, with static projection using the 2014 SSA Improvement Scale to PSRS: RP 2006 White Collar Employee Mortality Table, multiplied by an adjustment factor of.75 at all ages for both males and females, with static projection using the 2014 SSA Improvement Scale to Non-Disabled Retirees, Beneficiaries and Survivors: PEERS: RP 2006 Total Dataset Employee Mortality Tables with plan-specific Improvement Scale. PSRS: RP 2006 White Collar Mortality Tables with plan-specific experience adjustments and static projection to 2028 using the 2014 SSA Improvement Scale. 58
62 Notes to Financial Statements Disabled Retirees: Changes in Actuarial Assumptions and Methods Fiduciary Net Position Long-term Expected Rate of Return RP 2006 Disabled Retiree Mortality Tables with static projection to 2028 using the 2014 SSA Improvement Scale. PEERS and PSRS: The inflation assumption decreased from 2.50% to 2.25% per year. The Board adopted a new COLA policy during fiscal 2016 resulting in a decrease in the future COLA assumption from 2.00% per year to a variable, increasing assumption of 1.00%-1.50% over ten years beginning January 1, PEERS: The payroll growth assumption decreased from 3.75% to 3.25% per year. The future salary increase assumption decreased from 5.00%-12.00%, depending on service to 4.00%-11.00%, depending on service. The investment return assumption decreased from 8.00% to 7.75% per year. The active mortality assumption changed from the RP 2000 Mortality Table set back one year for males and six years for females, then projected to 2016 using Scale AA to 75% of the RP 2006 Total Dataset Mortality Tables with static projection to 2028 using the 2014 SSA Improvement Scale. The non-disabled retiree mortality assumption changed from the RP 2000 Mortality Table set forward one year for males and no set back/forward for females, then projected to 2016 using Scale AA to the RP-2006 Total Dataset Mortality Tables with plan-specific experience adjustments and static projection to 2028 using the 2014 SSA Improvement Scale. The disabled retiree mortality assumption changed from the RP 2000 Disabled Retiree Mortality Table to the RP-2006 Disabled Retiree Mortality Tables with static projection to 2028 using the 2014 SSSA Improvement Scale. PSRS: The payroll growth assumption decreased from 3.50% to 2.75% per year. The future salary increase assumption decreased from 4.00%-10.00%, depending on service to 3.00%-9.50%, depending on service. The investment return assumption decreased from 8.00% to 7.75% per year. The active mortality assumption changed from the RP 2000 Mortality Table set back one year for males and six years for females, then projected to 2016 using Scale AA to 75% of the RP 2006 White Collar Mortality Tables with static projection to 2028 using the 2014 SSA Improvement Scale. The non-disabled retiree mortality assumption changed from the RP 2000 Mortality Table set back one year for both males and females, then projected to 2016 using Scale AA to the RP-2006 White Collar Mortality Tables with plan-specific experience adjustments and static projection to 2028 using the 2014 SSA Improvement Scale. The disabled retiree mortality assumption changed from the RP 2000 Disabled Retiree Mortality Table to the RP-2006 Disabled Retiree Mortality Tables with static projection to 2028 using the 2014 SSSA Improvement Scale. PEERS and PSRS issue a publicly available financial report that can be obtained at The long-term expected rate of return on PEERS and PSRS investments was determined using a building-block method in which best-estimate ranges of expected future real rates of returns (expected returns, net of investment expense and inflation) are developed for each major asset class. These ranges are combined to produce the long-term expected rate of return by weighting the expected future real rates of return by the target asset allocation percentage and by adding expected inflation. Best estimates of arithmetic real rates of return for each major asset class included in PEERS and PSRS target allocations as of June 30, 2016 are summarized below. 59
63 Notes to Financial Statements Target Asset Long-term Expected Real Asset Class Allocation Rate of Return U.S. public equity 27.0% 5.16% Public credit 7.0% 2.17% Hedged assets 6.0% 4.42% Non-U.S public equity 15.0% 6.01% U.S. Treasuries 16.0% 0.96% U.S. TIPS 4.0% 0.80% Private credit 4.0% 5.60% Private equity 12.0% 9.86% Private real estate 9.0% 3.56% Total 100% Discount Rate The discount rate used to measure the total pension liability was 7.60 percent and 7.75 percent as of June 30, 2017 and 2016, respectively, and is consistent with the long-term expected geometric return on plan investments. The actuarial assumed rate or return was 8.0 percent from 1980 through fiscal year The Board of Trustees adopted a new actuarial assumed rate of return on 7.75 percent based on the actuarial experience studies and asset-liability study conducted during the 2016 fiscal year. The Board of Trustees further reduced the assumed rate of return to 7.60 percent effective with the June 30, 2017 valuation. The projection of cash flows used to determine the discount rate assumed that employer contributions would be made at the actuarially calculated rate computed in accordance with assumptions and methods stated in the funding policy adopted by the Board of Trustees, which requires payment of the normal cost and amortization of the unfunded actuarially accrued liability in level percent of employee payroll installments over 30 years utilizing a closed period, layered approach. Based on this assumption, the pension plan s fiduciary net position was projected to be available to make all projected future benefit payments of current plan members. Sensitivity of the College s Proportionate Share of the Net Pension Liability to Changes in the Discount Rate The sensitivity of the district s net pension liability to changes in the discount rate is presented below. The district s net pension liability calculated using the discount rate of 7.60 percent is presented as well as the net pension liability using a discount rate that is 1.0 percent lower (6.60 percent) or 1.0 percent higher (8.60 percent) than the current rate. The College s net pension liability calculated using the discount rate of 7.75 percent is presented as well as the net pension liability using a discount rate that is 1.00 percent lower (6.75 percent) or 1.00 higher (8.75 percent) than the current rate as of June 30,
64 Notes to Financial Statements Proportionate Share of the Net Pension Liability 1% Decrease Current Rate 1% Increase As of June 30, 2018: (6.60%) (7.60%) (8.60%) PEERS $ 26,745,722 $ 14,518,955 $ 4,263,254 PSRS 82,085,306 46,217,761 16,398,809 As of June 30, 2017: (6.75%) (7.75%) (8.75%) PEERS $ 26,873,269 $ 15,452,978 $ 5,868,543 PSRS 79,952,515 47,129,070 19,798,564 The plans are multiemployer defined benefit plans. Both systems issue a publicly available financial report that includes financial statements and required supplementary information. That report may be obtained by writing to either system at: P.O. Box 268, Jefferson City, Missouri or by calling Note 7: Missouri United School Insurance Council The Missouri United School Insurance Council (MUSIC) is a not-for-profit self-insurance association, which is designed to provide uniform property and casualty coverage under one comprehensive plan for participating school districts in Missouri. The College purchases insurance coverage for property, general liability, workers compensation and medical malpractice (for allied health students). Members pay annual premiums, which are retained to pay losses, fund an administrative budget, buy risk management services and purchase reinsurance for excessive losses. Because MUSIC is a pooling arrangement comprised of member districts, the members are owners of the loss fund. In the event that the loss fund and related reserves are unable to cover claims, the members would be assessed additional premiums by MUSIC to cover the deficit. The College is not aware of any deficit situation in the MUSIC loss fund, which would require the accrual of a liability as of. Effective January 1, 1999, the terms of insurance coverage provided by MUSIC were revised, with the College increasing the level of its self-insurance for losses occurring below the amount of the MUSIC coverage stop-loss, which was $356,517 and $342,770 for calendar years 2018 and 2017, respectively. As of, an accrual of $340,468 and $340,250, respectively, has been made to cover the estimated exposure to claims the College would have to pay under its self-insurance agreement, including an estimate for claims incurred but not reported. This claims liability is based on estimates of the ultimate cost of claims including inflation factors and historical trend data. Other non-incremental costs are not included in the basis of estimating the liability. 61
65 Notes to Financial Statements Note 8: Designations of Unrestricted Net Positions Unrestricted net position is designated for specific purposes by action of the Board or management. Designations for the use of unrestricted net position as of are as follows: Designated for deferred maintenance $ 2,615,769 $ 4,610,448 Designated for information technology 1,070,079 1,040,917 Unrestricted 42,879,435 44,564,659 Total $ 46,565,283 $ 50,216,024 Note 9: Defined Contribution Plan The College has a 403(b) defined contribution retirement plan covering all employees except for employees regularly attending classes at the College. The College matches contributions percent per dollar, with an annual maximum limit of $1,000. The participant is fully vested in amounts attributable to the plan contributions when such plan contributions are made. The College s expense under the plan was approximately $537,000 and $453,000 for the years ended, respectively. Note 10: Federal Assistance The College has received significant financial assistance from various federal agencies in the form of grants and entitlements. These programs are subject to audit by agents of the granting authority, or by independent public accountants under the Single Audit Act, the purpose of which is to ensure compliance with terms and conditions specified in these agreements. The College does not believe that liabilities for reimbursement, if any, will have a materially adverse effect upon the financial condition of the College. Note 11: Contingencies The College is named as a defendant in various legal actions arising in the normal course of operations. The College s management believes the resolution of those actions will not have a material effect on the College s financial statements. 62
66 Notes to Financial Statements Note 12: Governmental Accounting Standards Board (GASB) Statements The College adopted the following statements during the year ended June 30, 2018: GASB Statement No. 75, Accounting and Financial Reporting for Postemployment Benefits Other Than Pensions, issued June 2015, applies to governments that provide OPEB to their employees or finance OPEB for employees of other governments. It replaces GASB Statement No. 45 and requires governments to report a liability on the face of their financial statements for the OPEB provided. In addition, it requires governments in all types of OPEB plans to provide more extensive note disclosures and RSI about OPEB liabilities. The provisions of Statement No. 75 are effective for fiscal years beginning after June 15, 2017 (College s June 30, 2018 fiscal year). See Note 1 and Note 5 for effect of this Statement to the College. As of June 30, 2018, the GASB has issued statements that will require consideration and implementation by the College as follows: In June 2017, GASB issued GASB Statement No. 87, Leases, which establishes a uniform approach to accounting for and reporting leases based on the principle that all leases are, in substance, financings. The provisions of Statement No. 87 are effective for fiscal years beginning after December 15, 2019 (College s June 30, 2019 fiscal year). The effect of this Statement to the College has not yet been determined. Note 13: Disclosure About Fair Value of Assets Fair value is the price that would be received to sell an asset or paid to transfer a liability in an orderly transaction between market participants at the measurement date. Fair value measurements must maximize the use of observable inputs and minimize the use of unobservable inputs. There is a hierarchy of three levels of inputs that may be used to measure fair value: Level 1 Level 2 Level 3 Quoted prices in active markets for identical assets or liabilities Observable inputs other than Level 1 prices, such as quoted prices for similar assets or liabilities; quoted prices in markets that are not active; or other inputs that are observable or can be corroborated by observable market data for substantially the full term of the assets or liabilities Unobservable inputs supported by little or no market activity and are significant to the fair value of the assets or liabilities 63
67 Notes to Financial Statements Recurring Measurements The following table presents the fair value measurements of assets recognized in the accompanying financial statements measured at fair value on a recurring basis and the level within the fair value hierarchy in which the fair value measurements fall at : 2018 Description Total Level 1 Level 2 Level Money market mutual funds $ 5,004,518 $ 5,004,518 $ - $ - Total investments measured at fair value $ 5,004,518 $ 5,004,518 $ - $ Description Total Level 1 Level 2 Level Federal Home Loan Bank $ 8,985,590 $ - $ 8,985,590 $ - Federal National Mortgage Association 15,969,500-15,969,500 - Money market mutual funds 4,961,412 4,961, Total investments measured at fair value $ 29,916,502 $ 4,961,412 $ 24,955,090 $ - Federal Home Loan Bank and Federal National Mortgage Association securities classified as Level 2 of the fair value hierarchy are valued using third-party pricing services based on market observable information such as market quotes for similar assets, as well as normal market pricing considerations such as duration, interest rates and prepayment assumptions. 64
68 Notes to Financial Statements Note 14: Tax Abatements For the fiscal year ended June 30, 2018, the College s property tax revenue was reduced through abatements and diversions through various incentive granting agencies and entities with an impact to the College totaling an estimated $3,743,944 under the following programs: Tax Abatement Program Amount of Taxes Abated during the Fiscal Year Tax Increment Financing $ 1,426,659 Chapter 353 Abatement 403,276 Chapter 99 Abatement 33,118 EEZ 21,550 Multi-Abatement 1,859,341 $ 3,743,944 The College is subject to tax abatements and diversions granted or entered into by other government entities through various incentive granting agencies and entities as outlined below: Tax Increment Financing Grants tax diversion to promote new investment, infrastructure improvements and job growth by providing financial assistance and incentive to redevelopers. Created pursuant to Section of the Revised Statutes of Missouri. Chapter 353 Tax Abatement Grants tax abatement to encourage investment and assist in the removal of blight and blighting conditions within urban redevelopment areas. Created pursuant to Sections to RSMo and City Ordinance Chapter 99 Tax Abatement Grants abatement through several programs to encourage investment and assist in redevelopment of designated real property resulting in real property tax abatement for certain projects. Created pursuant to Section 99 of the Revised Statutes of Missouri. EEZ Grants property tax abatement to encourage job creation and investment by providing tax credits and property tax abatement to new or expanding businesses located in an Enhance Enterprise Zone (EEZ). Created pursuant to Sections to RSMo and City Ordinances , and
69 Notes to Financial Statements Note 15: Foundation The following disclosures pertain to the discretely presented component unit. Significant Accounting Policies Use of Estimates The preparation of financial statements in conformity with accounting principles generally accepted in the United States of America requires management to make estimates and assumptions that affect the reported amounts in the financial statements and accompanying notes. Although these estimates are based on management s knowledge of current events and actions it may undertake in the future, they may ultimately differ from actual results. Cash and Cash Equivalents The Foundation considers all liquid investments with original maturities of three months or less to be cash equivalents. At, cash equivalents consisted primarily of investments in money market mutual funds. At June 30, 2018, the Foundation s cash accounts did not exceed federally insured limits. Marketable Securities and Investment Return Investments in equity securities having a readily determinable fair value and in all debt securities are carried at fair value. Investment return includes dividend, interest and other investment income; realized and unrealized gains and losses on investments carried at fair value; and realized gains and losses on other investments. Investment income and net investment gains (losses) are reported as follows: As increases (decreases) in permanently restricted net assets, if the terms of the gift or the Foundation s interpretation of relevant state tax law requires that they be added to the principal of the permanent endowment fund. As increases (decreases) in temporarily restricted net assets if the terms of the gift impose restrictions on the use of the income. As increases (decreases) in unrestricted net assets in all other cases. The Foundation maintains pooled investment accounts for its endowments. Investment income and realized and unrealized gains and losses from securities in the pooled investment accounts are allocated annually to the individual endowments based on the relationship of the fair value of the interest of each endowment to the total fair value of the pooled investments accounts, as adjusted for additions to or deductions from those accounts. Investment return includes interest income, which is accrued as earned, and dividend income, which is recorded when notified of the dividend. Realized gains and losses are recorded when notified of the sale. The change in unrealized appreciation or depreciation, which occurs during the year, is recorded as a component of investment return in the statements of activities. 66
70 Notes to Financial Statements Net Assets The accounting and reporting of the Foundation classifies resources by their nature and purpose, based on the presence or absence of donor-imposed restrictions, into three classes of net assets: Unrestricted net assets Consist of funds free of any donor-imposed restriction. Temporarily restricted net assets Consist of contributions and other inflows of funds temporarily subject to donor imposed restrictions. The restrictions are temporary in that they are expected to expire with the passage of time or be satisfied and removed by actions of the Foundation that fulfill donor stipulations. Permanently restricted net assets Consist of contributions and other inflows of funds subject to donor imposed restrictions that neither expire by the passage of time nor can be fulfilled or otherwise removed by actions of the Foundation. Contributions A contribution, in the form of an unconditional promise to give, is recognized as revenue by the Foundation in the period in which the promise is received. Conditional promises to give made by donors are not recognized until the conditions are met. Assets received subject to conditions are accounted for as refundable advances until the conditions are met. Contributions are recorded at their fair value. Unconditional promises to give are reported at net realizable value by establishing an allowance for uncollectible promises. Unconditional promises to give cash over a period of time in excess of one year are recorded at the present value of amounts to be received, using an appropriate discount rate, if the amounts of such discounts are material. Revenue is reported as increases in unrestricted net assets unless use of the related assets is limited by donor-imposed restrictions. Expenses are reported as decreases in unrestricted net assets. Gains and losses on investments and other assets or liabilities are reported as increases or decreases in unrestricted net assets unless their use is restricted by explicit donor stipulation or by law. Gains and losses on temporarily restricted assets are reported as restricted until appropriated by the Board of Directors. Expirations of temporary restrictions on net assets (i.e., the donor-stipulated purpose has been fulfilled and/or the stipulated period has elapsed) are reported as reclassifications between the applicable classes of net assets. Contributed Services The College provides the Foundation with office space and furniture and equipment without charge. The Executive Director and staff of the Foundation are employed by the College without compensation from the Foundation and the Financial Services Department of the College also provides accounting processing services to the Foundation. In connection with the personnel and services provided by the College, the Foundation recognized contributed services revenue and related offsetting expense in the amount of $490,536 and $373,903 for the years ended June 30, 2018 and 2017, respectively. Included in these amounts are payments to outside vendors/contractors for advisory services and other expenses supporting the Foundation. 67
71 Notes to Financial Statements No amounts have been reflected in the financial statements for donated services, which do not create or enhance nonfinancial assets or which do not require specialized skills; however, time and resources have been contributed by volunteers in furtherance of the Foundation s objectives. Substantially all program expenses included in the statements of activities are reimbursed to the College as the result of College payments on behalf of the Foundation. Accordingly, the balances Due to on the statements of financial position of $616,068 and $25,070 at, respectively, represents amounts due to the College not yet reimbursed at year-end. Income Taxes The Foundation is exempt from income taxes under Section 501 of the Internal Revenue Code and a similar provision of state law. However, the Foundation is subject to federal income tax on any unrelated business taxable income. The Foundation files tax returns in the U.S. federal jurisdiction. Subsequent Events Subsequent events have been evaluated through November 14, 2018, which is the date the financial statements were available to be issued. 68
72 Notes to Financial Statements Marketable Securities and Investment Return Investments at consisted of the following: Equity securities $ 796,559 $ 462,281 Equity mutual funds 1,684,873 1,435,400 U.S. Treasury notes 892,489 - Corporate bonds 1,473,298 - Fixed income mutual funds DoubleLine Total Return Bond Fund - 912,913 Other fixed income mutual funds 96,695 1,405,414 Hedge fund/reit - 9,367 Exchange traded funds (ETF) Vanguard Growth ETF 1,348,290 1,143,360 Vanguard S&P 500 ETF 810, ,695 Vanguard Small-Cap ETF 924, ,920 Vanguard FTSE Developed Markets ETF 1,718,574 1,655,279 Vanguard Value ETF 622, ,920 Vanguard Mid-Cap ETF 1,174,418 1,061,774 ishares 1-3 Year Credit Bond ETF - 685,568 Other ETFs 556,068 1,241,495 Municipal bonds 493,851 - $ 12,593,683 $ 12,086,386 The Foundation s temporarily and permanently restricted net assets include various endowment funds established by donors. At, the fair value of the assets were not less than the level required by donor stipulation or law. Total investment return is comprised of the following: Interest and dividend income $ 231,357 $ 216,536 Net realized and unrealized gains 736,216 1,001,160 $ 967,573 $ 1,217,696 69
73 Notes to Financial Statements Investment return is net of investment fees reported in the statements of activities, which were $57,855 and $45,895 for the years ended, respectively. Contributions Receivable Contributions receivable at consisted of the following unconditional promises to give discounted using the discount rate for the year the receivable was originally pledged at 2.70 percent: Due within one year $ 53,301 $ 330,000 Due in one to five years 25,000 50,000 Less 78, ,000 Allowance for uncollectible contributions 1,527 7,486 Unamortized discount 2,699 12,837 $ 74,075 $ 359,677 70
74 Notes to Financial Statements Temporarily Restricted Net Assets Temporarily restricted net assets at were available for the following purposes: Investment earnings payout stabilization fund $ 1,553,401 $ 1,287,181 Scholarships 901,632 1,006,885 Neeland J & A Student Assistance 341, ,701 Other 280, ,453 MCC-BR Cyber Security 100, ,000 Kite Festival 73,034 65,307 Block Academic Coaching 67,071 95,427 Polsky Business Development Fund 67,678 67,127 James Neeland Award Fund 67,030 56,761 Hall Young Dev Curriculum 55,275 55,275 Book & Student Emergency Fund 44,880 47,521 Visual Arts & IT Building 32,498 23,542 Burns & McDonald Design Lab 30,092 - KC Construction Careers Academy 26,204 - Foundation Alumni 17,357 16,611 Hammonds Family Fund 14,688 - Student Success Center 8, ,885 Baseball Program 6,819 6,759 Nursing Loan Program 5,039 4,753 Brooks Center at PV 3,289 3,649 Friends of the Carter Arts Center 2,866 4,545 Longview Cultural Arts Center 177 8,177 Health Science Institute Program - 6,664 $ 3,698,589 $ 4,356,223 71
75 Notes to Financial Statements Permanently Restricted Net Assets Permanently restricted net assets as of are restricted to: Scholarships $ 3,380,429 $ 3,380,429 Other 1,821,558 1,795,292 $ 5,201,987 $ 5,175,721 Net Assets Released from Restrictions Net assets were released from donor restrictions by incurring expenses satisfying the restricted purposes or by occurrence of other events specified by donors Scholarships and grants $ 461,157 $ 334,777 Student Success Center 950,166 - Book & Student Emergency Fund 5,214 - FI-Hall-Youth Dev Curric - 20,401 Other Foundation Projects 134,595 70,329 Storytelling 28,301 24,952 Brooks Center at PV - 21,908 Longview Automotive Program 7,519 7,519 Kite Festival 7,473 7,387 $ 1,594,425 $ 487,273 Endowment The Foundation s endowment consists of numerous individual funds established for a variety of purposes. The endowment includes both donor-restricted endowment funds and funds designated by the governing body to function as endowments (board-designated endowment funds). As required by accounting principles generally accepted in the United States of America (GAAP), net assets associated with endowment funds, including board-designated endowment funds, are classified and reported based on the existence or absence of donor-imposed restrictions. 72
76 Notes to Financial Statements The Foundation s governing body has interpreted the Uniform Prudent Management of Institutional Funds Act (UPMIFA) adopted by the State of Missouri as requiring preservation of the fair value of the original gift as of the gift date of the donor-restricted endowment funds absent explicit donor stipulations to the contrary. As a result of this interpretation, the Foundation classifies as permanently restricted net assets (a) the original value of gifts donated to the permanent endowment, (b) the original value of subsequent gifts to the permanent endowment and (c) accumulations to the permanent endowment made in accordance with the direction of the applicable donor gift instrument at the time the accumulation is added to the fund. The remaining portion of donor-restricted endowment funds is classified as temporarily restricted net assets until those amounts are appropriated for expenditure by the Foundation in a manner consistent with the standard of prudence prescribed by UPMIFA. In accordance with UPMIFA, the Foundation considers the following factors in making a determination to appropriate or accumulate donor-restricted endowment funds: 1. Duration and preservation of the fund 2. Purposes of the Foundation and the fund 3. General economic conditions 4. Possible effect of inflation and deflation 5. Expected total return from investment income and appreciation or depreciation of investments 6. Other resources of the Foundation 7. Investment policies of the Foundation The composition of net assets by type of endowment fund at was: Temporarily Permanently Unrestricted Restricted Restricted Total June 30, 2018 Donor-restricted $ - $ 2,708,637 $ 5,201,987 $ 7,910,624 Board-designated 280, ,802 Total endowment funds $ 280,802 $ 2,708,637 $ 5,201,987 $ 8,191,426 June 30, 2017 Donor-restricted $ - $ 2,417,126 $ 5,175,721 $ 7,592,847 Board-designated 247, ,500 Total endowment funds $ 247,500 $ 2,417,126 $ 5,175,721 $ 7,840,347 73
77 Notes to Financial Statements Changes in endowment net assets for the years ended were: Temporarily Permanently Unrestricted Restricted Restricted Total Endowment net assets, June 30, 2016 $ 241,269 $ 1,863,208 $ 5,093,570 $ 7,198,047 Investment return Investment income 7, , ,721 Net appreciation 18, , ,933 Total investment return 26, , ,654 Contributions ,380 80,380 Other income - - 1,771 1,771 Appropriation of endowment assets for expenditures (19,773) (193,732) - (213,505) Endowment net assets, June 30, ,500 2,417,126 5,175,721 7,840,347 Investment return Investment income 7, , ,991 Net appreciation 13, , ,545 Total investment return 20, , ,536 Contributions 46,925-26,266 73,191 Appropriation of endowment assets for expenditures (34,092) (295,556) - (329,648) Endowment net assets, June 30, 2018 $ 280,802 $ 2,708,637 $ 5,201,987 $ 8,191,426 From time to time, the fair value of assets associated with individual donor-restricted endowment funds may fall below the level the Foundation is required to retain as a fund of perpetual duration pursuant to donor stipulation or UPMIFA. In accordance with GAAP, there were no deficiencies of this nature reported at. The Foundation has adopted investment and spending policies for its endowment fund. The objective of these policies is to provide the Foundation a predictable funding stream for its programs while protecting the purchasing power of the endowment fund. In accordance with the Foundation s investment policy, the endowment fund shall be invested to provide for total return. Endowment assets include those assets of donor-restricted endowment funds the Foundation must hold in perpetuity or for donor-specified periods, as well as those of board-designated endowment funds. Under the Foundation s policies, the endowment fund shall be invested in a diversified portfolio, consisting of common stocks, bonds, cash equivalents and other investments, which may reflect 74
78 Notes to Financial Statements varying rates of returns. The overall rate of return objective of the portfolio is a reasonable real rate, consistent with the risk levels established by the Endowment and Investment Committee of the Board of Directors. The Foundation recognizes the need for spendable income by the beneficiaries of the endowment and long-term institutional funds under their custodianship. The spending policy reflects an objective to distribute as much total return as is consistent with overall investment objectives defined above while protecting the real value of the endowment fund principal. The Board approved spending percentage, based on the average collected fund balance, was 5 percent for the fiscal years ended June 30, 2018 and Disclosures About Fair Value of Assets and Liabilities Fair value is the price that would be received to sell an asset or paid to transfer a liability in an orderly transaction between market participants at the measurement date. Fair value measurements must maximize the use of observable inputs and minimize the use of unobservable inputs. There is a hierarchy of three levels of inputs that may be used to measure fair value: Level 1 Level 2 Level 3 Quoted prices in active markets for identical assets or liabilities Observable inputs other than Level 1 prices, such as quoted prices for similar assets or liabilities; quoted prices in markets that are not active; or other inputs that are observable or can be corroborated by observable market data for substantially the full term of the assets or liabilities Unobservable inputs supported by little or no market activity and are significant to the fair value of the assets or liabilities 75
79 Notes to Financial Statements Recurring Measurements The following tables present the fair value measurements of assets and liabilities recognized in the accompanying statements of financial position measured at fair value on a recurring basis and the level within the fair value hierarchy in which the fair value measurements fall at June 30, 2018 and 2017: Fair Value Measurements Using Quoted Prices in Active Significant Markets for Other Significant Identical Observable Unobservable Assets Inputs Inputs Fair Value (Level 1) (Level 2) (Level 3) June 30, 2018 Equity securities $ 796,559 $ 796,559 $ - $ - Equity mutual funds 1,684,873 1,684, U.S. Treasury notes 892, , Corporate bonds 1,473,298-1,473,298 - Fixed income mutual funds 96,695 96, Exchange traded funds (ETF) Vanguard Growth ETF 1,348,290 1,348, Vanguard S&P 500 ETF 810, , Vanguard Small-Cap ETF 924, , Vanguard FTSE Developed Markets ETF 1,718,574 1,718, Vanguard Value ETF 622, , Vanguard Mid-Cap ETF 1,174,418 1,174, Other ETFs 556, , Municipal bonds 493, ,851 - $12,593,683 $ 10,626,534 $ 1,967,149 $ - 76
80 Notes to Financial Statements Fair Value Measurements Using Quoted Prices in Active Significant Markets for Other Significant Identical Observable Unobservable Assets Inputs Inputs Fair Value (Level 1) (Level 2) (Level 3) June 30, 2017 Equity securities $ 462,281 $ 462,281 $ - $ - Equity mutual funds 1,435,400 1,435, Fixed income mutual funds DoubleLine Total Return Bond Fund 912, , Other fixed income mutual funds 1,405,414 1,405, Hedge fund/reit 9,367 9, Exchange traded funds (ETF) Vanguard Growth ETF 1,143,360 1,143, Vanguard S&P 500 ETF 721, , Vanguard Small-Cap ETF 675, , Vanguard FTSE Developed Markets ETF 1,655,279 1,655, Vanguard Value ETF 675, , Vanguard Mid-Cap ETF 1,061,774 1,061, ishares 1-3 Year Credit Bond ETF 685, , Other ETFs 1,241,495 1,241, $12,086,386 $ 12,086,386 $ - $ - Following is a description of the valuation methodologies and inputs used for assets and liabilities measured at fair value on a recurring basis and recognized in the accompanying statements of financial position, as well as the general classification of such assets and liabilities pursuant to the valuation hierarchy. There have been no significant changes in the valuation techniques during the years ended. Investments Where quoted market prices are available in an active market, securities are classified within Level 1 of the valuation hierarchy. If quoted market prices are not available, then fair values are estimated by using quoted prices of securities with similar characteristics or independent asset pricing services and pricing models, the inputs of which are market-based or independently sourced market parameters, including, but not limited to, yield curves, interest rates, volatilities, prepayments, defaults, cumulative loss projections and cash flows. Such securities are classified in Level 2 of the valuation hierarchy. 77
81 Notes to Financial Statements Note 16: Condensed Combining Information Condensed combining information for the College as of and for the fiscal year ended June 30 is as follows: 2018 Building District Corporation Eliminations Total Condensed Statements of Net Position Assets Current assets $ 80,815,153 $ 1,182,055 $ - $ 81,997,208 Noncurrent assets 74,252,374 79,622, ,874,393 Total assets 155,067,527 80,804, ,871,601 Deferred outflows 21,564,050 2,587,341-24,151,391 Liabilities Current liabilities 14,007,565 5,004,518-19,012,083 Noncurrent liabilities 71,865,942 49,145, ,010,942 Total liabilities 85,873,507 54,149, ,023,025 Deferred inflows 7,377, ,377,898 Net position Net investment in capital assets 37,242,426 28,814,360-66,056,786 Unrestricted 46,137, ,537-46,565,283 Total net position $ 83,380,172 $ 29,241,897 $ - $ 112,622, Building District Corporation Eliminations Total Condensed Statements of Revenues, Expenses and Changes in Net Position Operating revenues (expenses) Operating revenues $ 46,178,043 $ - $ - $ 46,178,043 Depreciation expense (2,599,489) (3,959,559) - (6,559,048) Other operating expenses (125,636,304) - 5,758,838 (119,877,466) Operating loss (82,057,750) (3,959,559) 5,758,838 (80,258,471) Nonoperating revenues (expenses) Nonoperating revenues 94,005,005 5,759,035 (5,758,838) 94,005,202 Interest on debt related to capital assets (1,965) (2,028,282) - (2,030,247) Total nonoperating revenues, net 94,003,040 3,730,753 (5,758,838) 91,974,955 Change in net position 11,945,290 (228,806) - 11,716,484 Net position, beginning of year, as previously reported 84,615,530 29,470, ,086,233 Cumulative Effect of Change in Accounting Principle (13,180,648) - - (13,180,648) Net position, beginning of year, as restated 71,434,882 29,470, ,905,585 Net position, end of year $ 83,380,172 $ 29,241,897 $ - $ 112,622,069 78
82 Notes to Financial Statements 2018 Building District Corporation Eliminations Total Condensed Statements of Cash Flows Net cash used in operating activities $ (76,485,089) $ - $ - $ (76,485,089) Net cash provided by noncapital financing activities 86,605,975 5,758,838-92,364,813 Net cash used in capital and related financing activities (5,106,836) (5,715,929) - (10,822,765) Net cash provided by investing activities 580, ,043 5,594,896 43,106-5,638,002 Cash and cash equivalents, beginning of year 44,543,313 5,153,912-49,697,225 Cash and cash equivalents, end of year $ 50,138,209 $ 5,197,018 $ - $ 55,335, Building District Corporation Eliminations Total Condensed Statements of Net Position Assets Current assets $ 104,911,741 $ 1,138,949 $ - $ 106,050,690 Noncurrent assets 42,799,905 83,581, ,381,483 Total assets 147,711,646 84,720, ,432,173 Deferred outflows 25,674,988 3,106,588-28,781,576 Liabilities Current liabilities 14,986,853 4,961,412-19,948,265 Noncurrent liabilities 64,490,718 53,395, ,885,718 Total liabilities 79,477,571 58,356, ,833,983 Deferred inflows 9,293, ,293,533 Net position Net investment in capital assets 34,737,043 29,133,166-63,870,209 Unrestricted 49,878, ,537-50,216,024 Total net position $ 84,615,530 $ 29,470,703 $ - $ 114,086, Building District Corporation Eliminations Total Condensed Statements of Revenues, Expenses and Changes in Net Position Operating revenues (expenses) Operating revenue $ 49,749,219 $ - $ - $ 49,749,219 Depreciation expense (2,219,166) (4,059,752) - (6,278,918) Other operating expenses (125,897,990) - 5,762,819 (120,135,171) Operating loss (78,367,937) (4,059,752) 5,762,819 (76,664,870) Nonoperating revenues (expenses) Nonoperating revenues 90,719,179 5,762,248 (5,762,819) 90,718,608 Interest on debt related to capital assets - (2,538,652) - (2,538,652) Total nonoperating revenues, net 90,719,179 3,223,596 (5,762,819) 88,179,956 Change in net position 12,351,242 (836,156) - 11,515,086 Net position, beginning of year 72,264,288 30,306, ,571,147 Net position, end of year $ 84,615,530 $ 29,470,703 $ - $ 114,086,233 79
83 Notes to Financial Statements 2017 Building District Corporation Eliminations Total Condensed Statements of Cash Flows Net cash used in operating activities $ (72,204,573) $ - $ - $ (72,204,573) Net cash provided by noncapital financing activities 83,181,719 5,955,320-89,137,039 Net cash used in capital and related financing activities (5,428,002) (5,713,645) - (11,141,647) Net cash provided by investing activities 4,956, ,956,524 10,505, ,677-10,747,343 Cash and cash equivalents, beginning of year 34,037,647 4,912,235-38,949,882 Cash and cash equivalents, end of year $ 44,543,313 $ 5,153,912 $ - $ 49,697,225 80
84 Required Supplementary Information
85 Schedule of Changes in the College s Total OPEB Liability and Related Ratios June 30, Total OPEB Liability Service cost $ 258,494 Interest 365,040 Changes in assumptions or other inputs (374,914) Benefit payments (2,049,000) Notes to Schedule: Net change in Total OPEB Liability (1,800,380) Net OPEB asset under GASB 45, beginning of year, as previously reported (1,512,221) Cumulative Effect of Change in Accounting Principle 13,180,648 Total OPEB liability under GASB 75, beginning of year, as restated 11,668,427 Total OPEB liability, end of year $ 9,868,047 Covered-Employee Payroll $ 61,460,898 Total OPEB Liability as a Percentage of Covered-Employee Payroll 16.06% Benefit Changes There were no changes to benefit terms for the year ended June 30, Changes of Assumptions There was a change in the discount rate which has a net impact of $583,
86 Schedule of Funding Progress for OPEB Plan June 30, 2018 Year Ended June 30, 2017 Actuarial UAAL as a Actuarial Value of Actuarial Funded Percentage of Valuation Date Assets Accrued Liability Unfunded AAL Ratio Covered Payroll Covered Payroll July 1, 2016 $ - $ 12,845,610 $ (12,845,610) 0% $ 45,438,106 28% July 1, ,584,735 (17,584,735) 0% 44,468,616 40% July 1, ,420,508 (24,420,508) 0% 47,757,555 43% July 1, ,469,000 (12,469,000) 0% 51,416,000 24% June 30, ,993,000 (25,993,000) 0% 50,218,000 52% Note: Fiscal year 2009 is the transition year for GASB Statement No. 45. Fiscal year 2011 the post-employment benefit plan was modified and effective July 1, 2013 eligible retirees and their dependents may continue coverage under the College s plan by paying active COBRA rates. The unfunded Actuarial Liability (AAL) is amortized over 10 years. 82
87 Schedules of the College s Proportionate Share of the Net Pension Liability and College Contributions June 30, 2018 Schedule of the College s Proportionate Share of Net Pension Liability District's Proportionate Share District's of the Net Pension Plan District's Proportionate Share of Liability as a Fiduciary Net Position Proportion of the the Net Pension District's Percentage of as a Percentage Year Ended * Net Pension Liability Liability Covered Payroll it's Covered Payroll of Total Pension Liability 6/30/2018 PEERS % $ 14,518,955 $ 30,582, % 85.35% 6/30/2018 PSRS % 46,217,761 30,878, % 83.77% 6/30/2017 PEERS % 15,452,978 29,741, % 83.32% 6/30/2017 PSRS % 47,129,070 29,987, % 82.18% 6/30/2016 PEERS % 10,918,210 30,953, % 88.28% 6/30/2016 PSRS % 36,571,069 29,482, % 85.78% 6/30/2015 PEERS % 7,388,403 29,505, % 91.33% 6/30/2015 PSRS % 25,493,403 28,345, % 89.34% Note: This schedule is intended to show information for ten years. Additional years will be displayed as they become available. * The data provided in the schedule is based as of the measurement date of PSRS and PEERS net pension liability, which is as of the beginning of the College s fiscal year. Schedule of College s Contributions Contractually Actual Contribution District's Contributions as Required Employer Deficiency Covered a Percentage of Year Ended Contribution Contributions (Excess) Payroll Covered Payroll 6/30/2013 PEERS $ 2,107,749 $ 2,107,749 $ - $ 30,744, % 6/30/2013 PSRS 4,633,378 4,633,378-32,831, % 6/30/2014 PEERS 2,024,056 2,024,056-29,505, % 6/30/2014 PSRS 4,001,458 4,001,458-28,345, % 6/30/2015 PEERS 2,123,411 2,214,010 (90,599) 30,953, % 6/30/2015 PSRS 3,927,796 4,158,868 (231,072) 29,482, % 6/30/2016 PEERS 2,123,413 2,123,413-29,741, % 6/30/2016 PSRS 4,159,289 4,159,289-27,807, % 6/30/2017 PEERS 2,040,287 2,040,287-29,741, % 6/30/2017 PSRS 4,242,915 4,242,915-29,987, % 6/30/2018 PEERS 2,097,934 2,097,934-30,582, % 6/30/2018 PSRS 4,377,884 4,377,884-30,878, % Note: This schedule is intended to show information for ten years. Additional years will be displayed as they become available. 83
88 Schedules of the College s Proportionate Share of the Net Pension Liability and College Contributions (Continued) June 30, 2018 Notes to Schedules of the College s Proportionate Share of the Net Pension Liability and College Contributions See Note 6 for factors that affect trends in the amounts reported, such as changes in benefit terms or assumptions. Contribution rates for PEERS and PSRS remained the same for the College for years ended June 30, 2018, 2017 and
89 Other Supplementary Information
90 Combining Schedule of Net Position June 30, 2018 Building District Corporation Eliminations Total Assets Current Assets Cash and cash equivalents $ 50,138,209 $ 5,197,018 $ - $ 55,335,227 Short-term investments 18,412, ,412,000 Accounts receivable, net of allowance; $263,025 11,695,488 (4,014,963) - 7,680,525 Other assets 569, ,456 Total current assets 80,815,153 1,182,055-81,997,208 Noncurrent Assets Long-term investments 36,105, ,105,000 Capital assets Nondepreciable 9,528, ,095-10,335,057 Depreciable, net 28,618,412 78,815, ,434,336 Total noncurrent assets 74,252,374 79,622, ,874,393 Total assets 155,067,527 80,804, ,871,601 Deferred Outflows of Resources 21,564,050 2,587,341-24,151,391 Total assets and deferred outflows of resources $ 176,631,577 $ 83,391,415 $ - $ 260,022,992 Liabilities Current Liabilities Accounts payable, accrued and other liabilities $ 7,659,568 $ 754,518 $ - $ 8,414,086 Compensated absences 2,217, ,217,858 Current portion of long-term debt - 4,250,000-4,250,000 Unearned revenue - tuition 3,627, ,627,666 Unearned revenue - contracts 50, ,000 Capital lease purchases 452, ,473 Total current liabilities 14,007,565 5,004,518-19,012,083 Noncurrent Liabilities Bond payable - 49,145,000-49,145,000 Compensated absences 508, ,704 Other postemployment benefit obligations 9,868, ,868,047 Net pension liability 60,736, ,736,716 Capital lease purchases 452, ,475 Unearned revenue - contracts 300, ,000 Total noncurrent liabilities 71,865,942 49,145, ,010,942 Total liabilities 85,873,507 54,149, ,023,025 Deferred Inflows of Resources 7,377, ,377,898 Net Position Net investment in capital assets 37,242,426 28,814,360-66,056,786 Unrestricted 46,137, ,537-46,565,283 Total net position $ 83,380,172 $ 29,241,897 $ - $ 112,622,069 85
91 Combining Schedule of Revenues, Expenses and Changes in Net Position Year Ended June 30, 2018 Building District Corporation Eliminations Total Operating Revenues Tuition and fees $ 46,918,390 $ - $ - $ 46,918,390 Less sholarship allowance 21,774, ,774,143 Student tuition and fees, net 25,144, ,144,247 Federal grants and contracts 11,317, ,317,308 State and local grants and contracts 3,172, ,172,059 Auxiliary services revenues 1,672, ,672,756 Other 4,871, ,871,673 Total operating revenues 46,178, ,178,043 Operating Expenses Salaries and wages 63,306, ,306,546 Fringe benefits 21,819, ,819,736 Supplies and other services 32,796,998 - (5,758,838) 27,038,160 Utilities 4,014, ,014,870 Scholarships and fellowships 3,698, ,698,154 Depreciation 2,599,489 3,959,559-6,559,048 Total operating expenses 128,235,793 3,959,559 (5,758,838) 126,436,514 Operating Loss (82,057,750) (3,959,559) 5,758,838 (80,258,471) Nonoperating Revenues (Expenses) Federal Pell Grant revenue 21,666, ,666,105 State appropriations 31,115, ,115,709 County property tax revenue 35,529, ,529,587 Investment income 1,291, ,291,398 Other nonoperating revenues 4,402,403 5,758,838 (5,758,838) 4,402,403 Interest on debt related to capital assets (1,965) (2,028,282) - (2,030,247) Total nonoperating revenues, net 94,003,040 3,730,753 (5,758,838) 91,974,955 Increase (Decrease) in Net Position 11,945,290 (228,806) - 11,716,484 Net Position, Beginning of Year, as Previously Reported 84,615,530 29,470, ,086,233 Cumulative Effect of Change in Accounting Principle (13,180,648) - - (13,180,648) Net Position, Beginning of Year, as Restated 71,434,882 29,470, ,905,585 Net Position, End of Year $ 83,380,172 $ 29,241,897 $ - $ 112,622,069 86
92 Schedule of Revenues, Expenses and Changes in Fund Balances Year Ended June 30, 2018 Business & Special Projects Designated Continuing Auxiliary Unexpended Invested in Agency Fund General Fund Fund Fund Education Fund Enterprises Fund Student Aid Fund Restricted Fund Plant Fund Plant Fund Total Revenues Student tuition and fees, net $ 235,253 $ 41,009,681 $ 2,452,851 $ 627,483 $ 2,593,097 $ 25 $ (21,774,143) $ - $ - $ - $ 25,144,247 State aid - 31,115, ,115,709 Government grants and contracts 35,542 2,447, , ,550 8,088 23,233,286 9,530, ,155,472 State and county taxes - 35,529, ,529,587 Investment income - 1,291, ,291,201 Other income 120,476 2,471, ,724-1,788,436 2,949, , ,453 2,947,682-10,946,832 Total revenues 391, ,865,619 3,047, ,483 4,976,083 2,958,011 1,584,552 9,784,494 2,947, ,183,048 Expenses Instructional (13,000) 40,296,659 1,313,645-2,181, ,679 7,794-44,407,964 Academic support - 9,671, , , ,947,950 6,469-13,892,776 Student services 309,396 14,382, , , ,148,284 Plant operation and maintenance - 11,422, , ,201,038-23,186,995 Depreciation ,599,489 2,599,489 Institutional support - 21,744,292 48,845 6, , ,564,967-23,534,466 Scholarships and fellowships 2,996 1,658,018 8,378-15,483-1,583, , ,698,154 Public service ,330, ,330,555 Interest expense ,965-1,965 Auxiliary epenses ,093, ,093,067 Total expenses 299,392 99,174,978 1,792,719 6,277 3,211,684 1,656,903 1,584,553 9,785,196 12,782,524 2,599, ,893,715 Revenues Over (Under) Expenses 91,879 14,690,641 1,255, ,206 1,764,399 1,301,108 (1) (702) (9,834,842) (2,599,489) 7,289,333 Add: Capitalized expenses 6,639 1,108,459 73, ,467,448-4,655,957 Total before fund transfers 98,518 15,799,100 1,328, ,206 1,764,399 1,301,108 (1) (702) (6,367,394) (2,599,489) 11,945,290 Total fund transfers (6,639) (15,799,100) (1,328,545) - (1,764,398) (1,251,108) ,493,132 4,655,957 - Increase (Decrease) in Fund Balance 91, , ,000 (1) (1) 9,125,738 2,056,468 11,945,290 Fund Balance, Beginning of Year, As Previously Reported 834,070 20,058,742-32,814 - (400,000) ,606,794 40,483,110 84,615,530 Cumulative Effect of Change in Accounting Principle (13,180,648) - (13,180,648) Fund Balance, Beginning of Year, As Restated 834,070 20,058,742-32,814 - (400,000) ,426,146 40,483,110 71,434,882 Fund Balance, End of Year $ 925,949 $ 20,058,742 $ - $ 654,020 $ 1 $ (350,000) $ (1) $ (1) $ 19,551,884 $ 42,539,578 $ 83,380,172 87
93 Schedule of Revenues, Expenses and Changes in Fund Balances (Continued) Year Ended June 30, 2018 Building District Corporation Eliminations Total Revenues Student tuition and fees $ 46,918,390 $ - $ - $ 46,918,390 Less scholarship allowance 21,774, ,774,143 Student tuition and fees, net 25,144, ,144,247 State aid 31,115, ,115,709 Government grants and contracts 36,155, ,155,472 State and county taxes 35,529, ,529,587 Investment income 1,291, ,291,398 Other income 10,946,832 5,758,838 (5,758,838) 10,946,832 Total revenues 140,183,048 5,759,035 (5,758,838) 140,183,245 Operating Expenses Instructional 44,407, ,407,964 Academic support 13,892, ,892,776 Student services 15,148, ,148,284 Plant operation and maintenance 23,186,995 - (5,758,838) 17,428,157 Depreciation 2,599,489 3,959,559-6,559,048 Institutional support 23,534, ,534,466 Scholarships and fellowships 3,698, ,698,154 Public service 5,330, ,330,555 Interest expense 1,965 2,028,282-2,030,247 Auxiliary expense 1,093, ,093,067 Total operating expenses 132,893,715 5,987,841 (5,758,838) 133,122,718 Revenues over (under) expenditures 7,289,333 (228,806) - 7,060,527 Add: Capitalized expenses 4,655, ,655,957 Net Increase (Decrease) in Fund Balance 11,945,290 (228,806) - 11,716,484 Fund Balance, Beginning of Year, as Previously Reported 84,615,530 29,470, ,086,233 Cumulative Effect of Change in Accounting Principle (13,180,648) - - (13,180,648) Fund Balance, Beginning of Year, as Restated 71,434,882 29,470, ,905,585 Fund Balance, End of Year $ 83,380,172 $ 29,241,897 $ - $ 112,622,069 88
94 Schedule of Expenses by Functional and Natural Classification Year Ended June 30, 2018 Functional Expense Classification Natural Expense Classification Total Expenses by Functional Salaries Supplies and Scholarships Classification and wages Fringe benefits other services Utilities and fellowships Depreciation Interest Expense (Fund Report) Type of expense Instructional $ 30,800,266 $ 8,760,609 $ 4,847,090 $ 531,651 $ - $ - $ - $ 44,939,616 Academic support 7,764,268 2,788,438 3,337,660 2, ,892,776 Student services 9,764,823 3,666,345 1,717, ,148,284 Plant operation and maintenance 3,352,369 1,457,082 9,137,897 3,480, ,428,157 Institutional support 10,368,291 4,820,929 7,813, ,002,623 Public service 413, ,274 4,794, ,330,747 Auxiliary expense 842, ,059 46, ,093,066 Scholarships and fellowships ,698, ,698,154 Depreciation ,559,048-6,559,048 Interest expense ,030,247 2,030,247 Total expenses 63,306,546 21,819,736 31,694,117 4,014,870 3,698,154 6,559,048 2,030, ,122,718 Less: Capitalized expenses - - (4,655,957) (4,655,957) Total expenses by natural classification (GASB Report) $ 63,306,546 $ 21,819,736 $ 27,038,160 $ 4,014,870 $ 3,698,154 $ 6,559,048 $ 2,030,247 $ 128,466,761 89
95 Schedule of Fund Transfers From/(To) Year Ended June 30, 2018 Operational Restricted Funds Plant Funds Special Unexpended Invested in General Projects IWI Student Fund Auxiliary Student Aid Restricted Plant Plant Fund Transfers Transfer for capitalized equipment $ 1,108,459 $ 73,411 $ - $ 6,639 $ - $ - $ - $ 3,467,448 $ (4,655,957) Transfer to cover net bond payment 5,758, (5,758,838) - Transfer for designated maintenance projects 1,500, (1,500,000) - Transfer for designated IT projects 500, (500,000) - Transfer annual fund close-out (4,269,939) 1,255,134 1,764,398-1,251,108 - (701) - - Transfer to match financial plan 11,201, (11,201,742) - Net fund transfers $ 15,799,100 $ 1,328,545 $ 1,764,398 $ 6,639 $ 1,251,108 $ - $ (701) $ (15,493,132) $ (4,655,957) 90
96 Notes to Other Supplementary Financial Information June 30, 2018 Funds statements are still used to manage the colleges and for external reporting to various agencies and have been included in the Other Supplementary Information section of the accompanying report for informational purposes. The main difference between the Colleges primary audited financial statements and the funds statement presentations is the treatment of scholarship aid used for tuition and fees. The primary statements per GASB 35 require such aid to be offset against tuition and fees, whereas the funds statements reflect gross tuition and fees and scholarship aid. Fund accounting is the procedure by which resources are classified for accounting and reporting purposes into funds that are maintained in accordance with activities or specific objectives. Separate accounts are maintained for each fund. Funds that have similar characteristics have been combined into fund groups. Accordingly, all financial transactions have been recorded and reported by fund groups. The assets, liabilities and fund balances of the Colleges are reported in two self-balancing fund groups as follows: Current Funds include two separate fund groups, unrestricted and restricted, both of which are currently expendable for purposes of meeting the primary objectives of the Colleges, i.e., instruction, public service and related supporting services. The unrestricted funds group, over which the College s governing board retains full control to use in achieving any of its institutional purposes, includes the operational (general, business/continuing education and special projects), auxiliary enterprise and agency funds. The general fund is used for all operational-type charges that are not covered by the following two categories. The business/continuing education fund is utilized to account for contracted instructional activities with the business community and most other noncredit instruction. The special projects fund is used to account for programs, which have been internally designated by the College s governing board as pilot projects or require special accountability. Resources restricted by donors or other outside agencies for specific current operating purposes are accounted for in the restricted funds group, which includes the restricted and student aid funds. Plant Funds include resources available for future plant acquisitions, renewals and replacements, resources restricted for the retirement of indebtedness and funds which have been invested in the plant. These funds are broken into two separate sections: Plant Funds and Building Corporation plant funds. 91
97 Compliance
98 Schedule of Expenditures of Federal Awards Year Ended June 30, 2018 Federal Pass-Through Passed Total Federal Grantor/Pass-Through Grantor/ CFDA Entity Identifying Through to Federal Program or Cluster Title Number Number Subrecipients Expenditures U.S. Department of Education/Federal Supplemental Education Opportunity Grants N/A $ - $ 498,681 U.S. Department of Education/Federal Direct Student Loans N/A - 9,463,101 U.S. Department of Education/Federal Work Study Program N/A - 317,787 U.S. Department of Education/Federal Pell Grant Program N/A - 21,700,096 Total Student Financial Assistance Cluster - 31,979,665 U.S. Department of Education/Education Opportunity Center N/A - 429,543 U.S. Department of Education/Student Support Services N/A - 340,962 U.S. Department of Education/Upward Bound N/A - 82,429 Total TRIO Cluster - 852,934 U.S. Department of Labor/Missouri Department of Economic Development/WIOA Adult Program N/A - 14,159 Total Workforce Investment Act Cluster - 14,159 U.S. Department of Education/Title III - Higher Education - Institutional Aid N/A - 1,077,086 U.S. Department of Education/Title III - Higher Education - Institutional Aid N/A - 1,665,483 Total Title III - Higher Education - Institutional Aid Grant - 2,742,569 U.S. Department of Education/Missouri Department of Elementary & Secondary Education/Carl D. Perkins Vocational Programs N/A - 865,976 U.S. Department of Agriculture/Missouri Department Social Services & Missouri Community College Assn./SkillUP Program N/A - 273,547 U.S. Department of Labor/Trade Adjustment Assistance Community College & Career Training Missouri STEM N/A 3,420,352 5,429,873 U.S. Department of Labor/State of Missouri Department of Economic Development/Apprenticeship USA N/A - 81,813 National Aeronautics & Space Administration/Missouri University of Science and Technology/Missouri Space Grant Consortium ,770 National Endowment for the Humanities/Missouri Humanities Council/Metropolitan Community College Storytelling Celebration ,000 U.S. Department of Health and Human Services/Behavorial Health Workforce Education & Training for Professionals & Paraprofessionals N/A - 166,152 U.S. Department of Health and Human Services/University of Missouri-Kansas City/Kansas City Health Tracks ,565 Total $ 3,420,352 $ 42,441,023 The accompanying notes are an integral part of this Schedule 92
99 Notes to the Schedule of Expenditures of Federal Awards Year Ended June 30, 2018 Notes to Schedule 1. The accompanying schedule of expenditures of federal awards (the Schedule ) includes the federal award activity of under programs of the federal government for the year ended June 30, The information in this Schedule is presented in accordance with the requirements of Title 2 U.S. Code of Federal Regulations Part 200, Uniform Administrative Requirements, Cost Principles and Audit Requirements for Federal Awards (Uniform Guidance). Because the Schedule presents only a selected portion of the operations of The Metropolitan Community College, it is not intended to and does not present the financial position, changes in net position or cash flows of. 2. Expenditures reported on the Schedule are reported on the accrual basis of accounting. Such expenditures are recognized following, as applicable, either the cost principles contained in OMB Cost Circular A-110 or the cost principles contained in Title 2 U.S. Code of Federal Regulations Part 200, Uniform Administrative Requirements, Cost Principles and Audit Requirements for Federal Awards, wherein certain types of expenditures are not allowable or are limited as to reimbursement. Negative amounts shown on the Schedule represent adjustments or credits made in the normal course of business to amounts reported as expenditures in prior years. has elected not to use the 10 percent de minimis indirect cost rate allowed under the Uniform Guidance. 93
100 Report on Internal Control Over Financial Reporting and on Compliance and Other Matters Based on an Audit of Financial Statements Performed in Accordance with Government Auditing Standards Independent Auditor s Report Board of Trustees Kansas City, Missouri We have audited, in accordance with auditing standards generally accepted in the United States of America and the standards applicable to financial audits contained in Government Auditing Standards, issued by the Comptroller General of the United States, the financial statements of the business-type activities and the discretely presented component unit of The Junior College District of Metropolitan Kansas City, Missouri s (d/b/a the College ) as of and for the year ended June 30, 2018, and the related notes to the financial statements, which collectively comprise the College s basic financial statements, and have issued our report thereon dated November 14, 2018, which contained an emphasis of matter paragraph for a change in accounting principle. The financial statements of Foundation, the discretely presented component unit, were not audited in accordance with Government Auditing Standards. Internal Control Over Financial Reporting In planning and performing our audit of the financial statements, we considered the College s internal control over financial reporting (internal control) to determine the audit procedures that are appropriate in the circumstances for the purpose of expressing our opinion on the financial statements, but not for the purpose of expressing an opinion on the effectiveness of the College s internal control. Accordingly, we do not express an opinion on the effectiveness of the College s internal control. A deficiency in internal control exists when the design or operation of a control does not allow management or employees, in the normal course of performing their assigned functions, to prevent, or detect and correct, misstatements on a timely basis. A material weakness is a deficiency, or a combination of deficiencies, in internal control, such that there is a reasonable possibility that a material misstatement of the College s financial statements will not be prevented, or detected and corrected, on a timely basis. A significant deficiency is a deficiency, or a combination of deficiencies, in internal control that is less severe than a material weakness, yet important enough to merit attention by those charged with governance. Our consideration of internal control was for the limited purpose described in the first paragraph of this section and was not designed to identify all deficiencies in internal control that might be material weaknesses or significant deficiencies. Given these limitations, during our audit we did not identify any deficiencies in internal control that we consider to be material weaknesses. However, material weaknesses may exist that have not been identified. 94
101 Board of Trustees Page 2 Compliance and Other Matters As part of obtaining reasonable assurance about whether the College s financial statements are free from material misstatement, we performed tests of its compliance with certain provisions of laws, regulations, contracts and grant agreements, noncompliance with which could have a direct and material effect on the determination of financial statement amounts. However, providing an opinion on compliance with those provisions was not an objective of our audit, and accordingly, we do not express such an opinion. The results of our tests disclosed no instances of noncompliance or other matters that are required to be reported under Government Auditing Standards. Purpose of this Report The purpose of this report is solely to describe the scope of our testing of internal control and compliance and the results of that testing, and not to provide an opinion on the effectiveness of the entity s internal control or on compliance. This report is an integral part of an audit performed in accordance with Government Auditing Standards in considering the College s internal control and compliance. Accordingly, this communication is not suitable for any other purpose. Kansas City, Missouri November 14,
102 Report on Compliance for the Major Federal Program and Report on Internal Control Over Compliance Independent Auditor s Report Board of Trustees Kansas City, Missouri Report on Compliance for the Major Federal Program We have audited The Junior College District of Metropolitan Kansas City, Missouri s (d/b/a The Metropolitan Community College the College ) compliance with the types of compliance requirements described in the OMB Compliance Supplement that could have a direct and material effect on the College s major federal program for the year ended June 30, The College s major federal program is identified in the summary of auditor s results section of the accompanying schedule of findings and questioned costs. Management s Responsibility Management is responsible for compliance with federal statutes, regulations and the terms and conditions of its federal awards applicable to its federal programs. Auditor s Responsibility Our responsibility is to express an opinion on compliance for the College s major federal program based on our audit of the types of compliance requirements referred to above. We conducted our audit of compliance in accordance with auditing standards generally accepted in the United States of America; the standards applicable to financial audits contained in Government Auditing Standards, issued by the Comptroller General of the United States; and the audit requirements of Title 2 U.S. Code of Federal Regulations Part 200, Uniform Administrative Requirements, Cost Principles and Audit Requirements for Federal Awards (Uniform Guidance). Those standards and the Uniform Guidance require that we plan and perform the audit to obtain reasonable assurance about whether noncompliance with the types of compliance requirements referred to above that could have a direct and material effect on a major federal program occurred. An audit includes examining, on a test basis, evidence about the College s compliance with those requirements and performing such other procedures as we considered necessary in the circumstances. We believe that our audit provides a reasonable basis for our opinion on compliance for the major federal program. However, our audit does not provide a legal determination of the College s compliance. 96
103 Board of Trustees Page 2 Opinion on the Major Federal Program In our opinion, the College complied, in all material respects, with the types of compliance requirements referred to above that could have a direct and material effect on its major federal program for the year ended June 30, Report on Internal Control Over Compliance Management of the College is responsible for establishing and maintaining effective internal control over compliance with the types of compliance requirements referred to above. In planning and performing our audit of compliance, we considered the College s internal control over compliance with the types of requirements that could have a direct and material effect on the major federal program to determine the auditing procedures that are appropriate in the circumstances for the purpose of expressing an opinion on compliance for the major federal program and to test and report on internal control over compliance in accordance with the Uniform Guidance, but not for the purpose of expressing an opinion on the effectiveness of internal control over compliance. Accordingly, we do not express an opinion on the effectiveness of the College s internal control over compliance. A deficiency in internal control over compliance exists when the design or operation of a control over compliance does not allow management or employees, in the normal course of performing their assigned functions, to prevent, or detect and correct, noncompliance with a type of compliance requirement of a federal program on a timely basis. A material weakness in internal control over compliance is a deficiency, or a combination of deficiencies, in internal control over compliance, such that there is a reasonable possibility that material noncompliance with a type of compliance requirement of a federal program will not be prevented, or detected and corrected, on a timely basis. A significant deficiency in internal control over compliance is a deficiency, or a combination of deficiencies, in internal control over compliance with a type of compliance requirement of a federal program that is less severe than a material weakness in internal control over compliance, yet important enough to merit attention by those charged with governance. Our consideration of internal control over compliance was for the limited purpose described in the first paragraph of this section and was not designed to identify all deficiencies in internal control over compliance that might be material weaknesses or significant deficiencies. We did not identify any deficiencies in internal control over compliance that we consider to be material weaknesses. However, material weaknesses may exist that have not been identified. The purpose of this report on internal control over compliance is solely to describe the scope of our testing of internal control over compliance and the results of that testing based on the requirements of the Uniform Guidance. Accordingly, this report is not suitable for any other purpose. Kansas City, Missouri November 14,
104 Schedule of Findings and Questioned Costs Year Ended June 30, 2018 Summary of Auditor s Results Financial Statements 1. The type of report the auditor issued on whether the financial statements audited were prepared in accordance with accounting principles generally accepted in the United States of America (GAAP) were: Unmodified Qualified Adverse Disclaimer 2. The independent auditor s report on internal control over financial reporting disclosed: Significant deficiency(ies)? Yes None reported Material weakness(es)? Yes No 3. Noncompliance considered material to the financial statements was disclosed by the audit? Federal Awards Yes No 4. The independent auditor s report on internal control over compliance for the major federal awards program disclosed: Significant deficiency(ies)? Yes None reported Material weakness(es)? Yes No 5. The opinion expressed in the independent auditor s report on compliance for the major federal award was: Unmodified Qualified Adverse Disclaimer 6. The audit disclosed findings required to be reported by 2 CFR (a)? Yes No 98
105 Schedule of Findings and Questioned Costs (Continued) Year Ended June 30, The College s major program was: Name of Federal Program CFDA Number Student Finanical Assistance Cluster U.S. Department of Education/Federal Supplemental Education Opportunity Grants U.S. Department of Education/Federal Direct Student Loans U.S. Department of Education/Federal Work Study Program U.S. Department of Education/Federal Pell Grant Program The threshold used to distinguish between Type A and Type B programs was $1,273, The College qualified as a low-risk auditee? Yes No 99
106 Schedule of Findings and Questioned Costs (Continued) Year Ended June 30, 2018 Findings Required to be Reported by Government Auditing Standards No matters are reportable. Findings Required to be Reported by Uniform Guidance No matters are reportable. 100
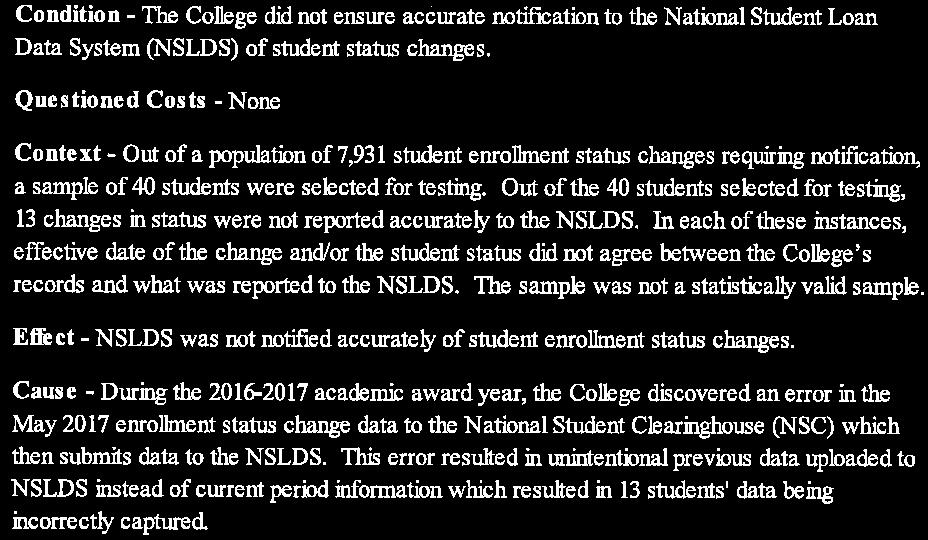


107
COMMUNITY COLLEGE DISTRICT OF ST. LOUIS ST. LOUIS COUNTY, MISSOURI St. Louis, Missouri FINANCIAL STATEMENTS. June 30, 2017 and 2016
 ST. LOUIS COUNTY, MISSOURI St. Louis, Missouri FINANCIAL STATEMENTS TABLE OF CONTENTS INDEPENDENT AUDITORS' REPORT... 4 MANAGEMENT S DISCUSSION AND ANALYSIS... 8 FINANCIAL STATEMENTS Statements of Net
SAN BERNARDINO COMMUNITY COLLEGE DISTRICT ANNUAL FINANCIAL REPORT JUNE 30, 2017
 SAN BERNARDINO COMMUNITY COLLEGE DISTRICT ANNUAL FINANCIAL REPORT TABLE OF CONTENTS FINANCIAL SECTION Independent Auditor's Report 2 Management Discussion and Analysis 5 Basic Financial Statements - Primary
Report of Independent Auditors in accordance with the Uniform Guidance and Financial Statements for
 Report of Independent Auditors in accordance with the Uniform Guidance and Financial Statements for June 30, 2016 and 2015 LEWIS-CLARK STATE COLLEGE TABLE OF CONTENTS Page REPORT OF INDEPENDENT AUDITORS
WASHBURN UNIVERSITY OF TOPEKA FINANCIAL STATEMENTS JUNE 30, 2016
 FINANCIAL STATEMENTS JUNE 30, 2016 Index Page Independent Auditors Report... 1-3 Management s Discussion And Analysis... 4-28 Financial Statements Statements Of Net Position... 29-30 Statements Of Financial
Financial Statements. C.S. Mott Community College Flint, Michigan. June 30, 2017 and 2016
 Financial Statements C.S. Mott Community College Flint, Michigan June 30, 2017 and 2016 Table of Contents Page Independent Auditors Report on Financial Statements 1-2 Management s Discussion and Analysis
Los Angeles Community College District
 Los Angeles Community College District Basic Financial Statements and Supplemental Information June 30, 2016 and 2015 (With Independent Auditors Report Thereon) June 30, 2016 and 2015 Los Angeles County,
WASHBURN UNIVERSITY OF TOPEKA FINANCIAL STATEMENTS JUNE 30, 2017
 FINANCIAL STATEMENTS JUNE 30, 2017 Index Page Independent Auditors Report... 1-3 Management s Discussion And Analysis... 4-24 Financial Statements Statements Of Net Position... 25-26 Statements Of Financial
WINSTON-SALEM STATE UNIVERSITY
 STATE OF NORTH f CAROLINA OFFICE OF THE STATE AUDITOR BETH A. WOOD, CPA WINSTON-SALEM STATE UNIVERSITY WINSTON-SALEM, NORTH CAROLINA FINANCIAL STATEMENT AUDIT REPORT FOR THE YEAR ENDED JUNE 30, 2018 A
GENESEE COMMUNITY COLLEGE SINGLE AUDIT REPORTS AUGUST 31, 2016
 GENESEE COMMUNITY COLLEGE SINGLE AUDIT REPORTS AUGUST 31, 2016 GENESEE COMMUNITY COLLEGE (A Component Unit of the County of Genesee, New York) Table of Contents August 31, 2016 Independent Auditors Report
Community College District of St.Louis St.Louis County, Missouri St.Louis, Missouri. FINANCIAL STATEMENTS Year Ended June 30, 2018 and 2017
 Community College District of St.Louis St.Louis County, Missouri St.Louis, Missouri FINANCIAL STATEMENTS Year Ended TABLE OF CONTENTS INDEPENDENT AUDITORS' REPORT... 4 MANAGEMENT S DISCUSSION AND ANALYSIS...
Washburn University of Topeka
 Accountants Report and Financial Statements (Including Reports Required Under OMB-133) June 30, 2006 and 2005 June 30, 2006 and 2005 Contents Independent Accountants Report on Financial Statements and
Washburn University of Topeka
 Accountants Report and Financial Statements (Including Reports Required Under OMB-133) June 30, 2005 and 2004 June 30, 2005 and 2004 Contents Independent Accountants Report on Financial Statements and
NORTH ORANGE COUNTY COMMUNITY COLLEGE DISTRICT ANNUAL FINANCIAL REPORT JUNE 30, 2017
 NORTH ORANGE COUNTY COMMUNITY COLLEGE DISTRICT ANNUAL FINANCIAL REPORT TABLE OF CONTENTS FINANCIAL SECTION Independent Auditor's Report 2 Management's Discussion and Analysis 5 Basic Financial Statements
MIRACOSTA COMMUNITY COLLEGE DISTRICT ANNUAL FINANCIAL REPORT JUNE 30, 2018
 MIRACOSTA COMMUNITY COLLEGE DISTRICT ANNUAL FINANCIAL REPORT TABLE OF CONTENTS FINANCIAL SECTION Independent Auditor's Report 2 Management's Discussion and Analysis 5 Basic Financial Statements - Primary
Kent State University (a component unit of the State of Ohio)
") Kent State University (a component unit of the State of Ohio) Financial Report Including Supplementary Information June 30, 2018 Table of Contents June 30, 2018 and 2017 Page(s) Independent Auditor s Report...
Kent State University (a component unit of the State of Ohio) Financial Report Including Supplementary Information June 30, 2018 Table of Contents June 30, 2018 and 2017 Page(s) Independent Auditor s Report...
Washburn University of Topeka
 Accountants Report and Financial Statements (Including Reports Required Under OMB-133) June 30, 2008 and 2007 June 30, 2008 and 2007 Contents Independent Accountants Report on Financial Statements and
SOUTHEAST MISSOURI STATE UNIVERSITY FINANCIAL STATEMENTS JUNE 30, 2018
 SOUTHEAST MISSOURI STATE UNIVERSITY FINANCIAL STATEMENTS JUNE 30, 2018 Contents Page Independent Auditors Report... 1-3 Management s Discussion And Analysis... 4-11 Financial Statements Statement Of Net
ST. CHARLES COMMUNITY COLLEGE FINANCIAL STATEMENTS FOR THE YEARS ENDED JUNE 30, 2018 AND 2017
 ST. CHARLES COMMUNITY COLLEGE FINANCIAL STATEMENTS FOR THE YEARS ENDED JUNE 30, 2018 AND 2017 ST. CHARLES COMMUNITY COLLEGE CONTENTS PAGE INDEPENDENT AUDITORS REPORT 1 MANAGEMENT S DISCUSSION AND ANALYSIS
WASHBURN UNIVERSITY OF TOPEKA FINANCIAL STATEMENTS JUNE 30, 2013
 FINANCIAL STATEMENTS JUNE 30, 2013 Index Page Independent Auditors Report... 1-4 Management s Discussion And Analysis... 5-27 Financial Statements Statements Of Net Position... 28-29 Statements Of Financial
FINANCIAL STATEMENTS AND INDEPENDENT AUDITOR S REPORTS YEAR ENDED JUNE 30, 2017 TABLE OF CONTENTS
 FINANCIAL STATEMENTS AND INDEPENDENT AUDITOR S REPORTS YEAR ENDED JUNE 30, 2017 TABLE OF CONTENTS Page MANAGEMENT S LETTER... 1 INDEPENDENT AUDITOR S REPORT... 2-4 MANAGEMENT S DISCUSSION AND ANALYSIS...
WILKES COMMUNITY COLLEGE
 STATE OF NORTH CAROLINA OFFICE OF THE STATE AUDITOR BETH A. WOOD, CPA WILKES COMMUNITY COLLEGE WILKESBORO, NORTH CAROLINA FINANCIAL STATEMENT AUDIT REPORT FOR THE YEAR ENDED JUNE 30, 2018 A COMPONENT UNIT
JUNIOR COLLEGE DISTRICT OF EAST CENTRAL MISSOURI UNION, MISSOURI FINANCIAL STATEMENTS. Years Ended June 30, 2016 and 2015
 JUNIOR COLLEGE DISTRICT OF EAST CENTRAL MISSOURI UNION, MISSOURI FINANCIAL STATEMENTS Years Ended June 30, 2016 and 2015 TABLE OF CONTENTS INDEPENDENT AUDITORS REPORT... 4 MANAGEMENT S DISCUSSION AND ANALYSIS...
JOHNSON COUNTY COMMUNITY COLLEGE FINANCIAL STATEMENTS JUNE 30, 2018
 JOHNSON COUNTY COMMUNITY COLLEGE FINANCIAL STATEMENTS JUNE 30, 2018 Contents Independent Auditor s Report 1 2 Management s Discussion and Analysis 3 13 Financial Statements Statements of net position 14
RANCHO SANTIAGO COMMUNITY COLLEGE DISTRICT ANNUAL FINANCIAL REPORT JUNE 30, 2013
 RANCHO SANTIAGO COMMUNITY COLLEGE DISTRICT ANNUAL FINANCIAL REPORT JUNE 30, 2013 TABLE OF CONTENTS JUNE 30, 2013 FINANCIAL SECTION Independent Auditors' Report 2 Management's Discussion and Analysis 4
HARFORD COMMUNITY COLLEGE COMPONENT UNIT FINANCIAL STATEMENTS AND SINGLE AUDIT COMPLIANCE REPORTS YEAR ENDED JUNE 30, 2017
 COMPONENT UNIT FINANCIAL STATEMENTS AND SINGLE AUDIT COMPLIANCE REPORTS TABLE OF CONTENTS INDEPENDENT AUDITORS REPORT 1 MANAGEMENT DISCUSSION AND ANALYSIS (UNAUDITED) 4 FINANCIAL STATEMENTS STATEMENT OF
Financial Statements. C.S. Mott Community College Flint, Michigan. June 30, 2015 and 2014
 Financial Statements C.S. Mott Community College Flint, Michigan June 30, 2015 and 2014 Table of Contents Page Independent Auditors Report on Financial Statements 1-2 Management s Discussion and Analysis
Audited Financial Statements and Other Financial Information. June 30, 2017
 Audited Financial Statements and Other Financial Information Audited Financial Statements and Other Financial Information Audited Financial Statements Management s Discussion and Analysis... 1-13 Report
JUNIOR COLLEGE DISTRICT OF EAST CENTRAL MISSOURI UNION, MISSOURI FINANCIAL STATEMENTS. Years Ended June 30, 2017 and 2016
 JUNIOR COLLEGE DISTRICT OF EAST CENTRAL MISSOURI UNION, MISSOURI FINANCIAL STATEMENTS Years Ended June 30, 2017 and 2016 TABLE OF CONTENTS INDEPENDENT AUDITORS REPORT... 4 MANAGEMENT S DISCUSSION AND ANALYSIS...
BLUEFIELD STATE COLLEGE FINANCIAL STATEMENTS YEARS ENDED JUNE 30, 2018 AND 2017
 FINANCIAL STATEMENTS YEARS ENDED JUNE 30, 2018 AND 2017 TABLE OF CONTENTS YEARS ENDED JUNE 30, 2018 INDEPENDENT AUDITORS REPORT 1 MANAGEMENT S DISCUSSION AND ANALYSIS (RSI) (UNAUDITED) 3 FINANCIAL STATEMENTS
ESSEX COUNTY COLLEGE (A Component Unit of the County of Essex) FINANCIAL STATEMENTS AND SUPPLEMENTARY INFORMATION YEARS ENDED JUNE 30, 2018 AND 2017
 FINANCIAL STATEMENTS AND SUPPLEMENTARY INFORMATION YEARS ENDED JUNE 30, 2018 AND 2017") (A Component Unit of the County of Essex) FINANCIAL STATEMENTS AND SUPPLEMENTARY INFORMATION YEARS ENDED JUNE 30, 2018 AND 2017 CliftonLarsonAllen LLP TABLE OF CONTENTS YEARS ENDED JUNE 30, 2018 AND 2017
(A Component Unit of the County of Essex) FINANCIAL STATEMENTS AND SUPPLEMENTARY INFORMATION YEARS ENDED JUNE 30, 2018 AND 2017 CliftonLarsonAllen LLP TABLE OF CONTENTS YEARS ENDED JUNE 30, 2018 AND 2017
Bergen Community College (A Component Unit of the County of Bergen)
") Basic Financial Statements, Management s Discussion and Analysis and Schedules of Expenditures of Federal and State Awards (With Independent Auditors Reports Thereon) Report on Financial Statements and
Basic Financial Statements, Management s Discussion and Analysis and Schedules of Expenditures of Federal and State Awards (With Independent Auditors Reports Thereon) Report on Financial Statements and
MIRACOSTA COMMUNITY COLLEGE DISTRICT ANNUAL FINANCIAL REPORT JUNE 30, 2016
 MIRACOSTA COMMUNITY COLLEGE DISTRICT ANNUAL FINANCIAL REPORT TABLE OF CONTENTS FINANCIAL SECTION Independent Auditor's Report 2 Management's Discussion and Analysis 5 Basic Financial Statements - Primary
MOREHEAD STATE UNIVERSITY. Single Audit Reports Under Uniform Guidance
 Single Audit Reports Under Uniform Guidance As of and for the Years Ended June 30, 2017 and 2016 with Report of Independent Auditors M CONTENTS Management s Discussion and Analysis... 1 Report of Independent
RANCHO SANTIAGO COMMUNITY COLLEGE DISTRICT ANNUAL FINANCIAL REPORT JUNE 30, 2012
 RANCHO SANTIAGO COMMUNITY COLLEGE DISTRICT ANNUAL FINANCIAL REPORT JUNE 30, 2012 TABLE OF CONTENTS JUNE 30, 2012 FINANCIAL SECTION Independent Auditors' Report 2 Management's Discussion and Analysis (Required
Report of Independent Auditors and Financial Statements for
 Report of Independent Auditors and Financial Statements for June 30, 2013 and 2012 LEWIS-CLARK STATE COLLEGE TABLE OF CONTENTS Page REPORT OF INDEPENDENT AUDITORS 1-2 MANAGEMENT S DISCUSSION AND ANALYSIS
Essex County College (A Component Unit of the County of Essex)
") Basic Financial Statements, Management s Discussion and Analysis and Schedules of Expenditures of Federal and State Awards (With Independent Auditors Reports Thereon) Report on Financial Statements and
Basic Financial Statements, Management s Discussion and Analysis and Schedules of Expenditures of Federal and State Awards (With Independent Auditors Reports Thereon) Report on Financial Statements and
West Virginia Council for Community and Technical College Education
 West Virginia Council for Community and Technical College Education (A Component Unit of the West Virginia Higher Education Policy Commission) Combined Financial Statements Years Ended June 30, 2017 and
WISCONSIN INDIANHEAD TECHNICAL COLLEGE
 WISCONSIN INDIANHEAD TECHNICAL COLLEGE Annual Audited Financial Statements for fiscal year ending, June 30, 2017 Wisconsin Indianhead Technical College District Shell Lake, WI Financial Statements With
SAN FRANCISCO COMMUNITY COLLEGE DISTRICT ANNUAL FINANCIAL REPORT JUNE 30, 2015
 SAN FRANCISCO COMMUNITY COLLEGE DISTRICT ANNUAL FINANCIAL REPORT TABLE OF CONTENTS FINANCIAL SECTION Independent Auditor's Report 2 Management's Discussion and Analysis (Required Supplementary Information)
Bergen Community College (A Component Unit of the County of Bergen)
") Basic Financial Statements, Management s Discussion and Analysis and Schedules of Expenditures of Federal and State Awards (With Independent Auditors Reports Thereon) Report on Financial Statements and
Basic Financial Statements, Management s Discussion and Analysis and Schedules of Expenditures of Federal and State Awards (With Independent Auditors Reports Thereon) Report on Financial Statements and
BALTIMORE CITY COMMUNITY COLLEGE. Financial Statements Together with Report of Independent Public Accountants
 Financial Statements Together with Report of Independent Public Accountants For the JUNE 30, 2013 AND 2012 CONTENTS REPORT OF INDEPENDENT PUBLIC ACCOUNTANTS 1 MANAGEMENT S DISCUSSION AND ANALYSIS 3 FINANCIAL
MONROE COMMUNITY COLLEGE (A Component Unit of the County of Monroe, New York)
") MONROE COMMUNITY COLLEGE (A Component Unit of the County of Monroe, New York) Financial Statements As of August 31, 2016 and 2015 Together with Independent Auditor s Report MONROE COMMUNITY COLLEGE (A
MONROE COMMUNITY COLLEGE (A Component Unit of the County of Monroe, New York) Financial Statements As of August 31, 2016 and 2015 Together with Independent Auditor s Report MONROE COMMUNITY COLLEGE (A
SAN FRANCISCO COMMUNITY COLLEGE DISTRICT ANNUAL FINANCIAL REPORT JUNE 30, 2016
 SAN FRANCISCO COMMUNITY COLLEGE DISTRICT ANNUAL FINANCIAL REPORT TABLE OF CONTENTS FINANCIAL SECTION Independent Auditor's Report 2 Management's Discussion and Analysis (Required Supplementary Information)
DURHAM TECHNICAL COMMUNITY COLLEGE
 STATE OF NORTH CAROLINA OFFICE OF THE STATE AUDITOR BETH A. WOOD, CPA DURHAM TECHNICAL COMMUNITY COLLEGE DURHAM, NORTH CAROLINA FINANCIAL STATEMENT AUDIT REPORT FOR THE YEAR ENDED JUNE 30, 2015 A COMPONENT
McLennan County Junior College District Annual Financial Report August 31, 2013 and 2012
 McLennan County Junior College District Annual Financial Report August 31, 2013 and 2012 Introductory Section McLennan County Junior College District Table of Contents Exhibit / Schedule Page Introductory
CARROLL COMMUNITY COLLEGE FINANCIAL STATEMENTS YEARS ENDED JUNE 30, 2017 AND 2016
 FINANCIAL STATEMENTS YEARS ENDED TABLE OF CONTENTS YEARS ENDED INDEPENDENT AUDITORS REPORT 1 MANAGEMENT S DISCUSSION AND ANALYSIS 3 FINANCIAL STATEMENTS STATEMENTS OF NET POSITION (DEFICIT) 13 STATEMENTS
JOHNSON COUNTY COMMUNITY COLLEGE FINANCIAL STATEMENTS JUNE 30, 2017
 JOHNSON COUNTY COMMUNITY COLLEGE FINANCIAL STATEMENTS JUNE 30, 2017 Contents Independent Auditor s Report 1 2 Management s Discussion and Analysis 3 13 Financial Statements Statements of net position 14
MONROE COMMUNITY COLLEGE (A Component Unit of the County of Monroe, New York)
") MONROE COMMUNITY COLLEGE (A Component Unit of the County of Monroe, New York) Financial Statements As of August 31, 2017 and 2016 Together with Independent Auditor s Report MONROE COMMUNITY COLLEGE (A
MONROE COMMUNITY COLLEGE (A Component Unit of the County of Monroe, New York) Financial Statements As of August 31, 2017 and 2016 Together with Independent Auditor s Report MONROE COMMUNITY COLLEGE (A
KENTUCKY STATE UNIVERSITY (A Component Unit of the Commonwealth of Kentucky) FINANCIAL STATEMENTS June 30, 2018
 FINANCIAL STATEMENTS June 30, 2018") (A Component Unit of the Commonwealth of Kentucky) FINANCIAL STATEMENTS FINANCIAL STATEMENTS CONTENTS INDEPENDENT AUDITOR S REPORT... 1 MANAGEMENT'S DISCUSSION AND ANALYSIS... 3 FINANCIAL STATEMENTS KENTUCKY
(A Component Unit of the Commonwealth of Kentucky) FINANCIAL STATEMENTS FINANCIAL STATEMENTS CONTENTS INDEPENDENT AUDITOR S REPORT... 1 MANAGEMENT'S DISCUSSION AND ANALYSIS... 3 FINANCIAL STATEMENTS KENTUCKY
Audited Financial Statements Stanly Community College Albemarle, North Carolina As of and for the Year Ended June 30, 2014
 Audited Financial Statements Stanly Community College Albemarle, North Carolina As of and for the Year Ended June 30, 2014 TABLE OF CONTENTS Pages Independent Auditors' Report 1-2 Management's Discussion
CARROLL COMMUNITY COLLEGE FINANCIAL STATEMENTS JUNE 30, 2016 AND 2015
 FINANCIAL STATEMENTS TABLE OF CONTENTS YEARS ENDED INDEPENDENT AUDITORS REPORT 1 MANAGEMENT S DISCUSSION AND ANALYSIS 3 FINANCIAL STATEMENTS STATEMENTS OF NET POSITION (DEFICIT) 12 STATEMENTS OF REVENUES,
Kent State University (a component unit of the State of Ohio)
") Kent State University (a component unit of the State of Ohio) Financial Report Including Supplementary Information June 30, 2016 Table of Contents June 30, 2016 and 2015 Page(s) Management s Discussion
Kent State University (a component unit of the State of Ohio) Financial Report Including Supplementary Information June 30, 2016 Table of Contents June 30, 2016 and 2015 Page(s) Management s Discussion
SOUTHEAST MISSOURI STATE UNIVERSITY FINANCIAL STATEMENTS JUNE 30, 2016
 SOUTHEAST MISSOURI STATE UNIVERSITY FINANCIAL STATEMENTS JUNE 30, 2016 Contents Page Independent Auditors Report... 1-3 Management s Discussion And Analysis... 4-13 Financial Statements Statement Of Net
FINANCIAL STATEMENTS University of South Alabama Year ended September 30, 2002 with Report of Independent Auditors
 FINANCIAL STATEMENTS University of South Alabama Year ended September 30, 2002 with Report of Independent Auditors Financial Statements Year ended September 30, 2002 Contents Management s Discussion and
HARFORD COMMUNITY COLLEGE COMPONENT UNIT FINANCIAL STATEMENTS AND SINGLE AUDIT COMPLIANCE REPORTS YEAR ENDED JUNE 30, 2013
 COMPONENT UNIT FINANCIAL STATEMENTS AND SINGLE AUDIT COMPLIANCE REPORTS YEAR ENDED TABLE OF CONTENTS YEAR ENDED INDEPENDENT AUDITORS REPORT 1 MANAGEMENT DISCUSSION AND ANALYSIS (UNAUDITED) 4 FINANCIAL
Oklahoma Panhandle State University
 Oklahoma Panhandle State University An Organizational Unit of the Board of Regents For the Oklahoma Agricultural and Mechanical Colleges Financial Statements with Independent Auditors Reports June 30,
Cleveland State University (a component unit of the State of Ohio) Financial Report Including Supplemental Information June 30, 2017
 Financial Report Including Supplemental Information June 30, 2017") Cleveland State University (a component unit of the State of Ohio) Financial Report Including Supplemental Information June 30, 2017 Contents Report of Independent Auditors 1-3 Management s Discussion
Cleveland State University (a component unit of the State of Ohio) Financial Report Including Supplemental Information June 30, 2017 Contents Report of Independent Auditors 1-3 Management s Discussion
The William Paterson University of New Jersey
 The William Paterson University of New Jersey (A Component Unit of the State of New Jersey) Financial Statements and Management s Discussion and Analysis Table of Contents Page Independent Auditors Report
UNIVERSITY OF ALASKA
 UNIVERSITY OF ALASKA (A Component Unit of the State of Alaska) Financial Statements (With Independent Auditors Report Thereon) University of Alaska (A Component Unit of the State of Alaska) Financial Statements
JOHNSTON COMMUNITY COLLEGE
 STATE OF NORTH CAROLINA OFFICE OF THE STATE AUDITOR BETH A. WOOD, CPA JOHNSTON COMMUNITY COLLEGE SMITHFIELD, NORTH CAROLINA FINANCIAL STATEMENT AUDIT REPORT FOR THE YEAR ENDED JUNE 30, 2017 A COMPONENT
Kanawha Valley Community and Technical College
 Kanawha Valley Community and Technical College Financial Statements Years Ended June 30, 2013 and 2012 and Independent Auditor s Reports TABLE OF CONTENTS INDEPENDENT AUDITOR S REPORT 3-4 MANAGEMENT S
PASADENA AREA COMMUNITY COLLEGE DISTRICT ANNUAL FINANCIAL REPORT JUNE
 ' PASADENA CITY COLLEGE PASADENA AREA COMMUNITY COLLEGE DISTRICT ANNUAL FINANCIAL REPORT TABLE OF CONTENTS FINANCIAL SECTION Independent Auditor's Report 2 Management's Discussion and Analysis 5 Basic
Oklahoma Panhandle State University
 Oklahoma Panhandle State University Financial Statements with Independent Auditors Reports June 30, 2017 and 2016 Contents Independent Auditor s Report 1 2 Management s Discussion and Analysis (Unaudited)
c c STATE TECHNICAL COLLEGE OF MISSOURI (A Component Unit of the State of Missouri) Linn, Missouri INDEPENDENT AUDITORS REPORT
 Linn, Missouri INDEPENDENT AUDITORS REPORT") STATE TECHNICAL COLLEGE OF MISSOURI Linn, Missouri INDEPENDENT AUDITORS REPORT y ;ÿ* I 2 * c c INDEPENDENT AUDITORS REPORT. TABLE OF CONTENTS MANAGEMENT S DISCUSSION AND ANALYSIS. PAGE 1-3 4-12 BASIC FINANCIAL
STATE TECHNICAL COLLEGE OF MISSOURI Linn, Missouri INDEPENDENT AUDITORS REPORT y ;ÿ* I 2 * c c INDEPENDENT AUDITORS REPORT. TABLE OF CONTENTS MANAGEMENT S DISCUSSION AND ANALYSIS. PAGE 1-3 4-12 BASIC FINANCIAL
Kalamazoo Valley Community College. Financial Report with Supplemental Information June 30, 2017
 Financial Report with Supplemental Information June 30, 2017 Contents Report Letter 1-2 Management s Discussion and Analysis 3-12 Basic Financial Statements Statement of Net Position 13 Statement of Revenue,
MITCHELL COMMUNITY COLLEGE
 STATE OF NORTH CAROLINA OFFICE OF THE STATE AUDITOR BETH A. WOOD, CPA MITCHELL COMMUNITY COLLEGE STATESVILLE, NORTH CAROLINA FINANCIAL STATEMENT AUDIT REPORT FOR THE YEAR ENDED JUNE 30, 2015 A COMPONENT
TRUMAN STATE UNIVERSITY A COMPONENT UNIT OF THE STATE OF MISSOURI FINANCIAL STATEMENTS JUNE 30, 2017
 A COMPONENT UNIT OF THE STATE OF MISSOURI FINANCIAL STATEMENTS JUNE 30, 2017 Contents Page Independent Auditors Report... 1-2 Management s Discussion And Analysis... 3-12 Financial Statements Statement
WASHBURN UNIVERSITY OF TOPEKA FINANCIAL STATEMENTS JUNE 30, 2011
 FINANCIAL STATEMENTS JUNE 30, 2011 Index Page Independent Auditors Report... 1-2 Management s Discussion And Analysis... 3-24 Financial Statements Statements Of Net Assets... 25-26 Statements Of Financial
Financial Statements. C.S. Mott Community College Flint, Michigan. June 30, 2012 and 2011
 Financial Statements C.S. Mott Community College Flint, Michigan June 30, 2012 and 2011 Table of Contents Page Independent Auditor s Report 1-2 Management s Discussion and Analysis 3-20 Financial Statements:
WINSTON-SALEM STATE UNIVERSITY
 STATE OF NORTH f CAROLINA OFFICE OF THE STATE AUDITOR BETH A. WOOD, CPA WINSTON-SALEM STATE UNIVERSITY WINSTON-SALEM, NORTH CAROLINA FINANCIAL STATEMENT AUDIT REPORT FOR THE YEAR ENDED JUNE 30, 2017 A
STATE OF MISSISSIPPI INSTITUTIONS OF HIGHER LEARNING. Financial Statements. June 30, 2018
 STATE OF MISSISSIPPI INSTITUTIONS OF HIGHER LEARNING Financial Statements CLAconnect.com WEALTH ADVISORY OUTSOURCING AUDIT, TAX, AND CONSULTING Financial Statements (THIS PAGE LEFT BLANK INTENTIONALLY)
ALLAN HANCOCK JOINT COMMUNITY COLLEGE DISTRICT ANNUAL FINANCIAL REPORT JUNE 30, 2017
 ALLAN HANCOCK JOINT COMMUNITY COLLEGE DISTRICT ANNUAL FINANCIAL REPORT TABLE OF CONTENTS FINANCIAL SECTION Independent Auditor's Report 2 Management's Discussion and Analysis 5 Basic Financial Statements
Financial Statements and Reports Required by Uniform Guidance June 30, 2018 and 2017 The University of Oklahoma - Norman Campus
 Financial Statements and Reports Required by Uniform Guidance June 30, 2018 and 2017 The University of Oklahoma - Norman Campus eidebailly.com Table of Contents June 30, 2018 and 2017 Independent Auditor
Graham County Community College District. Annual Financial Report
 Annual Financial Report June 30, 2016 Graham County Community College District Single Audit Reporting Package June 30, 2016 Single audit reporting package Year ended June 30, 2016 Table of Contents Financial
Southern West Virginia Community and Technical College
 Southern West Virginia Community and Technical College Financial Statements for the Years Ended June 30, 2003 and 2002 and Independent Auditors Reports SOUTHERN WEST VIRGINIA COMMUNITY AND TECHNICAL COLLEGE
SAN FRANCISCO STATE UNIVERSITY. Financial Statements. June 30, (With Independent Auditors Report Thereon)
") Financial Statements (With Independent Auditors Report Thereon) Table of Contents Page(s) Independent Auditors Report 1 2 Management s Discussion and Analysis (Unaudited) 3 14 Financial Statements: Statement
Financial Statements (With Independent Auditors Report Thereon) Table of Contents Page(s) Independent Auditors Report 1 2 Management s Discussion and Analysis (Unaudited) 3 14 Financial Statements: Statement
UNIVERSITY OF ALASKA
 UNIVERSITY OF ALASKA (A Component Unit of the State of Alaska) Financial Statements (With Independent Auditors Report Thereon) University of Alaska (A Component Unit of the State of Alaska) Financial Statements
HARFORD COMMUNITY COLLEGE COMPONENT UNIT FINANCIAL STATEMENTS AND SINGLE AUDIT COMPLIANCE REPORTS YEAR ENDED JUNE 30, 2014
 COMPONENT UNIT FINANCIAL STATEMENTS AND SINGLE AUDIT COMPLIANCE REPORTS YEAR ENDED TABLE OF CONTENTS YEAR ENDED INDEPENDENT AUDITORS REPORT 1 MANAGEMENT DISCUSSION AND ANALYSIS (UNAUDITED) 4 FINANCIAL
DURHAM TECHNICAL COMMUNITY COLLEGE
 STATE OF NORTH f CAROLINA OFFICE OF THE STATE AUDITOR BETH A. WOOD, CPA DURHAM TECHNICAL COMMUNITY COLLEGE DURHAM, NORTH CAROLINA FINANCIAL STATEMENT AUDIT REPORT FOR THE YEAR ENDED JUNE 30, 2017 A COMPONENT
SOUTH PIEDMONT COMMUNITY COLLEGE
 STATE OF NORTH CAROLINA OFFICE OF THE STATE AUDITOR BETH A. WOOD, CPA SOUTH PIEDMONT COMMUNITY COLLEGE POLKTON, NORTH CAROLINA FINANCIAL STATEMENT AUDIT REPORT FOR THE YEAR ENDED JUNE 30, 2017 A COMPONENT
UNIVERSITY OF SOUTH ALABAMA (A Component Unit of the State of Alabama)
") Basic Financial Statements and Single Audit Reporting in Accordance with the Uniform Guidance Table of Contents Management s Discussion and Analysis (Unaudited) 1 Independent Auditors Report 15 Basic Financial
Basic Financial Statements and Single Audit Reporting in Accordance with the Uniform Guidance Table of Contents Management s Discussion and Analysis (Unaudited) 1 Independent Auditors Report 15 Basic Financial
Cleveland State University (a component unit of the State of Ohio) Financial Report with Supplemental Information June 30, 2018
 Financial Report with Supplemental Information June 30, 2018") Cleveland State University (a component unit of the State of Ohio) Financial Report with Supplemental Information June 30, 2018 Contents Independent Auditor s Report 1-3 Management s Discussion and Analysis
Cleveland State University (a component unit of the State of Ohio) Financial Report with Supplemental Information June 30, 2018 Contents Independent Auditor s Report 1-3 Management s Discussion and Analysis
UNIVERSITY OF SOUTH ALABAMA (A Component Unit of the State of Alabama)
") Basic Financial Statements and Supplementary Information on Federal Awards Programs Table of Contents Management s Discussion and Analysis (Unaudited) 1 Independent Auditors Report 13 Basic Financial Statements:
Basic Financial Statements and Supplementary Information on Federal Awards Programs Table of Contents Management s Discussion and Analysis (Unaudited) 1 Independent Auditors Report 13 Basic Financial Statements:
Audited Financial Statements and Other Financial Information. June 30, 2016
 Audited Financial Statements and Other Financial Information June 30, 2016 AUDITED FINANCIAL STATEMENTS AND OTHER FINANCIAL INFORMATION JUNE 30, 2016 CONTENTS Audited Financial Statements Management s
AUDITED FINANCIAL STATEMENTS REQUIRED SUPPLEMENTAL INFORMATION OTHER FINANCIAL INFORMATION AND SUPPLEMENTAL REPORTS COMMUNITY COLLEGE DISTRICT OF
 AUDITED FINANCIAL STATEMENTS REQUIRED SUPPLEMENTAL INFORMATION OTHER FINANCIAL INFORMATION AND SUPPLEMENTAL REPORTS COMMUNITY COLLEGE DISTRICT OF GOGEBIC COUNTY IRONWOOD, MICHIGAN June 30, 2015 CONTENTS
BOARD OF EDUCATION OF CARROLL COUNTY MANAGEMENT S DISCUSSION AND ANALYSIS, FINANCIAL STATEMENTS AND REQUIRED SUPPLEMENTARY INFORMATION
 MANAGEMENT S DISCUSSION AND ANALYSIS, FINANCIAL STATEMENTS AND REQUIRED SUPPLEMENTARY INFORMATION YEAR ENDED TABLE OF CONTENTS YEAR ENDED INDEPENDENT AUDITORS REPORT 1 MANAGEMENT S DISCUSSION AND ANALYSIS
Fairmont State University
 Fairmont State University Financial Statements Years Ended June 30, 2017 and 2016 and Independent Auditor s Reports TABLE OF CONTENTS INDEPENDENT AUDITOR S REPORT 3-4 MANAGEMENT S DISCUSSION AND ANALYSIS
NORTH CAROLINA SCHOOL OF SCIENCE
 STATE OF NORTH CAROLINA OFFICE OF THE STATE AUDITOR BETH A. WOOD, CPA NORTH CAROLINA SCHOOL OF SCIENCE AND MATHEMATICS DURHAM, NORTH CAROLINA FINANCIAL STATEMENT AUDIT REPORT FOR THE YEAR ENDED JUNE 30,
EL CAMINO COMMUNITY COLLEGE DISTRICT ANNUAL FINANCIAL REPORT JUNE 30, 2017
 EL CAMINO COMMUNITY COLLEGE DISTRICT ANNUAL FINANCIAL REPORT TABLE OF CONTENTS FINANCIAL SECTION Independent Auditor's Report 2 Management's Discussion and Analysis 5 Basic Financial Statements - Primary
STATE OF NORTH CAROLINA
 STATE OF NORTH CAROLINA WINSTON-SALEM STATE UNIVERSITY WINSTON-SALEM, NORTH CAROLINA FINANCIAL STATEMENT AUDIT REPORT FOR THE YEAR ENDED JUNE 30, 2012 OFFICE OF THE STATE AUDITOR BETH A. WOOD, CPA STATE
SAN JOSÉ/EVERGREEN COMMUNITY COLLEGE DISTRICT. FINANCIAL STATEMENTS June 30, 2015
 SAN JOSÉ/EVERGREEN COMMUNITY COLLEGE DISTRICT FINANCIAL STATEMENTS June 30, 2015 FINANCIAL STATEMENTS WITH SUPPLEMENTARY INFORMATION For the Year Ended June 30, 2015 TABLE OF CONTENTS Page Independent
RANCHO SANTIAGO COMMUNITY COLLEGE DISTRICT ORANGE COUNTY
 ORANGE COUNTY REPORT ON AUDIT OF FINANCIAL STATEMENTS AND SUPPLEMENTARY INFORMATION INCLUDING REPORTS ON COMPLIANCE June 30, 2017 TABLE OF CONTENTS June 30, 2017 INDEPENDENT AUDITOR S REPORT MANAGEMENT'S
FINANCIAL STATEMENT REPORT
 FINANCIAL STATEMENT REPORT FOR THE YEAR ENDED TABLE OF CONTENTS INDEPENDENT AUDITOR S REPORT... 1 MANAGEMENT S DISCUSSION AND ANALYSIS... 3 FINANCIAL STATEMENTS COLLEGE EXHIBITS A-1 STATEMENT OF NET POSITION...
Ohio University (a component unit of the State of Ohio) Financial Statements June 30, 2017 and 2016
 Financial Statements June 30, 2017 and 2016") (a component unit of the State of Ohio) Financial Statements Contents Independent Auditor s Report 1-3 Financial Statements Management s Discussion and Analysis 4-12 Statements of Net Position 13-14 Statements
(a component unit of the State of Ohio) Financial Statements Contents Independent Auditor s Report 1-3 Financial Statements Management s Discussion and Analysis 4-12 Statements of Net Position 13-14 Statements
INDEPENDENT AUDITORS REPORT 1 MANAGEMENT S DISCUSSION AND ANALYSIS Statements of Net Assets 11
 University of Idaho Financial Statements for the Years Ended June 30, 2003 and 2002 and Independent Auditors Report Including Single Audit Reports for the Year Ended June 30, 2003 UNIVERSITY OF IDAHO TABLE
LOS ANGELES COMMUNITY COLLEGE DISTRICT. June 30, 2011
 June 30, 2011 Los Angeles County, California: East Los Angeles College Los Angeles City College Los Angeles Harbor College Los Angeles Mission College Pierce College Los Angeles Southwest College Los Angeles
STATE OF NORTH CAROLINA
 STATE OF NORTH CAROLINA WINSTON-SALEM STATE UNIVERSITY WINSTON-SALEM, NORTH CAROLINA FINANCIAL STATEMENT AUDIT REPORT FOR THE YEAR ENDED JUNE 30, 2010 OFFICE OF THE STATE AUDITOR BETH A. WOOD, CPA STATE
West Virginia School of Osteopathic Medicine
 West Virginia School of Osteopathic Medicine Financial Statements Years Ended June 30, 2016 and 2015 and Independent Auditor s Reports TABLE OF CONTENTS INDEPENDENT AUDITOR S REPORT 3-4 MANAGEMENT S DISCUSSION
AUDITED FINANCIAL STATEMENTS REQUIRED SUPPLEMENTAL INFORMATION OTHER FINANCIAL INFORMATION AND SUPPLEMENTAL REPORTS COMMUNITY COLLEGE DISTRICT OF
 AUDITED FINANCIAL STATEMENTS REQUIRED SUPPLEMENTAL INFORMATION OTHER FINANCIAL INFORMATION AND SUPPLEMENTAL REPORTS COMMUNITY COLLEGE DISTRICT OF GOGEBIC COUNTY IRONWOOD, MICHIGAN June 30, 2016 CONTENTS
Missouri Southern State University (A Component Unit of the State of Missouri) Independent Auditor s Reports and Financial Statements
 Independent Auditor s Reports and Financial Statements") (A Component Unit of the State of Missouri) Independent Auditor s Reports and Financial Statements Contents Independent Auditor s Report... 1 Management s Discussion and Analysis... 3 Financial Statements
(A Component Unit of the State of Missouri) Independent Auditor s Reports and Financial Statements Contents Independent Auditor s Report... 1 Management s Discussion and Analysis... 3 Financial Statements