BLUEFIELD STATE COLLEGE FINANCIAL STATEMENTS YEARS ENDED JUNE 30, 2018 AND 2017
|
|
|
- Jean Elliott
- 5 years ago
- Views:
Transcription
1
2
3 FINANCIAL STATEMENTS YEARS ENDED JUNE 30, 2018 AND 2017
4 TABLE OF CONTENTS YEARS ENDED JUNE 30, 2018 INDEPENDENT AUDITORS REPORT 1 MANAGEMENT S DISCUSSION AND ANALYSIS (RSI) (UNAUDITED) 3 FINANCIAL STATEMENTS STATEMENTS OF NET POSITION 12 STATEMENTS OF REVENUES, EXPENSES, AND CHANGES IN NET POSITION 13 STATEMENTS OF CASH FLOWS 14 COMPONENT UNIT STATEMENTS OF NET POSITION FOUNDATION 15 COMPONENT UNIT STATEMENTS OF ACTIVITIES FOUNDATION JUNE 30, COMPONENT UNIT STATEMENTS OF ACTIVITIES FOUNDATION JUNE 30, COMPONENT UNIT STATEMENTS OF FINANCIAL POSITION RESEARCH AND DEVELOPMENT CORPORATION 18 COMPONENT UNIT STATEMENTS OF ACTIVITIES RESEARCH AND DEVELOPMENT CORPORATION 19 NOTES TO FINANCIAL STATEMENTS 20 REQUIRED SUPPLEMENTARY INFORMATION SCHEDULES OF PROPORTIONATE SHARE OF NET PENSION LIABILITY AND CONTRIBUTIONS 76 SCHEDULES OF PROPORTIONATE SHARE OF OTHER POSTEMPLOYMENT BENEFITS, LIABILITY, AND CONTRIBUTIONS 77 INDEPENDENT AUDITORS REPORT ON INTERNAL CONTROL OVER FINANCIAL REPORTING AND ON COMPLIANCE AND OTHER MATTERS BASED ON AN AUDIT OF FINANCIAL STATEMENTS PERFORMED IN ACCORDANCE WITH GOVERNMENT AUDITING STANDARDS 78 SCHEDULE OF FINDINGS AND RECOMMENDATIONS 80
5 INDEPENDENT AUDITORS REPORT Board of Governors Bluefield State College Bluefield, West Virginia Report on the Financial Statements We have audited the accompanying financial statements of the business-type activities and the aggregate discretely presented component units of Bluefield State College (the College), a component unit of the West Virginia Higher Education Fund as of and for the years ended June 30, 2018 and 2017, and the related notes to the financial statements, which collectively comprise the College's basic financial statements, as listed in the table of contents. Management s Responsibility for the Financial Statements Management is responsible for the preparation and fair presentation of these financial statements in accordance with accounting principles generally accepted in the United States of America; this includes the design, implementation, and maintenance of internal control relevant to the preparation and fair presentation of financial statements that are free from material misstatement, whether due to fraud or error. Auditor s Responsibility Our responsibility is to express opinions on these financial statements based on our audits. We did not audit the discretely presented component unit of Bluefield State College Foundation, Inc. (a component unit of the College) or Bluefield State College Research and Development Corporation (a component unit of the College) for the years ended June 30, 2018 and 2017, which represent 100% of the total assets, total net assets and total revenues of the component units. Those statements were audited by other auditors whose reports have been furnished to us, and our opinion, insofar as it relates to the amounts included for the Bluefield State College Foundation, Inc., and Bluefield State College Research and Development Corporation is based solely on the reports of the other auditors. We conducted our audit in accordance with auditing standards generally accepted in the United States of America and the standards applicable to financial audits contained in Government Auditing Standards, issued by the Comptroller General of the United States. The financial statements of the Bluefield State College Foundation, Inc. and Bluefield State College Research and Development Corporation were not audited in accordance with Government Auditing Standards. Those standards require that we plan and perform the audit to obtain reasonable assurance about whether the financial statements are free from material misstatement. An audit involves performing procedures to obtain audit evidence about the amounts and disclosures in the financial statements. The procedures selected depend on the auditor s judgment, including the assessment of the risks of material misstatement of the financial statements, whether due to fraud or error. In making those risk assessments, the auditor considers internal control relevant to the entity s preparation and fair presentation of the financial statements in order to design audit procedures that are appropriate in the circumstances, but not for the purpose of expressing an opinion on the effectiveness of the entity s internal control. Accordingly, we express no such opinion. An audit also includes evaluating the appropriateness of accounting policies used and the reasonableness of significant accounting estimates made by management, as well as evaluating the overall presentation of the financial statements. (1)
6 Board of Governors Bluefield State College We believe that the audit evidence we have obtained is sufficient and appropriate to provide a basis for our audit opinions. Opinions In our opinion, based on our audit and the report of the other auditors, the financial statements referred to above present fairly, in all material respects, the respective financial position of the business-type activities and the aggregate discretely presented component units of the College as of June 30, 2018 and 2017, and the respective changes in financial position, and, where applicable, cash flows, thereof for the years then ended in conformity with accounting principles generally accepted in the United States of America. Emphasis of Matter As discussed in Note 2 to the financial statements, the University implemented the provisions of Governmental Accounting Standards Board (GASB) Statements No. 75 Accounting and Financial Reporting for Postemployment Benefits Other Than Pensions for the year ended June 30, 2018, which represents a change in accounting principle. As of July 1, 2017, the University s net position was restated to reflect the impact of adoption. A summary of the restatement is presented in Note 2. Our opinion is not modified with respect to this matter. Other Matters Required Supplementary Information Accounting principles generally accepted in the United States of America require that the management s discussion and analysis, schedule of proportionate share of TRS net pension liability and TRS schedule of contributions, as listed in the table of contents, be presented to supplement the basic financial statements. Such information, although not a part of the basic financial statements, is required by the Governmental Accounting Standards Board who considers it to be an essential part of financial reporting for placing the basic financial statements in an appropriate operational, economic, or historical context. We have applied certain limited procedures to the required supplementary information in accordance with auditing standards generally accepted in the United States of America, which consisted of inquiries of management about the methods of preparing the information and comparing the information for consistency with management s responses to our inquiries, the basic financial statements, and other knowledge we obtained during our audit of the basic financial statements. We do not express an opinion or provide any assurance on the information because the limited procedures do not provide us with sufficient evidence to express an opinion or provide any assurance. Other Reporting Required by Government Auditing Standards In accordance with Government Auditing Standards, we have also issued our report dated October 23, 2018, on our consideration of the College's internal control over financial reporting and on our tests of its compliance with certain provisions of laws, regulations, contracts, and grant agreements and other matters. The purpose of that report is solely to describe the scope of our testing of internal control over financial reporting and compliance and the result of that testing, and not to provide an opinion on the effectiveness of internal control over financial reporting or on compliance. That report is an integral part of an audit performed in accordance with Government Auditing Standards in considering the College s internal control over financial reporting and compliance. CliftonLarsonAllen LLP Plymouth Meeting, Pennsylvania October 23, 2018 (2)
7 MANAGEMENT S DISCUSSION AND ANALYSIS YEARS ENDED JUNE 30, 2018 AND 2017 Our discussion and analysis of Bluefield State College s (the College) financial performance provides an overview of the College's financial activities during the years ended June 30, 2018, 2017, and Since this discussion and analysis is designed to focus on current activities, resulting changes, and currently known facts, please refer to the College s basic financial statements on pages 12 to 19 and the notes to financial statements on pages 20 to 75. During the fiscal year 2003, the College adopted Governmental Accounting Standards Board (GASB) Statement No. 39, Determining Whether Certain Organizations are Component Units, and an amendment to GASB Statement No. 14. As a result, the audited financial statements of the Bluefield State College Foundation, Incorporated (the Foundation) are presented here with the College s financial statements for the fiscal years ended June 30, 2018 and For the years ended June 30, 2018 and 2017, the College determined that the Bluefield State College Research and Development Corporation (the Corporation) resources were significant and required presentation in accordance with the GASB statements. The Foundation and the Corporation are private nonprofit organizations that report under Financial Accounting Standards Board (FASB) standards. As such, certain revenue recognition criteria and presentation features are different from GASB revenue recognition criteria and presentation features. Complete financial statements of the Foundation can be obtained from the Treasurer of the Bluefield State College Foundation at 1629 College Drive, Bluefield, West Virginia Complete financial statements of the Corporation can be obtained from the Bluefield State College Research and Development Corporation at 219 Rock Street, Bluefield, West Virginia Financial Highlights from Bluefield State College The following are brief summaries for the College: The College s assets and deferred outflows of resources exceeded its liabilities at the end of fiscal year 2018 by approximately $9.7 million, compared to approximately $9.4 million and $10.5 million in 2017 and 2016, respectively. The other postemployment benefits (OPEB) liability at fiscal year-end 2018 was approximately $4.5 million, all recorded as unrestricted. The net pension liability that was added for the first time in FY 2015 for GASB 68 decreased approx. $0.3 million in FY 2018 from FY 2017 to reflect the College s portion of the increase in the Teacher s Retirement System liability (See Notes 2 and 11). Overview of the Financial Statements The College has implemented GASB Statement No. 35, Basic Financial Statements and Management s Discussion and Analysis for Public Colleges and Universities beginning with fiscal year GASB No. 35 requires the College to present financial information as a whole rather than focusing on individual funds. Two major changes were the recording of depreciation for capital assets and reclassifying certain loan program equity balances as liabilities. In addition, federal and state loan and grant programs are no longer reported as revenues and expenses in the financial statements since the transactions are directly with the student receiving the loan or grant. (3)
8 MANAGEMENT S DISCUSSION AND ANALYSIS YEARS ENDED JUNE 30, 2018 AND 2017 This report consists of management s discussion and analysis, the basic financial statements, and the notes to the financial statements. The basic financial statements include the statement of net position; statement of revenues, expenses and changes in net position; and statement of cash flows. The statement of net position presents the College s assets, deferred outflows of resources, liabilities, and deferred inflows of resources with the difference reported as net position. Increases or decreases in net position can be an indicator of improvement or deterioration of the College s financial position. Changes in net position during the year are reported in the statement of revenues, expenses, and changes in net position. All revenues, expenses, and changes are reported as the underlying event occurs that results in the revenue, expense, or change. The statement of cash flows presents information on actual cash inflows or outflows as they occur. Financial Analysis of the College Of the College s net position of approximately $9.7 million, $15.5 million represents its net investment in capital assets of land, land improvements, buildings, equipment, and library books. These capital assets are utilized to provide educational and related services to students and the communities and are not available for future spending. Unrestricted net position is available to meet the College s obligations. The unrestricted net position increased to a reduce deficit of approximately ($6.3) million compared to ($7.2) million in There is approximately $4.5 million of unrestricted assets related to OPEB liability. The State of West Virginia has adopted a plan for elimination of the OPEB liability by 2035 for all state agencies. The unrestricted cash represents the amount not restricted via plant operations, auxiliaries, grant and loan funds, and state code restrictions. The College s net position from 2018 and 2017 increased by approximately $0.3 million with net capital assets decreasing by approximately $0.4 million. (4)
9 MANAGEMENT S DISCUSSION AND ANALYSIS YEARS ENDED JUNE 30, 2018 AND 2017 Condensed Statements of Net Position June 30, 2018, 2017, and 2016 (in millions) Cash $ 1.6 $ 1.0 $ 1.0 Other Current Assets Total Current Assets Capital Assets Other Noncurrent Assets Total Noncurrent Assets Total Assets Deferred Outflows of Resources Total $ 19.5 $ 19.1 $ 19.9 Current Liabilities $ 3.2 $ 2.3 $ 2.2 Noncurrent Liabilities Total Liabilities Deferred Inflows of Resources Net Position: Net Investment in Capital Assets Restricted Unrestricted (Deficit) (6.2) (7.2) (7.1) Total Net Position Total $ 19.5 $ 19.1 $ 19.9 For the year ended June 30, 2018 there was an increase of approximately $0.5 million in net position. The OPEB liability as of June 30, 2018 was approximately $4.5 million compared to the approximately $6.1 million at June 30, Total assets and deferred outflows of resources increased by $0.7 million. Total liabilities and deferred inflows of resources increased approximately $0.5 million mainly due to a decrease of approximately. $1.6 million in the OPEB liability. (5)
10 MANAGEMENT S DISCUSSION AND ANALYSIS YEARS ENDED JUNE 30, 2018 AND 2017 The following table summarizes the operating results and non-operating revenue for the past three fiscal years. Condensed Statements of Revenues, Expenses, and Changes in Net Position Years Ended June 30, 2018, 2017, and 2016 (in millions) Operating Revenues: Tuition and Fees $ 4.1 $ 4.2 $ 4.1 Contracts and Grants Auxiliary Other Less: Operating Expenses Operating Loss (10.1) (10.4) (12.1) Nonoperating Revenues (Expenses): State Appropriations Federal Pell Grants Other Net Nonoperating Revenue Loss Before Other Revenues, Expenses, Gains, and Losses (0.5) (1.1) (2.5) Capital Proceeds from the Commission Restatement July 1, 2017 OPEB Liability 0.8 Total Change in Net Position $ (0.3) $ (1.1) $ (2.5) Gross tuition and fees decreased slightly to $4.1 in 2018 from approximately $4.2 million in The scholarship allowance increased from approximately $5.1 million in 2017 to approximately $5.6 million in Total operating expenses increased slightly from 2017 from $20.8 million to $21.0 million in (6)
11 MANAGEMENT S DISCUSSION AND ANALYSIS YEARS ENDED JUNE 30, 2018 AND 2017 Revenue Sources Years Ended June 30, 2018, 2017, and 2016 (in millions) Student Tuition and Fees $ 4.1 $ 4.2 $ 4.1 Contracts and Grants State Appropriations Auxiliary Federal Pell Grants Capital Projects and Bond Proceeds Other Total Revenue Sources $ 20.1 $ 19.6 $ 19.6 (7)
12 MANAGEMENT S DISCUSSION AND ANALYSIS YEARS ENDED JUNE 30, 2018 AND 2017 Operating Expenses Years Ended June 30, 2018, 2017, and 2016 (in millions) Natural Classification Salaries and Wages $ 10.4 $ 10.7 $ 10.9 Benefits Supplies and Other Services Utilities Scholarships and Fellowships Depreciation Fees Assigned by Commission $ 21.0 $ 20.9 $ 22.0 (8)
13 MANAGEMENT S DISCUSSION AND ANALYSIS YEARS ENDED JUNE 30, 2018 AND 2017 Functional Classification Instruction $ 8.0 $ 7.8 $ 8.0 Research Public Service Academic Support Student Services Institutional Support Operation and Maintenance of Plant Student Financial Aid Auxiliary Enterprises and Other Depreciation $ 21.0 $ 20.9 $ 22.1 (9)
14 MANAGEMENT S DISCUSSION AND ANALYSIS YEARS ENDED JUNE 30, 2018 AND 2017 The statement of cash flows presents detailed information about the cash activities of Bluefield State College during the year. The statement is divided into five parts. The first section deals with operating cash flows and shows the net cash used in the operating activities. The second section reflects cash flows from noncapital financing activities. This section reflects the cash received and spent for nonoperating, noninvesting, and noncapital financing purposes. The third section deals with the cash flows from capital and related financing activities. This section deals with the cash used for the acquisition and construction of capital assets and related items and related funding received. The fourth section reflects the cash flows from investing activities and shows interest received from investing activities, and purchases and sales of investments. The fifth section reconciles the net cash used in operating activities to the operating loss reflected in the statement of revenues, expenses, and changes in net position. Cash and cash equivalents decreased by approximately $0.1 million for the year ended June 30, Condensed Statements of Cash Flows Years Ended June 30, 2018, 2017, and 2016 (in millions) Cash Provided by (Used in): Operating Activities $ (7.6) $ (8.8) $ (10.1) Non Capital Financing Activities Capital Financing Activities 1.0 (0.4) (0.3) Investing Activities Increase (Decrease) in Cash and Cash Equivalents 0.6 (0.1) (0.9) Cash and Cash Equivalents - Beginning of Year Cash and Cash Equivalents - End of Year $ 1.6 $ 1.0 $ 1.1 Capital Asset and Debt Administration The debt service obligation payable to the Commission for the College for the years ended June 30, 2018, 2017, and 2016 was approximately $103 thousand, $143 thousand, and $184 thousand, respectively. The College entered into a loan agreement with the Commission during fiscal year 2011 to fund capital projects. The outstanding balance on the loan at June 30, 2018 was approximately $103 thousand. The following is a brief summary of capital asset activity for the College as a whole: Construction in progress (CIP) additions of $0.4 million due to Student Housing/Parking Plaza. There was $0.02 million in purchases towards buildings in fiscal year There were no disposals of land or buildings during fiscal year Equipment purchases totaled $0.6 million and disposals of equipment during the year were $0.1 million. Library book purchases were $0.002 million. Depreciation expense was $1.4 million. Readers interested in more detailed information regarding capital assets and debt administration should review the accompanying Notes 7 and 8 to the financial statements. (10)
15 MANAGEMENT S DISCUSSION AND ANALYSIS YEARS ENDED JUNE 30, 2018 AND 2017 Economic Outlook The College s overall financial position is stable. The College s enrollment is stabilizing. With the national economy continuing to be challenging, the College continues to be mindful of our students, keeping tuition at the level lowest in the State for baccalaureate institutions, and competitive with nearby Virginia counties. The Other Postemployment Benefit liability also will continue to be a challenge for a few years until the liability is fully funded. We are very appreciative for the State of West Virginia addressing this issue. Contacting the College s Financial Management This financial report is designed to provide a general overview of Bluefield State College s finances. Questions concerning any of the information provided in this report should be addressed to the Vice President of Financial and Administrative Affairs at Bluefield State College, 219 Rock Street, Bluefield, West Virginia (11)
16 STATEMENTS OF REVENUES, EXPENSES, AND CHANGES IN NET POSITION YEARS ENDED JUNE 30, 2018 AND ASSETS CURRENT ASSETS Cash and Cash Equivalents $ 1,598,287 $ 994,047 Accounts Receivable, Net of Allowance of $1,458,540 and $1,216,874, Respectively 816, ,657 Prepaid Expenses 3,201 2,974 Due from the Commission 10,691 5,393 Inventories 198, ,639 Total Current Assets 2,627,937 2,026,710 NONCURRENT ASSETS Cash and Cash Equivalents - Restricted 146, ,018 Investments 511, ,015 Loans Receivable, Net of Allowance of $104,129 and $116,512, Respectively 46,447 36,276 Capital Assets, Net of Accumulated Depreciation 15,599,993 16,055,363 Total Noncurrent Assets 16,303,914 16,722,672 Total Assets 18,931,851 18,749,382 DEFERRED OUTFLOWS OF RESOURCES Deferred Outflows OPEB 381,097 - Deferred Outflows TRS Plan 171, ,008 Total Deferred Outflows of Resources 552, ,008 Total Assets and Deferred Outflows of Resources $ 19,484,780 $ 19,032,390 LIABILITIES, DEFERRED INFLOWS, AND NET POSITION CURRENT LIABILITIES Accounts Payable $ 1,792,996 $ 768,687 Due to the Commission 1,350 4,750 Accrued Liabilities 951, ,719 Unearned Revenue 120, ,968 Compensated Absences, Current Portion 351, ,141 Debt Service Obligation Payable to the Commission, Current Portion 41,000 41,000 Total Current Liabilities 3,259,097 2,264,265 NONCURRENT LIABILITIES Advances from Federal Sponsors 107,254 95,335 Compensated Absences 222, ,430 Other Post Employment Benefits Liability 4,480,843 6,066,813 Net Pension Liability 498, ,228 Debt Service Obligation Payable to the Commission, Net of Current Liabilities 61, ,500 Total Noncurrent Liabilities 5,370,677 7,258,306 Total Liabilities 8,629,774 9,522,571 DEFERRED INFLOWS OF RESOURCES Deferred Inflows OPEB 956,916 - Deferred Inflows TRS Plan 240, ,569 Total Deferred Inflows of Resources 1,197, ,569 Total Liabilities and Deferred Inflows of Resources 9,827,614 9,638,140 NET POSITION Net Investment in Capital Assets 15,497,493 15,911,863 Restricted for: Nonexpendable Endowment 552, ,515 Expendable Scholarships 220, ,013 Expendable Loans 85,500 85,959 Expendable Grants (438,849) (51,236) Unrestricted (Deficit) (6,260,400) (7,196,864) Total Net Position 9,657,166 9,394,250 Total Liabilities, Deferred Inflows, and Net Position $ 19,484,780 $ 19,032,390 (12)
17 STATEMENTS OF REVENUES, EXPENSES, AND CHANGES IN NET POSITION YEARS ENDED JUNE 30, 2018 AND OPERATING REVENUES Student Tuition and Fees (Net of Scholarship Allowance of $5,283,446 AND $5,133,808, Respectively) $ 4,139,271 $ 4,187,954 Contracts and Grants: Federal 3,338,551 3,102,028 State 1,781,162 1,805,266 Private 875, ,086 Interest on Student Loans Receivable Sales and Services of Educational Activities 100,975 77,461 Auxiliary Enterprise Revenue (Net of Scholarship Allowance of $236,243 and $241,907 Respectively) 632, ,358 Miscellaneous - Net 37,270 44,013 Total Operating Revenues 10,906,119 10,443,922 OPERATING EXPENSES Salaries and Wages 10,406,513 10,685,968 Benefits 2,820,665 3,024,204 Supplies and Other Services 4,277,216 3,387,977 Utilities 726, ,591 Student Financial Aid - Scholarships and Fellowships 1,336,329 1,282,766 Depreciation 1,410,064 1,423,716 Assessments by the Commission for Operations 61,334 67,286 Total Operating Expenses 21,038,603 20,785,508 OPERATING LOSS (10,132,484) (10,341,586) NONOPERATING REVENUES (EXPENSES) State Appropriations 5,379,199 5,524,125 State Appropriations Expire (3,548) Federal Pell Grants 3,768,642 3,574,806 Investment Income 56,928 49,453 Payments on Behalf of the College 389, ,608 Assessments by the Commission for Debt Service (5,545) (5,611) Net Nonoperating Revenues 9,585,136 9,276,381 DECREASE IN NET POSITION (547,348) (1,065,205) Net Position - Beginning of Year 9,394,250 10,459,455 Cumulative Effect of Change in Accounting Principle 810,264 - Net Position - Beginning of Year Restated 10,204,514 10,459,455 NET POSITION - END OF YEAR $ 9,657,166 $ 9,394,250 (13)
18 STATEMENTS OF CASH FLOWS YEARS ENDED JUNE 30, 2018 AND CASH FLOWS FROM OPERATING ACTIVITIES Student Tuition and Fees $ 4,116,716 $ 4,194,286 Contracts and Grants 6,816,933 5,371,524 Payments to and on Behalf of Employees (13,058,821) (13,593,547) Payments to Suppliers (4,020,088) (3,478,506) Payments to Utilities (807,644) (782,929) Payments for Scholarships and Fellowships (1,336,329) (1,282,766) Collections of Loans to Students (9,588) 331 Sales and Service of Educational Activities 107,617 76,619 Auxiliary Enterprise Charges 653, ,742 Fees Assessed by Commission (61,334) (67,286) Other Receipts, Net 29,826 44,242 Net Cash Used by Operating Activities (7,569,301) (8,845,290) CASH FLOWS FROM NONCAPITAL FINANCING ACTIVITIES State Appropriations 5,375,651 5,524,125 Federal Pell Grants 3,768,642 3,574,806 Direct Lending Receipts 3,777,263 6,166,162 Direct Lending Payments (3,777,263) (6,166,162) Net Cash Provided by Noncapital Financing Activities 9,144,293 9,098,931 CASH FLOWS FROM CAPITAL FINANCING ACTIVITIES Purchases of Capital Assets (954,694) (302,338) Payments to Commission for Debt Service (5,545) (5,611) Payments to Commission for Loan (41,000) (41,000) Withdrawals from Noncurrent Cash and Cash Equivalents (1,289) (1,202) Net Cash Used by Capital Financing Activities (1,002,528) (350,151) CASH FLOWS FROM INVESTING ACTIVITIES Interest on Investments 56,928 49,453 Purchase of Investments (25,152) (35,029) Sale of Investments - - Net Cash Provided by Investing Activities 31,776 14,424 DECREASE IN CASH AND CASH EQUIVALENTS 604,240 (82,086) Cash and Cash Equivalents - Beginning of Year 994,047 1,076,133 CASH AND CASH EQUIVALENTS - END OF YEAR $ 1,598,287 $ 994,047 RECONCILIATION OF NET OPERATING LOSS TO NET CASH USED IN OPERATING ACTIVITIES Operating Loss $ (10,132,484) $ (10,341,586) Adjustments to Reconcile Net Operating Loss to Net Cash Used in Operating Activities: Depreciation Expense 1,410,064 1,423,716 Pension expense- special funding situation 389, ,608 Effect of Changes in Operating Assets and Liabilities: Accounts Receivables, Net (73,135) (71,555) Due from the commission (5,298) 4,898 Loans to Students, Net (10,171) 331 Prepaid Expenses (227) 116 Inventories 81,673 (88,676) Deferred outflows of resources (269,921) (162,349) Accounts Payable 1,024, ,425 Due to the Commission; Council (3,400) 3,405 Accrued Liabilities (7,910) (144,371) Compensated Absences 18,949 (58,104) Other Postemployment Benefits (775,706) 165,519 Net pension liability (291,537) 219,189 Unearned Revenue (18,157) 27,944 Advances from Federal Sponsors 11, Deferred inflows of resources 1,082,271 (62,560) Net Cash Used in Operating Activities $ (7,569,301) $ (8,845,290) SUPPLEMENTAL DISCLOSURE OF NONCASH TRANSACTIONS Expenses Paid on Behalf of the College $ 389,460 $ 133,608 (14)
19 FOUNDATION, INC. A COMPONENT UNIT OF STATEMENTS OF FINANCIAL POSITION JUNE 30, 2018 AND 2017 ASSETS CURRENT ASSETS Cash and Short-Term Investments $ 711,390 $ 777,152 Interest Receivable 6,545 5,465 Contributions Receivable, Net of Discount and Allowance 362,587 4,885 Cash Restricted for Long-Term Investment 214, ,253 Investments 11,680,035 11,294,994 Note Receivable 2,000,000 2,000,000 Assets Held for Others 39,378 41,738 Other Assets, Net of Allowance 1, Total Assets $ 15,015,563 $ 14,449,737 LIABILITIES AND NET ASSETS LIABILITIES Amounts Held on Behalf of Others $ 39,378 $ 41,738 NET ASSETS Unrestricted 11,609,546 11,642,866 Temporarily Restricted 1,440, ,202 Permanently Restricted 1,926,009 1,854,931 Total Net Assets 14,976,185 14,407,999 Total Liabilities and Net Assets $ 15,015,563 $ 14,449,737 (15)
20 FOUNDATION, INC. A COMPONENT UNIT OF STATEMENT OF ACTIVITIES YEAR ENDED JUNE 30, 2018 Temporarily Permanently Unrestricted Restricted Restricted Total REVENUES AND OTHER SUPPORT Net Gifts $ 4,631 $ 534,602 $ 71,078 $ 610,311 Interest Income 25,597 1,495-27,092 Dividend Income 179,692 52, ,458 Fundraising Income 26, ,620 Other Income Net Realized and Unrealized Gains (Losses) 412, , ,216 Net Assets Released from Restrictions 228,426 (228,426) - - Total Revenues and Other Support 877, ,428 71,078 1,478,697 EXPENSES AND SUPPORT College Support: Student Support 272, ,484 Institutional Support 334, ,526 Conferences, Meetings, and Travel 9, ,671 Other Expenses 194, ,375 Total Expenses and Support 811, ,056 Donations to BSC R&D 54, ,669 Foundation Fund Raising Expenses 15, ,372 Financial Management Expenses 29, , , ,511 CHANGE IN NET ASSETS (33,320) 530,428 71, ,186 NET ASSETS Beginning of Year 11,642, ,202 1,854,931 14,407,999 End of Year $ 11,609,546 $ 1,440,630 $ 1,926,009 $ 14,976, (16)
21 FOUNDATION, INC. A COMPONENT UNIT OF STATEMENT OF ACTIVITIES YEAR ENDED JUNE 30, 2017 Temporarily Permanently Unrestricted Restricted Restricted Total REVENUES AND OTHER SUPPORT Net Gifts $ 10,773 $ 138,645 $ 133,046 $ 282,464 Interest Income 23,374 6,657-30,031 Dividend Income 183,227 29, ,207 Fundraising Income 18, ,050 Net Realized and Unrealized Gains 646,367 66, ,261 Net Assets Released from Restrictions 29,813 (34,335) 4,522 - Total Revenues and Other Support 911, , ,568 1,257,013 EXPENSES AND SUPPORT College Support: Student Support 251, ,477 Institutional Support 40, ,334 Conferences, Meetings, and Travel 5, ,945 Other Expenses 92, ,301 Total Expenses and Support 390, ,057 Donations to BSC R&D 628, ,318 Foundation Fund Raising Expenses 19, ,181 Financial Management Expenses 28, ,114 1,065, ,065,670 CHANGE IN NET ASSETS (154,066) 207, , ,343 NET ASSETS Beginning of Year 11,796, ,361 1,717,363 14,216,656 End of Year $ 11,642,866 $ 910,202 $ 1,854,931 $ 14,407, (17)
22 RESEARCH AND DEVELOPMENT CORPORATION A COMPONENT UNIT OF STATEMENTS OF FINANCIAL POSITION JUNE 30, 2018 AND ASSETS CURRENT ASSETS Cash and Cash Equivalents $ - $ 54,405 Receivables, Net 103,910 88,541 Assets Held for Others 305, ,189 Inventory ,649 Total Current Assets 410, ,784 Property and Equipment, Net 766, ,891 Total Assets $ 1,177,213 $ 1,194,675 LIABILITIES AND NET ASSETS (DEFICIT) CURRENT LIABILITIES Accounts Payable and Accrued Expenses $ 173,977 $ 59,564 Cash overdraft 71,703 - Unearned Revenue 11,123 11,863 Funds Held for Others 305, ,189 Current Portion of Long-Term Debt 90,065 85,257 Total Current Liabilities 652, ,873 Long-Term Debt, Less Current Portion 3,014,762 3,097,899 Total Liabilities 3,667,180 3,528,772 NET ASSETS (DEFICIT) Unrestricted (Deficit) (2,489,967) (2,334,097) Total Liabilities and Net Assets (Deficit) $ 1,177,213 $ 1,194,675 (18)
23 RESEARCH AND DEVELOPMENT CORPORATION A COMPONENT UNIT OF STATEMENTS OF ACTIVITIES YEARS ENDED JUNE 30, 2018 AND SUPPORT AND REVENUE Rental Income $ 308,653 $ 464,922 Federal, State, and Private Contracts and Grants 624, ,935 Contributions and Donations 154, ,318 Other Income 48,288 53,352 Total Revenue and Support 1,135,908 1,704,527 EXPENSES Program Services: Federal Programs 455, ,778 State Programs 743 9,030 Private and Unrestricted Programs 643, ,510 Total Program Expenses 1,099,944 1,420,318 Support Services: Management and General 144, ,945 Total Operating Expenses 1,243,960 1,591,263 Change in Net Assets from Operations (108,052) 113,264 Impairment Loss - (820,090) Donations to Bluefield State College (47,818) - Change in Net Assets (155,870) (706,826) Beginning Net Assets (Deficit) (2,334,097) (1,627,271) ENDING NET ASSETS (Deficit) $ (2,489,967) $ (2,334,097) (19)
24 NOTES TO FINANCIAL STATEMENTS JUNE 30, 2018 AND 2017 NOTE 1 ORGANIZATION Bluefield State College (the College) is governed by the Bluefield State College Board of Governors (the Board). The Board was established by Senate Bill 653 (S.B. 653). Powers and duties of the Board include, but are not limited to, the power to determine, control, supervise and manage the financial, business and educational policies and affairs of the institution under its jurisdiction, the duty to develop a master plan for the institution, the power to prescribe the specific functions and institution s budget request, the duty to review at least every five years all academic programs offered at the institution and the power to fix tuition and other fees for the different classes or categories of students enrolled at its institution. S.B. 653 also created the West Virginia Higher Education Policy Commission (the Commission) and the West Virginia Higher Education Fund (the Fund). The Commission is responsible for developing, gaining consensus around and overseeing the implementation and development of a higher education public policy agenda. As a requirement of Governmental Accounting Standards Board standards (GASB), the College has included information from the Bluefield State College Foundation, Incorporated (the Foundation) and Bluefield State College Research and Development Corporation (the Corporation). Although the College benefits from the activities of the Foundation, the Foundation is independent of the College in all respects. The Foundation is not a subsidiary of the College and is not directly or indirectly controlled by the College. The Foundation has its own separate, independent Board of Directors. Moreover, the assets of the Foundation are the exclusive property of the Foundation and do not belong to the College. The College is not accountable for, and does not have ownership of, any of the financial and capital resources of the Foundation. The College does not have the power or authority to mortgage, pledge, or encumber the assets of the Foundation. The Board of Directors of the Foundation is entitled to make all decisions regarding the business and affairs of the Foundation including, without limitation, distributions made to the College. Under State law, neither the principal nor income generated by the assets of the Foundation can be taken into consideration in determining the amount of State-appropriated funds allocated to the College. Third parties dealing with the College, the Board, and the State of West Virginia (the State) (or any agency thereof) should not rely upon the financial statements of the Foundation for any purpose without consideration of all the foregoing conditions and limitations. See Note 13 for additional disclosure. Although the College benefits from the activities of the Corporation, the Corporation is independent of the College in all respects. The Corporation is not a subsidiary of the College and is not directly or indirectly controlled by the College. The assets of the Corporation are the exclusive property of the Corporation and do not belong to the College. The College is not accountable for, and does not have ownership of, any of the financial and capital resources of the Corporation. The College does not have the power or authority to mortgage, pledge, or encumber the assets of the Corporation. Any income resulting from the operations of the Corporation is for the benefit of the Corporation and is not distributed to the College. Third parties dealing with the College, the Board, and the State (or any agency thereof) should not rely upon the financial statements of the Corporation for any purpose without consideration of all the foregoing conditions and limitations. See Note 14 for additional disclosure. (20)
25 NOTES TO FINANCIAL STATEMENTS JUNE 30, 2018 AND 2017 NOTE 2 SUMMARY OF SIGNIFICANT ACCOUNTING POLICIES The financial statements of the College have been prepared in accordance with accounting principles generally accepted in the United States of America as prescribed by GASB. The combined financial statement presentation required by GASB provides a comprehensive, entity-wide perspective of the College s assets, deferred outflows of resources, liabilities, deferred inflows of resources, net position, revenues, expenses, changes in net position and cash flows. Reporting Entity The College is a blended component unit of the West Virginia Higher Education Fund and represents separate funds of the State of West Virginia (the State) that are not included in the State s general fund. The College is a separate entity, which along with all State institutions of higher education, the Commission (which includes West Virginia Network for Educational Telecomputing), and West Virginia Council for Community and Technical Education form the Higher Education Fund of the State. The Higher Education Fund is considered a component unit of the State, and its financial statements are discretely presented in the State s comprehensive annual financial report. The basic criteria for inclusion in the accompanying financial statements is the exercise of oversight responsibility derived from the College s ability to significantly influence operations and accountability for fiscal matters of related entities. As of July 1, 2003, the College adopted GASB Statement No. 39, Determining Whether Certain Organizations are Component Units, an amendment to GASB Statement No. 14. As a result, the audited financial statements of the Foundation are presented as a discrete component unit with the College s combined financial statements in accordance with GASB. The Foundation is a private nonprofit organization that reports under FASB standards, including the Presentation of Financial Statements for Not-for-Profit Entities Topic of the FASB Accounting Standards Codification. As such, certain revenue recognition criteria and presentation features are different from GASB revenue recognition criteria and presentation features. No modifications have been made to the Foundation s audited financial information as it is presented herein except that in accordance with governmental accounting standards, the Foundation s statements of cash flows are not presented. The Corporation is presented as a discrete component unit with the College s combined financial statements as of and for the years ended June 30, 2018 and 2017 in accordance with GASB. The Corporation is a private nonprofit organization that reports under FASB standards. As such, certain revenue recognition criteria and presentation features are different from GASB revenue recognition criteria and presentation features. No modifications have been made to the Corporation s audited financial information as it is presented herein except that in accordance with governmental accounting standards, the Corporation s statements of cash flows are not presented. The Center for Applied Research and Technology of Bluefield State College and the Bluefield State College Alumni Association are not part of the College reporting entity and are not included in the accompanying financial statements as the College has no ability to designate management, cannot significantly influence operations of the entity and is not accountable for the fiscal matters of the entity under GASB. (21)
26 NOTES TO FINANCIAL STATEMENTS JUNE 30, 2018 AND 2017 NOTE 2 SUMMARY OF SIGNIFICANT ACCOUNTING POLICIES (CONTINUED) Financial Statement Presentation GASB establishes standards for external financial reporting for public colleges and universities and requires that financial statements be presented on a basis to focus on the College as a whole. Net position is classified into four categories according to external donor restrictions or availability of assets for satisfaction of College obligations. The College s net position is classified as follows: Net Investment in Capital Assets This represents the College s total investment in capital assets, net of depreciation and outstanding debt obligations related to those capital assets. To the extent that debt has been incurred but not yet expended for capital assets, such amounts are not included as a component of net investment in capital assets, net of related debt. Restricted Net Position, Expendable This includes resources in which the College is legally or contractually obligated to spend resources in accordance with restrictions imposed by external third parties. The West Virginia State Legislature, as a regulatory body outside the reporting entity, has restricted the use of certain funds by Article 10, Fees and Other Money Collected as State Institutions of Higher Education of the West Virginia State Code. House Bill 101 passed in March 2004 simplified the tuition and fee structure and removed the restrictions but included designations associated with auxiliary and capital items. These activities are fundamental to the normal ongoing operations of the institution. These restrictions are subject to change by future actions of the State Legislature. Restricted Net Position, Nonexpendable This includes endowment and similar type funds in which donors or other outside sources have stipulated, as a condition of the gift instrument, that the principal is to be maintained inviolate and in perpetuity, and invested for the purpose of producing present and future income, which may either be expended or added to principal. Unrestricted Net Position Unrestricted net position includes resources that are not subject to externally imposed stipulations. Such resources are derived from tuition and fees (not restricted as to use), state appropriations, sales and services of educational activities and auxiliary enterprises. Unrestricted net position is used for transactions related to the educational and general operations of the College and may be designated for specific purposes by action of the Board of Governors. (22)
27 NOTES TO FINANCIAL STATEMENTS JUNE 30, 2018 AND 2017 NOTE 2 SUMMARY OF SIGNIFICANT ACCOUNTING POLICIES (CONTINUED) Basis of Accounting For financial reporting purposes, the College is considered a special-purpose government engaged only in business-type activities. Accordingly, the College s financial statements have been prepared on the accrual basis of accounting with a flow of economic resources measurement focus. Revenues are reported when earned and expenditures when materials or services are received. All intercompany accounts and transactions have been eliminated. Cash and Cash Equivalents For purposes of the statements of net position, the College considers all highly liquid investments with an original maturity of three months or less at the time of purchase to be cash equivalents. Cash and cash equivalents balances on deposit with the State of West Virginia Treasurer s Office (the State Treasurer) are pooled by the State Treasurer with other available funds of the State for investment purposes by the West Virginia Board of Treasury Investments (the BTI). These funds are transferred to the BTI and the BTI is directed by the State Treasurer to invest the funds in specific external investment pools in accordance with West Virginia code, policies set by the BTI, and by provisions of bond indentures and trust agreements, when applicable. Balances in the investment pools are recorded at fair value or amortized cost which approximates fair value. Fair value is determined by a third-party pricing service based on asset portfolio pricing models and other sources, in accordance with GASB. The BTI was established by the State Legislature and is subject to oversight by the State Legislature. Fair value and investment income are allocated to participants in the pools based upon the funds that have been invested. The amounts on deposit are available for immediate withdrawal or on the first day of each month for the WV Short Term Bond Pool and, accordingly, are presented as cash and cash equivalents in the accompanying financial statements. The BTI maintains the Consolidated Fund investment fund, which consists of eight investment pools and participant-directed accounts, three of which the College may invest in. These pools have been structured as multi-participant variable net position funds to reduce risk and offer investment liquidity diversification to the Fund participants. Funds not required to meet immediate disbursement needs are invested for longer periods. A more detailed discussion of the BTI s investment operations pool can be found in its annual audited financial report. A copy of the annual audited financial report can be obtained from the following address: 1900 Kanawha Boulevard East, Room E-122, Charleston, West Virginia or Permissible investments for all agencies include those guaranteed by the United States of America, its agencies and instrumentalities (U.S. Government obligations); corporate debt obligations, including commercial paper, which meet certain ratings; certain money market funds; repurchase agreements; reverse repurchase agreements; asset-backed securities; certificate of deposit; state and local government securities (SLGS); and other investments. Other investments consist primarily of investments in accordance with the Linked Deposit Program, a program using financial institutions in West Virginia to obtain certificates of deposit, loans approved by the legislature and any other program investments authorized by the legislature. (23)
28 NOTES TO FINANCIAL STATEMENTS JUNE 30, 2018 AND 2017 NOTE 2 SUMMARY OF SIGNIFICANT ACCOUNTING POLICIES (CONTINUED) Appropriations Due from Primary Government For financial reporting purposes, appropriations due from the State are presented separate from cash and cash equivalents, as amounts are not specific deposits with the State Treasurer but are obligations of the State. Allowance for Doubtful Accounts It is the College s policy to provide for future losses on uncollectible accounts, contracts, grants and loans receivable based on an evaluation of the underlying account, contract, grant and loan balances, the historical collectability experienced by the College on such balances and such other factors which, in the College s judgment, require consideration in estimating doubtful accounts. Inventories Inventories are stated at the lower-of-cost or market, cost being determined on the first-in, first-out method. Noncurrent Cash, Cash Equivalents, and Investments Cash, cash equivalents, and investments that are (1) externally restricted to make debt service payments and long-term loans to students, or to maintain sinking or reserve funds, (2) to purchase capital or other noncurrent assets or settle long-term liabilities, or (3) permanently restricted net position, are classified as a noncurrent asset in the accompanying combined statements of net position. Investments GASB requires the College to record certain investment balances at fair value. The College s investments were on deposit with First Community Bank, Inc. and First Century Bank, Inc. These funds represented the George M. Cruise Endowed Chair of Health Sciences/Nursing and the James H. Shott Endowed Chair of Business, respectively. Funds on deposit are invested in Federal Agency Bonds, money market funds, the underlying securities of which are securities of the U.S. Government, Federated Prime Value Obligation Funds, equity market funds, fixed income securities, and other mutual funds invested in high-quality fixed income securities. These funds are classified as long term due to the restrictions on expenditure. Amounts held for restricted expenditures are available for immediate withdrawal. Investments measured and reported at fair value are classified according to the following hierarchy. Level 1, investments reflect prices quoted in active markets. Level 2, investments reflect prices that are based on a similar observable asset either directly or indirectly, which may include inputs in markets that are not considered to be active. Level 3, investments reflect prices bases upon unobservable inputs. The categorization of investments within the hierarchy is based upon the pricing transparency of the instrument and should not be perceived as the particular investment s risk. Investments are made in accordance with and subject to the provisions of the Uniform Prudent Investor Act codified as article six-c, chapter forty-four of the West Virginia Code. (24)
29 NOTES TO FINANCIAL STATEMENTS JUNE 30, 2018 AND 2017 NOTE 2 SUMMARY OF SIGNIFICANT ACCOUNTING POLICIES (CONTINUED) Capital Assets Capital assets include property, plant, and equipment, books and materials that are part of a catalogued library and infrastructure assets. Capital assets are stated at cost at the date of acquisition or construction, or at acquisition value at the date of donation in the case of gifts. Depreciation is computed using the straight-line method over the estimated useful lives of the assets, generally 20 to 50 years for buildings and infrastructure, 20 years for land improvements, 7 years for library books and 3 to 10 years for furniture and equipment. The College s capitalization threshold is $5,000. There was no interest capitalized during 2018 or The accompanying combined financial statements reflect all adjustments required by GASB. Unearned Revenue Revenues for programs or activities to be conducted primarily in the next fiscal year are classified as unearned revenue, including items such as orientation fees and room and board. Financial aid and other deposits are separately classified as deposits. Compensated Absences and Other Postemployment Benefits (OPEB) GASB provides for the measurement, recognition, and display of OPEB expenditures, assets, and liabilities, including applicable note disclosures and required supplementary information. During fiscal year 2006, House Bill No was established to create a trust fund for postemployment benefits for the State. The College is required to participate in this multiple-employer, cost-sharing plan, the West Virginia Retiree Health Benefit Trust Fund, sponsored by the State of West Virginia. Details regarding this plan and its stand-alone financial statements can be obtained by contacting the West Virginia Public Employees Insurance Agency (PEIA), th St. SE, Suite 2, Charleston, West Virginia or GASB requires entities to accrue for employees rights to receive compensation for vacation leave or payments in lieu of accrued vacation or sick leave as such benefits are earned and payment becomes probable. The College s full-time employees earn up to two vacation leave days for each month of service and are entitled to compensation for accumulated, unpaid vacation leave upon termination. Full-time employees also earn 1 1/2 sick leave days for each month of service and are entitled to extend their health or life insurance coverage upon retirement in lieu of accumulated, unpaid sick leave. Generally, two days of accrued sick leave extend health insurance for one month of single coverage, and three days extend health insurance for one month of family coverage. For employees hired after 1988, or who were hired before 1988 but did not choose such coverage until after 1988 but before July 1, 2001, the employee shares in the cost of the extended benefit coverage to the extent of 50% of the premium required for the extended coverage. Employees hired July 1, 2001, or later will no longer receive sick leave credit toward insurance premiums when they retire. Additionally, all retirees have the option to purchase continued coverage regardless of their eligibility for premium credits. This liability is now provided for under the multiple-employer, cost-sharing plan sponsored by the State. (25)
30 NOTES TO FINANCIAL STATEMENTS JUNE 30, 2018 AND 2017 NOTE 2 SUMMARY OF SIGNIFICANT ACCOUNTING POLICIES (CONTINUED) Compensated Absences and Other Postemployment Benefits (OPEB) (Continued) Certain faculty employees (generally those with less than a 12-month contract) earn a similar extended health or life insurance coverage retirement benefit based on years of service. Generally, 3 1/3 years of teaching service extend health insurance for 1 year of single coverage, and 5 years extend health insurance for 1 year of family coverage. Faculty hired after July 1, 2009, will no longer receive years of service credit toward insurance premiums when they retire. Employees hired after July 1, 2010, receive no health insurance premium subsidy from the College. Two groups of employees hired after July 1, 2010, will not be required to pay the unsubsidized rate: 1) active employees who were originally hired before July 1, 2010, who have a break in service of fewer than two years after July 1, 2010; and 2) retired employees who retired before July 1, 2010, return to active service after July 1, 2010, and then go back into retirement. In those cases, the original hire date will apply. The estimated expense and expense incurred for the vacation leave or OPEB benefits are recorded as a component of benefits expense in the statements of revenues, expenses, and changes in net position. Net Pension Liability For purposes of measuring the net pension liability, deferred outflows of resources and deferred inflows of resources related to pensions, and pension expense, information about the fiduciary net position of the West Virginia Teachers Retirement System (TRS), administered by the West Virginia Consolidated Public Retirement Board (CPRB), and additions to/reductions from the TRS fiduciary net position have been determined on the same basis as they are reported in the TRS financial statements, which can be found at ttps:// The plan schedules of TRS are prepared using the accrual basis of accounting and economic resources measurement focus in accordance with U.S. GAAP as prescribed by GASB. Employer contributions are recognized when due and the employer has a legal requirement to provide the contributions. Investments are reported at fair value. Detailed information on investment valuation can be found in the TRS financial statements. Management of TRS has made certain estimates and assumptions relating to employer allocation schedules, and actual results could differ. (See Note 11.) Deferred Outflows of Resources Consumption of net position by the College that is applicable to a future fiscal year is reported as a deferred outflow of resources on the statement of net position. As of June 30, 2018 and 2017, the College had deferred outflows of resources related to pension of $552,929 and $283,008, respectively (see Note 11). As of June 30, 2018, the College had deferred outflows of resources related to OPEB of $381,097 (see Note 8). Deferred Inflows of Resources Acquisition of net position by the College that is applicable to a future fiscal year is reported as a deferred inflow of resources on the statement of net position. As of June 30, 2018 and 2017, the College had deferred inflows related to pensions of $1,197,840 and $115,569, respectively (see Note 11). As of June 30, 2018, the College had deferred inflows of resources related to OPEB of $956,916 (see Note 8). (26)
31 NOTES TO FINANCIAL STATEMENTS JUNE 30, 2018 AND 2017 NOTE 2 SUMMARY OF SIGNIFICANT ACCOUNTING POLICIES (CONTINUED) Risk Management The State s Board of Risk and Insurance Management (BRIM) provides general, property and casualty, and medical malpractice liability coverage to the College and its employees. Such coverage may be provided to the College by BRIM through self-insurance programs maintained by BRIM or policies underwritten by BRIM that may involve experience-related premiums or adjustments to BRIM. BRIM engages an independent actuary to assist in the determination of its premiums so as to minimize the likelihood of premium adjustments to the College or other participants in BRIM s insurance programs. As a result, management does not expect significant differences between the premiums the College is currently charged by BRIM and the ultimate cost of that insurance based on the College s actual loss experience. In the event such differences arise between estimated premiums currently charged by BRIM to the College and the College s ultimate actual loss experience, the difference will be recorded, as the change in estimate becomes known. In addition, through its participation in the West Virginia Public Employees Insurance Agency (PEIA) and a third-party insurer, the College has obtained health, life, prescription drug coverage, and coverage for job related injuries for its employees. In exchange for payment of premiums PEIA and the third-party insurer, the College has transferred its risks related to health, life, prescription drug coverage, and job related injuries. West Virginia had a single private insurance company, BrickStreet Insurance, which provided workers compensation coverage to all employers in the state. BrickStreet retains the risk related to the compensation of injured employees under the program. Classification of Revenues The College has classified its revenues as either operating or nonoperating revenues according to the following criteria: Operating Revenues Operating revenues include activities that have the characteristics of exchange transactions, such as (1) student tuition and fees, net of scholarship discounts and allowances, (2) sales and services of auxiliary enterprises, (3) most federal, state, local, and nongovernmental grants and contracts, and (4) sales and services of educational activities. Nonoperating Revenues Nonoperating revenues include activities that have the characteristics of nonexchange transactions, such as gifts and contributions, and other revenues that are defined as nonoperating revenues by GASB, such as state appropriations, Federal Pell Grants, and investment income, and sale of capital assets (including natural resources). Other Revenue Other revenues consist primarily of capital grants and gifts. (27)
32 NOTES TO FINANCIAL STATEMENTS JUNE 30, 2018 AND 2017 NOTE 2 SUMMARY OF SIGNIFICANT ACCOUNTING POLICIES (CONTINUED) Use of Restricted Net Position The College has not adopted a formal policy regarding whether to first apply restricted or unrestricted resources when an expense is incurred for purposes for which both restricted and unrestricted net position are available. Generally, the College attempts to utilize restricted net position first when practicable. Federal Financial Assistance Programs The College makes loans to students under the Federal Direct Student Loan Program. Under this program, the U.S. Department of Education makes interest subsidized and nonsubsidized loans directly to students, through the College. Direct student loan receivables are not included in the College s statement of net position as the loans are repayable directly to the U.S. Department of Education. In 2018 and 2017, respectively, the College received and disbursed approximately $4.0 million and $6.2 million, under the Federal Direct Student Loan Program on behalf of the U.S. Department of Education, which is not included as revenue and expense on the statements of revenues, expenses, and changes in net position. The College also distributes other student financial assistance funds on behalf of the federal government to students under the federal Pell Grant, Supplemental Educational Opportunity Grant, and Federal Work Study programs. The activity of these programs is recorded in the accompanying financial statements. In 2018 and 2017, the College received and disbursed approximately $5.8 million and $13.8 million, respectively, under these federal student aid programs. Scholarship Allowances Student tuition and fee revenues, and certain other revenues from students, are reported net of scholarship allowances in the statements of revenues, expenses and changes in net position. Scholarship allowances are the difference between the stated charge for goods and services provided by the College, and the amount that is paid by students and/or third parties making payments on the student s behalf. Financial aid to students is reported in the financial statements under the alternative method as prescribed by the National Association of College and College Business Officers (NACUBO). Certain aid such as loans, funds provided to students as awarded by third parties, and Federal Direct Lending is accounted for as a third-party payment (credited to the student s account as if the student made the payment). All other aid is reflected in the financial statements as operating expenses, or scholarship allowances, which reduce revenues. The amount reported as operating expense represents the portion of aid that was provided to the student in the form of cash. Scholarship allowances represent the portion of aid provided to the student in the form of reduced tuition. Under the alternative method, these amounts are computed on a College basis by allocating the cash payments to students, excluding payments for services, on the ratio of total aid to the aid not considered to be third-party aid. (28)
33 NOTES TO FINANCIAL STATEMENTS JUNE 30, 2018 AND 2017 NOTE 2 SUMMARY OF SIGNIFICANT ACCOUNTING POLICIES (CONTINUED) Government Grants and Contracts Government grants and contracts normally provide for the recovery of direct and indirect costs, subject to audit. The College recognizes revenue associated with direct costs as the related costs are incurred. Recovery of related indirect costs is generally recorded at fixed rates negotiated for a period of one to five years. Income Taxes The College is exempt from income taxes, except for unrelated business income, as a governmental instrumentality under federal income tax laws and regulations of the Internal Revenue Service as described in Section 115 of the Internal Revenue Code. Cash Flows Any cash and cash equivalents escrowed, restricted for noncurrent assets, or in funded reserves have not been included as cash and cash equivalents for the purpose of the statements of cash flows. Use of Estimates The preparation of financial statements in conformity with accounting principles generally accepted in the United States of America requires management to make estimates and assumptions that affect the reported amounts of assets and liabilities and disclosure of contingent assets and liabilities at the date of the financial statements and the reported amounts of revenues and expenditures during the reporting period. Actual results could differ from those estimates. Risk and Uncertainties Investments are exposed to various risks, such as interest rate, credit, and overall market volatility. Due to the level of risk associated with certain securities, it is reasonably possible that changes in risk and values will occur in the near term and that such changes could materially affect the amounts reported in the financial statements. Newly Adopted Statements Issued by the Governmental Accounting Standards Board (GASB) The Commission has implemented GASB Statement No. 75, Accounting and Financial Reporting for Postemployment Benefits Other Than Pensions. Statement No. 75 requires the Commission to report its share of the defined benefit other postemployment benefits (OPEB) and expense, as well as the related deferred outflows of resources and deferred inflows of resources, allocated to it by the RHBT. The July 1, 2017, balance of the OPEB liability and related deferred outflows of resources is reported in the statement of revenues, expenses, and changes in net position as a restatement to the 2017 net position beginning of the year. The RHBT was not able to provide sufficient information to restate the June 30, 2017 financial statements. (29)
34 NOTES TO FINANCIAL STATEMENTS JUNE 30, 2018 AND 2017 NOTE 2 SUMMARY OF SIGNIFICANT ACCOUNTING POLICIES (CONTINUED) Newly Adopted Statements Issued by the Governmental Accounting Standards Board (GASB) (Continued) June 30, 2018 Net Position - Beginning of Year, as Previously Stated $ 9,394,250 Balance of the Net OPEB liability and Related Deferred Outflows of Resources and Deferred Inflows of Resources 810,264 Net Position - Beginning of Year, as Restated $ 10,204,514 The Commission has adopted Statement No. 85, Omnibus Statement No. 85 addresses practice issues that have been identified during implementation of certain GASB statements. The Commission has not yet determined the effect that the adoption of GASB Statement No. 85 may have on its financial statements. The adoption of this standard had no effect on the Commission s financial statements.ing debt. The adoption of this standard had no effect on the University s financial statements. Recent Statements Issued by the Governmental Accounting Standards Board (GASB) The GASB has also issued Statement No. 83, Certain Asset Retirement Obligations, which is effective for fiscal years beginning after June 15, Statement No. 83 establishes criteria for determining the timing and pattern of recognition of a liability and a corresponding deferred outflow of resources for legally enforceable liabilities associated with the retirement of tangible capital assets. Examples of asset retirements covered under this standard are the decommissioning of a nuclear reactor or the dismantling and removal of sewage treatment plants as required by law. The Commission has not yet determined the effect that the adoption of GASB Statement No. 83 may have on its financial statements. The GASB has also issued Statement No. 84, Fiduciary Activities, which is effective for fiscal years beginning after December 15, Statement No. 84 establishes criteria for identifying fiduciary activities of all state and local governments to determine whether an activity should be reported in a fiduciary fund in the financial statements. The Commission has not yet determined the effect that the adoption of GASB Statement No. 84 may have on its financial statements. The GASB has also issued Statement No. 87, Leases, which is effective for fiscal years beginning after December 15, Statement No. 87 establishes a single model for lease accounting based on the foundational principle that leases are financings of the right to use an underlying asset. In other words, most leases currently classified as operating leases will be accounted for and reported in the same manner as capital leases. The Commission has not yet determined the effect that the adoption of GASB Statement No. 87 may have on its financial statements. (30)
35 NOTES TO FINANCIAL STATEMENTS JUNE 30, 2018 AND 2017 NOTE 2 SUMMARY OF SIGNIFICANT ACCOUNTING POLICIES (CONTINUED) Recent Statements Issued by the Governmental Accounting Standards Board (GASB) (Continued) In April 2018, the GASB issued Statement No. 88, Certain Disclosures Related to Debt, Including Direct Borrowing and Direct Placements, which is effective for fiscal years beginning after June 15, This Statement improves the information that is disclosed in notes to government financial statements related to debt, including direct borrowings and direct placements. It also clarifies which liabilities governments should include when disclosing information related to debt. This Statement defines debt for purposes of disclosure in notes to financial statements as a liability that arises from a contractual obligation to pay cash (or other assets that may be used in lieu of cash) in one or more payments to settle an amount that is fixed at the date the contractual obligation is established. This Statement requires that additional essential information related to debt be disclosed in notes to financial statements. For notes to financial statements related to debt, this Statement also requires that existing and additional information be provided for direct borrowings and direct placements of debt separately from other debt. The Commission has not yet determined the effect that the adoption of GASB Statement No. 87 may have on its financial statements. In June 2018, the GASB issued Statement No. 89, Accounting for Interest Cost Incurred before the End of a Construction Period, which is effective for fiscal years beginning after December 15, The objective of this Statement is to enhance the relevance and comparability of information about capital assets and the cost of borrowing for a reporting period and to simplify accounting for certain interest costs. This Statement also establishes accounting requirements for interest cost incurred before the end of a construction period. The Commission has not yet determined the effect that the adoption of GASB Statement No. 87 may have on its financial statements. In August 2018, the GASB issued Statement No. 90, Major Equity Interests, which is effective for fiscal years beginning after December 15, This Statement modifies previous guidance for reporting a government s majority equity interest in a legally separate organization. This Statement also provides guidance for reporting component unit if a government acquires a 100% equity interest in that component unit. An equity interest is a financial interest in a legally separate organization evidenced by the ownership of shares of the organization s stock or by otherwise having an explicit, measureable right to the net resources of the organization that is usually based on an investment of financial or capital resources by a government. An equity interest is explicit and measureable if the government has a present or future claim to the net resources of the entity and the method for measuring the government s share of the entity s net resources is determinable. The Commission has not yet determined the effect that the adoption of GASB Statement No. 87 may have on its financial statements. Reclassifications Certain amounts in the 2017 financial statements have been reclassified to conform to the 2018 presentation. (31)
36 NOTES TO FINANCIAL STATEMENTS JUNE 30, 2018 AND 2017 NOTE 3 CASH AND CASH EQUIVALENTS The composition of cash and cash equivalents held was as follows: June 30, 2018 Current Noncurrent Total State Treasurer $ 1,490,974 $ 41,073 $ 1,532,047 In Bank 100, , ,247 On Hand 7,300-7,300 Total $ 1,598,287 $ 146,307 $ 1,744,594 June 30, 2017 Current Noncurrent Total State Treasurer $ 911,324 $ 41,073 $ 952,397 In Bank 75, , ,368 On Hand 7,300-7,300 Total $ 994,047 $ 145,018 $ 1,139,065 Cash held by the State Treasurer includes $1,530,411 and $940,090 at June 30, 2018 and 2017, respectively, of restricted cash for sponsored projects, loans, and other purposes. The combined carrying amount of cash in bank at June 30, 2018 and 2017, was $205,247 and $179,367 as compared with the combined bank balance of $628,904 and $489,797, respectively. The difference is primarily caused by outstanding checks and items in transit. The bank balances were covered by federal depository insurance or were collateralized by securities held by the State s agent. Regarding federal depository insurance, interestbearing accounts are insured by the Federal Deposit Insurance Corporation up to $250,000. Noninterest-bearing accounts are 100% insured through December 31, Amounts with the State Treasurer as of June 30, 2018 and 2018, are comprised of three investment pools, the WV Money Market Pool, the WV Government Money Market Pool, and the WV Short Term Bond Pool. Credit Risk - Credit risk is the risk that an issuer or other counterparty to an investment will not fulfill its obligations. The following table provides information on the Standard & Poor s rating of the investment pools as of June 30: Carrying Value S&P Carrying Value S&P External Pool (in Thousands) Ratings (in Thousands) Ratings WV Money Market Pool $ 872 AAAm $ 872 AAAm WV Government Money Market Pool - AAAm - AAAm WV Short Term Bond Pool 20 Not Rated 20 Not Rated A Fund rated AAAm has extremely strong capacity to maintain principal stability and to limit exposure to principal losses due to credit, market, and/or liquidity risks. AAAm is the highest principal stability fund rating assigned by Standard & Poor s. (32)
37 NOTES TO FINANCIAL STATEMENTS JUNE 30, 2018 AND 2017 NOTE 3 CASH AND CASH EQUIVALENTS (CONTINUED) Interest Rate Risk Interest rate risk is the risk that changes in interest rates will adversely affect the fair value of an investment. All the amounts with the State Treasurer are subject to interest rate risk. The following table provides information on the weighted-average maturities for the WV Money Market Pool and the WV Government Money Market Pool: Carrying Value WAM Carrying Value WAM External Pool (in Thousands) (Days) (in Thousands) (Days) WV Money Market Pool $ $ The following table provides information on the effective duration for the WV Short Term Bond Pool: Effective Effective Carrying Value Duration Carrying Value Duration External Pool (in Thousands) (Days) (in Thousands) (Days) WV Short Term Bond Pool $ $ Other Investment Risks Other investment risks include concentration of credit risk, custodial credit risk, and foreign currency risk. None of the BTI s Consolidated Fund s investment pools or accounts is exposed to these risks as described below. Custodial Credit Risk Custodial credit risk for investments is the risk that, in the event of the failure of the counterparty to a transaction, the College will not be able to recover the value of the investment or collateral securities that are in the possession of an outside party. The College does not have a formal custodial credit risk policy. Interest Rate Risk Interest rate risk is the risk that changes in interest rates will adversely affect the fair value of an investment. The College s investment policy limits investment maturities from potential fair value losses due to increasing interest rates. No more than 5% of the money market fund s total market value may be invested in the obligations of a single issuer, with the exception of the U.S. government and its agencies. (33)
38 NOTES TO FINANCIAL STATEMENTS JUNE 30, 2018 AND 2017 NOTE 4 ACCOUNTS RECEIVABLE Accounts receivable were as follows at June 30: Student Tuition and Fees, Net of Allowance for Doubtful Accounts of $741,220 and $597,074 in 2018 and 2017, Respectively $ 283,257 $ 278,859 Grants and Contracts Receivable, Net of Allowance for Doubtful Accounts of $555,006 and $485,662 in 2018 and 2017, Respectively 198, ,443 Other Accounts Receivable 335, ,355 Accounts Receivable, Net $ 816,792 $ 743,657 NOTE 5 INVESTMENTS The College categorizes its fair value measurements within the fair value hierarchy established by accounting principles generally accepted in the United States of America. The College had the following recurring fair value measurements comprised of investments as of June 30, 2018 and 2017: 2018 Fair Value Measurements Using Quoted Prices in Significant Active Markets Other Significant for Identical Observable Unobservable Fair Assets Inputs Inputs Value (Level 1) (Level 2) (Level 3) Money Market $ 6,802 $ 6,802 $ - $ - Corporate Bonds 76,508-76,508 - U.S. Government Agency Securities 102, ,151 - Bond Mutual Funds Fixed Income 85,458 85, High Yield 10,477 10, Equity Mutual Funds Domestic Large Cap 107, , Domestic Mid-Cap 15,025 15, Domestic Small Cap 28,708 28, International 66,085 66, Mid-Cap Blend 12,842 12, Total $ 511,167 $ 332,508 $ 178,659 $ - (34)
39 NOTES TO FINANCIAL STATEMENTS JUNE 30, 2018 AND 2017 NOTE 5 INVESTMENTS (CONTINUED) 2017 Fair Value Measurements Using Quoted Prices in Significant Active Markets Other Significant for Identical Observable Unobservable Fair Assets Inputs Inputs Value (Level 1) (Level 2) (Level 3) Money Market $ 22,620 $ 22,620 $ - $ - Corporate Bonds 74,967-74,967 - U.S. Government Agency Securities 89,714-89,714 - Bond Mutual Funds Fixed Income 77,770 77, High Yield 10,560 10, Equity Mutual Funds Domestic Large Cap 96,574 96, Domestic Mid-Cap 13,985 13, Domestic Small Cap 26,931 26, International 53,634 53, Partnerships 4,801 4, Mid-Cap Blend 14,459 14, Total $ 486,015 $ 321,334 $ 164,681 $ - The investments are held with a third-party trustee. The money market funds invest in U.S. Government Securities and Federated Prime Value Obligation Funds. These funds are rated AAA by Standard & Poor s. The U.S. Government Securities are also rated Aaa by Moody s. The Federal Government Bonds are rated AAA by Standard & Poor s and Aaa by Moody s. The fixed income securities invest in Federal Home Loan Bank Bonds, Freddie Mac Notes and certificates of deposit under the CDARS program. The equity market securities, fixed income securities, and limited partnerships are rated AAA by Standard & Poor s. Management believes that there is no significant custodial credit risk nor interest rate risk for any of the funds. Furthermore, the funds are not exposed to any significant concentration of credit risk nor any foreign currency risk. (35)
40 NOTES TO FINANCIAL STATEMENTS JUNE 30, 2018 AND 2017 NOTE 6 CAPITAL ASSETS The following is a summary of capital asset transactions for the College for the years ended June 30: Capital Assets not being Depreciated: Beginning Ending Balance Additions Reductions Transfers Balance Land $ 277,942 $ - $ - $ - $ 277,942 Construction in Progress 295, , ,352 Total Capital Assets not being Depreciated $ 573,931 $ 356,363 $ - $ - $ 930,294 Capital Assets Being Depreciated: Land Improvements $ 4,381,817 $ - $ - $ - $ 4,381,817 Buildings 31,631,933 26, ,658,058 Equipment 3,955, , ,924-4,420,286 Library Books 1,428,667 2, ,430,817 Total Other Capital Assets 41,397, , ,924-41,890,978 Less Accumulated Depreciation for: Land Improvements 3,291, , ,530,751 Buildings 17,737, , ,724,430 Equipment 3,480, , ,924-3,552,314 Library Books 1,407,002 6, ,413,784 Total Accumulated Depreciation 25,916,139 1,410, ,924-27,221,279 Capital Assets Being Depreciated - Net $ 15,481,432 $ (811,733) $ - $ - $ 14,669, Capital Asset Summary: Capital Assets not being Depreciated $ 573,931 $ 356,363 $ - $ - $ 930,294 Other Capital Assets 41,397, , ,924-41,890,978 Total Cost of Capital Assets 41,971, , ,924-42,821,272 Less: Accumulated Depreciation 25,916,139 1,410, ,924-27,221,279 Capital Assets - Net $ 16,055,363 $ (455,370) $ - $ - $ 15,599,993 (36)
41 NOTES TO FINANCIAL STATEMENTS JUNE 30, 2018 AND 2017 NOTE 6 CAPITAL ASSETS (CONTINUED) Capital Assets not being Depreciated: Beginning Ending Balance Additions Reductions Transfers Balance Land $ 277,942 $ - $ - $ - $ 277,942 Construction in Progress 151, , ,989 Total Capital Assets not being Depreciated $ 429,004 $ 144,927 $ - $ - $ 573,931 Capital Assets Being Depreciated: Land Improvements $ 4,381,817 $ - $ - $ - $ 4,381,817 Buildings 31,490, , ,631,933 Equipment 4,080,557 13, ,077-3,955,154 Library Books 1,426,605 2, ,428,667 Total Other Capital Assets 41,379, , ,077-41,397,571 Less Accumulated Depreciation for: Land Improvements 3,051, , ,291,274 Buildings 16,724,228 1,013, ,737,618 Equipment 3,455, , ,077-3,480,245 Library Books 1,399,577 7, ,407,002 Total Accumulated Depreciation 24,631,500 1,423, ,077-25,916,139 Capital Assets Being Depreciated - Net $ 16,747,737 $ (1,266,305) $ - $ - $ 15,481, Capital Asset Summary: Capital Assets not being Depreciated $ 429,004 $ 144,927 $ - $ - $ 573,931 Other Capital Assets 41,379, , ,397,571 Total Cost of Capital Assets 41,808, , ,971,502 Less: Accumulated Depreciation 24,631,500 1,423, ,077-25,916,139 Capital Assets - Net $ 17,176,741 $ (1,121,378) $ (139,077) $ - $ 16,055,363 The College maintains certain collections of inexhaustible assets to which no value can be practically determined. Accordingly, such collections are not capitalized or recognized for financial statement purposes. Such collections include contributed works of art, historical treasures, and literature that are held for exhibition, education, research, and public service. These collections are neither disposed of for financial gain nor encumbered in any means. Title for certain real property is with the Commission. Title for some land was with the original Board of Directors. Those deeds/records have not been converted to BSC. At some point in the future, title can be changed to BSC. At June 30, 2018, the College had no outstanding contractual commitments for property, plant, and equipment expenditures. (37)
42 NOTES TO FINANCIAL STATEMENTS JUNE 30, 2018 AND 2017 NOTE 7 LONG-TERM LIABILITIES The following is a summary of long-term obligation transactions for the College for the years ended June 30: 2018 Beginning Ending Current Balance Additions Reductions Balance Portion Advances from Federal Sponsors $ 95,335 $ 11,919 $ - $ 107,254 $ - Accrued Compensated Absences 554,571 18, , ,131 OPEB Liability 6,066,813-1,585,970 4,480,843 - Net Pension Liability 790, , ,691 - Debt Obligation Due Commission 143,500-41, ,500 41,000 Total Noncurrent Liabilities $ 7,650,447 $ 30,868 $ 1,918,507 $ 5,762,808 $ 392, Beginning Ending Current Balance Additions Reductions Balance Portion Advances from Federal Sponsors $ 94,575 $ 760 $ - $ 95,335 $ - Accrued Compensated Absences 612,675-58, , ,141 OPEB Liability 5,901, ,519-6,066,813 - Net Pension Liability 571, , ,228 - Debt Obligation Due Commission 184,500-41, ,500 41,000 Total Noncurrent Liabilities $ 7,364,083 $ 385,468 $ 99,104 $ 7,650,447 $ 392,141 NOTE 8 OTHER POSTEMPLOYMENT BENEFITS Employees of the College are enrolled in the West Virginia Other Postemployment Benefit Plan (the OPEB plan) which is administered by the West Virginia Public Employees Insurance Agency (PEIA) and the West Virginia Retiree Health Benefit Trust Fund (the RHBT). Following is the College s other postemployment benefits liability, deferred outflows of resources and deferred inflows of resources related to other postemployment benefits, revenues, and other postemployment benefits expense and expenditures for the fiscal year ended June 30, 2018: Net OPEB Liability $ 4,480,843 Deferred Outflows of Resources 381,097 Deferred Inflow of Resources 956,916 Revenues 282,532 OPEB Expense 463,742 Employer Contributions 381,097 (38)
43 NOTES TO FINANCIAL STATEMENTS JUNE 30, 2018 AND 2017 NOTE 8 OTHER POSTEMPLOYMENT BENEFITS (CONTINUED) Plan Description The OPEB plan is a cost-sharing, multiple employer, defined benefit other post-employment benefit plan that covers the retirees of state agencies, colleges and universities, county boards of education, and other government entities as set forth in West Virginia Code Section 5-16D-2 (the Code). Plan benefits are established and revised by PEIA and the RHBT with approval of the Finance Board. The Finance Board is comprised of nine members. Finance Board members are appointed by the Governor, serve a term of four years, and are eligible for reappointment. The State Department of Administration secretary serves as Chairman of the Board. Four members represent labor, education, public employees, and public retirees. Four remaining members represent the public-at-large. Active employees who retire are eligible for PEIA health and life benefits, provided they meet the minimum eligibility requirements of the applicable State retirement system and if their last employer immediately prior to retirement: is a participating employer under the Consolidated Public Retirement Board (CPRB) and, as of July 1, 2008 forward, is a participating employer with PEIA. Active employees who, as of July 1, 2008, have ten years or more of credited service in the CPRB and whose employer at the time of their retirement does participate with CPRB, but does not participate with PEIA will be eligible for PEIA retiree coverage provided: they otherwise meet all criteria under this heading and their employer agrees, in writing, upon a form prescribed by PEIA, that the employer will pay to PEIA the nonparticipating retiree premium on behalf of the retiree or retirees, or that the retiree agrees to pay the entire unsubsidized premium themselves. Employees who participate in non-state retirement systems but that are CPRB system affiliated, contracted, or approved (such as TIAA-CREF and Empower Retirement), or are approved, in writing, by the PEIA Director must, in the case of education employees, meet the minimum eligibility requirements of the State Teachers Retirement System (STRS), and in all other cases meet the minimum eligibility requirements of the Public Employees Retirement System to be eligible for PEIA benefits as a retiree. The financial activities of the OPEB plan are accounted for in the RHBT, a fiduciary fund of the State of West Virginia. The RHBT audited financial statements and actuarial reports can be found on the PEIA website at Benefits Provided The OPEB plan provides the following benefits: medical and prescription drug insurance and life insurance. The medical and prescription drug insurance is provided through two options: the self-insured preferred provider benefit plan option, which is primarily for non-medicareeligible retirees and spouses; and the external managed care organization option, which is primarily for Medicare-eligible retirees and spouses. (39)
44 NOTES TO FINANCIAL STATEMENTS JUNE 30, 2018 AND 2017 NOTE 8 OTHER POSTEMPLOYMENT BENEFITS (CONTINUED) Contributions Pay as you go premiums (paygo) are established by the Finance Board annually. All participating employers are required by statute to contribute this premium to the RHBT at the established rate for every active policyholder per month. The active premiums subsidize the retirees health care. Members retired before July 1, 1997 pay retiree healthcare contributions at the highest sponsor subsidized rate, regardless of their actual years of service. Members retired between July 1, 1997 and June 30, 2010, pay a subsidized rate depending on the member s years of service. Members hired on or after July 1, 2010, pay retiree healthcare contributions with no sponsor provided implicit or explicit subsidy. Retiree leave conversion contributions from the employer depend on the retiree s date of hire and years of service at retirement as described below: Members hired before July 1, 1988 may convert accrued sick or vacation leave days into 100% of the required retiree healthcare contribution. Members hired from July 1, 1988 to June 30, 2001 may convert sick or vacation leave days into 50% of the required retiree healthcare contribution. The conversion rate is two days of unused sick and vacation leave days per month for single healthcare coverage and three days of unused sick and vacation leave days per month for family healthcare coverage. Employees hired on or after July 1, 2001 no longer receive sick and/or vacation leave credit toward the required retiree healthcare contribution when they retire. All retirees have the option to purchase continued coverage regardless of their eligibility for premium credits. Certain faculty employees (generally those with less than a 12-month contract) earn a similar extended health or life insurance coverage retirement benefit based on years of service. Generally, 3-1/3 years of teaching service extend health insurance coverage for one year of family coverage. Faculty hired after July 1, 2009, no longer receive years of service credit toward insurance premiums when they retire. Faculty hired on or after July 1, 2010, receive no health insurance premium subsidy when they retire. Two groups of employees hired after July 1, 2010 will not be required to pay the unsubsidized rate: 1) active employees who were originally hired before July 1, 2010 who have a break in service of fewer than two years after July 1, 2010; and 2) retired employees who had an original hire date prior to July 1, 2010 may return to active employment. In those cases, the original hire date may apply. (40)
45 NOTES TO FINANCIAL STATEMENTS JUNE 30, 2018 AND 2017 NOTE 8 OTHER POSTEMPLOYMENT BENEFITS (CONTINUED) Assumptions The net OPEB liability for financial reporting purposes was determined by an actuarial valuation as of June 30, 2016, rolled forward to June 30, The following actuarial assumptions were used and applied to all periods included in the measurement: Actuarial cost method: Entry age normal cost method. Amortization method and period: Level percentage of payroll over 21 years; closed as of June 30, Investment rate of return: 7.15%, net of OPEB plan investment expense, including inflation. Projected salary increases: dependent on pension system ranging from 3.00% to 6.50%, including inflation. Healthcare cost trend rates: Actual trend used for fiscal year For fiscal years on and after 2018, trend starts at 8.50% and 9.75% for pre- and post-medicare, respectively, and gradually decreases to an ultimate trend of 4.50%. Excess trend rate of 0.14% and 0.29% for pre- and post-medicare, respectively, is added to healthcare trend rates pertaining to per capita claims costs beginning in 2020 to account for the Excise Tax. Inflation rate: 2.75%. Discount rate: 7.15% Mortality rates: based on RP-2000 Mortality Tables. The long-term investment rate of return of 7.15% on OPEB plan investments was determined by a combination of an expected long-term rate of return of 7.50% for long-term assets invested with the West Virginia Investment Management Board (IMB) and an expected short-term rate of return of 3.0% for assets invested with the WV Board of Treasury Investments (BTI). Long-term pre-funding assets are invested with the IMB. The strategic asset allocation consists of 55% equity, 15% fixed income, 10% private equity, 10% hedge fund and 10% real estate invested. Short-term assets used to pay current year benefits and expenses are invested with the BTI. The long-term expected rate of return on OPEB plan investments was determined using a building-block method in which estimates of expected future real rates of return (expected returns, net of OPEB plan investment expense and inflation) are developed for each major asset class. These ranges are combined to produce the long-term expected rate of return by weighting the expected future real rates of return by the target asset allocation percentages and by adding expected inflation. Best estimates of the long-term geometric rates for each major asset class are summarized below. (41)
46 NOTES TO FINANCIAL STATEMENTS JUNE 30, 2018 AND 2017 NOTE 8 OTHER POSTEMPLOYMENT BENEFITS (CONTINUED) Assumptions (Continued) The actuarial assumptions used in the June 30, 2016 valuation were based on the results of an actuarial experience study for the period July 1, 2010 through June 30, Asset Class Long-Term Expected Real Rate of Return Large Cap Domestic 17.0% Non-Large Cap Domestic 22.0% International Qualified 24.6% International Non-Qualified 24.3% International Equity 26.2% Short-Term Fixed 0.5% Total Return Fixed Income 6.7% Core Fixed Income 0.1% Hedge Fund 5.7% Private Equity 19.6% Real Estate 8.3% Opportunistic Income 4.8% Cash 0.0% Discount rate. The discount rate used to measure the OPEB liability was 7.15%. The projection of cash flows used to determine the discount rate assumed that RHBT contributions will be made at rates equal to the actuarially determined contribution rates, in accordance with prefunding and investment policies. Based on those assumptions, the OPEB plan s fiduciary net position was projected to be available to make all projected future benefit payments of current plan members. Therefore, the long-term expected rate of return on OPEB plan investments was applied to all periods of projected benefit payments to determine the total OPEB liability. Discount rates are subject to change between measurement dates. Sensitivity of the net pension liability to changes in the discount rate. The following presents the College s proportionate share of the net OPEB liability as of June 30, 2016 calculated using the discount rate of 7.15%, as well as what the College s net OPEB liability would be if it were calculated using a discount rate that is one percentage point lower (6.15%) or one percentage point higher (8.15%) than the current rate: Sensitivity Current 1% Decrease Discount Rate 1% Increase (6.15%) (7.15%) (8.15%) Net OPEB Liability $ 5,217,428 $ 4,480,843 $ 3,868,536 (42)
47 NOTES TO FINANCIAL STATEMENTS JUNE 30, 2018 AND 2017 NOTE 8 OTHER POSTEMPLOYMENT BENEFITS (CONTINUED) Assumptions (Continued) Sensitivity of the net OPEB liability to changes in healthcare cost trend rates. The following presents the College s proportionate share of the net OPEB liability as of June 30, 2016 calculated using the current healthcare cost trend rates, as well as what the College s net OPEB liability would be if it were calculated using healthcare cost trend rates that are one percentage point lower or one percentage point higher than the current rates: Cost Trend Rate Current Healthcare Cost 1% Decrease Trend Rate 1% Increase Net OPEB Liability $ 3,763,972 $ 4,480,843 $ 5,357,617 OPEB Liability, OPEB Expense, and Deferred Outflows of Resources and Deferred Inflows of Resources Related to OPEB The net OPEB liability at June 30, 2018 was measured as of June 30, 2016 rolled forward to June 30, 2017, which is the measurement date. The total OPEB liability at June 30, 2018 was determined by an actuarial valuation as of June 30, 2016 and rolled forward to the measurement date. At June 30, 2018, the amount recognized as the College s proportionate share of the net OPEB liability was approximately $4,480,843. At June 30, 2018, the nonemployer contributing entity s (State of West Virginia) portion of the collective net OPEB liability is $920,370 and the total net OPEB liability attributable to the College is $5,401,213. The allocation percentage assigned to each contributing employer is based on the employer s proportionate share of employer contributions to the RHBT for the fiscal years ended June 30, 2017 and June 30, Employer contributions are recognized when due. At June 30, 2017, the College s proportion was %, a decrease of % from its proportion of % calculated as of June 30, For the year ended June 30, 2018, the College recognized OPEB expense of $463,742. Of this amount, $181,210 was recognized as the College s proportionate share of the OPEB expense, and $282,532 as the amount of OPEB expense attributed to special funding. The College also recognized revenue of $282,532 for support provided by the state. (43)
48 NOTES TO FINANCIAL STATEMENTS JUNE 30, 2018 AND 2017 NOTE 8 OTHER POSTEMPLOYMENT BENEFITS (CONTINUED) OPEB Liability, OPEB Expense, and Deferred Outflows of Resources and Deferred Inflows of Resources Related to OPEB (Continued) At June 30, 2018, deferred outflows of resources and deferred inflows of resources related to OPEB are as follows: 2018 Deferred Deferred Outflows of Inflows of Resources Resources Differences Between Expected and Actual Experience $ - $ 15,004 Changes in Proportion and Difference Between Employer Contributions and Proportionate Share of Contributions - 870,395 Net Difference Between Projected and Actual Investment Earnings - 71,517 Contributions After the Measurement Date 381,097 - Total $ 381,097 $ 956,916 The College will recognize the $381,097 reported as deferred outflows of resources resulting from OPEB contributions after the measurement date as a reduction of the net OPEB liability in the year ended June 30, Other amounts reported as deferred outflows of resources and deferred inflows of resources related to OPEB will be recognized in OPEB expense as follows: Fiscal Year Ending June 30, Amortization 2019 $ 256, , , ,094 Total $ 956,916 NOTE 9 STATE SYSTEM OF HIGHER EDUCATION INDEBTEDNESS The College is a state institution of higher education. It receives a state appropriation in partial support of its operations. In addition, the College is subject to the legislative and administrative mandates of state government. Those mandates affect all aspects of the College s operations, its tuition and fee structure, its personnel policies and its administrative practices. (44)
49 NOTES TO FINANCIAL STATEMENTS JUNE 30, 2018 AND 2017 NOTE 9 STATE SYSTEM OF HIGHER EDUCATION INDEBTEDNESS (CONTINUED) The State has chartered the Commission with the responsibility to construct or renovate, finance and maintain various academic and other facilities of the State s universities and colleges, including certain facilities of the College. Financing for these facilities was provided through revenue bonds issued by the former Board of Regents or the former Boards of the College and College Systems (the Boards). These obligations administered by the Commission are the direct and total responsibility of the Municipal Bond Commission, as successor to the former Boards. The Commission assesses each public institution of higher education for funds to meet the payment of debt service on these various bonds. The tuition and registration fees of the members of the former State College System are generally pledged as collateral for the Commission s bond indebtedness. Student fees collected by the institution in excess of the debt service allocation are retained by the institution for internal funding of capital projects and maintenance. Although the bonds remain as a capital obligation of the Commission, an estimate of the obligation of each institution is reported as a long-term payable by each institution and as a receivable by the Commission. Amounts due to Commission at June 30, 2018 and 2017 is $-0-. During fiscal year 2011, the College entered into two capital project loans with the Higher Education Policy Commission in the amounts of $410,000 and $340,000 to fund an HVAC replacement project. Under these agreements, there is no interest charged to the College. The loan for $410,000 is to be repaid over 10 years in semi-annual payments of $20,500 while the loan for $340,000 is to be repaid over five years in semi-annual payments of $34,000. During 2018 and 2017, the College paid $41,000 and $41,000, respectively, to the Commission against the loans The scheduled maturities of amounts due to the Commission at June 30, 2018 are as follows: Year Ending June 30, Amount 2019 $ 41, , ,500 Total $ 102,500 NOTE 10 UNRESTRICTED DEFICIT The College s unrestricted net position at June 30, 2018 and 2017 includes certain undesignated net position, as follows: Designated for Repair and Replacement $ 19,809 $ 16,888 Undesignated (1,799,366) (1,206,632) Total Unrestricted Net Position before OPEB Liability (1,779,557) (1,189,744) Less: OPEB Liability 4,480,843 6,007,120 Total Unrestricted Net Position (Deficit) $ (6,260,400) $ (7,196,864) (45)
50 NOTES TO FINANCIAL STATEMENTS JUNE 30, 2018 AND 2017 NOTE 11 RETIREMENT PLANS Substantially all full-time employees of the College participate in either the West Virginia Teachers Retirement System (the TRS) or the Teachers Insurance and Annuities Association - College Retirement Equities Fund (the TIAA-CREF). Previously, upon full-time employment, all employees were required to make an irrevocable selection between the TRS and TIAA-CREF. Effective July 1, 1991, the TRS was closed to new participants. Current participants in the TRS are permitted to make a one-time election to cease their participation in that plan and commence contributions to the West Virginia Teachers Defined Contribution Plan. Contributions to and participation in the West Virginia Teachers Defined Contribution Plan by College employees have not been significant to date. Defined Contribution Benefit Plans The TIAA-CREF is a cost-sharing defined contribution plan in which benefits are based solely upon amounts contributed plus investment earnings. Employees who elect to participate in this plan are required to make a contribution equal to 6% of total annual compensation. The College matches the employees 6% contribution. Contributions are immediately and fully vested. In addition, employees may elect to make additional contributions to TIAA-CREF which are not matched by the College. Total contributions to the TIAA-CREF for the years ended June 30, 2018, 2017, and 2016, were $1,330,160, $1,085,460, and $1,102,340, which consisted of equal contributions of $665,080, $542,730, and $551,170, respectively, from both the College and covered employees. Effective January 1, 2003, higher education employees enrolled in the basic 401(a) retirement plan with TIAA-CREF have an option to switch to the new Educators Money 401(a) Basic Retirement Plan. New hires have a choice of either plan. As of June 30, 2015, the College did not have any employees enrolled in the new Educators Monday 401(a) Basic Retirement Plan. The Great West benefit program is also available to new employees. Total contributions to Great West for year ended June 30, 2018, 2017, and 2016 were $9,498, $14,408, and $8,570, which consisted of equal contributions $4,749, $7,204, and $4,285, respectively, from both the College and employees. (46)
51 NOTES TO FINANCIAL STATEMENTS JUNE 30, 2018 AND 2017 NOTE 11 RETIREMENT PLANS (CONTINUED) Defined Contribution Benefit Plans (Continued) The College s total payroll for the years ended June 30, 2018, 2017, and 2016 was $10,685,985, $10,861,769, and $11,129,552, respectively. Total covered employees salaries in the TIAA-CREF and Great West were $8,554,900 and $115,700, respectively, in 2018; $90,455 and $120,066, respectively, in 2017; and $9,186,740 and $71,420, respectively, in Defined Benefit Plan Some employees of the College are enrolled in a defined benefit pension plan, the West Virginia Teachers Retirement System (TRS), which is administered by the West Virginia Consolidated Public Retirement Board (CPRB). Following is the College s pension liability, deferred outflows of resources and deferred inflows of resources related to pensions, revenues, and the pension expense and expenditures for the fiscal years ended June 30, 2018 and 2017: Net Pension Liability $ 498,691 $ 790,228 Deferred Outflows of Resources 171, ,008 Deferred Inflows of Resources 240, ,569 Revenues 389, ,608 Pension Expense 34, ,575 Contributions Made by BSC 59,754 59,693 TRS Plan Description TRS is a multiple employer defined benefit cost sharing public employee retirement system providing retirement benefits as well as death and disability benefits. It covers all full-time employees of the 55 county public school systems in the State of West Virginia (the State) and certain personnel of the 13 State-supported institutions of higher education, State Department of Education and the Higher Education Policy Commission hired prior to July 1, Employees of the State-supported institutions of higher education and the Higher Education Policy Commission hired after June 30, 1991, are required to participate in the Higher Education Retirement System. TRS closed membership to new hires effective July 1, TRS is considered a component unit of the State of West Virginia for financial reporting purposes, and, as such, its financial report is also included in the State of West Virginia s Comprehensive Annual Financial Report. TRS issues a publicly available comprehensive annual financial report that includes financial statements and required supplementary information for the plan. A copy of the report may be obtained from the TRS website at (47)
52 NOTES TO FINANCIAL STATEMENTS JUNE 30, 2018 AND 2017 NOTE 11 RETIREMENT PLANS (CONTINUED) Benefits Provided TRS provides retirement, death, and disability benefits. A member is eligible for normal retirement at age 60 with five years of service, age 55 with 30 years of service or any age with 35 years of service. A member may retire with 30 years of credited service at any age with the pension reduced actuarially if the member retires before age 55. Terminated members with at least five, but less than 20, years of credited service who do not withdraw their accumulated contributions are entitled to a deferred retirement commencing at age 62. Retirement benefits are equivalent to 2% of average annual salary multiplied by years of service. Average salary is the average of the 5 highest fiscal years of earnings during the last 15 fiscal years of earnings. Chapter 18, Article 7A of the West Virginia State Code assigns the authority to establish and amend the provisions of the plan, including contribution rates, to the State Legislature. Contributions The funding objective of the CPRB pension trust funds is to meet long-term benefit requirements through contributions, which remain relatively level as a percent of member payroll over time, and through investment earnings. Contribution requirements are set by CPRB. A member who withdraws from service for any cause other than death or retirement may request that the accumulated employee contributions plus interest be refunded. Member Contributions: TRS funding policy provides for member contributions based on 6% of members gross salary. Contributions as a percentage of payroll for members and employers are established by State law and are not actuarially determined. Employer Contributions: Employers make the following contributions: The State (including institutions of higher education) contributes: 1. 15% of gross salary of their State-employed members hired prior to July 1, 1991; 2. 15% of School Aid Formula (SAF) covered payroll of county-employed members; % of SAF-covered payroll od members of the TDCRS; 4. a certain percentage of fire insurance premiums paid by State residents; and 5. under WV State code section 18-9-A-6a, beginning in fiscal year 1996, an amount determined by the State Actuary as being needed to eliminate the TRS unfunded liability within 40 years of June 30, As of June 30, 2017 and 2016, the College s proportionate share attributable to this special funding subsidy was $106,928 and $133,608, respectively. The College s contributions to TRS for the years ended June 30, 2018, 2017, and 2016, were $59,754, $59,693, and $75,055, respectively. (48)
53 NOTES TO FINANCIAL STATEMENTS JUNE 30, 2018 AND 2017 NOTE 11 RETIREMENT PLANS (CONTINUED) Assumptions For the year ended June 30, 2018, the total pension liabilities for financial reporting purposes were determined by actuarial valuations as of July 1, 2016 and rolled forward to June 30, For the year ended June 30, 2017, total pension liabilities for financial reporting purposes were determined by actuarial valuations as of July 1, 2016 and rolled forward to June 30, The following actuarial assumptions were used and applied to all periods included in the measurement: Actuarial cost method: Entry age normal cost with level percentage of payroll. Asset valuation method: Investments are reported at fair (market) value. Amortization method and period: Level dollar, fixed period over 40 years, from July 1, 1994 through fiscal year Investment rate of return of 7.50%, net of pension plan administrative and investment expenses. Projected salary increases: Teachers % and nonteachers %, based on age. Inflation rate of 3.0% Discount rate of 7.50% Mortality rates based on RP-2000 Mortality Tables. Withdrawal rates: Teachers 0.8%-35% and nonteachers 1.316%-24.75%. Disability rates: % Retirement age: An age-related assumption is used for participants not yet receiving payments. Retirement rates: % Ad hoc cost-of-living increases in pensions are periodically granted by the State Legislature. However, the retirement system makes no automatic provision for such increases. Experience studies are performed at least once in every five-year period. The most recent experience study covered the period from July 1, 2005 to June 30, These assumptions will remain in effect for valuation purposes until such time as the CPRB adopts revised assumptions. The long-term expected rate of return on pension plan investments was determined using a building-block method in which best-estimate ranges of expected future real rates of return (expected returns, net of pension plan investment expense and inflation) are developed for each major asset class. These ranges are combined to produce the long-term expected rate of return by weighting the expected future real rates of return by the target asset allocation percentage and by adding expected inflation. Best estimates of the long-term arithmetic real rates of return for each major asset class included in TRS target asset allocation as of June 30, 2018 and June 30, 2017 are summarized below. (49)
54 NOTES TO FINANCIAL STATEMENTS JUNE 30, 2018 AND 2017 NOTE 11 RETIREMENT PLANS (CONTINUED) Assumptions (Continued) Long-Term Expected Target Asset Class Real Rate of Return Allocation Domestic Equity 7.0% 27.5% International Equity 7.7% 27.5% Core Fixed Income 2.7% 7.5% High-yield Fixed Income 5.5% 7.5% Real Estate 5.6% 10.0% Private Equity 9.4% 10.0% Hedge Funds 4.7% 10.0% Discount rate. The discount rate used to measure the total TRS pension liability was 7.50%. The projection of cash flows used to determine the discount rate assumed that State contributions will continue to follow the current funding policy. Based on those assumptions, TRS fiduciary net position was projected to be available to make all projected future benefit payments of current plan members. Therefore, the long-term expected rate of return on TRS investments was applied to all periods of projected benefit payments to determine the total pension liability. Sensitivity of the net pension liability to changes in the discount rate. The following presents the College s proportionate share of the TRS net pension liability as of June 30, 2018 and June 30, 2017 calculated using the discount rate of 7.50%, as well as what the College s TRS net pension liability would be if it were calculated using a discount rate that is one percentage point lower (6.50%) or one percentage point higher (8.50%) than the current rate. Current Discount 1% Decrease Rate 1% Increase (6.50%) (7.50%) (8.50%) Net Pension Liability $ 656,548 $ 498,691 $ 363,812 Net Pension Liability , , ,184 Pension Liabilities, Pension Expense, and Deferred Outflows of Resources and Deferred Inflows of Resources Related to Pensions The June 30, 2018 TRS net pension liability was measured as of June 30, 2017, and the total pension liability was determined by an actuarial valuation as of July 1, 2016, rolled forward to the measurement date of June 30, The June 30, 2017 TRS net pension liability was measured as of June 30, 2016, and the total pension liability was determined by an actuarial valuation as of July 1, 2015, rolled forward to the measurement date of June 30, (50)
55 NOTES TO FINANCIAL STATEMENTS JUNE 30, 2018 AND 2017 NOTE 11 RETIREMENT PLANS (CONTINUED) Pension Liabilities, Pension Expense, and Deferred Outflows of Resources and Deferred Inflows of Resources Related to Pensions (Continued) At June 30, 2018 the College s proportionate share of the TRS net pension liability was $1,601,518. Of this amount, the College recognized $498,691 as its proportionate share on the Statement of Net Position. The remainder of $1,102,827 denotes the College s proportionate share of net pension liability attributable to the special funding. At June 30, 2017, the College s proportionate share of the TRS net pension liability was $2,295,401. Of this amount, the College recognized $790,228 as its proportionate share on the Statement of Net Position. The remainder of $1,505,173 denotes the College s proportionate share of net pension liability attributable to the special funding. The allocation percentage assigned to each participating employer and nonemployer contributing entity is based on their proportionate share of employer and nonemployer contributions to TRS for each of the fiscal years ended June 30, 2018 and Employer contributions are recognized when due. At June 30, 2018, the College s proportion was %, an increase of % from its proportion of % calculated as of June 30, For the year ended June 30, 2018, the College recognized TRS pension expense of $34,533. Of this amount, $(72,395) was recognized as the College s proportionate share of the TRS expense and $106,928 as the amount of pension expense attributable to special funding from a nonemployer contributing entity. The College also recognized revenue of $106,928 for support provided by the State. For the year ended June 30, 2018, the College recognized TRS pension expense of $77,283. Of this amount, $(15,179) was recognized as the College s proportionate share of the TRS expense and $133,608 as the amount of pension expense attributable to special funding from a nonemployer contributing entity. The College also recognized revenue of $133,608 for support provided by the State. At June 30, 2018, deferred outflows of resources and deferred inflows of resources related to the TRS pension are as follows. Deferred Deferred Outflows Inflows June 30, 2018 of Resources of Resources Changes in Proportion and Difference Between Employer Contributions and Proportionate Share of Contributions $ 93,874 $ 216,365 Net Difference Between Projected and Actual Experience 4,336 8,884 Net Difference Between Projected and Actual Investment Earnings - 15,675 Changes in Assumptions 13,868 - Contributions After the Measurement Date 59,754 - Total $ 171,832 $ 240,924 (51)
56 NOTES TO FINANCIAL STATEMENTS JUNE 30, 2018 AND 2017 NOTE 11 RETIREMENT PLANS (CONTINUED) Pension Liabilities, Pension Expense, and Deferred Outflows of Resources and Deferred Inflows of Resources Related to Pensions (Continued) Deferred Deferred Outflows Inflows June 30, 2017 of Resources of Resources Changes in Proportion and Difference Between Employer Contributions and Proportionate Share of Contributions $ 119,791 $ 110,954 Net Difference Between Projected and Actual Experience 7,234 4,615 Net Difference Between Projected and Actual Investment Earnings 65,032 - Changes in Assumptions 31,258 - Contributions After the Measurement Date 59,693 - Total $ 283,008 $ 115,569 The College will recognize the $59,693 reported as deferred outflows of resources resulting from pension contributions after the measurement date as a reduction of the TRS net pension liability in the year ended June 30, Other amounts reported as deferred outflows of resources and deferred inflows of resources related to pensions will be recognized in TRS pension expense as follows. Fiscal Year Ending June 30, Amortization 2019 $ 31, , , , ,070 Total $ 128,846 Payables to the Pension Plan The College did not report any amounts payable for normal contributions to the TRS as of June 30, 2018 or NOTE 12 LEASES The College leases a branch campus facility in the State. Rental payments for the facility were $206,097 for the year-end June 30, Following is a schedule of future minimum lease payments for the term of this operating lease. Year Ending June 30, 2019 $ 206, (52)
57 NOTES TO FINANCIAL STATEMENTS JUNE 30, 2018 AND 2017 NOTE 13 DISCRETELY PRESENTED COMPONENT UNITS The Bluefield State College Foundation, Inc. (the Foundation) is a separate nonprofit organization incorporated in the State of West Virginia and has as its purpose to aid, strengthen and further in every proper and useful way, the work and services of the College and its affiliated nonprofit organizations Oversight of the Foundation is the responsibility of a separate and independently elected Board of Directors, not otherwise affiliated with the College. In carrying out its responsibilities, the Board of Directors of the Foundation employs management, forms policy, and maintains fiscal accountability over funds administered by the Foundation. Although the College does not control the timing or amount of receipts from the Foundation, the majority of resources, or income thereon, that the Foundation holds and invests are restricted to the activities of the College by the donors. Because these restricted resources held by the Foundation can only be used by, or for the benefit of, the College, the Foundation is considered a component unit of the College and is therefore discretely presented with the College s financial statements in accordance with GASB. Complete financial statements for the Foundation can be obtained from the President of the Bluefield State College Foundation at College Avenue, Bluefield, Virginia During the years ended June 30, 2018 and 2017, the Foundation contributed $560,313 and $250,037 respectively, to the College for scholarships and grants and employee compensation. The Corporation is a separate nonprofit organization incorporated in the State of West Virginia and has as its purpose form partnerships and develop commitments for assistance from a wide spectrum of community based organizations in both the public and private sectors. The corporation will work to identify and eliminate barriers that inhibit access to technology training and market based development activities in communities served by the College Oversight of the Corporation is the responsibility of a separate and independently elected Board of Directors, not otherwise affiliated with the College. In carrying out its responsibilities, the Board of Directors of the Corporation employs management, forms policy, and maintains fiscal accountability over funds administered by the Corporation. Although the College does not control the timing or amount of receipts from the Corporation, the majority of resources, or income thereon, that the Corporation holds and invests are restricted to the activities of the College by donors or grant restrictions. Because these restricted resources held by the Corporation can only be used by, or for the benefit of, the College, the Corporation can only be used by, or for the benefit of, the College, the Corporation is considered a component unit of the College and is therefore discretely presented with the College s financial statements in accordance with GASB. Complete financial statements for the Corporation can be obtained from the President of the Bluefield State College Research and Development Corporation at 219 Rock Street, Bluefield, Virginia (53)
58 NOTES TO FINANCIAL STATEMENTS JUNE 30, 2018 AND 2017 NOTE 14 AFFILIATED ORGANIZATIONS (UNAUDITED) There are separately incorporated organizations affiliated with the College which include the Center for Applied Research and Technology of Bluefield State College and the Bluefield State College Alumni Association. Oversight responsibility for these entities rests with independent boards and management not otherwise affiliated with the College. Accordingly, the financial statements of such organizations are not included in the accompanying combined financial statements under the blended component unit requirements. They are not included in the College s accompanying financial statements as, they (1) are not material or (2) have dual purposes (i.e., not entirely, or almost entirely for the benefit of the College). NOTE 15 CONTINGENCIES The nature of the education industry is such that, from time to time, claims will be presented against the college on account of alleged negligence, acts of discrimination, breach of contract or disagreements arising from the interpretation of laws or regulations. While some of these claims may be for substantial amounts, they are not unusual in the ordinary course of providing educational services in a higher education system. In the opinion of management, all known claims are covered by insurance or are such that an award against the College would not seriously impact the financial position of the College. Under the terms of federal grants, periodic audits are required and certain costs may be questioned as not being appropriate expenditures under the terms of the grants. Such audits could lead to reimbursement to the grantor agencies. The College s management believes disallowances, if any, will not have a significant financial impact on the College s financial position. The College owns various buildings which are known to contain asbestos. The College is not required by federal, state, or local law to remove the asbestos from its buildings. The College is required under Federal Environmental, Health and Safety Regulations to manage the presence of asbestos in its buildings in a safe condition. The College addresses its responsibility to manage the presence of asbestos in its buildings on a case-by-case basis. Significant problems of dangerous asbestos conditions are abated as the condition becomes known. The College also addresses the presence of asbestos as building renovation or demolition projects are undertaken and through asbestos operation and maintenance programs directed at containing, managing, or operating with the asbestos in a safe condition. (54)
59 NOTES TO FINANCIAL STATEMENTS JUNE 30, 2018 AND 2017 NOTE 16 NATURAL CLASSIFICATIONS WITH FUNCTIONAL CLASSIFICATIONS These tables represent operating expenses within both natural and functional classifications for the years ended June 30: 2018 Supplies Salaries and Scholarships Fees and Other and Assessed by Wages Benefits Services Utilities Fellowships Depreciation Commission Total Instruction $ 5,645,077 $ 1,721,882 $ 637,097 $ 299 $ - $ - $ - $ 8,004,355 Research 5,179 5,427 5, ,012 Public Service 94,696 39,543 32, ,926 Academic Support 719, , ,248 1, ,285,934 Student Services 1,210, , , ,913,965 General Institutional Support 1,975, ,595 1,183,931 19, ,353,540 Operations and Maintenance of Plant 336, , , , ,907,830 Student Financial Aid ,336, ,336,329 Auxiliary Enterprises 420, , ,270 93, ,582,313 Depreciation ,410,064-1,410,064 Other ,334 61,334 Total $ 10,406,513 $ 2,820,665 $ 3,942,856 $ 1,060,842 $ 1,336,329 $ 1,410,064 $ 61,334 $ 21,038, Supplies Salaries and Scholarships Fees and Other and Assessed by Wages Benefits Services Utilities Fellowships Depreciation Commission Total Instruction $ 5,540,093 $ 1,442,032 $ 691,475 $ - $ - $ - $ - $ 7,673,600 Research 11,075 2,136 7, ,767 Public Service 128,745 35,465 82, ,483 Academic Support 834, , ,537 1, ,469,009 Student Services 1,211, , , ,952,093 General Institutional Support 2,001, , ,063 34, ,602,573 Operations and Maintenance of Plant 533, , , , ,778,077 Student Financial Aid ,282, ,282,766 Auxiliary Enterprises 424, , ,410 90, ,269,138 Depreciation ,423,716-1,423,716 Other ,286 67,286 Total $ 10,685,968 $ 3,024,204 $ 3,387,977 $ 913,591 $ 1,282,766 $ 1,423,716 $ 67,286 $ 20,785,508 (55)
60 NOTES TO FINANCIAL STATEMENTS JUNE 30, 2018 AND 2017 NOTE 17 COMPONENT UNIT DISCLOSURES FOUNDATION, INC. The following are the notes taken directly from the Foundation s financial statements. NOTE 17.1 SIGNIFICANT ACCOUNTING POLICIES AND OTHER MATTERS Nature of Foundation Bluefield State College Foundation, Inc. (the Foundation) is incorporated as a nonprofit corporation under the laws of the State of West Virginia. The purpose of the Foundation is to provide for student scholarships and faculty and staff development at Bluefield State College (the College). The Foundation is managed by an independently elected Board of Directors not otherwise affiliated with the College. All contributions generally are for the benefit of the College and are administered by the Foundation. Basis of Financial Statement Presentation and Accounting The financial statements of the Foundation have been prepared in accordance with accounting principles generally accepted in the United States of America. The preparation of financial statements in conformity with accounting principles generally accepted in the United States of America requires management to make estimates and assumptions that affect the reported amounts of assets and liabilities, the disclosure of contingent assets and liabilities at the date of the financial statements, and the reported amounts of revenues and expenses during the period. Actual results could differ from those estimates. The accompanying financial statements present information regarding the Foundation s financial position and activities according to three classes of net assets: unrestricted, temporarily restricted, and permanently restricted. The three classes are differentiated based on the existence or absence of donor-imposed restrictions, as described below: Unrestricted net assets are free of donor-imposed restrictions. Unrestricted net assets may be designated for specific purposes by action of the Board of Directors or may otherwise be limited by contractual agreements with outside parties. Revenues, gains, and losses that are not temporarily or permanently restricted by donors are included in this classification. Expenses are reported as decreases in this classification. Temporarily restricted net assets are limited in use by donor-imposed stipulations that expire either by the passage of time or that can be fulfilled by action of the Foundation pursuant to those stipulations. Permanently restricted net assets are amounts required by donors to be held in perpetuity; however, the income on these assets is available to meet various restricted and other operating needs. These net assets primarily include permanent endowment funds and funds held in trust by others. (56)
61 NOTES TO FINANCIAL STATEMENTS JUNE 30, 2018 AND 2017 NOTE 17.1 SIGNIFICANT ACCOUNTING POLICIES AND OTHER MATTERS (CONTINUED) Cash and Short-Term Investments The Foundation considers all highly liquid investments with maturity of three months or less when purchased to be cash and cash equivalents. Cash equivalents are stated at cost, which approximates market value. Cash held for long-term investment is classified as cash restricted for long-term investment and by agency relationships. The money market investment accounts are approximately $925,000 and $992,000 for June 30, 2018 and 2017, respectively, and the principal underlying assets are securities of the U.S. Government, its agencies, authorities and instrumentality s and obligations of U.S. banks. The estimated fair value of short-term investments approximates cost. Fund Descriptions General Administrative Account Funds that were released from Title III restrictions and internally restricted by the Foundation s Board for the purpose of ensuring funds be available for future administrative costs. Most donors elect to endow funds to be permanently restricted for scholarships and, following the market s downturns, the Board felt it necessary to set aside funds to cover needed future administrative costs. Endowed Account Funds permanently set aside by donors for specific uses with the majority designated for scholarships. The Robertson endowment; however, is for use by the library. Peters Engineering Chair Account endowed for use as directed by the Head of the Engineering Division. FCB Title III and FCBT Title III Restrictions have been satisfied and the funds have now been released for the Foundation to use in any manner it feels is beneficial to Bluefield State College. The Board has determined to use seventy-five percent (75%) income for disbursements and has internally restricted the use of the remaining funds for future needs. BSC General Foundation Account Unrestricted funds and property held by the Foundation. Monies are used for administrative costs, discretionary funds for use by the President and Executive Director of the Foundation as approved by the Board and any other day-to-day costs of maintaining the Foundation. Use of Estimates The preparation of financial statements in conformity with accounting principles generally accepted in the United States of America requires management to make estimates and assumptions that affect certain reported amounts and disclosures. Accordingly, actual results could vary from those estimates. Note Receivable Note receivable is reported at its principal outstanding balance. The Board has approved for the receivable to be nonaccrual. (57)
62 NOTES TO FINANCIAL STATEMENTS JUNE 30, 2018 AND 2017 NOTE 17.1 SIGNIFICANT ACCOUNTING POLICIES AND OTHER MATTERS (CONTINUED) Investments Investments in marketable securities with readily determinable fair values and all investments in debt securities are reported at their fair values in the statements of financial position. The fair value of investments in equities, bonds, U.S. securities, exchange traded mutual funds, REIT and short-term assets is determined by reference to quoted market prices. Net unrealized and realized gains or losses are reflected in the Statements of Activities. Certain land and other investments, which are not readily marketable, are carried at cost. Gifts of investments are recorded at their fair value (based on quotations or appraisals) at date of gift. Purchases and sales of investments are recorded on the trade date. Income and realized and unrealized net gains on investments of endowment and similar net asset classes are reported as follows: As increases in permanently restricted net assets if the terms of the gift require that they be added to the principal of a permanent endowment fund; As increases in temporarily restricted net assets if the terms of the gift impose restrictions on the use of the income; As increases in unrestricted net assets in all other cases. Assets Whose Use is Limited Assets whose use is limited consist of assets internally designated by the Foundation for specific use. The Foundation retains control over these assets and may, at its discretion, subsequently use the assets for other purposes. These assets consist of cash and cash equivalents, investments, and other property. Cash and cash equivalents and investments within this category follow the same policies noted earlier for regular cash and cash equivalents (those whose use is not limited). Amounts Held on Behalf of Others Amounts held on behalf of others are used to account for assets held by the Foundation as an agent for other organizations. These funds are custodial by nature (assets equal liabilities) and do not involve measurement of operations. Contributions Contributions, including unconditional promises to give or contributions receivable, are recognized as unrestricted, temporarily restricted, or permanently restricted support, depending on the existence and/or nature of any donor restrictions, in the period the donor s commitment is received. Unrestricted, unconditional promises to give for future operations are recognized as temporarily restricted revenues unless the donor explicitly stipulates its use to support current period activities. (58)
63 NOTES TO FINANCIAL STATEMENTS JUNE 30, 2018 AND 2017 NOTE 17.1 SIGNIFICANT ACCOUNTING POLICIES AND OTHER MATTERS (CONTINUED) Conditional promises to give are not recognized until they become unconditional, that is, when the conditions on which they depend are substantially met. Contributions of assets other than cash are recorded at their estimated fair value. Contributions to be received after one year are discounted at an appropriate discount rate commensurate with the risks involved. Amortization of the discount is recorded as additional contribution revenue in accordance with donor-imposed restrictions, if any, on the contributions. An allowance for uncollectible contributions receivable is provided based upon management s judgment, including such factors as prior collection history, type of contribution, and nature of the fundraising activity. Contributions received with donor-imposed restrictions that are met in the same year as received are reported as revenues of the temporarily restricted net asset class, and a reclassification to unrestricted net assets is made to reflect the expiration of such restrictions. The Foundation occasionally utilizes office space located in a college owned building and receives assistance in development and administration of the Foundation by an employee of the College. The value of these services as well as other donated volunteer services are not reflected in the accompanying financial statements since there is no objective basis available by which to measure the value of such services. Income Tax Status The Foundation is a nonprofit organization exempt from federal income taxes under Internal Revenue Code Section 501(c)(3) based upon its determination letter dated October 16, In addition, the Foundation qualifies for the charitable contribution deduction under Section 170(b)(1)(A) and has been classified as an organization that is not a private foundation within the meaning of Section 509(a) of the Internal Revenue Code. The Federal Forms 990 of the Foundation for the fiscal years 2017, 2016, and 2015 are subject to examination by the Internal Revenue Service, generally for three years after they are filed. Credit Risk Concentration Financial instruments, which potentially subject the Foundation to concentrations of credit risk, consist principally of cash and cash equivalents and investments. The Foundation places its temporary cash investments with high credit quality financial institutions and does not believe it is exposed to any significant credit risk on cash and cash equivalents. Concentration of credit risk for investments is limited by the Foundation s policy of diversification of investments. (59)
64 NOTES TO FINANCIAL STATEMENTS JUNE 30, 2018 AND 2017 NOTE 17.1 SIGNIFICANT ACCOUNTING POLICIES AND OTHER MATTERS (CONTINUED) Net Asset Classifications of Institutional Funds The Foundation holds institutional funds, principally endowment funds, subject to the Uniform Prudent Management of Institutional Funds Act (UPMIFA) as adopted in the State of West Virginia. Endowment is a commonly used term to refer to the resources that have been restricted by the donor or designated by the Board that will be invested to provide future revenue to support the Foundation s activities. The Foundation s endowment consists of individual funds established for a variety of purposes. As titled, UPMIFA provides guidance and applicable regulations relative to the management of applicable funds. In response to UPMIFA, the Foundation adopted the provisions of authoritative accounting guidance for the net asset classification of donor restricted endowment funds for an organization that is subject to UPMIFA and also required related financial statement disclosures. Interpretation of UPMIFA The Board of Directors of the Foundation has interpreted UPMIFA as requiring the preservation of the fair value of the original gift as of the gift date of the donor-restricted endowment funds absent explicit donor stipulations to the contrary. The Foundation classifies as permanently restricted net assets (a) the original value of gifts donated to the permanent endowment, (b) the original value of subsequent gifts to the permanent endowment, and (c) accumulations of investment returns to the permanent endowment made in accordance with the direction of the applicable donor gift instrument, when applicable, at the time accumulation is added to the fund. The remaining portion of the donor-restricted endowment fund that is not classified as permanently restricted net assets is classified as temporarily restricted net assets until those amounts are appropriated for expenditure by the Foundation in a manner consistent with the standard of prudence prescribed by UPMIFA. In accordance with UPMIFA, the Foundation considers the following factors in making a determination to appropriate or accumulate donor-restricted endowment funds: (1) the duration and preservation of the fund, (2) the purposes of the Foundation and the donor-restricted endowment fund, (3) general economic conditions, (4) the possible effect of inflation and deflation, (50 the expected total return from income and the appreciation of investment, (6) other resources of the Foundation, and (7) the investment policies of the Foundation. Return Objectives and Risk Parameters The Foundation has adopted investment and spending policies for endowment assets that attempt to provide a predictable stream of funding to programs supported by its endowment while seeking to maintain the purchasing power of the endowment assets. Endowment assets include those of donor-restricted funds that organizations must hold in perpetuity or for a donor-specified period as well as board-designated funds. Under this policy, as approved by the Board of Directors, the endowment assets are invested in accordance with insurance companies regulations as set forth in the West Virginia State Code. Actual returns in any given year may vary from this amount. (60)
65 NOTES TO FINANCIAL STATEMENTS JUNE 30, 2018 AND 2017 NOTE 17.1 SIGNIFICANT ACCOUNTING POLICIES AND OTHER MATTERS (CONTINUED) Net Asset Classifications of Institutional Funds (Continued) Strategies Employed for Achieving Objectives To satisfy its long-term rate-of-return objectives, the Foundation relies on a total return strategy in which investment returns are achieved through both capital appreciation (realized and unrealized) and current yield (interest and dividends). The Foundation recognizes that unsupervised assets will probably be subjected to an inflationary loss of purchasing power; therefor the funds should be managed in a way that will minimize the effect of inflation. Fixed income-like investments will be used to reduce volatility of the overall portfolio while providing a predictable stream of income. Spending Policy and How the Investment Objectives Related to Spending Policy The Foundation employs a total return endowment spending policy that establishes the amount of endowment investment return that is available to support current needs and restricted purposes. This policy is designed to insulate program spending from capital market fluctuations and to increase the amount of return that is reinvested in the corpus of the fund in order to enhance its long-term value. Except for the Title III funds, the Foundation s annual target spending rate is currently 4% of the average market value of the funds, calculated as of February 28 of the year immediately preceding the beginning of the Foundation s fiscal year. The annual spending rate for the Title III Funds is 75% of income. If cash yield (interest and dividends) is less than the spending rate, realized gains can be used to make up the deficiency. Any income excess of the spending rate is to be reinvested in the endowment. Funds with Deficiencies (Underwater Funds) From time-to-time, the fair value of assets associated with individual donor-restricted endowment funds may fall below the level that the donor or UPMIFA requires that Foundation to retain as a fund or perpetual duration. Deficiencies of this nature reported in unrestricted net assets were $-0- as of June 30, 2018 and Subsequent Events Subsequent events have been evaluated through October 23, 2018, the date the financial statements were available to be issued. NOTE 17.2 RECEIVABLES Contributions Receivable Unconditional Promises to Give $ 389,030 $ 5,000 Less: Allowance for Uncollectible Promises - - Unamortized Discount of 2.3% and 1.6% for 2018 and 2017, respectively (26,443) (115) Net Unconditional Promises to Give $ 362,587 $ 4,885 (61)
66 NOTES TO FINANCIAL STATEMENTS JUNE 30, 2018 AND 2017 NOTE 17.2 RECEIVABLES (CONTINUED) Contributions Receivable (Continued) Expected to be Collected In: Less Than One Year $ 67,658 $ 2,424 One to Five Years 294,929 2,461 $ 362,587 $ 4,885 The ownership of pledges receivable for each class of net assets as of June 30, 2018 and 2017 is as follows: Temporarily Restricted $ 362,587 $ 4,885 On December 16, 2015, the Hugh I. Shott, Jr. Foundation Inc. agreed to donate to the Foundation a Deed of Trust in the amount of $2 million secured by a certain real estate known as the Mountain View Real Estate owned by the Bluefield State College Research & Development Corporation (BSC R&D). The Foundation recognized that BSC R&D s current financial condition made it impossible to pay the principal and unpaid interest due by the original maturity date; therefore, the promissory note was modified extending the maturity to January 3, 2021 with annual installments of $100,000 and carrying an annual interest rate at 5%. At the time of the deed of trust transfer, the note included $11,781 of accrued interest. The Foundation s Board approved the waiver of the interest and recorded a donation to the BSC R&D in the same amount. NOTE 17.3 INVESTMENTS Investments are comprised of the following: Measured at Fair Value Certificates of Deposits $ 99,119 $ 356,420 Corporate and Municipal Bonds and Notes 1,185,196 1,246,534 Equity Investments 5,475,385 5,634,906 Mutual Funds 4,281,256 3,650,001 REIT 284,809 30,953 Limited Partnership 27,670 33,580 11,353,435 10,952,394 Measured at Cost Real Estate 326, ,600 $ 11,680,035 $ 11,294,994 (62)
67 NOTES TO FINANCIAL STATEMENTS JUNE 30, 2018 AND 2017 NOTE 17.3 INVESTMENTS (CONTINUED) The ownership of investments for each class of net assets as of June 30, 2018 and 2017 is as follows: Unrestricted $ 9,149,986 $ 9,142,066 Temporarily Restricted 825, ,070 Permanently Restricted 1,704,949 1,464,858 $ 11,680,035 $ 11,294,994 Realized and unrealized gains (losses) recognized during the years ended June 30, 2018 and 2017 consisted of the following: Realized $ (104,738) $ 313,695 Unrealized 686, ,566 $ 582,216 $ 713,261 Government obligations consist principally of obligations to the U.S. Treasury and agencies. Corporate obligations are concentrated in the financial services and utilities sectors. Corporate equities and mutual funds are diversified, with no significant industry concentrations. NOTE 17.4 UNRESTRICTED NET ASSETS Unrestricted net assets as of June 30, 2018 and 2017 include the following: Designated: Investment in Land, Leased for Charitable Purposes $ 250,000 $ 250,000 Internally Restricted by Board 8,365,261 8,267,400 8,615,261 8,517,400 Undesignated: Other 2,901,685 3,032,866 Investment in Land 92,600 92,600 2,994,285 3,125,466 $ 11,609,546 $ 11,642,866 Land is leased to another nonprofit entity for $1 per year to assist in its charitable purpose. The lease renews in 10-year terms, but automatically terminates May 31, 2083 or if the land is not used for the stated purpose. The lease provides that the leasee must maintain liability coverage of one million dollars to protect the Foundation. (63)
68 NOTES TO FINANCIAL STATEMENTS JUNE 30, 2018 AND 2017 NOTE 17.4 UNRESTRICTED NET ASSETS (CONTINUED) As of June 30, 2018, funds internally restricted by the Foundation s Board for the purpose of ensuring funds be available for future needs of the Foundation totaled $8,365,261 and $8,267,400 for administrative costs. Other undesignated funds include the $2 million deed of trust with the BSC R&D Corporation NOTE 17.5 TEMPORARILY RESTRICTED NET ASSETS Temporarily restricted net assets are available for the following purposes or periods: Provide Scholarship Assistance and Operations of the Foundation $ 1,207,873 $ 688,150 Engineering Technology Department 232, ,052 $ 1,440,630 $ 910,202 NOTE 17.6 PERMANENTLY RESTRICTED NET ASSETS Permanently restricted net assets as of June 30, 2018 and 2017 are restricted to investment in perpetuity, the income from which is expendable to support: Engineering Technology Department $ 150,000 $ 150,000 Financial Aid 1,776,009 1,704,931 $ 1,926,009 $ 1,854,931 NOTE 17.7 FAIR VALUE MEASUREMENTS The framework for measuring fair value provides a fair value hierarchy that prioritizes the inputs to valuation techniques used to measure fair value. The hierarchy gives the highest priority to unadjusted quoted prices in active markets for identical assets or liabilities (Level 1) and the lowest priority to unobservable inputs (Level 3). The three levels of the fair value hierarchy under FASB ASC 820 are described as follows: The fair value measurement accounting literature establishes a fair value hierarchy that prioritizes the inputs to valuation techniques used to measure fair value. This hierarchy consists of three broad levels. Level 1 inputs consist of unadjusted quoted prices in active markets for identical assets and have the highest priority: Level 2 inputs consist of observable inputs other than quoted prices for identical assets; and Level 3 inputs consist of unobservable inputs and have the lowest priority. The Foundation uses appropriate valuation techniques based on the available inputs to measure the fair value of its investments. When available, the Foundation measures fair value using Level 1 inputs because they generally provide the most reliable evidence of fair value. (64)
69 NOTES TO FINANCIAL STATEMENTS JUNE 30, 2018 AND 2017 NOTE 17.7 FAIR VALUE MEASUREMENTS (CONTINUED) Level 1 Fair Value Measurements Cash and short-term investments have principal underlying assets which are securities of the U.S. government, its agencies, authorities, and instrumentalities and obligations of U.S. banks. The estimated fair value approximates cost. Cash restricted for long term is classified as investment and is stated at cost, which approximates market value. The fair value of investments in equities, bonds, U.S. securities, exchange traded mutual funds, partnerships and short-term assets is determined by reference to quoted market prices. Gains and losses (realized and unrealized) included in statements of activities are reported in net realized and unrealized gain (loss). June 30, 2018 Fair Value Measurements at Reporting Date Using Quoted Prices in Active Significant Markets for Other Significant Identical Observable Unobservable Fair Assets Inputs Inputs Value (Level 1) (Level 2) (Level 3) Cash and Short-Term Investments $ 447,720 $ 447,720 $ - $ - Cash Restricted for Long-Term Investment 214, , Investments: Certificates of Deposits 99,119 99, Corporate and Municipal Bonds and Notes 1,185,196 1,185, Equity Investments 5,475,385 5,475, Mutual Funds 4,281,256 4,281, REIT 284, , Limited Partnership 27,670 27, $ 12,015,649 $ 12,015,649 $ - $ - June 30, 2017 Cash and Short-Term Investments $ 525,652 $ 525,652 $ - $ - Cash Restricted for Long-Term Investment 325, , Investments: Certificates of Deposits 356, , Corporate and Municipal Bonds and Notes 1,246,534 1,246, Equity Investments 5,634,906 5,634, Mutual Funds 3,650,000 3,650, REIT 30,953 30, Limited Partnership 33,580 33, $ 11,803,298 $ 11,803,298 $ - $ - (65)
70 NOTES TO FINANCIAL STATEMENTS JUNE 30, 2018 AND 2017 NOTE 17.8 RELATED PARTY TRANSACTIONS Certain local financial institutions hold substantially all the Foundation s assets in their trust departments. Some of the Foundation s Board members also serve as officers and directors of these institutions. The Foundation paid $29,100 and $28,114 in management fees to these related parties for the years ended June 30, 2018 and 2017, respectively. BSC R&D is related to the Foundation through the common purpose of supporting Bluefield State College. Both entities are consolidated into the College s financial statements. Donations to BSC R&D totaled $54,669 and $628,318 for the years ended June 30, 2018 and 2017, respectively. NOTE 17.9 FUNCTIONAL ALLOCATION OF EXPENSES Expenses are reported on a functional basis that discloses the purposes for which the expenses have been incurred. A brief description of each of the functional classifications follows: College Support Funds expended primarily to provide support services for Bluefield State College. It includes scholarships awarded to the students and the provision of services that directly assist the academic functions, such as faculty development, as well as capital projects. Foundation Fundraising Expenses Expenses related to community and alumni relations, including development and fundraising. Financial Management Expenses Expenses incurred principally for (1) central executive-level activities concerned with management of day-to-day operations and long-range planning, (2) legal and fiscal operations, and (3) administrative data processing. NOTE NET ASSETS RELEASED FROM RESTRICTIONS Net assets were released from donor restrictions when expenses were incurred to satisfy the restricted purposes or by occurrence of other events as specified by donors. Restrictions were satisfied as follows for the years ended June 30, 2018 and 2017: Operating: Financial Aid $ (228,426) $ 34,335 NOTE 18 COMPONENT UNIT DISCLOSURES RESEARCH AND DEVELOPMENT CORPORATION The following are the notes taken directly from the Research and Development Corporation s financial statements. (66)
71 NOTES TO FINANCIAL STATEMENTS JUNE 30, 2018 AND 2017 NOTE 18.1 SUMMARY OF SIGNIFICANT ACCOUNTING POLICIES Nature of Activities Bluefield State College Research and Development Corporation (the Corporation) was organized for the purpose of operating a nonprofit organization exclusively for charitable, educational, and scientific purposes within the meaning of Section 501(c)(3) of the Internal Revenue Code. In 2008, the Corporation purchased a college dormitory facility to house students. The majority of revenues are derived from dormitory rooms rented to students. Other revenues are derived from other rental income, as well as federal, state, or private sources in the form of grants. The Corporation provides most of its resources for the benefit of Bluefield State College. Furthermore, because of the relationship with Bluefield State College the Corporation is considered a discretely presented component unit of the Bluefield State College. Basis of Accounting The financial statements of the Corporation have been prepared on the accrual basis of accounting and, accordingly, reflect all significant receivables, payables and other liabilities. Basis of Presentation Financial statement presentation follows the requirements of the Financial Accounting Standards Board and the Corporation reports using accounting principles generally accepted in the United States of America. The Corporation is required to report information regarding its financial position and activities according to three classes of net assets: unrestricted net assets, temporarily restricted net assets, and permanently restricted net assets. Use of Estimates The preparation of financial statements in conformity with accounting principles generally accepted in the United States of America requires management to make estimates and assumptions that affect certain reported amounts and disclosures. Accordingly, actual results could differ from those estimates. Cash and Cash Equivalents For purposes of the statements of cash flows, the Corporation considers all highly liquid investments available for current use with an initial maturity of three months or less to be cash equivalents. The Corporation maintains its cash in bank deposit accounts which, at times, may exceed federally insured limits. The Corporation has not experienced any losses in such accounts. The Corporation believes that the banks are credit worthy and that it is not exposed to any significant credit risk on cash and cash equivalents. Receivables The Corporation has receivables from grants and other state agencies, and it also leases office space to businesses and dormitory rooms to students based on contractual agreements. Receivables are stated at fair value with an allowance for doubtful accounts, based on historical collection experience, and an evaluation of the accounts receivable that are deemed delinquent based on billing due dates or other contractual terms, with no interest accrued. When accounts are deemed uncollectible, they are charged against the allowance. The allowance for doubtful accounts for the years ended June 30, 2018 and 2017 was $119,706 and $124,289, respectively. (67)
72 NOTES TO FINANCIAL STATEMENTS JUNE 30, 2018 AND 2017 NOTE 18.1 SUMMARY OF SIGNIFICANT ACCOUNTING POLICIES (CONTINUED) Inventories Inventories are stated at the lower of cost or market, with cost determined primarily on the first-in, first-out method. Funds Held for Others Funds held for others are used to account for assets held by the Corporation as an agent. These funds are custodial by nature (assets equal liabilities) and do not involve measurement of operations. At June 30, 2018 and 2017, approximately $298,100 and $272,700, respectively, of the funds held for others balance was held on behalf of Bluefield State College, a related party of the Corporation. Property and Equipment Property and equipment are stated at cost at the date of acquisition or fair value at the date of the gift, less accumulated depreciation. Additions, improvements, and expenditures that materially improve or extend the life of an asset are capitalized. The Corporation utilizes a capitalization threshold of $5,000 for equipment and $25,000 for building. Maintenance and repairs are charged to expense as incurred. Upon retirement or sale of an asset, its cost and related accumulated depreciation are removed from the property accounts. Depreciation is calculated on the straight-line method over the estimated useful lives of the depreciable assets. Depreciation expense for the years ended June 30, 2018 and 2017 was $-0- and $70,108, respectively. Impairment of Property, Equipment, and Intangibles If facts and circumstances suggest that property, equipment, or intangibles may be impaired, the carrying value is reviewed for recoverability. If this review indicates that the carrying value of the asset(s) will not be recovered, considering a fair value determination based on projected undiscounted cash flows related to the asset over its estimated remaining life or the potential sale price of the asset, the carrying value of the asset is reduced to its estimated fair value through an impairment loss. An impairment loss of $820,090 was recognized on the statement of activities for the years ended June 30, 2017, related to the valuation of property, equipment, and intangibles. Accounts Payable and Accrued Expenses Accounts payable and accrued expenses consist primarily of expenses incurred for the operation of the Mountain View Dormitory and related payroll liabilities. Unearned Revenue Unearned revenue consists of grants that have been received for a specific purpose, but have not yet met revenue recognition criteria. Unrestricted Net Assets The unrestricted category consists of funds whose use is limited only to the extent that the Corporation s bylaws limit the activities of the organization. Contributions with donorimposed restrictions met in the same year in which the contribution is recognized are reported as changes in unrestricted net assets. (68)
73 NOTES TO FINANCIAL STATEMENTS JUNE 30, 2018 AND 2017 NOTE 18.1 SUMMARY OF SIGNIFICANT ACCOUNTING POLICIES (CONTINUED) Temporarily Restricted Net Assets Temporarily restricted net assets are comprised of funds whose use has been limited by donors to a specific time period and/or purpose. The Corporation currently has no temporarily restricted net assets. Permanently Restricted Net Assets Permanently restricted net assets are comprised of funds whose use have been restricted by the donor and must be maintained permanently by the Corporation. The Corporation currently has no permanently restricted net assets. Support and Revenue Support received under conditional contracts and grants is reported as deferred revenue until qualifying expenses have been incurred or other conditions have been substantially met. Contracts and grants receivable represent amounts expected to be received after yearend on approved grants. Contributed Services, Supplies, and Space Contributions of services are recognized if the services received create or enhance nonfinancial assets, or require specialized skills, are provided by individuals possessing those skills, and would typically need to be purchased if not provided by donation. Contributed services and promises to give services that do not meet the above criteria are not recognized. Contributed services that are recognized are valued at the estimated cost that would have been incurred by the Corporation to purchase similar services. Donated space is valued at the estimated fair rental value. Donations of occupancy costs and other noninventory items are expensed during the year the contributions are provided. Functional Reporting Expenses are reported on a functional basis that discloses the purpose for which the expenses have been incurred. A brief description of each of the functional classifications is as follows: Program Services Represent funds expended primarily to provide support for certain federal, state and private research and development programs. Management and General Represent expenses incurred principally for (1) executive level activities concerned with management of the operations, (2) legal and fiscal operations, and (3) other administrative related expenses. Fundraising Represents expenses related to community and other development costs expended to perform fundraising for the Corporation. The Corporation had no fundraising expenditures for the years ended June 30, 2018 and Advertising Costs Total advertising costs for the years ended June 30, 2018 and 2017 were $-0- and $7,069, respectively. (69)
74 NOTES TO FINANCIAL STATEMENTS JUNE 30, 2018 AND 2017 NOTE 18.1 SUMMARY OF SIGNIFICANT ACCOUNTING POLICIES (CONTINUED) Concentrations Approximately 49% and 25% of the Corporation s support was provided by grants from the Federal Government for the years ended June 30, 2018 and 2017, respectively. Income Tax Status The Corporation is exempt from federal income tax on its exempt purpose activities as an organization described in Section 501(c)(3) of the Internal Revenue Code. For the years ended June 30, 2018 and 2017, the Corporation has no material uncertain tax positions to be accounted for in the financial statements under professional standards. The Corporation recognizes interest and penalties, if any, related to unrecognized tax benefits in interest expense. As of June 30, 2018 tax years ending on or after June 30, 2015 remain subject to examination. Reclassifications Certain amounts in the 2017 financial statements have been reclassified to conform to the 2018 presentation. NOTE 18.2 RECEIVABLES The following is a summary of receivables due the Corporation under grant or lease contractual agreements at June 30: Student Rent Receivable $ 114,522 $ 159,310 Marshall University Research/IDEA Network of Biomedical Research Excellence Grants 73,921 15,302 NASA Grant 4,078 7,200 West Virginia University Health Science Technology Grant 10,287 8,528 Marshall University Health Science Technology Grant - 7,655 Other Accounts Receivables 20,808 14,835 Less: Allowance for Doubtful Accounts (119,706) (124,289) $ 103,910 $ 88,541 NOTE 18.3 PROPERTY AND EQUIPMENT Property and equipment consisted of the following at June 30: Land $ 766,891 $ 766,891 Land Improvements 7,076 7, , ,967 Less: Accumulated Depreciation (7,076) (7,076) $ 766,891 $ 766,891 (70)
75 NOTES TO FINANCIAL STATEMENTS JUNE 30, 2018 AND 2017 NOTE 18.4 LONG-TERM DEBT Long-term debt consisted of the following at June 30: Description The Corporation borrowed $1.8 million in January 2008 by issuing bonds through the City of Bluefield. The bonds mature in Bond proceeds were used to purchase a dormitory facility. Monthly payments are $12,392, including a fixed rate of interest at 5.5% per annum. The debt is secured by land, building, furniture, fixtures, and equipment. The debt agreement also contains a number of financial covenants. The Corporation is in compliance with all such covenants. $ 1,104,827 $ 1,183,156 The Corporation assumed $2.0 million in debt as part of a transaction where the Corporation acquired a dormitory facility. The debt is due in Debt is secured by a second lien on land, building, furniture, fixtures and equipment. Accrued interest is due in 2021 at a fixed rate of 5.0% per annum. The Corporation is in compliance with all debt covenants. 2,000,000 2,000,000 3,104,827 3,183,156 Less: Current Portion 90,065 85,257 Long-Term Portion $ 3,014,762 $ 3,097,899 Debt matures as follows at June 30: Year Ending June 30, Amount 2019 $ 90, , ,100, , ,426 Thereafter 604,492 Total $ 3,104,827 Interest expense was $157,787 and $172,842 for the years ended June 30, 2018 and 2017, respectively. NOTE 18.5 LEASES The Corporation leases office space to various third party businesses under operating lease agreements. The building in which the office space is leased was impaired during fiscal year The cost of the building was valued at $-0- in the statement of financial position at June 30, 2018 and Aggregate rental income from the lease agreements was approximately $62,000 and $55,000 for the years ended June 30, 2018 and 2017, respectively. Future minimum rentals amount are as follows at June 30: (71)
76 NOTES TO FINANCIAL STATEMENTS JUNE 30, 2018 AND 2017 NOTE 18.5 LEASES (CONTINUED) Year Ending June 30, Amount 2019 $ 14, ,322 Total $ 19,870 NOTE 18.6 CONTINGENCIES Under the terms of federal and state grants, periodic audits are required and certain costs may be questioned as not being appropriate expenditures under the terms of the grants. Such audits could lead to reimbursement to the grantor agencies. The Corporation s management believes disallowances, if any, will not have a significant financial impact on the Corporation s financial position. NOTE 18.7 RELATED PARTY TRANSACTIONS The Corporation conducts transactions with the Bluefield State College Foundation (the Foundation) throughout the year. The transactions primarily consist of donations from the Foundation to the Corporation, which amounted to approximately $155,000 and $728,000 during the years ended June 30, 2018 and 2017, respectively Federal Programs: National Institute of Health/Department of Health and Human Services Grant $ 125,508 $ 113,668 Marshall University Research/IDEA Network of Biomedical Research Excellence Grant 116, ,513 NASA Grant 12,146 8,329 West Virginia University Health Science Technology Academy Grant 43,816 17,794 Title III Summer Research Grant - 1,694 Department of Health and Human Services Substance Abuse and Mental Health Services Administration Grant 125,955 47,980 National Institute of Health Radon Project Grant - 3,800 Marshall University Health Science Technology Academy Grant 31, , ,778 State Programs: Higher Education Policy Commission Grant American Legacy Grant 743 4,230 Governor's STEM Initiative Grant - 4,530 Tobacco Control Grant ,030 Private and Unrestricted Programs: MountainView Dormitory Facility 584, ,194 Highmark Foundation Grant 51,598 1,495 Bluefield State College International Initiatives 6,763 1,295 NCAA Choice Grant 740 3, , ,510 Support Services: Management and General 144, ,945 $ 1,243,960 $ 1,591,263 (72)
77 NOTES TO FINANCIAL STATEMENTS JUNE 30, 2018 AND 2017 NOTE 18.8 DETAILS OF PROGRAM SERVICES AND SUPPORT SERVICES Details of program services and support services at June 30 are as follows: 2018 Supplies Scholarships Salaries and Fellowships Depreciation and Other and Support and Wages Benefits Services Utilities Services Amortization Interest Other Total Research $ - $ - $ 293,544 $ - $ - $ - $ - $ - $ 293,544 Student Support 145,695 16, , ,657 25, ,358 Depreciation and Amortization Interest , ,787 Other 82,191 3, ,772 83, , ,089 $ 227,886 $ 19,492 $ 585,370 $ 222,697 $ 25,832 $ - $ 157,787 $ 52,714 $ 1,291, Supplies Scholarships Salaries and Fellowships Depreciation and Other and Support and Wages Benefits Services Utilities Services Amortization Interest Other Total Research $ - $ - $ 147,237 $ - $ - $ - $ - $ - $ 147,237 Student Support 187,420 15, , ,987 66, ,952 Depreciation and Amortization , ,108 Interest , ,842 Other 82,522 3, ,245 82, ,090 1,315,214 $ 269,942 $ 19,170 $ 731,142 $ 261,673 $ 66,386 $ 70,108 $ 172,842 $ 820,090 $ 2,411,353 NOTE 18.9 NATURAL CLASSIFICATIONS WITH FUNCTIONAL CLASSIFICATIONS The natural classifications with functional classifications at June 30 are as follows: Rental Income $ 409,668 $ 409,668 Contributions 728, ,318 Other Income 21,288 21,288 Programs Services Expense (958,194) (958,194) Impairment Loss (820,090) (820,090) Change in Net Assets from Discontinued Operations $ (619,010) $ (619,010) (73)
78 NOTES TO FINANCIAL STATEMENTS JUNE 30, 2018 AND 2017 NOTE 18.9 NATURAL CLASSIFICATIONS WITH FUNCTIONAL CLASSIFICATIONS (CONTINUED) Assets Current Assets Cash and Cash Equivalents $ 10,170 $ 10,170 Receivables, Net of Allowance for Doubtful Accounts of $124,289 and $124,289, Respectively 39,230 39,230 Total Current Assets 49,400 49,400 Property and Equipment, Net 393, ,802 Total Assets $ 443,202 $ 443,202 Liabilities Current Liabilities Accounts Payable and Accrued Expenses $ 26,097 $ 26,097 Current Portion of Long-Term Debt 85,257 85,257 Total Current Liabilities 111, ,354 Long-Term Debt, Less Current Portion 1,097,899 1,097,899 Total Liabilities $ 1,209,253 $ 1,209,253 NOTE MANAGEMENT S PLAN TO ADDRESS UNRESTRICTED DEFICIENCY IN NET ASSETS AND DECREASED CASH FLOWS During fiscal years, 2017 and 2016, the Corporation recorded an impairment loss to write the MountainView dormitory value down to fair value. As a result of the impairment losses, the Corporation has incurred a significant deficit in unrestricted net assets. Bluefield State College plans to pen on campus housing for its students by fiscal year 2020, in which case the Corporation would likely sell the building and land associated with the MountainView dormitory. The Corporation has historically experienced operating losses from dormitory operations, which would be eliminated with the sale of the facility. Upon sale of the dormitory, the Corporation s primary operational focus will shift to grant administration. Management anticipates a significant decrease in overall expenses and an increase in cash with this shift. However, until Bluefield State College opens on-campus housing to its student, the MountainView dormitory will likely continues its operation. In recent years, the Foundation has contributed over $1.0 million to help sustain the Corporation s operations, primarily to support operating costs of the MountainView dormitory. In addition to these contributions, the Foundations has also forgiven the interest due on the $2.0 million note payable described in note 18.4 for the years ended June 30, 2018, and These contributions were significantly reduced during the year ended June 30, 2018 and future contributions from the Foundation or other organizations are uncertain. A reduction or elimination of these contributions in the future, in addition to continuing decreases in occupancy at the MountainView dormitory, would have a significant impact on the sustainability of the Corporation s operations and creates substantial doubt about the Corporation s ability to continue as a going concern within one year after the date that these financial statements are issued. (74)
79 NOTES TO FINANCIAL STATEMENTS JUNE 30, 2018 AND 2017 NOTE SUBSEQUENT EVENTS In preparing these financial statements, the Corporation has evaluated events and transaction for potential recognition or disclosure through October 2, 2018, the date the financial statements were issued. (75)
80 REQUIRED SUPPLEMENTARY INFORMATION SCHEDULES OF PROPORTIONATE SHARE OF NET PENSION LIABILITY AND CONTRIBUTIONS JUNE 30, 2018 AND 2017 Schedule of Proportionate Share of TRS Net Pension Liability (NPL) College's College's College's Plan Proportionate Proportionate Fiduciary Net Share as a College's Share as a Position as a Percentage of College's State's Total Covered Percentage of percentage of Measurement Net Pension Proportionate Proportionate Proportionate Employee Covered Total Pension Date Liability Share Share Share Payroll Payroll Liability June 30, % $ 571,039 $ 1,303,004 $ 1,874,043 $ 495, % 66.25% June 30, % $ 790,228 $ 1,505,173 $ 2,295,401 $ 500, % 65.95% June 30, % $ 498,691 $ 1,102,827 $ 1,601,518 $ 519,608 96% 67.85% TRS Schedule of Contributions Actual Contribution Actuarily Contribution as a Percentage Measurement Determined Actual Deficiency Covered of Covered Date Contributions Contribution (Excess) Payroll Payroll June 30, 2015 $ 74,933 $ 80,855 $ (5,922) $ 495,570 16% June 30, 2016 $ 75,055 $ 81,371 $ (6,316) $ 500,367 16% June 30, 2017 $ 59,754 $ 65,163 $ (5,409) $ 519,608 13% These schedules are intended to show information for ten years. Additional years will be displayed as they become available. Notes to Required Supplementary Information For the Year Ended June 30, 2018 There are no factors that affect trends in the amounts reported, such as a change of benefit terms or assumptions. Additional information, if necessary, can be obtained from the CPRB Comprehensive Annual Financial Report for the year ended June 30, (76)
81 REQUIRED SUPPLEMENTARY INFORMATION SCHEDULES OF PROPORTIONATE SHARE OF OTHER POSTEMPLOYMENT BENEFITS, LIABILITY, AND CONTRIBUTIONS JUNE 30, 2018 AND 2017 Schedule of Proportionate Share of Net OPEB Liability College's College's Plan College's College's Proportionate Fiduciary Net Proportionate Share College's State's Total Covered Share as a Position as a Measurement as a Percentage of Proportionate Proportionate Proportionate Employee Percentage of Percentage of Date Net OPEB Liability Share Share Share Payroll Covered Payroll Total OPEB Liability June 30, % $ 4,480,843 $ 920,370 $ 5,401,213 $ 318, % 25.10% Schedule of Employer Contributions Actuarily Contribution Actual Contribution Measurement Determined Actual Deficiency Covered as a Percentage of Date Contribution Contribution (Excess) Payroll Covered Payroll June 30, 2017 $ 374,283 $ 381,097 $ (6,814) $ 318, % These schedules are intended to show information for ten years. Additional years will be displayed as they become available. Notes to Required Supplementary Information For the Year Ended June 30, 2018 There are no factors that affect trends in the amounts reported, such as change in benefit terms or assumptions. With only one year reported in the required supplementary information, there is no additional information to include in notes. Information, ifnecessary, can be obtained from the RHBT and PEIA at (77)
82 INDEPENDENT AUDITORS REPORT ON INTERNAL CONTROL OVER FINANCIAL REPORTING AND ON COMPLIANCE AND OTHER MATTERS BASED ON AN AUDIT OF FINANCIAL STATEMENTS PERFORMED IN ACCORDANCE WITH GOVERNMENT AUDITING STANDARDS Board of Governors Bluefield State College Bluefield, West Virginia We have audited, in accordance with the auditing standards generally accepted in the United States of America and the standards applicable to the financial audits contained in Government Auditing Standards issued by the Comptroller General of the United States, the financial statements of the business-type activities and the aggregate discretely presented component units of Bluefield State College (the College), a blended component unit of the West Virginia Higher Education Fund, as of and for the year ended June 30, 2018, and the related notes to the financial statements, and have issued our report thereon dated October 23, Our report includes a reference to other auditors who audited the financial statements of the Bluefield State College Foundation, Inc. and the Bluefield State College Research and Development Corporation, as described in our report on the College s financial statements. The financial statements of the Bluefield State College Foundation, Inc. and Bluefield State College Research and Development Corporation were not audited in accordance with Government Auditing Standards. Internal Control Over Financial Reporting In planning and performing our audit of the financial statements, we considered the College's internal control over financial reporting (internal control) to determine the audit procedures that are appropriate in the circumstances for the purpose of expressing our opinions on the financial statements, but not for the purpose of expressing an opinion on the effectiveness of the College's internal control. Accordingly, we do not express an opinion on the effectiveness of the College's internal control. Our consideration of internal control was for the limited purpose described in the preceding paragraph and was not designed to identify all deficiencies in internal control that might be material weaknesses or significant deficiencies and therefore, material weaknesses or significant deficiencies may exist that have not been identified. However, as described in the accompanying schedule of findings and recommendations, we did identify certain deficiencies in internal control that we consider to be material weaknesses and significant deficiencies. (78)
83 Board of Governors Bluefield State College A deficiency in internal control exists when the design or operation of a control does not allow management or employees, in the normal course of performing their assigned functions, to prevent, or detect and correct, misstatements on a timely basis. A material weakness is a deficiency, or a combination of deficiencies, in internal control, such that there is a reasonable possibility that a material misstatement of the entity s financial statements will not be prevented, or detected and corrected on a timely basis. We consider the deficiency described in the accompanying schedule of findings and recommendations to be a material weakness as item A significant deficiency is a deficiency, or a combination of deficiencies, in internal control that is less severe than a material weakness, yet important enough to merit attention by those charged with governance. We consider the deficiencies described in the accompanying schedule of findings and recommendations as item to be a significant deficiency. Compliance and Other Matters As part of obtaining reasonable assurance about whether the College s financial statements are free from material misstatement, we performed tests of its compliance with certain provisions of laws, regulations, contracts, and grant agreements, noncompliance with which could have a direct and material effect on the determination of financial statement amounts. However, providing an opinion on compliance with those provisions was not an objective of our audit, and accordingly, we do not express such an opinion. The results of our tests disclosed no instances of noncompliance or other matters that are required to be reported under Government Auditing Standards. Bluefield State College s Response to Findings The College s response to the finding identified in our audit is described below. The College s response was not subjected to the auditing procedures applied in the audit of the financial statements and, accordingly, we express no opinion on it. Purpose of this Report The purpose of this report is solely to describe the scope of our testing of internal control and compliance and the results of that testing, and not to provide an opinion on the effectiveness of the College s internal control or on compliance. This report is an integral part of an audit performed in accordance with Government Auditing Standards in considering the College s internal control and compliance. Accordingly, this communication is not suitable for any other purpose. CliftonLarsonAllen LLP Plymouth Meeting, Pennsylvania October 23, 2018 (79)
84 SCHEDULE OF FINDINGS AND RECOMMENDATIONS FOR YEAR ENDED JUNE 30, Audit Adjustments Type of Finding: Material Weakness in Internal Control Over Financial Reporting Condition During the audit, it was determined that at June 30, 2018, there were accounts payable and related capital assets and expenses not recorded. The expense or capital assets were incurred prior to fiscal year end, and therefore should have been recorded as a liability on the Statement of Net Position as of June 30, 2018 which was corrected during the audit. Criteria or Specific Requirement Management is responsible for establishing and maintaining internal controls, including monitoring, and for the fair presentation in the Statement of Net Position, Statement of Revenue, Expenses, and Changes in Net Position, and Statement of Cash Flows, including the notes to the financial statements, in conformity with accounting principles generally accepted in the United States of America. Their responsibilities include recording significant financial reporting process, including controls over procedures used to enter transaction totals into the general ledger; initiate, authorize, record, and process journal entries into the general ledger; and record recurring and nonrecurring adjustments to the financial statements. Context The College has a process to review subsequent disbursements to ensure any expense incurred within the fiscal year is properly recognized as accounts payable. As invoices are received, the finance department enters the accounts payable, based on the date of expense; the liability is booked within the respective fiscal year. Effect This omission resulted in an adjustment to record the accounts payable and related expense as of June 30, Cause The expense in question was not processed with the appropriate date and therefore a liability was not recognized as of June 30, Repeat Finding No Auditors Recommendation We recommend management review policies and procedures regarding the review of subsequent disbursements to ensure expenses are recognized in the proper fiscal year in which they are incurred. Views of Responsible Officials and Planned Corrective Actions: Bluefield State College recognizes the importance of accurate financial reporting. Within our year-end processes, transactions such as these are extremely unusual. Going forward, Bluefield State personnel will make corrective action for this not to occur again. (80)
85 SCHEDULE OF FINDINGS AND RECOMMENDATIONS (CONTINUED) FOR YEAR ENDED JUNE 30, Federal Grant Receivables and Unearned Revenue Type of Finding: Significant Deficiency in Internal Control Over Financial Reporting Condition Federal grant receivables and unearned revenue subledgers include amounts with no activity in the current year and some which date back as far as 1997/1998. Criteria or Specific Requirement Sound internal control policies under the Committee of Sponsoring Organizations (COSO) framework requires that all accounts be reconciled to their underlying subsidiary ledger or other supporting documentation on a timely periodic basis. Such reconciliations should include a review for stale dated items for timely clearing. Context The Veterans Upward Bound grant was closed on 9/30/07 and carried a receivable balance of $74,029 with no activity in the current year. Effect Federal grant accounts receivable and unearned revenue may be overstated for amounts that are uncollectible or no longer available for spending. Cause Reconciliation procedures do not include a review of stale or old amounts for resolution. Repeat Finding Yes Auditors Recommendation We recommend the College review Federal grant accounts receivable and unearned revenue subledgers to ensure that only collectible amounts are recorded as receivable and that unearned revenue balances are still within the period of availability for spending. Any amounts deemed uncollectible or not spendable should be written off or returned to the respective agencies, as applicable. Views of Responsible Officials and Planned Corrective Actions: Bluefield State College considers any concerns brought forward by the independent auditors important. Personnel at the institution have worked on correcting some balances in some of the grants in previous years and ongoing. Finance personnel will make a concentrated effort in the next months to correct other outstanding balances. (81)
86 Board of Governors Bluefield State College Bluefield, West Virginia We have audited the financial statements of the business-type activities and the aggregate discretely presented component units of Bluefield State College (the College), a component unit of West Virginia Education Fund, as of and for the year ended June 30, 2018, and have issued our report thereon dated October 23, We have previously communicated to you information about our responsibilities under auditing standards generally accepted in the United States of America and Government Auditing Standards, as well as certain information related to the planned scope and timing of our audit. Professional standards also require that we communicate to you the following information related to our audit. Significant audit findings Qualitative aspects of accounting practices Accounting policies Management is responsible for the selection and use of appropriate accounting policies. The significant accounting policies used by Bluefield State College are described in Note 2 to the financial statements. For the year ended June 30, 2018, the College adopted the provisions of Governmental Accounting Standards Board Statement No. 75 Accounting and Financial Reporting for Postemployment Benefits Other than Pensions. As a result of the adoption of this Statement, beginning net position was restated. See Note 2 of the financial statements for additional information. We noted no transactions entered into by the College during the year for which there is a lack of authoritative guidance or consensus. All significant transactions have been recognized in the financial statements in the proper period. Accounting estimates Accounting estimates are an integral part of the financial statements prepared by management and are based on management s knowledge and experience about past and current events and assumptions about future events. Certain accounting estimates are particularly sensitive because of their significance to the financial statements and because of the possibility that future events affecting them may differ significantly from those expected. The most sensitive estimates affecting the financial statements were: Management s estimate of the allowance for doubtful accounts is based on an evaluation of the underlying account, contract, grant, and loan balances; the historical collectability experienced by the University on such balances; and such other factors that, in the University s judgment, require consideration in estimating doubtful accounts. We evaluated the key factors and assumptions used to develop the allowances in determining that it is reasonable in relation to the financial statements taken as a whole. Management s estimate of depreciation is based on the estimated useful lives of capital assets. We evaluated the key factors and assumptions used to estimate the useful lives in determining that it is reasonable in relation to the financial statements taken as a whole.
87 Board of Governors Bluefield State College Page 2 Management s estimate of the compensated absences liability is based on current and historical information available to management. We evaluated the key factors and assumptions used to develop the compensated absences liability estimate in determining that it is reasonable in relation to the financial statements taken as a whole. Management s estimate of the other postemployment benefits liability is based on an actuarial computed amount. We evaluated the key factors and assumptions used to develop the compensated absences liability estimate in determining that it is reasonable in relation to the financial statements taken as a whole. Management s estimate of the net pension liability is based on an actuarial computed amount. We evaluated the key factors and assumptions used to develop the net pension liability in determining that it is reasonable in relation to the financial statements taken as a whole. Financial statement disclosures Certain financial statement disclosures are particularly sensitive because of their significance to financial statement users. There were no particularly sensitive financial statement disclosures The financial statement disclosures are neutral, consistent, and clear. Difficulties encountered in performing the audit The completion of our audit was delayed due to the following matters, also communicated to you in our letter dated October 8, Bluefield State College, draft financial statements and underlying books and records were not available to be audited until October 9, Uncorrected misstatements Professional standards require us to accumulate all misstatements identified during the audit, other than those that are clearly trivial, and communicate them to the appropriate level of management. As part of our audit procedures we identified two uncorrected misstatements. One related to loans receivable and the related revenues being overstated by $13,131. This is due to no support available to account for this amount included in the loans receivable balance as of June 30, The other one relates to accounts payable and related expenses being understated by $153,048. This is due to errors found in the sample of subsequent disbursements tested as part of the audit, which was projected to the entire balance. Corrected misstatements The following material misstatements detected as a result of audit procedures were corrected by management: A material entry was made to accounts payable and related expenses that were erroneously unrecorded in the amount of $397,983. Disagreements with management For purposes of this letter, a disagreement with management is a financial accounting, reporting, or auditing matter, whether or not resolved to our satisfaction, that could be significant to the financial statements or the auditors report. No such disagreements arose during our audit.
88 Board of Governors Bluefield State College Page 3 Management representations We have requested certain representations from management that are included in the management representation letter dated October 23, Management consultations with other independent accountants In some cases, management may decide to consult with other accountants about auditing and accounting matters, similar to obtaining a second opinion on certain situations. If a consultation involves application of an accounting principle to the College s financial statements or a determination of the type of auditors opinion that may be expressed on those statements, our professional standards require the consulting accountant to check with us to determine that the consultant has all the relevant facts. To our knowledge, there were no such consultations with other accountants. Significant issues discussed with management prior to engagement We generally discuss a variety of matters, including the application of accounting principles and auditing standards, with management each year prior to engagement as the College s auditors. However, these discussions occurred in the normal course of our professional relationship and our responses were not a condition to our engagement. Other audit findings or issues We have provided a separate letter to you dated October 23, 2018 communicating internal control related matters identified during the audit. Audits of group financial statements We noted no matters related to the group audit that we consider to be significant to the responsibilities of those charged with governance of the group. Quality of component auditor s work There were no instances in which our evaluation of the work of a component auditor gave rise to a concern about the quality of that auditor s work. Limitations on the group audit There were no restrictions on our access to information of components or other limitations on the group audit. Other information in documents containing audited financial statements With respect to the required supplementary information (RSI) accompanying the financial statements, we made certain inquiries of management about the methods of preparing the RSI, including whether the RSI has been measured and presented in accordance with prescribed guidelines, whether the methods of measurement and preparation have been changed from the prior period and the reasons for any such changes, and whether there were any significant assumptions or interpretations underlying the measurement or presentation of the RSI. We compared the RSI for consistency with management s responses to the foregoing inquiries, the basic financial statements, and other knowledge obtained during the audit of the basic financial statements. Because these limited procedures do not provide sufficient evidence, we did not express an opinion or provide any assurance on the RSI. Our auditors opinion, the audited financial statements, and the notes to financial statements should only be used in their entirety. Inclusion of the audited financial statements in a document you prepare, such as an annual report, should be done only with our prior approval and review of the document.
89 Board of Governors Bluefield State College Page 4 * * * This communication is intended solely for the information and use of the Board of Governors and management of Bluefield State College, and is not intended to be, and should not be, used by anyone other than these specified parties. CliftonLarsonAllen LLP Plymouth Meeting, Pennsylvania October 23, 2018
90 Board of Governors and Management Bluefield State College Bluefield, West Virginia In planning and performing our audit of the financial statements of Bluefield State College (the College) as of and for the year ended June 30, 2018, in accordance with auditing standards generally accepted in the United States of America, we considered the College s internal control over financial reporting (internal control) as a basis for designing audit procedures that are appropriate in the circumstances for the purpose of expressing our opinions on the financial statements, but not for the purpose of expressing an opinion on the effectiveness of the College s internal control. Accordingly, we do not express an opinion on the effectiveness of the College s internal control. However, during our audit, we became aware of deficiencies in internal control other than significant deficiencies and material weaknesses and other matters that are opportunities to strengthen your internal control and improve the efficiency of your operations. Our comments and suggestions regarding those matters are summarized below. A separate communication dated October 23, 2018, contains our written communication of significant deficiencies and material weaknesses in the College s internal control. This letter does not affect our communication dated October 23, Direct loan and Pell outstanding checklists During our review of the outstanding checklists, checks were noted dating back to Federal financial aid regulations require Title IV federal funds disbursed to a student or parent that are not received or negotiated must be returned to the appropriate financial aid program no later than 240 days after the check issue date. Accordingly, we recommend that the College review the outstanding checklists in further detail and return any funds to the appropriate federal program. Refund cash account outstanding checklist During our review of the outstanding checklist for the refund cash account, checks were noted dating back to 2006 that should be reviewed and returned to the State in accordance with unclaimed property laws. Accordingly, we recommend that the College review the unclaimed property laws in the state of West Virginia and ensure processes are in place to ensure all funds are being properly and timely remitted to the State. AR hospital allowance The College estimates an allowance for uncollectable receivables related to their agreement with a local medical center. The College has fully allowed for the receivable with this organization. During the fiscal year, the College provided additional services to the medical center and those have been added to both the outstanding receivable as well as the allowance for uncollectable receivables. We recommend that the College review the relationship and work performed for this medical center since it seems unlikely that the services will be paid for past work or for future services. Allowance for doubtful accounts It was noted the allowance for doubtful accounts is a significant portion of the total receivables balance and includes several outdated receivables which date back to It is unlikely these amounts will be recovered and they will continue to inflate the total receivables balance. We recommend the College write off the uncollectible portion as bad debt and reassess its policies surrounding bad debt and allowance for doubtful accounts estimates. This policy should include a formal review by management.
91 Board of Governors and Management Bluefield State College Page 2 Balance sheet review It was noted there is no documentation of review of balance sheet items. Active maintenance and review of balance sheet accounts is important to ensure the College s financial statements are accurate at year-end. Succession planning While performing our audit for the fiscal year ended June 30, 2018, we noted several instances where cross training among the various finance and accounting activities have not occurred or it has been very minimal. In addition with the College s staff primarily being long-term in nature, it is necessary to have employees cross trained so, as employees retire or separate from the College, not all institutional knowledge is lost at the same time. We recommend that the College s management review the various job duties within finance and accounting and ensure there is a proper level of succession planning conducted and cross training is conducted. We will review the status of these comments during our next audit engagement. We have already discussed many of these comments and suggestions with various College personnel, and we will be pleased to discuss them in further detail at your convenience, to perform any additional study of these matters, or to assist you in implementing the recommendations. * * * This communication is intended solely for the information and use of management, the Board of Governors, the Higher Education Policy Commission, federal and state awarding agencies, pass-through entities, and others within the College, and is not intended to be, and should not be, used by anyone other than these specified parties. CliftonLarsonAllen LLP Plymouth Meeting, Pennsylvania October 23, 2018
92
93
94
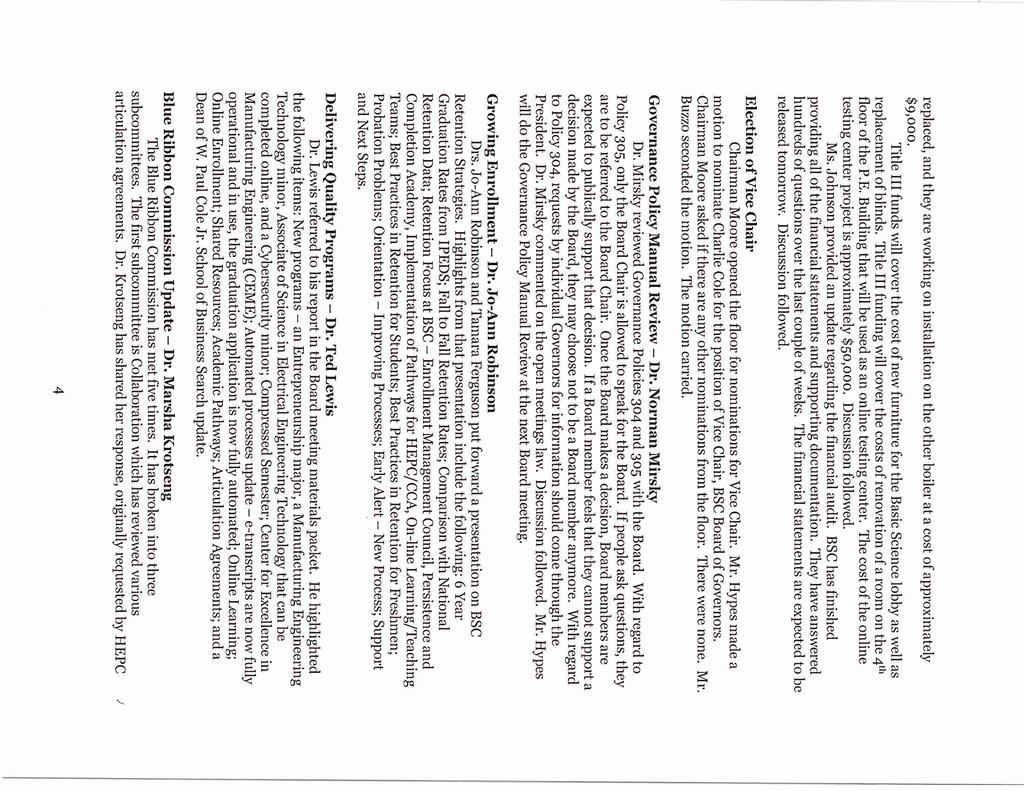
95
96
97
98
99
100
101
102
103
104 BOARD OF GOVERNORS POLICY NO. 6 TITLE: GRADE POINT AVERAGE FOR ASSOCIATE AND BACCALAUREATE DEGREES SECTION 1. GENERAL 1.1 Scope: Rule regarding grade-point average required for associate and baccalaureate degrees. 1.2 Repeal of Former Rule Revises and replaces Series 20 dated March 30, Authority West Virginia Code 18-B-1-1A; 18B Replaces Procedural Rule, Title 131, Series 20 Filing Date --??? 1.4 Effective Date: March 21, Repeal of former rule Repeals and replaces Title 133, Series 22 dated August 1, SECTION 2. GRADE-POINT AVERAGE REQUIRED for GRADUATION 2.1 Quality points are based on the following point values for each semester hour of credit: "A" - 4, "B" - 3; "C" - 2; "D" - 1 and "F" - 0. The grade point average to be computed for graduation purposes (not necessarily each semester) shall be based upon all work for which the student has registered with the following exceptions: Courses with grades of "W" and "WP" Courses in co-requisite courses or remedial and/or developmental education Courses taken on a credit/no credit, pass/fail or satisfactory/unsatisfactory basis where a passing grade is earned Courses taken on an audit basis Courses which have been repeated under the "D/F Repeat Provisions" of this policy Courses which are covered under the "Discretionary Academic Forgiveness Provisions" of this policy.
105 SECTION 3. D and F REPEAT PROVISIONS 3.1. If a student earns a grade of "D" or "F" (including failures due to regular and/or irregular withdrawal) on any a course taken no later than the semester or summer term during which the student attempts the sixtieth semester hour, and if that student repeats this course prior to the receipt of a baccalaureate degree, and if that student repeats this course prior to the receipt of the baccalaureate degree, the original grade shall be disregarded and the grade or grades earned when the course is repeated shall be used in determining his/her the grade point average. The original grade shall not be deleted from the student's record. In upper division courses, a student may formally repeat up to eight credit hours, of a grade of C, with the written permission of the appropriate head of the academic unit where the student s major is housed. The privilege of the D and F repeat is capped at 21 credit hours including any request for a C repeat in an upper division course. SECTION 4. DISCRETIONARY ACADEMIC FORGIVENESS PROVISIONS 4.1 For purposes of grade-point average required for graduation, Bluefield State College System shall have discretionary authority to establish academic forgiveness in addition to the "D/F" repeat provisions. However, institutionally established provisions must be consistent with this rule. If institutions elect to disregard prior "D" and/or failing grades, such action must accommodate the following minimal conditions: Students must not have been enrolled in college on a full-time basis during any semester or term in the last four consecutive years Only grades for courses taken at least four years prior to the request for academic forgiveness may be disregarded for grade-point average computation In cases where grades may be disregarded for grade-point average computation, these grades shall not be deleted from the student's permanent record In instances where students request and gain academic forgiveness from one college and then transfer to another institution, the receiving institution is not bound by the prior institution's decision to disregard grades for grade-point average computation. 4.2 The provisions included herein shall be considered as minimum standards for extending academic forgiveness provisions. Consistent with institutional policies and mission, Bluefield State College may impose more stringent provisions in the area of disregarding prior grades for grade-point average computation for graduation. 4.3 Institutional policies regarding academic forgiveness for grade-point average computation shall be stated in the institutional catalog. In addition to providing information on the manner in which such provisions may be applied, the catalog and/or such other publications as are appropriate shall inform students that academic forgiveness
106 extended by one institution may or may not be recognized by other institutions in which the student may transfer. SECTION 5. APPLICATION ONLY to GRADUATION REQUIREMENTS 5.1 Institutional officials shall make clear to students the fact that this regulation pertains only to graduation requirements and not to such requirements for professional certification which may be within the province of licensure boards, external agencies, or the West Virginia Board of Education.

107 Five-Year Compact Summary Report Institutional Successes: Bluefield State College has worked to implement strategies and activities over the past five years that were designed to help it meet the specific targets identified as a part of our Institutional Compact. Based on these specific metrics, we have identified several areas as worthy of notice. Success Objective 1: Improve the outcomes of students requiring developmental education. The College s focus for this objective was two-fold. First, the College worked to ensure the success of its students in developmental education classes. Second, the College sought to improve the outcomes of these developmental students in their subsequent college level classes. In exploring the data related to students, statewide, who require developmental education, we considered the percentages of students who graduated high school in 2016 and required developmental courses at college upon enrollment in 2017 (see Table 1). We looked both at the graduates by high school who went to any four year college in West Virginia as first-time freshmen and at the first-time freshmen enrollees at Bluefield State College, specifically. We noted, in completing this review, that students who graduated from high schools in the four WV counties surrounding the College were much more likely to require developmental coursework than those students from the state as a whole. We also noted that students at Bluefield State are noticeably more likely to require developmental coursework than their counterparts at other HEPC institutions. Table 1: 2017 Students (previous year HS grads) requiring developmental coursework Cohort %ENGL %MATH %MATH or ENGL Statewide Graduates from Mercer County Graduates from McDowell County Graduates from Summers County Graduates from Wyoming County State (WV grads only) all HEPC (WV grads only) State (all grads) all HEPC (all grads) % MATH & ENGL Prior to the implementation of the Compact, developmental studies (DS) students passed DS Math at a rate of 53.6% and DS English at a rate of 68.7% (see Table 2). Those students completing DS classes and moving to collegiate level classes passed those classes 34% and 49.5% of the time (MATH & ENGL, respectively). Strategies implemented included ensuring that students were properly placed. Additionally, an orientation program culminating in the assignment of a full-time senior faculty mentor for all new fulltime and adjunct faculty was implemented. The orientation and mentoring program focused on ensuring that all faculty were aware of institutional policies and processes as well as helping them to identify those best practices that have enabled our students to be successful. 1
108 As a result of the implementation of these strategies, the College saw an immediate improvement in the passing rates for students in developmental studies and subsequent collegiate classes. One additional strategy implemented after the start of the Compact was that of co-requisite remediation. Co-requisite remediation allows students who require developmental coursework to co-enroll in both the collegiate course and a supplemental developmental course so as to provide valuable developmental support as related material is covered in the collegiate class. This strategy was highly successful as can be seen from the data in Table 2. At this time, 74.2% of DS Math students and nearly 79.7% of DS English students are passing their DS courses. These students also pass their collegiate Math and English classes 78.8% and 81.0% of the time, respectively. Table 2: Performance in Developmental Education/Collegiate classes 2011 Cohort 2012 Cohort 2013 Cohort 2014 Cohort 2015 Cohort 2016 Cohort Target Students Passing DS Math 53.6% 70.5% 71.4% 73.9% 80.7% 74.2% 70.0% Students Passing DS English 68.4% 77.2% 70.2% 72.3% 82.3% 79.7% 80.0% DS Students Passing Collegiate Math 34.0% 35.5% 49.4% 67.9% 71.4% 78.8% 40.0% DS Students Passing Collegiate English 49.5% 52.2% 48.9% 60.7% 68.8% 81.0% 55.0% Success Objective 2: Increase the retention rate of students overall and specifically in important target populations. The retention rate for first-time, full-time freshmen who entered Bluefield State College in 2011 was 61.9%. Strategies aimed at increasing the retention rate for all students who enter the college included the development of a Peer Mentoring program in which successful junior and senior level students are recruited to serve as mentors and coaches for the incoming freshmen as well as the implementation of an Early Alert system which would allow faculty to notify staff of students who are in danger of failing. An early modification to the College s Compact, identified in consultation with Ruffalo Noel Levitz, called for the development of a Retention Specialist position to provide support for following up with students identified through the Early Alert system. Since the implementation of our Compact strategies, the retention rate for each of the important target populations has improved as seen in Table 3. Of particular note, the retention rate for students in our Underrepresented Racial/Ethnic group increased from 41.7% to over 65%. In addition, the retention targets were met for each group except Returning Adults. Because the returning adults are older, they are more likely to have families and other outside responsibilities that hinder their ability to focus on college. Additional attention will be paid to this group of students in order to meet the new target. Table 3: Retention Rates by year for select populations Cohort Cohort 2013 Cohort 2014 Cohort 2015 Cohort 2016 Cohort Target Full-Time, First-Time Freshmen 61.9% 65.9% 63.4% 62.7% 69.9% 69.0% 67.0% Low-Income First-Time Freshmen 54.5% 64.6% 57.5% 60.7% 65.1% 65.9% 65.0% Returning Adults 51.3% 50.0% 41.8% 53.2% 54.7% 59.0% 62.0% Transfer Students 62.4% 65.2% 65.0% 69.9% 66.4% 77.5% 75.0% Underrepresented Racial/Ethnic Group 41.7% 63.6% 65.6% 58.6% 65.2% 65.2% 55.0% 2
109 Success Objective 4: Increase the overall four- and six- year graduation rates of students and in important populations. Graduation rates at Bluefield State College were very low for both the four and six year rates prior to the implementation of the Compact (See 2009 cohort & 2007 cohort in tables 4 & 5). With the Compact, the College developed a new first-year experience course to better prepare students for the college experience. This course, coupled with the focus on retention improvement strategies led to a dramatic improvement in these graduation rates for most populations. The College met its targets for several of the specified populations. We continue to struggle with the four-year graduation rate for our Underrepresented Racial/Ethnic groups but have more than doubled the six-year graduation rate for that population. The difference between the four-year and six year graduation rates for this population is likely due to a larger percentage of these students taking less than full-time course loads. Additionally, while the four-year graduation rate for Returning Adults has increased dramatically from 28.1% to 40.5%, the six year graduation rate fell from 44.6% to 32.1%. We have already identified this population for additional focus based on the retention results. Table 4: Four-year Graduation Rates 2009 Cohort 2010 Cohort 2011 Cohort 2012 Cohort 2013 Cohort 2014 Cohort Target Full-Time, First-Time Freshmen 8.8% 9.2% 9.1% 13.7% 19.1% 15.5% 15.0% Low-Income First-Time Freshmen 7.0% 7.3% 5.4% 8.4% 10.8% 13.1% 15.0% Returning Adults 28.1% 29.2% 30.8% 31.3% 28.7% 40.5% 40.0% Transfer Students 35.0% 47.2% 31.5% 34.3% 38.4% 42.3% 40.0% Underrepresented Racial/Ethnic Group 6.8% 4.8% 5.0% 5.6% 5.6% 6.7% 15.0% Table 5: Six-year Graduation Rates 2007 Cohort 2008 Cohort 2009 Cohort 2010 Cohort 2011 Cohort 2012 Cohort Target Full-Time, First-Time Freshmen 17.3% 25.0% 19.6% 23.4% 19.5% 30.4% 35.0% Low-Income First-Time Freshmen 13.0% 18.8% 14.5% 21.9% 12.6% 25.2% 25.0% Returning Adults 44.6% 29.3% 34.2% 31.5% 35.8% 32.1% 45.0% Transfer Students 44.6% 36.8% 43.3% 54.1% 39.6% 38.5% 55.0% Underrepresented Racial/Ethnic Group 3.0% 13.3% 13.6% 17.4% 10.0% 11.1% 20.0% Impact Objective 1: Increase the number of degrees awarded at the undergraduate and graduate levels overall and in needed areas. The College has worked diligently to increase its graduation rates overall and for selected populations. Tied closely to the graduation rate is the number of degrees awarded. Toward this end, the College has increased the number of awards issued in Health & STEM fields as well as in the area of STEM education. While investigating our data, however, we have noted a cyclic variation to our number of degrees awarded. We are looking into the causes for this peculiar pattern. Table 6: Degrees Awarded AY 13 AY 14 AY15 AY 16 AY 17 AY 18 Target Bluefield overall STEM STEM Education Health
110 Institutional Challenges: Bluefield State College has struggled for many years with enrollment. In 2003, New River Community and Technical College was created from the community college programs offered through Bluefield and Glenville State Colleges. With the creation of this institution as a stand-alone entity, Bluefield State lost a significant population of students. Enrollment recovered somewhat with the economic downturn in 2008 and following, but with the recovery of the economy since that time, enrollment began, again, to trail off. In 2017, however, this trend was reversed for most populations due to the efforts the College has made to attract and retain more students. Table 7: Fall Headcount Enrollment Fall Fall Fall Fall Fall Fall Target Overall Headcount First-time Freshmen Headcount Low-Income Headcount Underrepresented Racial/Ethnic Group Headcount Adult (25+) Headcount The College has worked diligently, during the past five years, to bring in new programs that will attract students and prepare them for the local workforce. In our efforts to serve and attract more students, the College has opened a variety of programs ranging from Engineering Management to Sonography. Additionally, the College has created a number of new minors for our students including Cyber Security, Entrepreneurship, Forensic Investigation and others. Recently, the College opened the Center for Excellence in Manufacturing Engineering. This center is home to state-of-the-art robotics and manufacturing equipment and is working to recruit displaced coal workers, among others, to help them enter a new career. We anticipate, as a result of the opening of this center, seeing a further increase in the number of STEM degrees awarded. As we prepare to extend the Compact, the College will focus on additional recruitment and retention strategies in our effort to improve our enrollment. One long-term strategy the College seeks to employ is the reintroduction of residence life to the campus. In 1968, at the direction of the state governing board for higher education, the College closed its residence halls and became, for the first time in its history, exclusively a commuter campus focused on serving local students. Additionally, a state governing board resolution, enacted in 1968, precluded the College from pursuing the re-establishment of on-campus housing. While the resolution was repealed in 1992, the state legislature was no longer willing to allocate funding for on-campus housing facilities. The College has continued to seek alternative sources of funding for the residence hall project. Table 6: College-going Rates of Recent High School Graduates Fall 12 Fall 13 Fall 14 Fall 15 Fall 16 Fall 17 Statewide 56.41% 55.90% 54.63% 54.73% 55.03% 54.50% Mercer County 45.41% 49.92% 50.49% 49.92% 51.23% 45.65% McDowell County 25.00% 34.73% 42.36% 41.35% 40.29% 37.50% Summers County 50.00% 58.47% 60.18% 54.00% 46.59% 39.64% Wyoming County 28.99% 46.67% 43.73% 42.55% 43.73% 46.42% More recently, the commuter population in the Bluefield State area has been in decline. In the 2001 academic year, 19,256 students graduated from high school in West Virginia. By the 2011 academic year, the number of high school graduates in West Virginia had dropped to under 18,000 and this decline is projected to continue for the next two decades. In addition, college going rates among high school 4
111 graduates has been low across the state and lower in the immediate vicinity of Bluefield State (see Table 6). Together, these factors have contributed to a declining enrollment pool. We recognize the opportunity these lower college-going rate represent for the College, as it focuses on increasing enrollments. We are committed to reaching these individuals in high school and earlier to help them to understand the importance of a college education. We also recognize the importance of connecting with those adults (25+) who did not elect to enroll in college after completing their high school education. We further believe that, with the declining population in the area, the addition of residence halls is one necessary step to solving the enrollment downturn issue. In response to student demand, the College has focused its efforts on the improvement and expansion of its online programs. A series of committees have begun work to identify strategies, processes and policies to ensure that its online courses are of the highest quality, taught by well-trained faculty, and are easily accessible to our online student population. We are exploring all aspects of the application and matriculation processes as well as all support functions to ensure that our online students can be as successful as our on-campus students. As a result of this effort, enrollments in online courses have risen from 1476 students (duplicated headcount) in online classes in the fall 2015 semester to 2028 students (duplicated headcount) in online classes in the fall 2018 semester. This reflects a 37.4% increase in enrollments. Further, we note that we have seen an increase of 13% over the past two years in the number of students who are taking online classes exclusively. These increases have been the driving factor in the College s efforts to improve and further expand our online programs. In the past year, the College has increased the number of articulation agreements we have in place with local two-year colleges. To date, we have over 20 articulation agreements signed with our School of Business and we are reaching out to expand this number. These agreements have served as a basis for the development of articulation agreements for programs in our four other Schools. They have also opened new opportunities for offering classes and programs at new locations. We are currently in discussion with two community colleges regarding teaching classes at three separate locations. These efforts are proving to be a valuable source of new students. In 2017, Bluefield State signed a statewide agreement with the West Virginia Department of Education for graduates of health science education programs at all technical education centers in the state. This statewide Memorandum establishes a career pathway for students who graduate from an accredited/approved school of practical nursing and obtain an active license as a Licensed Practical Nurse and complete required curriculum to obtain an Associate of Nursing degree in three semesters at the College after completing prerequisites. We are currently in discussion with the West Virginia Department of Education to expand this model to other disciplines taught in the career technical education centers. The College is also exploring ways to increase its use of data in its efforts to increase enrollment, retention and graduation rates. Toward this end, we have begun to share our data more widely and regularly. As an example of this renewed effort to share data campus-wide, we have developed a process for the creation of our extended compact. This new process incorporated a college-wide sharing of our performance on these metrics to date and will involve a large segment of our community in the discussion and development of our extended Compact. In this way, we expect to foster a deeper understanding of the institutional issues and a stronger commitment to their resolutions. We look forward to support from the HEPC staff in expanding our use of data, such as employment and earnings data. The expansion and ongoing support, by HEPC staff, of a comprehensive, statewide database that has comparable information for all institutions, ensuring consistent definitions, is essential to all institutions. Additionally, the College would appreciate support in identifying and establishing new programs designed to support our students including appropriate academic programs as well as support initiatives such as Complete College America. We also look to HEPC for assistance in developing mutually beneficial partnerships within our community and the state. Finally, the College sees the role of the HEPC as that of a strong advocate at the state level for policy and process development as well as with the state legislature. 5
112 Access Success Impact 2017 System Goal 2017 Five Year Average 2018 Target Fall Head Count 64,313 73,500 1,384 1,507 2,154 1, Annualized FTE 58,452 68,000 1,194 1,321 1,879 1, Fall First-Time Freshmen Headcount 10,478 12, Fall Low-Income Student Headcount 22, , Fall Underrepresented Racial/Ethnic Group Total 7,426 6, Fall Adult (25+) Headcount 6,475 11, Students Passing Corequisite Courses (NEW) Math 72.1% ** 77.0% 4.9 ppt English 83.8% ** 89.0% 5.2 ppt 85.0% Students Passing Developmental Courses Math 70.6% 70% 74.2% ** 70.0% English 77.1% 75% 79.7% ** 80.0% Developmental Students Passing College-Level Course Math 70.7% 60% 78.8% ** 40.0% English 72.7% 70% 81.0% ** 55.0% Retention Full-Time, First-Time Freshmen 76.1% 80% 69.0% ** 67.0% 74.0% 5.0 ppt Part-time, First-Time Freshmen 45.3% 50% 54.5% ** 50.0% Low-Income First-Time Freshmen 68.2% 75% 65.9% ** 65.0% 71.0% 5.1 ppt Returning Adults 61.5% 65% 59.0% ** 62.0% 64.0% 5.0 ppt Transfer Students 75.4% 76% 77.5% ** 75.0% 80.0% 2.5 ppt Underrepresented Racial/Ethnic Group Total 64.0% 75% 65.2% ** 55.0% 70.0% 4.8 ppt Progress Toward Degree System Bluefield State College HEPC- Proposed 2020 Institutional Target Difference from Value First-Time Freshmen Earning 30 Hours 46.3% 65% 27.1% ** 30.0% 32.0% 4.9 ppt Four-Year Graduation Rate Cohort Years: First-Time Freshmen 30.6% 30% 15.5% ** 15.0% 21.0% 5.5 ppt Low-Income First-Time Freshmen 21.8% 20% 13.1% ** 15.0% 18.0% 4.9 ppt Returning Adults 40.0% 48% 40.5% ** 40.0% 45.0% 4.5 ppt Transfer Students 48.8% 48% 42.3% ** 40.0% 47.0% 4.7 ppt Underrepresented Racial/Ethnic Group Total 17.7% 20% 6.7% ** 15.0% 12.0% 5.3 ppt Six-Year Graduation Rate Cohort Years: First-Time Freshmen 51.1% 60% 30.4% ** 35.0% 35.0% 4.6 ppt Low-Income First-Time Freshmen 38.5% 40% 25.2% ** 25.0% 30.0% 4.8 ppt Returning Adults 42.4% 58% 32.1% ** 45.0% 37.0% 4.9 ppt Transfer Students 53.0% 58% 38.5% ** 55.0% 43.0% 4.5 ppt Underrepresented Racial/Ethnic Group Total 37.2% 40% 11.1% ** 20.0% 16.0% 4.9 ppt Degrees Awarded 13,665 15, STEM Degrees 3,547 3, STEM Education Degrees 0 ** Institution Proposed 2020 Target (if different) Health Degrees 2,093 2,
113 Bluefield State College Student Access Formal 2018 Target ( Data) Enrollment Fall Headcount 1,951 1,762 1,560 1,482 1,349 1,384 2,154 In-State 1,727 1,559 1,358 1,285 1,172 1,185 NA Out-of-State NA Annualized FTE 1,741 1,555 1,355 1,296 1,203 1,194 1,879 In-State 1,525 1,350 1,158 1,107 1,028 1,016 NA Out-of-State NA Fall First-Time Freshmen Headcount In-State NA Out-of-State NA Fall Low-Income Student Headcount* 1, ,200 Fall Underrepresented Racial/Ethnic Group Total American Indian NA Black NA Hispanic NA Multi Racial NA Native Hawaiian/Pacific Islander..... NA Fall Adult (25+) Headcount * Data to be provided by institution.
114 Bluefield State College Student Success 2011 Cohort 2012 Cohort 2013 Cohort 2014 Cohort 2015 Cohort 2016 Cohort Formal 2018 Target 2016 Cohort Developmental Education Outcomes Students Passing Developmental Courses Math 53.6% 70.5% 71.4% 73.9% 80.7% 74.2% 70% In-State 50.8% 70.6% 70.4% 73.3% 80.7% 73.8% NA Out-of-State 83.3% 69.2% 83.3% 78.6% 80.0% 70.5% NA English 68.4% 77.2% 70.2% 72.3% 82.3% 79.7% 80% In-State 65.1% 77.2% 71.4% 73.0% 83.0% 79.5% NA Out-of-State 91.7% 77.3% 33.3% 66.7% 75.0% 80.4% NA Developmental Students Passing College-Level Course Math 34.0% 35.5% 49.4% 67.9% 71.4% 78.8% 40% In-State 33.9% 35.9% 48.6% 68.3% 71.9% 78.7% NA Out-of-State 53.8% 30.8% 58.3% 64.3% 60.0% 80.0% NA English 49.5% 52.2% 48.9% 60.7% 68.8% 81.0% 55% In-State 50.8% 52.6% 49.5% 63.0% 69.3% 80.8% NA Out-of-State 75.0% 50.0% 33.3% 41.7% 62.5% 100.0% NA Retention Full-Time, First-Time Freshmen 61.9% 65.9% 63.4% 62.7% 69.9% 69.0% 67% In-State 62.6% 70.4% 63.3% 64.3% 70.3% 69.0% NA Out-of-State 55.6% 40.0% 64.1% 52.9% 67.7% 69.2% NA Part-time, First-Time Freshmen 50.0% 75.0% 25.0% 50.0% 16.7% 54.5% 50% Low-Income First-Time Freshmen 54.5% 64.6% 57.5% 60.7% 65.1% 65.9% 65% Returning Adults 51.3% 50.0% 41.8% 53.2% 54.7% 59.0% 62% Transfer Students 62.4% 65.2% 65.0% 69.9% 66.4% 77.5% 75% Underrepresented Racial/Ethnic Group Total 41.7% 63.6% 65.6% 58.6% 65.2% 65.2% 55% American Indian 100.0% 100.0%.. NA Black 40.9% 66.7% 66.7% 60.9% 69.2% 86.7% NA Hispanic 60.0% 50.0% 33.3% 100.0% 66.7% NA Multi Racial 100.0% 0.0% 50.0% 50.0% 42.9% 33.3% NA Native Hawaiian/Pacific Islander 0.0%..... NA Progress Toward Degree First-Time Freshmen Earning 30 Hours 26.6% 24.8% 32.0% 31.0% 33.7% 27.1% 30% In-State 26.4% 23.1% 30.0% 28.8% 33.1% 26.3% NA Out-of-State 28.6% 34.8% 45.0% 44.1% 38.2% 33.3% NA Four-Year Graduation Rate Cohort Years: Cohort First-Time Freshmen 8.8% 9.2% 9.1% 13.7% 19.1% 15.5% 15% In-State 8.3% 9.5% 9.0% 11.8% 17.3% 12.9% NA Out-of-State 14.3% 6.3% 10.0% 21.9% 30.4% 25.0% NA Low-Income First-Time Freshmen 7.0% 7.3% 5.4% 8.4% 10.8% 13.1% 15% Returning Adults 28.1% 29.2% 30.8% 31.3% 28.7% 40.5% 40% Transfer Students 35.0% 47.2% 31.5% 34.3% 38.4% 42.3% 40% Underrepresented Racial/Ethnic Group Total 6.8% 4.8% 5.0% 5.6% 5.6% 6.7% 15% American Indian NA Black 7.0% 5.3% 5.0% 6.7% 7.1% 7.7% NA Hispanic 0.0% 0.0% 0.0% 0.0% 0.0% NA Multi Racial. 0.0% 0.0% NA Native Hawaiian/Pacific Islander 0.0%... NA
115 Six-Year Graduation Rate Cohort Years: Cohort First-Time Freshmen 17.3% 25.0% 19.6% 23.4% 19.5% 30.4% 35% In-State 16.3% 23.5% 20.1% 23.8% 19.4% 28.7% NA Out-of-State 22.5% 32.6% 14.3% 18.8% 20.0% 37.5% NA Low-Income First-Time Freshmen 13.0% 18.8% 14.5% 21.9% 12.6% 25.2% 25% Returning Adults 44.6% 29.3% 34.2% 31.5% 35.8% 32.1% 45% Transfer Students 44.6% 36.8% 43.3% 54.1% 39.6% 38.5% 55% Underrepresented Racial/Ethnic Group Total 3.0% 13.3% 13.6% 17.4% 10.0% 11.1% 20% American Indian 0.0% 0.0%... NA Black 3.1% 11.5% 14.0% 21.1% 10.0% 13.3% NA Hispanic 33.3% 0.0% 0.0%. 0.0% NA Multi Racial.. NA Native Hawaiian/Pacific Islander 0.0%.. NA
116 Bluefield State College Impact Formal 2018 Target ( Data) Degrees Awarded Associate's Bachelor's Master's Doctorate STEM Associate's NA Bachelor's NA Master's NA Doctorate NA STEM Education* Health Associate's NA Bachelor's NA Master's NA Doctorate NA Federal Student Loan Cohort Default Rate Cohort Years: Cohort Three-Year Rate 26.8% 23.8% 19.6% 18.2% 20.4% 18.0% Research and Development FY 2013 FY 2014 FY2015 FY2016 FY 2018 Data Research grants & contracts* $250,683 $258,954 $127,840 $315,471 $299,134 Licensure Income* Peer-Reviewed Publications* Total FY2014 to FY 2018 Start-up Companies* Patents Issued* * Data to be provided by institution.
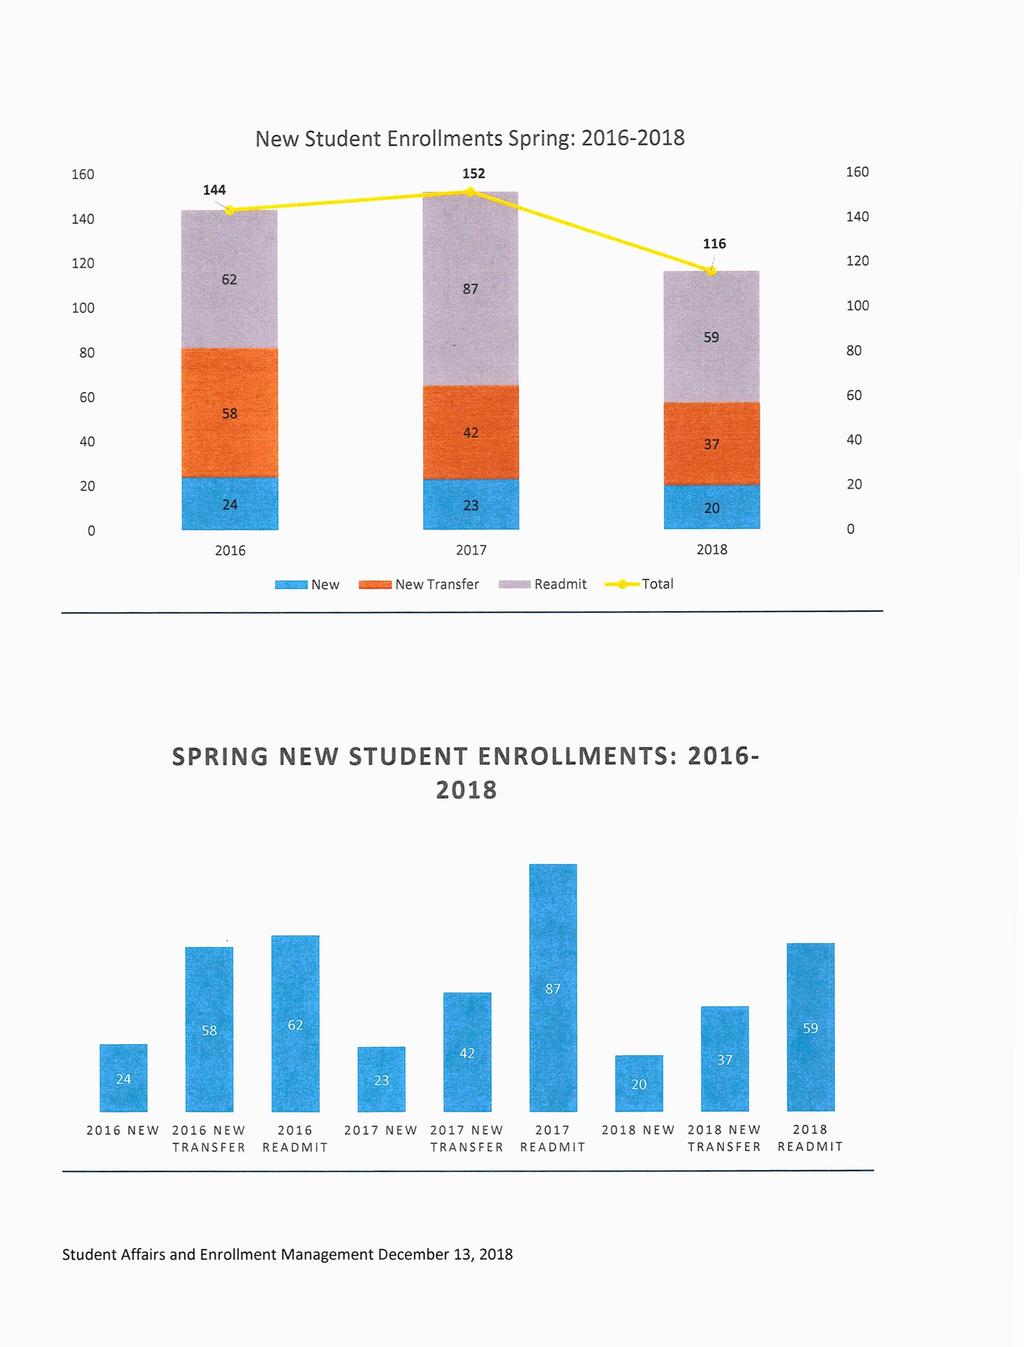
117
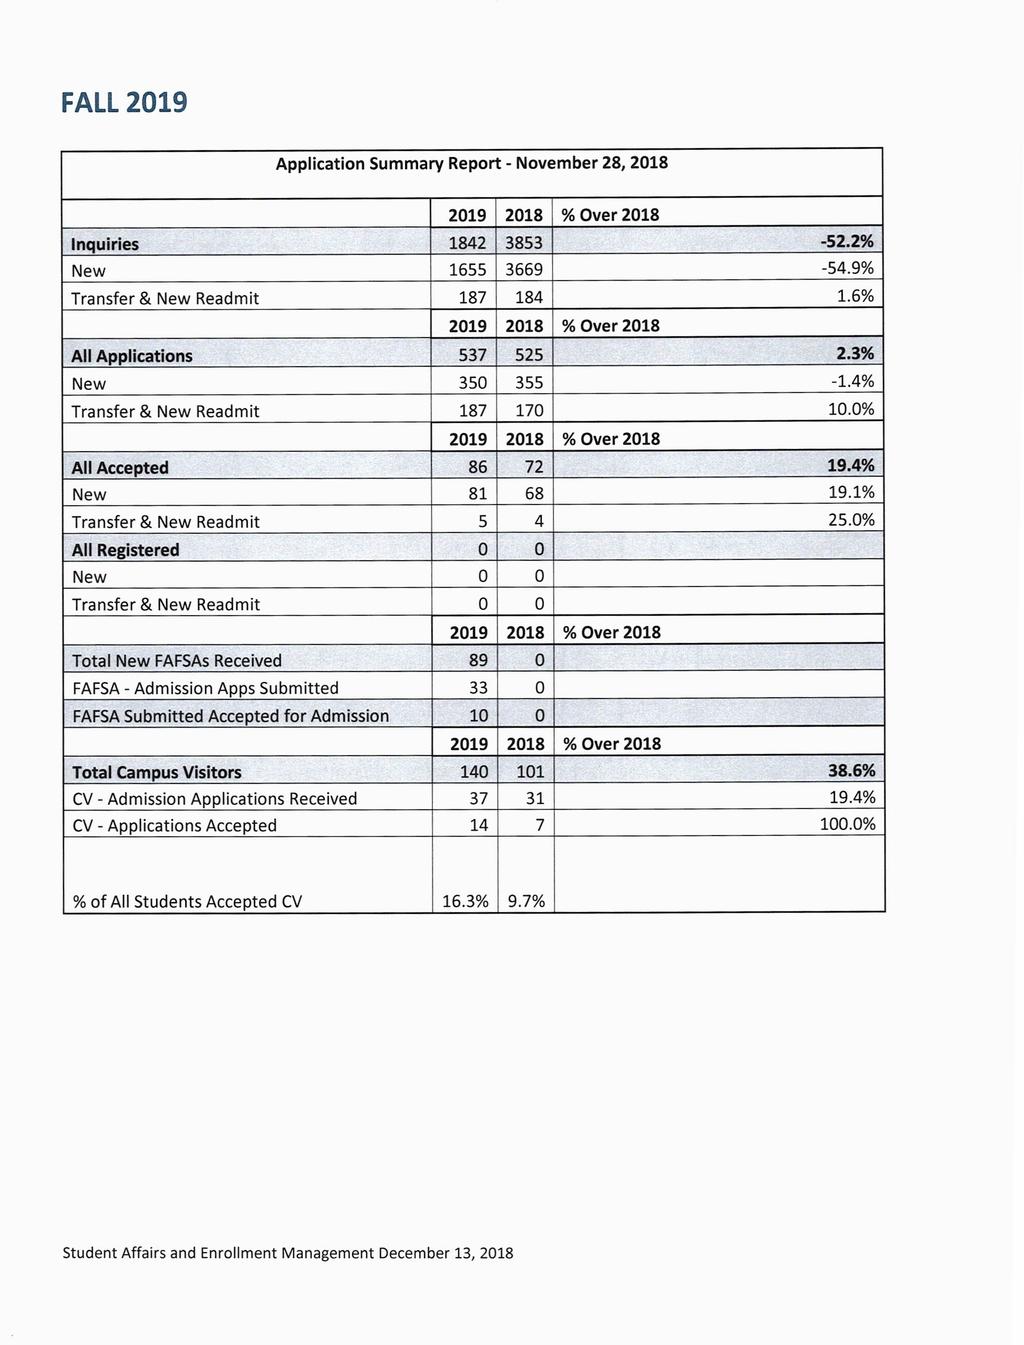
118
119
120
121
122
New River Community and Technical College. Financial Statements Years Ended June 30, 2017 and 2016 and Independent Auditor s Reports
 New River Community and Technical College Financial Statements Years Ended June 30, 2017 and 2016 and Independent Auditor s Reports TABLE OF CONTENTS Page INDEPENDENT AUDITOR S REPORT 3-4 MANAGEMENT S
New River Community and Technical College. Financial Statements Years Ended June 30, 2014 and 2013 and Independent Auditor s Reports
 New River Community and Technical College Financial Statements Years Ended June 30, 2014 and 2013 and Independent Auditor s Reports TABLE OF CONTENTS Page INDEPENDENT AUDITOR S REPORT 3-4 MANAGEMENT S
West Virginia School of Osteopathic Medicine
 West Virginia School of Osteopathic Medicine Financial Statements Years Ended June 30, 2016 and 2015 and Independent Auditor s Reports TABLE OF CONTENTS INDEPENDENT AUDITOR S REPORT 3-4 MANAGEMENT S DISCUSSION
Concord University. Combined Financial Statements Years Ended June 30, 2011 and 2010 and Independent Auditors Reports
 Concord University Combined Financial Statements Years Ended June 30, 2011 and 2010 and Independent Auditors Reports TABLE OF CONTENTS INDEPENDENT AUDITORS REPORT 3-4 MANAGEMENT S DISCUSSION AND ANALYSIS
Fairmont State University
 Fairmont State University Financial Statements as of and for the Years Ended June 30, 2009 and 2008, Additional Information as of and for the Year Ended June 30, 2009, and Independent Auditors Reports
West Virginia Higher Education Fund (A Component Unit of the State of West Virginia)
") West Virginia Higher Education Fund (A Component Unit of the State of West Virginia) Combined Financial Statements for the Years Ended June 30, 2007 and 2006, Additional Information for the Year Ended
West Virginia Higher Education Fund (A Component Unit of the State of West Virginia) Combined Financial Statements for the Years Ended June 30, 2007 and 2006, Additional Information for the Year Ended
Kanawha Valley Community and Technical College
 Kanawha Valley Community and Technical College Financial Statements Years Ended June 30, 2013 and 2012 and Independent Auditor s Reports TABLE OF CONTENTS INDEPENDENT AUDITOR S REPORT 3-4 MANAGEMENT S
Blue Ridge Community and Technical College (Formerly The Community and Technical College of Shepherd)
") Blue Ridge Community and Technical College (Formerly The Community and Technical College of Shepherd) Financial Statements as of and for the Years Ended June 30, 2007 and 2006, and Independent Auditors
Blue Ridge Community and Technical College (Formerly The Community and Technical College of Shepherd) Financial Statements as of and for the Years Ended June 30, 2007 and 2006, and Independent Auditors
The Community and Technical College of Shepherd. Financial Statements as of and for the Year Ended June 30, 2006, and Independent Auditors Reports
 The Community and Technical College of Shepherd Financial Statements as of and for the Year Ended June 30, 2006, and Independent Auditors Reports THE COMMUNITY AND TECHNICAL COLLEGE OF SHEPHERD TABLE OF
West Liberty University (Formerly West Liberty State College)
") West Liberty University (Formerly West Liberty State College) Financial Statements as of and for the Years Ended June 30, 2009 and 2008, and Independent Auditors Reports WEST LIBERTY UNIVERSITY (FORMERLY
West Liberty University (Formerly West Liberty State College) Financial Statements as of and for the Years Ended June 30, 2009 and 2008, and Independent Auditors Reports WEST LIBERTY UNIVERSITY (FORMERLY
West Virginia Higher Education Policy Commission
 West Virginia Higher Education Policy Commission Financial Statements and Additional Information for the Year Ended June 30, 2002, and Independent Auditors Reports WEST VIRGINIA HIGHER EDUCATION POLICY
Shepherd University. Financial Statements as of and for the Years Ended June 30, 2017 and 2016, and Independent Auditors Reports
 Shepherd University Financial Statements as of and for the Years Ended June 30, 2017 and 2016, and Independent Auditors Reports SHEPHERD UNIVERSITY TABLE OF CONTENTS INDEPENDENT AUDITORS REPORT 1 2 MANAGEMENT
Southern West Virginia Community and Technical College
 Southern West Virginia Community and Technical College Financial Statements for the Years Ended June 30, 2003 and 2002 and Independent Auditors Reports SOUTHERN WEST VIRGINIA COMMUNITY AND TECHNICAL COLLEGE
Shepherd University. Combined Financial Statements as of and for the Years Ended June 30, 2012 and 2011, and Independent Auditors Reports
 Shepherd University Combined Financial Statements as of and for the Years Ended June 30, 2012 and 2011, and Independent Auditors Reports SHEPHERD UNIVERSITY TABLE OF CONTENTS INDEPENDENT AUDITORS REPORT
WEST VIRGINIA UNIVERSITY INSTITUTE OF TECHNOLOGY
 WEST VIRGINIA UNIVERSITY INSTITUTE OF TECHNOLOGY Financial Statements and Additional Information for the Year Ended June 30, 2002 and Independent Auditors Reports WEST VIRGINIA UNIVERSITY INSTITUTE OF
Kanawha Valley Community and Technical College
 Kanawha Valley Community and Technical College Financial Statements as of and for the Years Ended June 30, 2010 and 2009, and Independent Auditors Reports KANAWHA VALLEY COMMUNITY AND TECHNICAL COLLEGE
Financial Statements and Reports Required by Uniform Guidance June 30, 2018 and 2017 The University of Oklahoma - Norman Campus
 Financial Statements and Reports Required by Uniform Guidance June 30, 2018 and 2017 The University of Oklahoma - Norman Campus eidebailly.com Table of Contents June 30, 2018 and 2017 Independent Auditor
WEST LIBERTY UNIVERSITY FINANCIAL STATEMENTS YEARS ENDED JUNE 30, 2016 AND 2015
 FINANCIAL STATEMENTS YEARS ENDED TABLE OF CONTENTS YEARS ENDED INDEPENDENT AUDITORS' REPORT 1 MANAGEMENT DISCUSSION AND ANALYSIS 3 FINANCIAL STATEMENTS STATEMENTS OF NET POSITION 11 STATEMENTS OF REVENUES,
MOUNTWEST COMMUNITY AND TECHNICAL COLLEGE. Financial Statements as of and for the Years Ended June 30, 2013 and 2012, and Independent Auditors Report
 MOUNTWEST COMMUNITY AND TECHNICAL COLLEGE Financial Statements as of and for the Years Ended June 30, 2013 and 2012, and Independent Auditors Report MOUNTWEST COMMUNITY AND TECHNICAL COLLEGE TABLE OF CONTENTS
WEST LIBERTY UNIVERSITY FINANCIAL STATEMENTS YEARS ENDED JUNE 30, 2017 AND 2016
 FINANCIAL STATEMENTS YEARS ENDED TABLE OF CONTENTS YEARS ENDED INDEPENDENT AUDITORS REPORT 1 MANAGEMENT DISCUSSION AND ANALYSIS 3 ABOUT WEST LIBERTY UNIVERSITY 3 OVERVIEW OF THE FINANCIAL STATEMENTS AND
WEST LIBERTY UNIVERSITY FINANCIAL STATEMENTS YEARS ENDED JUNE 30, 2014 AND 2013
 FINANCIAL STATEMENTS YEARS ENDED TABLE OF CONTENTS YEARS ENDED INDEPENDENT AUDITORS REPORT 1 MANAGEMENT S DISCUSSION AND ANALYSIS (RSI) (UNAUDITED) 3 FINANCIAL STATEMENTS STATEMENTS OF NET POSITION 12
West Liberty University
 West Liberty University Combined Financial Statements as of and for the Years Ended June 30, 2013 and 2012 (As Amended), and Independent Auditors Reports WEST LIBERTY UNIVERSITY TABLE OF CONTENTS INDEPENDENT
West Virginia Council for Community and Technical College Education (A Component Unit of the West Virginia Higher Education Fund)
") West Virginia Council for Community and Technical College Education (A Component Unit of the West Virginia Higher Education Fund) Combined Financial Statements as of and for the Years Ended June 30, 2009
West Virginia Council for Community and Technical College Education (A Component Unit of the West Virginia Higher Education Fund) Combined Financial Statements as of and for the Years Ended June 30, 2009
Financial Statements June 30, 2016 Rogers State University
 Financial Statements Rogers State University www.eidebailly.com Table of Contents Independent Auditor s Report... 1 Management s Discussion and Analysis... 4 Financial Statements Statement of Net Position...
West Liberty University. Financial Statements as of and for the Years Ended June 30, 2010 and 2009, and Independent Auditors Reports
 West Liberty University Financial Statements as of and for the Years Ended June 30, 2010 and 2009, and Independent Auditors Reports WEST LIBERTY UNIVERSITY TABLE OF CONTENTS INDEPENDENT AUDITORS REPORT
SOUTHEAST MISSOURI STATE UNIVERSITY FINANCIAL STATEMENTS JUNE 30, 2018
 SOUTHEAST MISSOURI STATE UNIVERSITY FINANCIAL STATEMENTS JUNE 30, 2018 Contents Page Independent Auditors Report... 1-3 Management s Discussion And Analysis... 4-11 Financial Statements Statement Of Net
Fairmont State University
 Fairmont State University Financial Statements Years Ended June 30, 2017 and 2016 and Independent Auditor s Reports TABLE OF CONTENTS INDEPENDENT AUDITOR S REPORT 3-4 MANAGEMENT S DISCUSSION AND ANALYSIS
AS OF AND FOR THE YEAR ENDED JUNE 30, 2016
 TM FINANCIAL STATEMENTS AND SCHEDULE OF EXPENDITURES OF FEDERAL AWARDS WITH REPORTS OF INDEPENDENT AUDITORS AS OF AND FOR THE YEAR ENDED TABLE OF CONTENTS YEAR ENDED INDEPENDENT AUDITORS REPORT 3 MANAGEMENT
WEST VIRGINIA UNIVERSITY AT PARKERSBURG. Financial Statements as of and for the Years Ended June 30, 2017 and 2016 and Independent Auditors Reports
 WEST VIRGINIA UNIVERSITY AT PARKERSBURG Financial Statements as of and for the Years Ended June 30, 2017 and 2016 and Independent Auditors Reports WEST VIRGINIA UNIVERSITY AT PARKERSBURG TABLE OF CONTENTS
UNIVERSITY OF ALASKA
 UNIVERSITY OF ALASKA (A Component Unit of the State of Alaska) Financial Statements (With Independent Auditors Report Thereon) University of Alaska (A Component Unit of the State of Alaska) Financial Statements
MOUNTWEST COMMUNITY AND TECHNICAL COLLEGE. Financial Statements as of and for the Years Ended June 30, 2012 and 2011, and Independent Auditors Report
 MOUNTWEST COMMUNITY AND TECHNICAL COLLEGE Financial Statements as of and for the Years Ended June 30, 2012 and 2011, and Independent Auditors Report MOUNTWEST COMMUNITY AND TECHNICAL COLLEGE TABLE OF CONTENTS
CARROLL COMMUNITY COLLEGE FINANCIAL STATEMENTS YEARS ENDED JUNE 30, 2017 AND 2016
 FINANCIAL STATEMENTS YEARS ENDED TABLE OF CONTENTS YEARS ENDED INDEPENDENT AUDITORS REPORT 1 MANAGEMENT S DISCUSSION AND ANALYSIS 3 FINANCIAL STATEMENTS STATEMENTS OF NET POSITION (DEFICIT) 13 STATEMENTS
West Virginia Northern Community College
 West Virginia Northern Community College Financial Statements and Additional Information for the Year Ended June 30, 2002, and Independent Auditors Reports WEST VIRGINIA NORTHERN COMMUNITY COLLEGE TABLE
Marshall Community and Technical College. Financial Statements as of and for the Year Ended June 30, 2009, and Independent Auditors Reports
 Marshall Community and Technical College Financial Statements as of and for the Year Ended June 30, 2009, and Independent Auditors Reports MARSHALL COMMUNITY AND TECHNICAL COLLEGE TABLE OF CONTENTS INDEPENDENT
Financial Statements June 30, 2017 Rogers State University
 Financial Statements Rogers State University www.eidebailly.com Table of Contents Independent Auditor s Report... 1 Management s Discussion and Analysis... 4 Financial Statements Statement of Net Position...
CARROLL COMMUNITY COLLEGE FINANCIAL STATEMENTS JUNE 30, 2016 AND 2015
 FINANCIAL STATEMENTS TABLE OF CONTENTS YEARS ENDED INDEPENDENT AUDITORS REPORT 1 MANAGEMENT S DISCUSSION AND ANALYSIS 3 FINANCIAL STATEMENTS STATEMENTS OF NET POSITION (DEFICIT) 12 STATEMENTS OF REVENUES,
Report of Independent Auditors in accordance with the Uniform Guidance and Financial Statements for
 Report of Independent Auditors in accordance with the Uniform Guidance and Financial Statements for June 30, 2016 and 2015 LEWIS-CLARK STATE COLLEGE TABLE OF CONTENTS Page REPORT OF INDEPENDENT AUDITORS
Oklahoma Panhandle State University
 Oklahoma Panhandle State University An Organizational Unit of the Board of Regents For the Oklahoma Agricultural and Mechanical Colleges Financial Statements with Independent Auditors Reports June 30,
GLENVILLE STATE COLLEGE
 GLENVILLE STATE COLLEGE Glenville, West Virginia Combined Financial Statements and Additional Information for the Years Ended June 30, 2012 and 2011 and Independent Auditors Reports GLENVILLE STATE COLLEGE
West Virginia State University Research and Development Corporation
 West Virginia State University Research and Development Corporation Financial Statements as of and for the Years Ended June 30, 2009 and 2008, and Independent Auditors Report and Reports Required by OMB
WEST VIRGINIA UNIVERSITY AT PARKERSBURG. Financial Statements as of and for the Years Ended June 30, 2016 and 2015 and Independent Auditors Reports
 WEST VIRGINIA UNIVERSITY AT PARKERSBURG Financial Statements as of and for the Years Ended June 30, 2016 and 2015 and Independent Auditors Reports WEST VIRGINIA UNIVERSITY AT PARKERSBURG TABLE OF CONTENTS
Oklahoma Panhandle State University
 Oklahoma Panhandle State University Financial Statements with Independent Auditors Reports June 30, 2017 and 2016 Contents Independent Auditor s Report 1 2 Management s Discussion and Analysis (Unaudited)
UNIVERSITY OF ALASKA
 UNIVERSITY OF ALASKA (A Component Unit of the State of Alaska) Financial Statements (With Independent Auditors Report Thereon) University of Alaska (A Component Unit of the State of Alaska) Financial Statements
SOUTHEAST MISSOURI STATE UNIVERSITY FINANCIAL STATEMENTS JUNE 30, 2016
 SOUTHEAST MISSOURI STATE UNIVERSITY FINANCIAL STATEMENTS JUNE 30, 2016 Contents Page Independent Auditors Report... 1-3 Management s Discussion And Analysis... 4-13 Financial Statements Statement Of Net
West Virginia Council for Community and Technical College Education
 West Virginia Council for Community and Technical College Education (A Component Unit of the West Virginia Higher Education Policy Commission) Combined Financial Statements Years Ended June 30, 2017 and
WINSTON-SALEM STATE UNIVERSITY
 STATE OF NORTH f CAROLINA OFFICE OF THE STATE AUDITOR BETH A. WOOD, CPA WINSTON-SALEM STATE UNIVERSITY WINSTON-SALEM, NORTH CAROLINA FINANCIAL STATEMENT AUDIT REPORT FOR THE YEAR ENDED JUNE 30, 2018 A
COMMUNITY COLLEGE DISTRICT OF ST. LOUIS ST. LOUIS COUNTY, MISSOURI St. Louis, Missouri FINANCIAL STATEMENTS. June 30, 2017 and 2016
 ST. LOUIS COUNTY, MISSOURI St. Louis, Missouri FINANCIAL STATEMENTS TABLE OF CONTENTS INDEPENDENT AUDITORS' REPORT... 4 MANAGEMENT S DISCUSSION AND ANALYSIS... 8 FINANCIAL STATEMENTS Statements of Net
University of NORTH ALABAMA FINANCIAL REPORT 2017
 University of NORTH ALABAMA FINANCIAL REPORT 2017 Table of Contents September 30, 2016 PART I FINANCIAL STATEMENTS Independent Auditor s Report... 1 Management s Discussion and Analysis... 4 Statement
CLARION UNIVERSITY OF PENNSYLVANIA OF THE STATE SYSTEM OF HIGHER EDUCATION FINANCIAL STATEMENTS AND SUPPLEMENTARY INFORMATION
 FINANCIAL STATEMENTS AND SUPPLEMENTARY INFORMATION YEARS ENDED TABLE OF CONTENTS YEARS ENDED INDEPENDENT AUDITORS' REPORT 1 FINANCIAL STATEMENTS BALANCE SHEETS PRIMARY INSTITUTION 3 STATEMENTS OF REVENUES,
DURHAM TECHNICAL COMMUNITY COLLEGE
 STATE OF NORTH CAROLINA OFFICE OF THE STATE AUDITOR BETH A. WOOD, CPA DURHAM TECHNICAL COMMUNITY COLLEGE DURHAM, NORTH CAROLINA FINANCIAL STATEMENT AUDIT REPORT FOR THE YEAR ENDED JUNE 30, 2015 A COMPONENT
Marshall University Research Corporation (A Component Unit of Marshall University)
") Marshall University Research Corporation (A Component Unit of Marshall University) Financial Statements as of and for the Years Ended June 30, 2007 and 2006, Supplemental Schedule for the Year Ended June
Marshall University Research Corporation (A Component Unit of Marshall University) Financial Statements as of and for the Years Ended June 30, 2007 and 2006, Supplemental Schedule for the Year Ended June
FINANCIAL STATEMENT REPORT
 FINANCIAL STATEMENT REPORT FOR THE YEAR ENDED TABLE OF CONTENTS INDEPENDENT AUDITOR S REPORT... 1 MANAGEMENT S DISCUSSION AND ANALYSIS... 3 FINANCIAL STATEMENTS COLLEGE EXHIBITS A-1 STATEMENT OF NET POSITION...
Bergen Community College (A Component Unit of the County of Bergen)
") Basic Financial Statements, Management s Discussion and Analysis and Schedules of Expenditures of Federal and State Awards (With Independent Auditors Reports Thereon) Report on Financial Statements and
Basic Financial Statements, Management s Discussion and Analysis and Schedules of Expenditures of Federal and State Awards (With Independent Auditors Reports Thereon) Report on Financial Statements and
MOREHEAD STATE UNIVERSITY. Single Audit Reports Under Uniform Guidance
 Single Audit Reports Under Uniform Guidance As of and for the Years Ended June 30, 2017 and 2016 with Report of Independent Auditors M CONTENTS Management s Discussion and Analysis... 1 Report of Independent
Bergen Community College (A Component Unit of the County of Bergen)
") Basic Financial Statements, Management s Discussion and Analysis and Schedules of Expenditures of Federal and State Awards (With Independent Auditors Reports Thereon) Report on Financial Statements and
Basic Financial Statements, Management s Discussion and Analysis and Schedules of Expenditures of Federal and State Awards (With Independent Auditors Reports Thereon) Report on Financial Statements and
HARFORD COMMUNITY COLLEGE COMPONENT UNIT FINANCIAL STATEMENTS AND SINGLE AUDIT COMPLIANCE REPORTS YEAR ENDED JUNE 30, 2013
 COMPONENT UNIT FINANCIAL STATEMENTS AND SINGLE AUDIT COMPLIANCE REPORTS YEAR ENDED TABLE OF CONTENTS YEAR ENDED INDEPENDENT AUDITORS REPORT 1 MANAGEMENT DISCUSSION AND ANALYSIS (UNAUDITED) 4 FINANCIAL
JOHNSTON COMMUNITY COLLEGE
 STATE OF NORTH CAROLINA OFFICE OF THE STATE AUDITOR BETH A. WOOD, CPA JOHNSTON COMMUNITY COLLEGE SMITHFIELD, NORTH CAROLINA FINANCIAL STATEMENT AUDIT REPORT FOR THE YEAR ENDED JUNE 30, 2017 A COMPONENT
Financial Statements June 30, 2017 and 2016 The University of Oklahoma - Norman Campus
 Financial Statements June 30, 2017 and 2016 The University of Oklahoma - Norman Campus Table of Contents June 30, 2017 and 2016 Independent Auditor s Report... 1 Management's Discussion and Analysis (Unaudited)...
West Virginia Network for Educational Telecomputing (A Unit of the West Virginia Higher Education Policy Commission)
") West Virginia Network for Educational Telecomputing (A Unit of the West Virginia Higher Education Policy Commission) Financial Statements and Additional Information for the Years Ended June 30, 2003 and
West Virginia Network for Educational Telecomputing (A Unit of the West Virginia Higher Education Policy Commission) Financial Statements and Additional Information for the Years Ended June 30, 2003 and
Audited Financial Statements and Reports Required by Uniform Guidance As of and for the Year Ended June 30, 2018 Rogers State University
 Audited Financial Statements and Reports Required by Uniform Guidance As of and for the Year Ended Rogers State University eidebailly.com Table of Contents As of and for the Year Ended Independent Auditor
SANDHILLS COMMUNITY COLLEGE
 STATE OF NORTH CAROLINA OFFICE OF THE STATE AUDITOR BETH A. WOOD, CPA SANDHILLS COMMUNITY COLLEGE PINEHURST, NORTH CAROLINA FINANCIAL STATEMENT AUDIT REPORT FOR THE YEAR ENDED JUNE 30, 2018 A COMPONENT
GENESEE COMMUNITY COLLEGE SINGLE AUDIT REPORTS AUGUST 31, 2016
 GENESEE COMMUNITY COLLEGE SINGLE AUDIT REPORTS AUGUST 31, 2016 GENESEE COMMUNITY COLLEGE (A Component Unit of the County of Genesee, New York) Table of Contents August 31, 2016 Independent Auditors Report
INDEPENDENT AUDITORS REPORT 1 MANAGEMENT S DISCUSSION AND ANALYSIS Statements of Net Assets 11
 University of Idaho Financial Statements for the Years Ended June 30, 2003 and 2002 and Independent Auditors Report Including Single Audit Reports for the Year Ended June 30, 2003 UNIVERSITY OF IDAHO TABLE
Report of Independent Auditors and Financial Statements for
 Report of Independent Auditors and Financial Statements for June 30, 2013 and 2012 LEWIS-CLARK STATE COLLEGE TABLE OF CONTENTS Page REPORT OF INDEPENDENT AUDITORS 1-2 MANAGEMENT S DISCUSSION AND ANALYSIS
ESSEX COUNTY COLLEGE (A Component Unit of the County of Essex) FINANCIAL STATEMENTS AND SUPPLEMENTARY INFORMATION YEARS ENDED JUNE 30, 2018 AND 2017
 FINANCIAL STATEMENTS AND SUPPLEMENTARY INFORMATION YEARS ENDED JUNE 30, 2018 AND 2017") (A Component Unit of the County of Essex) FINANCIAL STATEMENTS AND SUPPLEMENTARY INFORMATION YEARS ENDED JUNE 30, 2018 AND 2017 CliftonLarsonAllen LLP TABLE OF CONTENTS YEARS ENDED JUNE 30, 2018 AND 2017
(A Component Unit of the County of Essex) FINANCIAL STATEMENTS AND SUPPLEMENTARY INFORMATION YEARS ENDED JUNE 30, 2018 AND 2017 CliftonLarsonAllen LLP TABLE OF CONTENTS YEARS ENDED JUNE 30, 2018 AND 2017
MITCHELL COMMUNITY COLLEGE
 STATE OF NORTH CAROLINA OFFICE OF THE STATE AUDITOR BETH A. WOOD, CPA MITCHELL COMMUNITY COLLEGE STATESVILLE, NORTH CAROLINA FINANCIAL STATEMENT AUDIT REPORT FOR THE YEAR ENDED JUNE 30, 2015 A COMPONENT
SOUTH PIEDMONT COMMUNITY COLLEGE
 STATE OF NORTH CAROLINA OFFICE OF THE STATE AUDITOR BETH A. WOOD, CPA SOUTH PIEDMONT COMMUNITY COLLEGE POLKTON, NORTH CAROLINA FINANCIAL STATEMENT AUDIT REPORT FOR THE YEAR ENDED JUNE 30, 2017 A COMPONENT
Audited Financial Statements Stanly Community College Albemarle, North Carolina As of and for the Year Ended June 30, 2014
 Audited Financial Statements Stanly Community College Albemarle, North Carolina As of and for the Year Ended June 30, 2014 TABLE OF CONTENTS Pages Independent Auditors' Report 1-2 Management's Discussion
MONROE COMMUNITY COLLEGE (A Component Unit of the County of Monroe, New York)
") MONROE COMMUNITY COLLEGE (A Component Unit of the County of Monroe, New York) Financial Statements As of August 31, 2016 and 2015 Together with Independent Auditor s Report MONROE COMMUNITY COLLEGE (A
MONROE COMMUNITY COLLEGE (A Component Unit of the County of Monroe, New York) Financial Statements As of August 31, 2016 and 2015 Together with Independent Auditor s Report MONROE COMMUNITY COLLEGE (A
GLENVILLE STATE COLLEGE. Combined Financial Statements for the Years Ended June 30, 2001 and 2000, and Independent Auditors Reports
 GLENVILLE STATE COLLEGE Combined Financial Statements for the Years Ended June 30, 2001 and 2000, and Independent Auditors Reports GLENVILLE STATE COLLEGE TABLE OF CONTENTS INDEPENDENT AUDITORS REPORT
WILSON COMMUNITY COLLEGE
 STATE OF NORTH CAROLINA OFFICE OF THE STATE AUDITOR BETH A. WOOD, CPA WILSON COMMUNITY COLLEGE WILSON, NORTH CAROLINA FINANCIAL STATEMENT AUDIT REPORT FOR THE YEAR ENDED JUNE 30, 2017 A COMPONENT UNIT
BRISTOL COMMUNITY COLLEGE (an Agency of the Commonwealth of Massachusetts) FINANCIAL STATEMENTS AND MANAGEMENT S DISCUSSION AND ANALYSIS
 FINANCIAL STATEMENTS AND MANAGEMENT S DISCUSSION AND ANALYSIS") (an Agency of the Commonwealth of Massachusetts) FINANCIAL STATEMENTS AND MANAGEMENT S DISCUSSION AND ANALYSIS JUNE 30, 2017 Financial Statements and Management s Discussion and Analysis C O N T E N T
(an Agency of the Commonwealth of Massachusetts) FINANCIAL STATEMENTS AND MANAGEMENT S DISCUSSION AND ANALYSIS JUNE 30, 2017 Financial Statements and Management s Discussion and Analysis C O N T E N T
Jacksonville State University Financial Statements September 30, 2017 and 2016
 Financial Statements September 30, 2017 and 2016 Table of Contents September 30, 2017 and 2016 PART I FINANCIAL STATEMENTS PAGE Independent Auditor s Report... 1 Management s Discussion and Analysis...
Kent State University (a component unit of the State of Ohio)
") Kent State University (a component unit of the State of Ohio) Financial Report Including Supplementary Information June 30, 2018 Table of Contents June 30, 2018 and 2017 Page(s) Independent Auditor s Report...
Kent State University (a component unit of the State of Ohio) Financial Report Including Supplementary Information June 30, 2018 Table of Contents June 30, 2018 and 2017 Page(s) Independent Auditor s Report...
FORSYTH TECHNICAL COMMUNITY COLLEGE
 STATE OF NORTH CAROLINA OFFICE OF THE STATE AUDITOR BETH A. WOOD, CPA FORSYTH TECHNICAL COMMUNITY COLLEGE WINSTON-SALEM, NORTH CAROLINA FINANCIAL STATEMENT AUDIT REPORT FOR THE YEAR ENDED JUNE 30, 2017
MAYLAND COMMUNITY COLLEGE
 STATE OF NORTH Note CAROLINA OFFICE OF THE STATE AUDITOR BETH A. WOOD, CPA MAYLAND COMMUNITY COLLEGE SPRUCE PINE, NORTH CAROLINA FINANCIAL STATEMENT AUDIT REPORT FOR THE YEAR ENDED JUNE 30, 2017 A COMPONENT
MONROE COMMUNITY COLLEGE (A Component Unit of the County of Monroe, New York)
") MONROE COMMUNITY COLLEGE (A Component Unit of the County of Monroe, New York) Financial Statements As of August 31, 2017 and 2016 Together with Independent Auditor s Report MONROE COMMUNITY COLLEGE (A
MONROE COMMUNITY COLLEGE (A Component Unit of the County of Monroe, New York) Financial Statements As of August 31, 2017 and 2016 Together with Independent Auditor s Report MONROE COMMUNITY COLLEGE (A
UNIVERSITY OF ALASKA
 UNIVERSITY OF ALASKA (A Component Unit of the State of Alaska) Financial Statements (With Independent Auditors Report Thereon) University of Alaska (A Component Unit of the State of Alaska) Financial Statements
SOUTHWESTERN OKLAHOMA STATE UNIVERSITY
 SOUTHWESTERN OKLAHOMA STATE UNIVERSITY A DEPARTMENT OF THE REGIONAL UNIVERSITY SYSTEM OF OKLAHOMA ANNUAL FINANCIAL STATEMENTS AND INDEPENDENT AUDITOR S REPORT AS OF AND FOR THE YEAR ENDED JUNE 30, 2016
HARFORD COMMUNITY COLLEGE COMPONENT UNIT FINANCIAL STATEMENTS AND SINGLE AUDIT COMPLIANCE REPORTS YEAR ENDED JUNE 30, 2017
 COMPONENT UNIT FINANCIAL STATEMENTS AND SINGLE AUDIT COMPLIANCE REPORTS TABLE OF CONTENTS INDEPENDENT AUDITORS REPORT 1 MANAGEMENT DISCUSSION AND ANALYSIS (UNAUDITED) 4 FINANCIAL STATEMENTS STATEMENT OF
Shasta Tehama Trinity Joint Community College District Redding, California
 Shasta Tehama Trinity Joint Community College District Redding, California FINANCIAL STATEMENTS AND SUPPLEMENTARY INFORMATION WITH INDEPENDENT AUDITORS REPORTS June 30, 2016 TABLE OF CONTENTS June 30,
UNIVERSITY OF SOUTH ALABAMA (A Component Unit of the State of Alabama)
") Basic Financial Statements and Single Audit Reporting in Accordance with the Uniform Guidance Table of Contents Management s Discussion and Analysis (Unaudited) 1 Independent Auditors Report 15 Basic Financial
Basic Financial Statements and Single Audit Reporting in Accordance with the Uniform Guidance Table of Contents Management s Discussion and Analysis (Unaudited) 1 Independent Auditors Report 15 Basic Financial
DURHAM TECHNICAL COMMUNITY COLLEGE
 STATE OF NORTH f CAROLINA OFFICE OF THE STATE AUDITOR BETH A. WOOD, CPA DURHAM TECHNICAL COMMUNITY COLLEGE DURHAM, NORTH CAROLINA FINANCIAL STATEMENT AUDIT REPORT FOR THE YEAR ENDED JUNE 30, 2017 A COMPONENT
Kent State University (a component unit of the State of Ohio)
") Kent State University (a component unit of the State of Ohio) Financial Report Including Supplementary Information June 30, 2016 Table of Contents June 30, 2016 and 2015 Page(s) Management s Discussion
Kent State University (a component unit of the State of Ohio) Financial Report Including Supplementary Information June 30, 2016 Table of Contents June 30, 2016 and 2015 Page(s) Management s Discussion
Graham County Community College District. Annual Financial Report
 Annual Financial Report June 30, 2016 Graham County Community College District Single Audit Reporting Package June 30, 2016 Single audit reporting package Year ended June 30, 2016 Table of Contents Financial
JOHNSON COUNTY COMMUNITY COLLEGE FINANCIAL STATEMENTS JUNE 30, 2017
 JOHNSON COUNTY COMMUNITY COLLEGE FINANCIAL STATEMENTS JUNE 30, 2017 Contents Independent Auditor s Report 1 2 Management s Discussion and Analysis 3 13 Financial Statements Statements of net position 14
STATE OF NORTH CAROLINA
 STATE OF NORTH CAROLINA SOUTH PIEDMONT COMMUNITY COLLEGE POLKTON, NORTH CAROLINA FINANCIAL STATEMENT AUDIT REPORT FOR THE YEAR ENDED JUNE 30, 2013 OFFICE OF THE STATE AUDITOR BETH A. WOOD, CPA STATE AUDITOR
Montgomery County Community College (A Component Unit of the County of Montgomery, Pennsylvania)
") Montgomery County Community College (A Component Unit of the County of Montgomery, Pennsylvania) Financial Statements, Required Supplementary Information, and Supplementary Information Years Ended June
Montgomery County Community College (A Component Unit of the County of Montgomery, Pennsylvania) Financial Statements, Required Supplementary Information, and Supplementary Information Years Ended June
Lehigh Carbon Community College
 Financial Statements Table of Contents Independent Auditors Report 1 Management s Discussion and Analysis 3 Financial Statements Statement of Net Position - Primary Institution 12 Statement of Revenues,
STATE OF NORTH CAROLINA
 STATE OF NORTH CAROLINA WINSTON-SALEM STATE UNIVERSITY WINSTON-SALEM, NORTH CAROLINA FINANCIAL STATEMENT AUDIT REPORT FOR THE YEAR ENDED JUNE 30, 2010 OFFICE OF THE STATE AUDITOR BETH A. WOOD, CPA STATE
Financial Statements and Supplemental Data Together with Report of Independent Public Accountants
 Financial Statements and Supplemental Data Together with Report of Independent Public Accountants For the Years Ended June 30, 2016 and 2015 This page intentionally left blank. UNIVERSITY SYSTEM OF MARYLAND
Glenville State College. Combined Financial Statements for the Year Ended June 30, 2002 and Independent Auditors Reports
 Glenville State College Combined Financial Statements for the Year Ended June 30, 2002 and Independent Auditors Reports GLENVILLE STATE COLLEGE TABLE OF CONTENTS Page MANAGEMENT S DISCUSSION AND ANALYSIS
NORTH CAROLINA SCHOOL OF SCIENCE
 STATE OF NORTH CAROLINA OFFICE OF THE STATE AUDITOR BETH A. WOOD, CPA NORTH CAROLINA SCHOOL OF SCIENCE AND MATHEMATICS DURHAM, NORTH CAROLINA FINANCIAL STATEMENT AUDIT REPORT FOR THE YEAR ENDED JUNE 30,
STATE OF ILLINOIS ILLINOIS STATE UNIVERSITY. FINANCIAL AUDIT (In Accordance with the Single Audit Act and OMB Circular A-133)
") STATE OF ILLINOIS ILLINOIS STATE UNIVERSITY FINANCIAL AUDIT (In Accordance with the Single Audit Act and OMB Circular A-133) For The Years Ended June 30, 2009 and 2008 Performed as Special Assistant Auditors
STATE OF ILLINOIS ILLINOIS STATE UNIVERSITY FINANCIAL AUDIT (In Accordance with the Single Audit Act and OMB Circular A-133) For The Years Ended June 30, 2009 and 2008 Performed as Special Assistant Auditors
Western Oklahoma State College Table of Contents June 30, 2018 and 2017
 Table of Contents Independent Auditors Report... 1 Management s Discussion and Analysis... i Financial Statements Statements of Net Position... 3 Statements of Revenues, Expenses, and Changes in Net Position...
FINANCIAL STATEMENT AUDIT REPORT
 GRAHAM, NORTH CAROLINA FINANCIAL STATEMENT AUDIT REPORT For the Year Ended June 30, 2012 S. Preston Douglas & Associates, LLP Certified Public Accountants ALAMANCE COMMUNITY COLLEGE GRAHAM, NORTH CAROLINA
Financial statements and report of independent certified public accountants Oklahoma State University June 30, 2006 and 2005
 Financial statements and report of independent certified public accountants Oklahoma State University June 30, 2006 and 2005 C O N T E N T S Page MANAGEMENT S DISCUSSION AND ANALYSIS i REPORT OF INDEPENDENT
WILKES COMMUNITY COLLEGE
 STATE OF NORTH CAROLINA OFFICE OF THE STATE AUDITOR BETH A. WOOD, CPA WILKES COMMUNITY COLLEGE WILKESBORO, NORTH CAROLINA FINANCIAL STATEMENT AUDIT REPORT FOR THE YEAR ENDED JUNE 30, 2018 A COMPONENT UNIT
FINANCIAL STATEMENTS University of South Alabama Year ended September 30, 2002 with Report of Independent Auditors
 FINANCIAL STATEMENTS University of South Alabama Year ended September 30, 2002 with Report of Independent Auditors Financial Statements Year ended September 30, 2002 Contents Management s Discussion and
WEST VIRGINIA UNIVERSITY. Combined Financial Statements for the Years Ended June 30, 2001 and 2000 and Independent Auditors Reports
 WEST VIRGINIA UNIVERSITY Combined Financial Statements for the Years Ended June 30, 2001 and 2000 and Independent Auditors Reports WEST VIRGINIA UNIVERSITY TABLE OF CONTENTS INDEPENDENT AUDITORS REPORT