Ten years in Economic and Monetary Union: Malta s experience Rita Schembri
|
|
|
- Winfred Pearson
- 5 years ago
- Views:
Transcription
1 Ten years in Economic and Monetary Union: Malta s experience Rita Schembri 3 July 2018
2 Overview Economic context and timeline The Maltese economy since euro adoption Economic convergence criteria Lessons learned
3 Economic context and timeline
4 The Maltese economy is very small and open Population 460,297 GDP ( billion) 11.1 GDP (% of EU) 0.07 GDP per capita (PPS, EU28=100) 94 GDP per capita (PPS, EA19=100) 89 Total exports (% of GDP) 136 Total imports (% of GDP) 118 FDI stock (% of GDP)* 28 * Excludes the financial sector.
5 The road to euro adoption Apr 1971 Association Agreement comes into force Jul 1990 Malta applies for EU membership Feb 1997 Malta seeks as close a relationship with the EU as is compatible with its circumstances 1998 European Commission Communication aims at completing free trade area and strengthening co-operation with Malta. EU membership application is reactivated. Feb 1999 European Commission recommends start of negotiations with Malta.
6 The road to euro adoption May 2004 Malta joins the EU with an obligation to adopt the euro May 2005 Maltese lira joins ERM II July 2007 ECOFIN Council decides that Malta fulfils the convergence criteria and is eligible to adopt the euro January 2008 Malta adopts the euro
7 Key considerations behind early euro adoption Economic benefits in terms of growth, employment, lower currency risk Strong trade links with the euro area A similar economic cycle and structure A relatively flexible labour market A long and positive track record with an exchange rate peg Sufficient price, income and interest rate convergence! Poor track record in public finances
8 Key considerations behind early euro adoption Gradual approach Minimum ERM II period offered a limited time window for the necessary adjustment and for fulfilling all the official criteria for euro adoption Degree of adjustment needed in such a short period could carry significant social costs. Bolder reforms Delaying reforms undermines growth and credibility of fixed exchange rate regime The discipline inherent in the irrevocable fixing of the exchange rate and the policy framework in EMU offer the best prospect for long-lasting reforms.
9 The Maltese economy since euro adoption


10 The Maltese economy became more diversified and service-oriented

11 Diversification in the context of economic and financial stability facilitated income convergence


12 Robust economic growth supported job creation and lower unemployment

13 Unemployment fell despite increased labour market participation Supporting factors Income tax reforms Make work pay initiatives Free child care facilities Enhanced training & re-skilling programmes Life-long learning Pension reform
14 The economy has also benefited from the growing presence of foreign workers FOREIGNERS BY ECONOMIC SECTOR Accommodation and Food Service Activities % 18.5% 15.4% 2.6% 8.3% 35.7% Agriculture, Forestry and Fishing % 1.0% 0.4% 0.3% 1.5% 5.1% Arts, Entertainment and Recreation % 9.6% 13.4% 6.6% 21.5% 57.2% Construction % 13.3% 6.5% 3.6% 6.7% 23.4% Financial and Insurance Activities; Real Estate Activities % 3.0% 4.4% 1.3% 2.5% 15.1% Manufacturing; Quarrying; Utilities % 16.2% 7.4% 1.1% 3.8% 12.5% Other Service Activities % 3.8% 3.3% 2.9% 5.8% 22.5% Professional, Scientific and Technical Activities; Administrative and Support Service Activities % 16.5% 24.6% 4.5% 7.7% 29.6% Public Admin; Education; Health and Social Work Activities % 7.7% 8.3% 0.9% 1.3% 6.8% Wholesale and Retail Trade; Transportation and Storage; ICT % 10.4% 16.3% 1.1% 1.7% 13.0% Source: Jobsplus, CBM Workings Persons % of foreigners % of employment % 100.0% 100.0% 1.68% 3.91% 18.64%


15 Enhanced competition and trade linkages, and labour supply growth helped keep a lid on wage growth and inflation
16 Economic convergence criteria

17 The inflation criterion
18 Unit labour costs and price convergence Purchasing power parities (PPPs), price level indices (EA19 = 100) GDP Actual individual consumption Food and non-alcoholic beverages Alcoholic beverages, tobacco and narcotics Housing, water, electricity, gas and other fuels Household furnishings, equipment and maintenance Health Transport Communication Recreation and culture Education Restaurants and hotels Miscellaneous goods and services Source: Eurostat, CBM calculations

19 The interest rate criterion

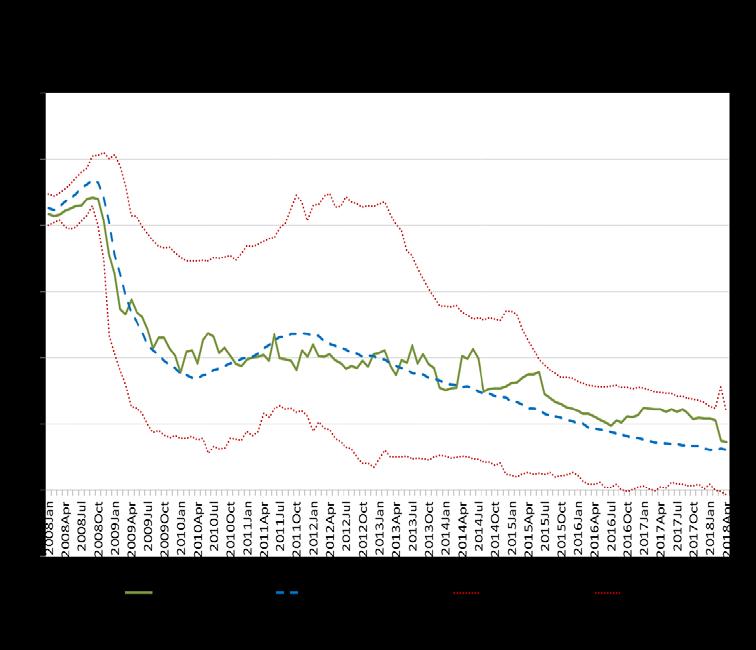
20 Retail deposit rates


21 Retail lending rates


22 The fiscal criteria

23 The cyclically-adjusted balance

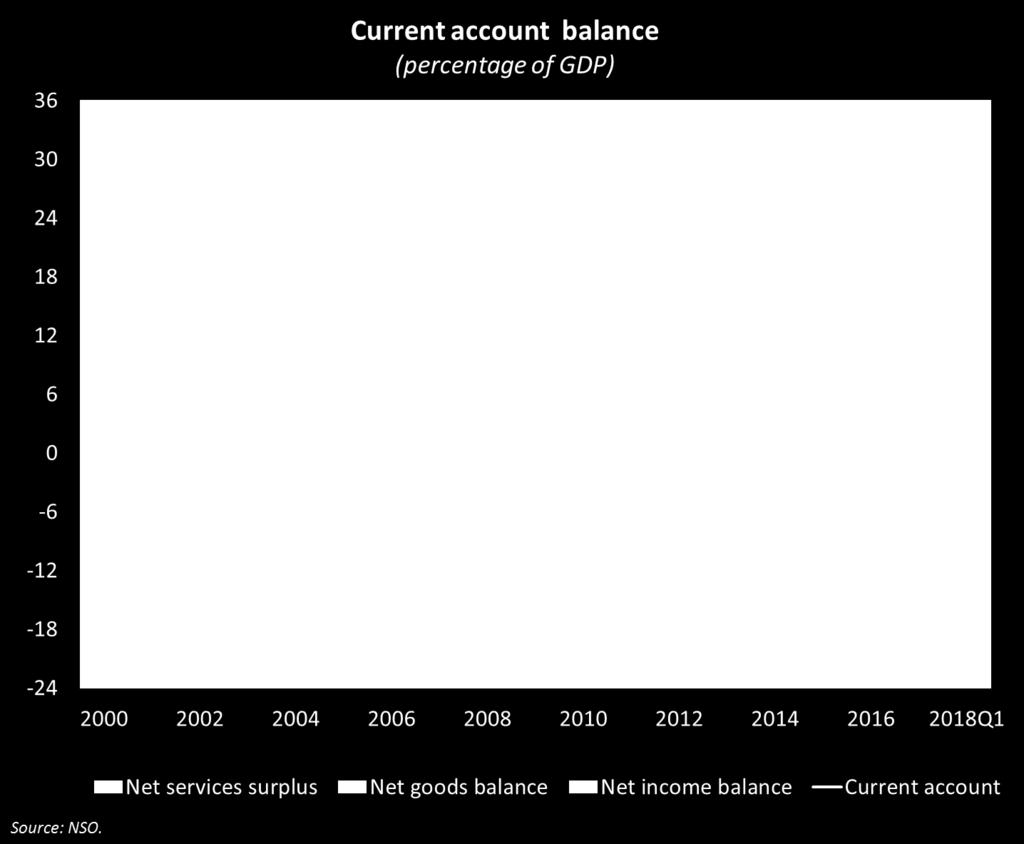
24 External developments - current account balance

25 External developments exchange rate
26 Lessons learned
27 Lessons learned The road to the euro benefited from clear target dates and a shared vision between the government and the monetary authorities. A long history of trade links with the euro area, a track record with a fixed exchange rate and a high degree of real economic convergence enabled a smooth transition. The single currency carries with it growth opportunities (integration in a larger market, transfer of capital and knowledge, enhanced surveillance, stronger institutions). However, economic performance is largely shaped by properly-paced and complementary reforms. Deeper external linkages increase interdependence, but can also be growth-enabling.
28 Lessons learned Income an price convergence in Malta progressed after euro adoption. Inflation and long-term interest rates developed in line with convergence criteria. The fiscal balance and the current account balance swung to a surplus. Wage growth has become somewhat more aligned with productivity growth. Sustaining the recent positive economic performance in the long-run requires: - wage awards that mirror more closely productivity developments - lending terms that are commensurate with those faced by NFCs with an equivalent level of risk in trading partners - fiscal measures that provide additional fiscal space ahead of the eventual normalisation of monetary policy and a possible decrease in IIP revenue.
29 THANK YOU
30 RESERVE SLIDE
31 External developments exchange rate
32 CBM official interest rate in the run up to euro adoption
STATISTICAL REFLECTIONS 3 September 2014
 66/14 STATISTICAL REFLECTIONS 3 September 14 Second-quarter 14 GDP increased by 3.9 Gross domestic product, second quarter 14, second estimation Contents Introduction...1 Production...1 Expenditure...
Economic Update 9/2016
 Economic Update 9/ Date of issue: 10 October Central Bank of Malta, Address Pjazza Kastilja Valletta VLT 1060 Malta Telephone (+356) 2550 0000 Fax (+356) 2550 2500 Website https://www.centralbankmalta.org
DEVELOPMENTS IN THE WHOLESALE AND RETAIL SECTOR
 DEVELOPMENTS IN THE WHOLESALE AND RETAIL SECTOR Article published in the Quarterly Review 219:1, pp. 22-31 BOX 1: DEVELOPMENTS IN THE WHOLESALE AND RETAIL SECTOR 1 The wholesale and retail sectors are
Chart 1 Development of real GDP by quarters (year-on-year growth in %)
") A T E C 1 14 12 1 8 4 2-2 -4 I -9-12 -15 8/29B volume 17, Development of the real economy in the first quarter of 29 Viera Kollárová, Helena Solčánska Národná banka Slovenska The indicators of Slovakia
A T E C 1 14 12 1 8 4 2-2 -4 I -9-12 -15 8/29B volume 17, Development of the real economy in the first quarter of 29 Viera Kollárová, Helena Solčánska Národná banka Slovenska The indicators of Slovakia
Social and Economic Development in Malta in the Context of the European Economic Landscape
 Social and Economic Development in Malta in the Context of the European Economic Landscape Economic Overview for the European Economic and Social Committee DR GORDON CORDINA MARCH 2017 Sustainable Economic
Nauru. Key Indicators for Asia and the Pacific Item
 Key Indicators for Asia and the Pacific 2018 1 POPULATION Total population a as of 1 July ( 000) 10.1 10.1 10.1 9.9 9.7 9.5 9.1 9.2 9.4 9.5 9.7 10.1 10.3 10.8 11.9 12.5 13.0 13.3 Population density (persons/km
INFLATION AND CONSUMER PRICE INDICES IN NOVEMBER
 INFLATION AND CONSUMER PRICE INDICES IN NOVEMBER 2012 Consumer price index (CPI) The consumer price index in November 2012 compared to October 2012 was 99.9%, i.e. the monthly inflation was -0.1%. The
INFLATION AND CONSUMER PRICE INDICES IN AUGUST 2013
 Consumer price index (CPI) INFLATION AND CONSUMER PRICE INDICES IN AUGUST 2013 The consumer price index in August 2013 compared to July 2013 was 99.4%, i.e. the monthly inflation was -0.6%. The inflation
INFLATION AND CONSUMER PRICE INDICES IN OCTOBER 2012
 Consumer price index (CPI) INFLATION AND CONSUMER PRICE INDICES IN OCTOBER 2012 The consumer price index in October 2012 compared to September 2012 was 100.3%, i.e. the monthly inflation was 0.3%. The
GROSS DOMESTIC PRODUCT FOR THE THIRD QUARTER OF 2012
 GROSS DOMESTIC PRODUCT FOR THE THIRD QUARTER OF 2012 In the third quarter of 2012 GDP at current prices amounted to 21 734 Million Levs. In Euro terms GDP was 11 112 Million Euro or 1 522 Euro per person.
Fiji. Key Indicators for Asia and the Pacific Item
 1 POPULATION Total population as of 1 July ( 000) 802.0 805.0 810.0 816.0 821.0 827.0 830.0 834.5 841.4 845.5 850.7 854.3 858.0 862.1 865.7 869.5 873.2 884.9 Population density (persons/km 2 ) 44 44 44
CPI annual rate of change was 2.0% in April
 Consumer Prices Index April 2017 11 May 2017 CPI annual rate of change was 2.0% in April The CPI annual rate moved from 1.4% in March to 2.0% in April 2017. The annual core inflation rate, which excludes
Solomon Islands. Key Indicators for Asia and the Pacific 2018
 1 POPULATION Total population a ( 000) 418.6 428.5 438.5 448.8 459.4 470.1 481.2 492.5 504.0 515.9 528.0 540.4 553.1 566.0 579.3 592.9 606.8 620.8 Population density (persons/km 2 ) 14 14 14 15 15 15 16
Viet Nam. Key Indicators for Asia and the Pacific Item
 Key Indicators for Asia and the Pacific 2018 1 POPULATION Total population as of 1 July (million) 77.11 78.12 79.08 80.00 80.95 81.91 82.85 84.22 85.12 86.03 86.93 87.84 88.81 89.76 90.73 91.71 92.69 93.67*
Hong Kong, China. Key Indicators for Asia and the Pacific 2018
 Key Indicators for Asia and the Pacific 2018 1 POPULATION a Total population as of 1 July (million) 6.7 6.7 6.7 6.7 6.8 6.8 6.9 6.9 7.0 7.0 7.0 7.1 7.2 7.2 7.2 7.3 7.3 7.4 Population density b (persons/km
GROSS DOMESTIC PRODUCT, SECOND QUARTER OF 2017 (PRELIMINARY DATA)
") GROSS DOMESTIC PRODUCT, SECOND QUARTER OF 2017 (PRELIMINARY DATA) In the second quarter of 2017 Gross Domestic Product (GDP) 1 at current prices amounts to 24 149 million BGN. In Euro terms GDP is 12 347
GROSS DOMESTIC PRODUCT, SECOND QUARTER OF 2017 (PRELIMINARY DATA) In the second quarter of 2017 Gross Domestic Product (GDP) 1 at current prices amounts to 24 149 million BGN. In Euro terms GDP is 12 347
Economic UpdatE JUnE 2016
 Economic Update June Date of issue: 30 June Central Bank of Malta, Address Pjazza Kastilja Valletta VLT 1060 Malta Telephone (+356) 2550 0000 Fax (+356) 2550 2500 Website https://www.centralbankmalta.org
INFLATION AND CONSUMER PRICE INDICES IN MARCH 2015
 Consumer price index (CPI) INFLATION AND CONSUMER PRICE INDICES IN MARCH 2015 The consumer price index in March 2015 compared to February 2015 was 100.4%, i.e. the monthly inflation was 0.4%. The inflation
INFLATION AND CONSUMER PRICE INDICES IN JULY 2014
 Consumer price index (CPI) INFLATION AND CONSUMER PRICE INDICES IN JULY 2014 The consumer price index in July 2014 compared to June 2014 was 100.4%, i.e. the monthly inflation was 0.4%. The inflation rate
Figure 1. Inflation measured by CPI by months
 INFLATION AND CONSUMER PRICE INDICES IN SEPTEMBER 2014 Consumer price index (CPI) The consumer price index in September 2014 compared to August 2014 was 99.8%, i.e. the monthly inflation was -0.2%. The
INFLATION AND CONSUMER PRICE INDICES IN SEPTEMBER
 INFLATION AND CONSUMER PRICE INDICES IN SEPTEMBER 2015 Consumer price index (CPI) The consumer price index in September 2015 compared to August 2015 was 99.9%, i.e. the monthly inflation was -0.1%. The
GROSS DOMESTIC PRODUCT FOR THE SECOND QUARTER OF 2012
 GROSS DOMESTIC PRODUCT FOR THE SECOND QUARTER OF 2012 In the second quarter of 2012 GDP at current prices amounted to 19 007 Million Levs. In Euro terms GDP was 9 718 Million Euro or 1 330 Euro per person.
GUATEMALA. 1. General trends
 Economic Survey of Latin America and the Caribbean 2014 1 GUATEMALA 1. General trends GDP grew by 3.7% in 2013 in real terms, versus 3.0% in 2012, reflecting the robustness of domestic demand, mainly from
GROSS DOMESTIC PRODUCT, FIRST QUARTER OF 2018 (PRELIMINARY DATA)
") GROSS DOMESTIC PRODUCT, FIRST QUARTER OF 2018 (PRELIMINARY DATA) In the first quarter of 2018 Gross Domestic Product (GDP) 1 at current prices amounts to 21 479 million BGN. In Euro terms GDP is 10 982
GROSS DOMESTIC PRODUCT, FIRST QUARTER OF 2018 (PRELIMINARY DATA) In the first quarter of 2018 Gross Domestic Product (GDP) 1 at current prices amounts to 21 479 million BGN. In Euro terms GDP is 10 982
INFLATION AND CONSUMER PRICE INDICES IN MARCH
 INFLATION AND CONSUMER PRICE INDICES IN MARCH 2014 Consumer price index (CPI) The consumer price index in March 2014 compared to February 2014 was 99.8%, i.e. the monthly inflation was -0.2%. The inflation
INFLATION AND CONSUMER PRICE INDICES IN APRIL 2014
 Consumer price index (CPI) INFLATION AND CONSUMER PRICE INDICES IN APRIL 2014 The consumer price index in April 2014 compared to March 2014 was 100.3%, i.e. the monthly inflation was 0.3%. The inflation
CURRENT ECONOMIC CONDITIONS
 Presentation to the FIA CURRENT ECONOMIC CONDITIONS 5 October 2017 Global economic outlook Has improved Global Economy Consolidating Healthy Growth Trajectory Global growth (%) Source: 2017 July IMF World
China, People s Republic of
 1 POPULATION Total population as of 31 December (million) 1,267.4 1,276.3 1,284.5 1,292.3 1,299.9 1,307.6 1,314.5 1,321.3 1,328.0 1,334.5 1,340.9 1,347.4 1,354.0 1,360.7 1,367.8 1,374.6 1,382.7 1,390.1
GROSS DOMESTIC PRODUCT FOR THE FOURTH QUARTER OF 2015 AND PRELIMINARY DATA FOR 2015
 GROSS DOMESTIC PRODUCT FOR THE FOURTH QUARTER OF 2015 AND PRELIMINARY DATA FOR 2015 In the fourth quarter of 2015 GDP at current prices amounted to 23 699 million BGN. In Euro terms GDP reaches 12 117
STATISTICAL TABLES. CENTRAL BANK OF MALTA Quarterly Review 2015:2
 STATISTICAL TABLES 85 The Maltese Islands - Key information, social and economic statistics (as at 28 August, unless otherwise indicated) CAPITAL CITY Valletta AREA 316 km 2 CURRENCY UNIT Euro exchange
INFLATION AND CONSUMER PRICE INDICES IN NOVEMBER 2011
 INFLATION AND CONSUMER PRICE INDICES IN NOVEMBER 2011 The consumer price index (CPI) in November 2011 compared to October 2011 was 100.3%, i.e. the monthly inflation was 0.3%. The inflation rate since
DOMINICAN REPUBLIC. 1. General trends
 Economic Survey of Latin America and the Caribbean 2015 1 DOMINICAN REPUBLIC 1. General trends The economy of the Dominican Republic grew by 7.3% in 2014, compared with 4.8% in 2013, driven by expanding
INFLATION AND CONSUMER PRICE INDICES IN SEPTEMBER 2016
 INFLATION AND CONSUMER PRICE INDICES IN SEPTEMBER 2016 Consumer price index (CPI) The consumer price index in September 2016 compared to August 2016 was 99.5%, i.e. the monthly inflation was -0.5%. The
INFLATION AND CONSUMER PRICE INDICES IN APRIL 2017
 INFLATION AND CONSUMER PRICE INDICES IN APRIL 2017 Consumer price index (CPI) The consumer price index in April 2017 compared to March 2017 was 100.7%, i.e. the monthly inflation was 0.7%. The inflation
INFLATION AND CONSUMER PRICE INDICES IN JULY 2016
 INFLATION AND CONSUMER PRICE INDICES IN JULY 2016 Consumer price index (CPI) The consumer price index in July 2016 compared to June 2016 was 101.0%, i.e. the monthly inflation was 1.0%. The inflation rate
Economic Projections for
 Economic Projections for 2015-2017 Article published in the Quarterly Review 2015:3, pp. 86-91 7. ECONOMIC PROJECTIONS FOR 2015-2017 Outlook for the Maltese economy 1 The Bank s latest macroeconomic projections
INFLATION AND CONSUMER PRICE INDICES IN MARCH 2017
 INFLATION AND CONSUMER PRICE INDICES IN MARCH 2017 Consumer price index (CPI) The consumer price index in March 2017 compared to February 2017 was 99.5%, i.e. the monthly inflation was -0.5%. The inflation
INFLATION AND CONSUMER PRICE INDICES IN AUGUST 2018
 INFLATION AND CONSUMER PRICE INDICES IN AUGUST 2018 Consumer price index (CPI) The consumer price index in August 2018 compared to July 2018 was 100.1%, i.e. the monthly inflation was 0.1%. The inflation
INFLATION AND CONSUMER PRICE INDICES IN MARCH 2018
 INFLATION AND CONSUMER PRICE INDICES IN MARCH 2018 Consumer price index (CPI) The consumer price index in March 2018 compared to February 2018 was 99.7%, i.e. the monthly inflation was -0.3%. The inflation
INFLATION AND CONSUMER PRICE INDICES IN JULY 2018
 INFLATION AND CONSUMER PRICE INDICES IN JULY 2018 Consumer price index (CPI) The consumer price index in July 2018 compared to June 2018 was 100.7%, i.e. the monthly inflation was 0.7%. The inflation rate
INFLATION AND CONSUMER PRICE INDICES IN AUGUST 2016
 INFLATION AND CONSUMER PRICE INDICES IN AUGUST 2016 Consumer price index (CPI) The consumer price index in August 2016 compared to July 2016 was 100.0%, i.e. the monthly inflation was 0.0%. The inflation
CPI annual rate of change increased to 1.5%
 Consumer Prices Index June 2018 11 July 2018 CPI annual rate of change increased to 1.5% The CPI annual rate moved from 1.0% in May to 1.5% in June 2018. The annual core inflation rate, which excludes
GROSS DOMESTIC PRODUCT, THIRD QUARTER OF 2018 (PRELIMINARY DATA)
") GROSS DOMESTIC PRODUCT, THIRD QUARTER OF 2018 (PRELIMINARY DATA) In the third quarter of 2018 Gross Domestic Product (GDP) 1 at current prices amounts to 29 822 million BGN. In Euro terms GDP is 15 248
GROSS DOMESTIC PRODUCT, THIRD QUARTER OF 2018 (PRELIMINARY DATA) In the third quarter of 2018 Gross Domestic Product (GDP) 1 at current prices amounts to 29 822 million BGN. In Euro terms GDP is 15 248
CPI annual rate of change increased to 1.5% in November
 Consumer Prices Index November 2017 14 December 2017 CPI annual rate of change increased to 1.5% in November The Consumer Price Index (CPI) annual rate was 1.5% in November 2017. The annual core inflation
CPI annual rate of change increased to 0.7%
 Consumer Prices Index March 2018 11 April 2018 CPI annual rate of change increased to 0.7% The CPI annual rate moved from 0.6% in February to 0.7% in March 2018. The annual core inflation rate, which excludes
INFLATION AND CONSUMER PRICE INDICES IN FEBRUARY 2018
 INFLATION AND CONSUMER PRICE INDICES IN FEBRUARY 2018 Consumer price index (CPI) The consumer price index in February 2018 compared to January 2018 was 100.3%, i.e. the monthly inflation was 0.3%. The
CPI annual rate of change increased to 1.4%
 Consumer Prices Index September 2018 11 October 2018 CPI annual rate of change increased to 1.4% The CPI annual rate moved from 1.2% in August to 1.4% in September 2018. The annual core inflation rate,
MONTHLY ECONOMIC INDICATORS
 MONTHLY ECONOMIC INDICATORS SEPTEMBER 0 Table of Contents 1. INFLATION... 2 2. MONEY, CREDIT AND INTEREST RATES... 6 3. REAL SECTOR INDICATORS... 9 4. BALANCE OF PAYMENTS AND EXTERNAL SECTOR INDICATORS...
INFLATION AND CONSUMER PRICE INDICES IN SEPTEMBER 2017
 INFLATION AND CONSUMER PRICE INDICES IN SEPTEMBER 2017 Consumer price index (CPI) The consumer price index in September 2017 compared to August 2017 was 100.2%, i.e. the monthly inflation was 0.2%. The
The CPI annual average rate of change was 0.3% in 2013 and the rate of change on a year earlier was 0.2% in December
 CONSUMER PRICES INDEX December 2013 13 January, 2014 The CPI annual average rate of change was 0.3% in 2013 and the rate of change on a year earlier was 0.2% in December The average rate of change of the
CPI annual rate of change was 0.7% in August
 CONSUMER PRICES INDEX August 2015 10 September, 2015 CPI annual rate of change was 0.7% in August The CPI annual rate was 0.7% in August 2015, 0.1 percentage points (p.p.) lower than in the previous month.
INFLATION AND CONSUMER PRICE INDICES IN JUNE 2011
 INFLATION AND CONSUMER PRICE INDICES IN JUNE 2011 The consumer price index (CPI) in June 2011 compared to May 2011 was 99.1%, i.e. the monthly inflation was -0.9%. The inflation rate since the beginning
GROSS DOMESTIC PRODUCT, FIRST QUARTER OF 2017 (PRELIMINARY DATA)
") GROSS DOMESTIC PRODUCT, FIRST QUARTER OF 2017 (PRELIMINARY DATA) In the first quarter of 2017 GDP at current prices amounts to 20 066 million BGN. In Euro terms GDP is 10 260 million Euro or 1 445 euro
GROSS DOMESTIC PRODUCT, FIRST QUARTER OF 2017 (PRELIMINARY DATA) In the first quarter of 2017 GDP at current prices amounts to 20 066 million BGN. In Euro terms GDP is 10 260 million Euro or 1 445 euro
INFLATION AND CONSUMER PRICE INDICES IN APRIL 2016
 INFLATION AND CONSUMER PRICE INDICES IN APRIL 2016 Consumer price index (CPI) The consumer price index in April 2016 compared to March 2016 was 100.0%, i.e. the monthly inflation was 0.0%. The inflation
Economic projections
 Economic projections 2017-2020 December 2017 Outlook for the Maltese economy Economic projections 2017-2020 The pace of economic activity in Malta has picked up in 2017. The Central Bank s latest economic
India. Key Indicators for Asia and the Pacific Item
 1 POPULATION a Total population as of 1 October (million) 1,019 1,040 1,056 1,072 1,089 1,106 1,122 1,138 1,154 1,170 1,186 1,220 1,235 1,251 1,267 1,283 1,299 1,316 Population density (persons/km 2 )
HONDURAS. 1. General trends
 Economic Survey of Latin America and the Caribbean 2016 1 HONDURAS 1. General trends Economic growth in Honduras picked up in 2015, reaching 3.6%, compared with 3.1% in 2014. This performance was mainly
INFLATION AND CONSUMER PRICE INDICES IN OCTOBER 2010
 INFLATION AND CONSUMER PRICE INDICES IN OCTOBER 2010 The consumer price index (CPI) in October 2010 compared to September 2010 was 100.6%, i.e. the monthly inflation was 0.6%. The inflation rate since
GROSS DOMESTIC PRODUCT FOR THE THIRD QUARTER OF 2013
 GROSS DOMESTIC PRODUCT FOR THE THIRD QUARTER OF 2013 In the third quarter of 2013 GDP at current prices amounts to 21 590 million BGN. In Euro terms GDP is 11 039 million euro or 1 519 euro per person.
The CPI annual average rate of change was -0.3% in 2014 and the rate of change on a year earlier was -0.4% in December
 CONSUMER PRICES INDEX December 2014 13 January, 2015 The CPI annual average rate of change was -0.3% in 2014 and the rate of change on a year earlier was -0.4% in December The average rate of change of
StatiStical tables Date of issue: 12 April 2016
 Statistical Tables Date of issue: 12 April 2016 Central Bank of Malta, 2016 Address Pjazza Kastilja Valletta VLT 1060 Malta Telephone (+356) 2550 0000 Fax (+356) 2550 2500 Website http://www.centralbankmalta.org
GROSS DOMESTIC PRODUCT FOR THE FOURTH QUARTER OF 2017 AND 2017 (PRELIMINARY DATA)
") GROSS DOMESTIC PRODUCT FOR THE FOURTH QUARTER OF 2017 AND 2017 (PRELIMINARY DATA) In the fourth quarter of 2017 GDP at current prices amounted to 27 427 million BGN. In Euro terms GDP reaches 14 023 million
GROSS DOMESTIC PRODUCT FOR THE FOURTH QUARTER OF 2017 AND 2017 (PRELIMINARY DATA) In the fourth quarter of 2017 GDP at current prices amounted to 27 427 million BGN. In Euro terms GDP reaches 14 023 million
StatiStical tables Date of issue: 13 April 2015
 Statistical Tables Date of issue: 13 April 2015 Central Bank of Malta, 2015 Address Pjazza Kastilja Valletta VLT 1060 Malta Telephone (+356) 2550 0000 Fax (+356) 2550 2500 Website http://www.centralbankmalta.org
CPI annual rate of change decreased to 0.4%
 Consumer Prices Index April 2018 11 May 2018 CPI annual rate of change decreased to 0.4% The CPI annual rate moved from 0.7% in March to 0.4% in April 2018. The annual core inflation rate, which excludes
GROSS DOMESTIC PRODUCT FOR THE FIRST QUARTER OF 2014 (PRELIMINARY DATA)
") GROSS DOMESTIC PRODUCT FOR THE FIRST QUARTER OF 2014 (PRELIMINARY DATA) In the first quarter of 2014 GDP at current prices amounts to 16 097 Million Levs. In Euro terms GDP is 8 230 Million Euro or 1 136
GROSS DOMESTIC PRODUCT FOR THE FIRST QUARTER OF 2014 (PRELIMINARY DATA) In the first quarter of 2014 GDP at current prices amounts to 16 097 Million Levs. In Euro terms GDP is 8 230 Million Euro or 1 136
INFLATION AND CONSUMER PRICE INDICES IN FEBRUARY 2016
 INFLATION AND CONSUMER PRICE INDICES IN FEBRUARY 2016 Consumer price index (CPI) The consumer price index in February 2016 compared to January 2016 was 99.7%, i.e. the monthly inflation was -0.3%. The
Table 1.3 : Demand side growth in GDP, growth contribution and relative share (figures in per cent at market prices) Growth of GDP
 Growth of GDP") Aggregate demand and its composition 1.17 The most important contribution to demand growth during the Tenth Five Year Plan period (2002-07) had come from investment, while the external trade made negligible
Aggregate demand and its composition 1.17 The most important contribution to demand growth during the Tenth Five Year Plan period (2002-07) had come from investment, while the external trade made negligible
GROSS DOMESTIC PRODUCT, THIRD QUARTER OF 2015 (PRELIMINARY DATA)
") GROSS DOMESTC PRODUCT, THRD QUARTER OF 2015 (PRELMNARY DATA) GDP at current prices is 23 490 million BGN in the third quarter of 2015. n Euro terms GDP is 12 010 million Euro or 1 671 euro per capita.
GROSS DOMESTC PRODUCT, THRD QUARTER OF 2015 (PRELMNARY DATA) GDP at current prices is 23 490 million BGN in the third quarter of 2015. n Euro terms GDP is 12 010 million Euro or 1 671 euro per capita.
GROSS DOMESTIC PRODUCT, SECOND QUARTER OF 2014 (PRELIMINARY DATA)
") GROSS DOMESTIC PRODUCT, SECOND QUARTER OF 2014 (PRELIMINARY DATA) In the second quarter of 2014 GDP at current prices amounts to 19 517 million BGN. In Euro terms GDP is 9 979 million Euro or 1 379 euro
GROSS DOMESTIC PRODUCT, SECOND QUARTER OF 2014 (PRELIMINARY DATA) In the second quarter of 2014 GDP at current prices amounts to 19 517 million BGN. In Euro terms GDP is 9 979 million Euro or 1 379 euro
COMMISSION OF THE EUROPEAN COMMUNITIES REPORT FROM THE COMMISSION CONVERGENCE REPORT 2006 ON LITHUANIA
 COMMISSION OF THE EUROPEAN COMMUNITIES Brussels, 16.5.2006 COM(2006) 223 final REPORT FROM THE COMMISSION CONVERGENCE REPORT 2006 ON LITHUANIA (prepared in accordance with Article 122(2) of the Treaty
INFLATION AND CONSUMER PRICE INDICES IN JULY 2015
 Consumer price index (CPI) INFLATION AND CONSUMER PRICE INDICES IN JULY 2015 The consumer price index in July 2015 compared to June 2015 was 99.8%, i.e. the monthly inflation was -0.2%. The inflation rate
Economic Projections :1
 Economic Projections 2017-2020 2018:1 Outlook for the Maltese economy Economic projections 2017-2020 The Central Bank s latest economic projections foresee economic growth over the coming three years to
Figure 1. Inflation measured by CPI by months
 INFLATION AND CONSUMER PRICE INDICES IN FEBRUARY 2015 Consumer price index (CPI) The consumer price index in February 2015 compared to January 2015 was 100.2%, i.e. the monthly inflation was 0.2%. The
National accounts and GDP
 National accounts and GDP Statistics Explained Data extracted in July 2018. Planned article update: July 2019. National accounts are the source for a multitude of well-known economic indicators which are
Colombia. 1. General trends. The Colombian economy grew by 2.5% in 2008, a lower rate than the sustained growth of
 Economic Survey of Latin America and the Caribbean 2008-2009 129 Colombia 1. General trends The Colombian economy grew by 2.5% in 2008, a lower rate than the sustained growth of recent years. Indicators
Czech Koruna and the Economic Outlook
 Czech Koruna and the Economic Outlook Vladimír Tomšík Vice-Governor Czech National Bank Austrian-Czech Economic Forum Czech National Bank Congress Centre Prague, 7 June 17 Outline 1. The CNB s exchange
NATIONAL ECONOMIC ACCOUNTS 2011 (Provisional Estimates)
") REPUBLIC OF CYPRUS NATIONAL ECONOMIC ACCOUNTS 2011 (Provisional Estimates) STATISTICAL SERVICE National Accounts Statistics Series II Report No. 28 Obtainable from the Printing Office of the Republic of
REPUBLIC OF CYPRUS NATIONAL ECONOMIC ACCOUNTS 2011 (Provisional Estimates) STATISTICAL SERVICE National Accounts Statistics Series II Report No. 28 Obtainable from the Printing Office of the Republic of
INFLATION AND CONSUMER PRICE INDICES IN APRIL 2018
 IV.2017 V.2017 VI.2017 VII.2017 VIII.2017 IX.2017 X.2017 XI.2017 XII.2017 I.2018 II.2018 III.2018 IV.2018 INFLATION AND CONSUMER PRICE INDICES IN APRIL 2018 Consumer price index (CPI) The consumer price
INFLATION AND CONSUMER PRICE INDICES IN MAY 2017
 INFLATION AND CONSUMER PRICE INDICES IN MAY 2017 Consumer price index (CPI) The consumer price index in May 2017 compared to April 2017 was 99.7%, i.e. the monthly inflation was -0.3%. The inflation rate
INFLATION AND CONSUMER PRICE INDICES IN AUGUST 2017
 INFLATION AND CONSUMER PRICE INDICES IN AUGUST 2017 Consumer price index (CPI) The consumer price index in August 2017 compared to July 2017 was 100.1%, i.e. the monthly inflation was 0.1%. The inflation
INFLATION AND CONSUMER PRICE INDICES IN JULY 2017
 INFLATION AND CONSUMER PRICE INDICES IN JULY 2017 Consumer price index (CPI) The consumer price index in July 2017 compared to June 2017 was 100.3%, i.e. the monthly inflation was 0.3%. The inflation rate
INFLATION AND CONSUMER PRICE INDICES IN DECEMBER 2017
 INFLATION AND CONSUMER PRICE INDICES IN DECEMBER 2017 Consumer price index (CPI) The consumer price index in December 2017 compared to November 2017 was 100.4%, i.e. the monthly inflation was 0.4%. The
QUARTERLY REVIEW 2018
 QUARTERLY REVIEW 218 Vol. 51 No. 2 Central Bank of Malta, 218 Address Pjazza Kastilja Valletta VLT 6 Malta Telephone (+356) 255 Fax (+356) 255 25 Website www.centralbankmalta.org E-mail info@centralbankmalta.org
QUARTERLY REVIEW 2017
 QUARTERLY REVIEW 2017 Vol. 50 No. 4 Central Bank of Malta, 2017 Address Pjazza Kastilja Valletta VLT 1060 Malta Telephone (+356) 2550 0000 Fax (+356) 2550 2500 Website www.centralbankmalta.org E-mail info@centralbankmalta.org
Ministry of Finance. Update of Sweden s convergence programme. November 2007
 Ministry of Finance Update of Sweden s convergence programme November 2007 2 U I Introduction 3 II Economic policy framework and targets 4 Structural reforms for long-term sustainability 4 Fiscal policy
CONTENTS COMMENTARY CHARTS TABLES GLOSSARY. Section 1: Headline Inflation Section 2: Core Inflation
 COMMENTARY CONTENTS Section 1: Headline Inflation Section 2: Core Inflation CHARTS 1. National Rates of Inflation, January 2010 April 2013 2. Monthly Changes in the Cost-of-Living Index, January 2010 April
The CPI annual average rate of change was 1.0% in 2018 and the rate of change on a year earlier was 0.7% in December
 Consumer Price Index December 2018 11 de January 2019 The CPI annual average rate of change was 1.0% in 2018 and the rate of change on a year earlier was 0.7% in December In 2018, the average rate of change
HOUSEHOLD EXPENDITURE IN MALTA AND THE RPI INFLATION BASKET
 HOUSEHOLD EXPENDITURE IN MALTA AND THE RPI INFLATION BASKET Article published in the Quarterly Review 2018:3, pp. 33-40 BOX 2: HOUSEHOLD EXPENDITURE IN MALTA AND THE RPI INFLATION BASKET 1 In early 2018,
2 Macroeconomic Scenario
 The macroeconomic scenario was conceived as realistic and conservative with an effort to balance out the positive and negative risks of economic development..1 The World Economy and Technical Assumptions
The CPI annual average rate of change was 1.4% in 2017 and the rate of change on a year earlier was 1.5% in December
 Consumer Prices Index December 2017 11 January 2018 The CPI annual average rate of change was 1.4% in 2017 and the rate of change on a year earlier was 1.5% in December The average rate of change of the
2016 Economic Outlook for Ireland & Eurozone IFP Launch
 2016 Economic Outlook for Ireland & Eurozone IFP Launch December 3 rd 2015 Jim Power Global Background US & UK growing at reasonable pace Euro Zone growing well below potential Emerging markets in some
The CPI annual average rate of change was 0.5% in 2015 and the rate of change on a year earlier was 0.4% in December
 Dec-11 Mar-12 Jun-12 Sep-12 Dec-12 Mar-13 Jun-13 Sep-13 Dec-13 Mar-14 Jun-14 Sep-14 Dec-14 Mar-15 Jun-15 Sep-15 Dec-15 Consumer Prices Index December 2015 January 13, 2016 The CPI annual average rate of
Federal Republic of Somalia Ministry of Planning, Investment and Economic Development Directorate of National Statistics CONSUMER PRICE INDEX
 Federal Republic of Somalia Ministry of Planning, Investment and Economic Development Directorate of National Statistics CONSUMER PRICE INDEX October 2018 Executive Summary The All Groups CPI was 111.62
The Brussels Economic Forum
 The Brussels Economic Forum What kind of policies should the new Member States apply to optimise their speed of convergence? Banco de Portugal VÍTOR CONSTÂNCIO Brussels, 23d of April 24 I. INTRODUCTION
The Framework of Monetary Policy in Malta
 MPRA Munich Personal RePEc Archive The Framework of Monetary Policy in Malta Aaron George Grech Central Bank of Malta July 2003 Online at https://mpra.ub.uni-muenchen.de/33464/ MPRA Paper No. 33464, posted
NATIONAL ACCOUNTS STATISTICS Highlights
 Per Capita Income (in Rs.) NATIONAL ACCOUNTS STATISTICS 218 Highlights 1. The Gross Domestic Product at constant (211-12) prices for the year 217-18 is estimated at ` 13.1 lakh crore, as against the estimate
Economic ProjEctions for
 Economic Projections for 2016-2018 ECONOMIC PROJECTIONS FOR 2016-2018 Outlook for the Maltese economy 1 Economic growth is expected to ease Following three years of strong expansion, the Bank s latest
Outline of presentation. National Accounts Office September 2016 Chiba, Japan
 25-27 September 2016 Chiba, Japan National Accounts Office Office of the National Economic and Social Development Board (NESDB) Outline of presentation Short Term Indicator Quarterly Gross Domestic Product
Market Report for Republic of Korea
 Market Report for Republic of Korea November 2014 Korea Financial Investment Association 1 I. Economic and Financial Background 1. General Economic Development Although economic recovery has continued
SACU INFLATION REPORT. April 2018
 SACU INFLATION REPORT April 2018 The content of this publication is intended for general information only. While precaution is taken to ensure the accuracy of information, the SACU Secretariat shall not