Chapter 15: Graphs, Charts, and Numbers Math 107
|
|
|
- Joanna McCoy
- 5 years ago
- Views:
Transcription

1 Chapter 15: Graphs, Charts, and Numbers Math 107 Data Set & Data Point: Discrete v. Continuous: Frequency Table: Ex 1) Exam Scores


2 Pictogram: Misleading Graphs: In reality, the data looks like this 45% 40% 35% 30% 25% 20% 15% 10% 5% 0% If Bush Tax Cuts Expire 39.60% 35% Now Jan 12013


3 CNN showed this graph of people who agreed with the court s decision to turn off Terri Schiavo s Life Support People who disagreed with the Court 70% 60% 50% 40% 30% 20% 10% 0% 62% Democrats 54% 54% Republicans Independents The Dow Jones Industrial Average for the last year. It looks as though the drop from the middle of July to the middle of August went down by 3/4ths! (75%!) Using the rounded values of 18,000 and 15,600, what percentage did it actually drop?

4 Let s investigate this a little, at this time the number of people who owned the following systems was: Wii: 50 million 360: 30 million PS3: 20 million Quantitative vs. Qualitative:
 a poll where everyone gets one choice.")
5 Pie Charts work well when you re looking at portions of a whole. How many hours a day spent doing X, or how much of your money is spent on different categories, or (as below) a poll where everyone gets one choice. When creating a pie chart, we need to think about the percentage of the whole that each category represents, and then each category gets that percentage of the total 360. Ex 2 (LC) The following pie chart represents the favorites sports of students who were polled. a) How many students were polled? b) Complete the chart to calculate the the percentage and degrees that each category receives in the pie chart. Sport Total: 146. % (out of 146 ) Number of Baseball = % 360 Basketball = % 360 Tennis = % 360 Swimming = % 360 Soccer = % 360 (LC) Football = % 360 (LC)


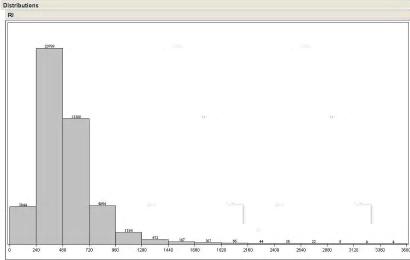
6 Class Intervals are when the data is put into groups or Ranges. The following SAT scores from 2011 are all scored in increments of 10. Histograms are more effective with continuous data. In other words, whether you make $44,999 a year or $45,001 isn t really that different, so the bars are connected to represent closeness of the endpoints of the regions of data.
 http://www.ems1.")
7 Histograms in the News Response interval histograms for EMS calls (Dec 2010) 60-second intervals 240-second Intervals (4 minutes) 480-second intervals (8 minutes)
 How many firefighters are there?")
8 Average (Mean): So the average of the data set d1, d2, d3,... d N is Ex 3 (LC) d + d + d + + d A= N 1 2 3,... N a) How many firefighters are there? b) To calculate the Mean, what is the total sum of the ages of just the first row? Ex 4)
9 Percentiles: The p th percentile of a data set is a number XP such that p% of the data is smaller or equal to XP and (100-p)% of the data is bigger or equal to XP. In order to calculate this, our data must be arranged from smallest to largest and we need to find the locator which separates the data into p% and (100-p)%. Ex 5) (LC)


10 Median: Quartiles: Ex 6) (LC) (LC) Warning: Not everyone agrees on the procedure for finding percentiles and quartiles, so your calculator or other program might do it slightly differently than the procedure described in this book.
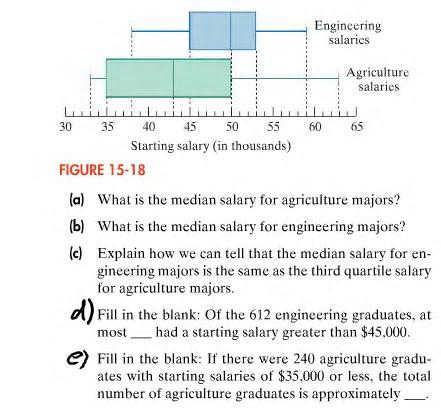
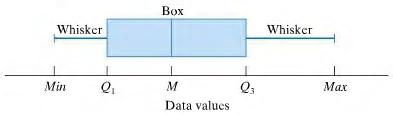
11 Five-number Summary: Box Plots: Ex 7) (LC)
 the data of a set is from the average of the data. Ex 9) Find the standard deviation of {0,6,6,8}.")
12 Range: Interquartile Range: Ex 8) (LC) Looking at the Engineering Salaries from the previous example, find a) Range b) Interquartile Range Standard Deviation is basically a measure of how far away (deviation) the data of a set is from the average of the data. Ex 9) Find the standard deviation of {0,6,6,8}. Ex 10) (LC)
1. In a statistics class with 136 students, the professor records how much money each
 so shows the data collected. student has in his or her possession during the first class of the semester. The histogram 1. In a statistics class with 136 students, the professor records how much money
STAT Chapter 6 The Standard Deviation (SD) as a Ruler and The Normal Model
 as a Ruler and The Normal Model") STAT 203 - Chapter 6 The Standard Deviation (SD) as a Ruler and The Normal Model In Chapter 5, we introduced a few measures of center and spread, and discussed how the mean and standard deviation are good
STAT 203 - Chapter 6 The Standard Deviation (SD) as a Ruler and The Normal Model In Chapter 5, we introduced a few measures of center and spread, and discussed how the mean and standard deviation are good
Review Problems for MAT141 Final Exam
 Review Problems for MAT141 Final Exam The following problems will help you prepare for the final exam. Answers to all problems are at the end of the review packet. 1. Find the area and perimeter of the
Math Take Home Quiz on Chapter 2
 Math 116 - Take Home Quiz on Chapter 2 Show the calculations that lead to the answer. Due date: Tuesday June 6th Name Time your class meets Provide an appropriate response. 1) A newspaper surveyed its
Exam 1 Review. 1) Identify the population being studied. The heights of 14 out of the 31 cucumber plants at Mr. Lonardo's greenhouse.
 Identify the population being studied. The heights of 14 out of the 31 cucumber plants at Mr. Lonardo's greenhouse.") Exam 1 Review 1) Identify the population being studied. The heights of 14 out of the 31 cucumber plants at Mr. Lonardo's greenhouse. 2) Identify the population being studied and the sample chosen. The
Exam 1 Review 1) Identify the population being studied. The heights of 14 out of the 31 cucumber plants at Mr. Lonardo's greenhouse. 2) Identify the population being studied and the sample chosen. The
Describing Data: One Quantitative Variable
 STAT 250 Dr. Kari Lock Morgan The Big Picture Describing Data: One Quantitative Variable Population Sampling SECTIONS 2.2, 2.3 One quantitative variable (2.2, 2.3) Statistical Inference Sample Descriptive
POLI 300 PROBLEM SET #7 due 11/08/10 MEASURES OF DISPERSION AND THE NORMAL DISTRIBUTION
 POLI 300 PROBLEM SET #7 due 11/08/10 MEASURES OF DISPERSION AND THE NORMAL DISTRIBUTION NAME Put all your answers directly on these pages 1. Refer to the continuous frequency density provided with Problem
Math 2311 Bekki George Office Hours: MW 11am to 12:45pm in 639 PGH Online Thursdays 4-5:30pm And by appointment
 Math 2311 Bekki George bekki@math.uh.edu Office Hours: MW 11am to 12:45pm in 639 PGH Online Thursdays 4-5:30pm And by appointment Class webpage: http://www.math.uh.edu/~bekki/math2311.html Math 2311 Class
Applications of Data Dispersions
 1 Applications of Data Dispersions Key Definitions Standard Deviation: The standard deviation shows how far away each value is from the mean on average. Z-Scores: The distance between the mean and a given
Stat 101 Exam 1 - Embers Important Formulas and Concepts 1
 1 Chapter 1 1.1 Definitions Stat 101 Exam 1 - Embers Important Formulas and Concepts 1 1. Data Any collection of numbers, characters, images, or other items that provide information about something. 2.
Quantitative Literacy: Thinking Between the Lines
 Quantitative Literacy: Thinking Between the Lines Crauder, Noell, Evans, Johnson Chapter 2: Analysis of Growth 2013 W. H. Freeman and Company 1 Chapter 2: Analysis of Growth Lesson Plan Measurements of
STAB22 section 1.3 and Chapter 1 exercises
 STAB22 section 1.3 and Chapter 1 exercises 1.101 Go up and down two times the standard deviation from the mean. So 95% of scores will be between 572 (2)(51) = 470 and 572 + (2)(51) = 674. 1.102 Same idea
appstats5.notebook September 07, 2016 Chapter 5
 Chapter 5 Describing Distributions Numerically Chapter 5 Objective: Students will be able to use statistics appropriate to the shape of the data distribution to compare of two or more different data sets.
FINALS REVIEW BELL RINGER. Simplify the following expressions without using your calculator. 1) 6 2/3 + 1/2 2) 2 * 3(1/2 3/5) 3) 5/ /2 4
 6 2/3 + 1/2 2) 2 * 3(1/2 3/5) 3) 5/ /2 4") FINALS REVIEW BELL RINGER Simplify the following expressions without using your calculator. 1) 6 2/3 + 1/2 2) 2 * 3(1/2 3/5) 3) 5/3 + 7 + 1/2 4 4) 3 + 4 ( 7) + 3 + 4 ( 2) 1) 36/6 4/6 + 3/6 32/6 + 3/6 35/6
FINALS REVIEW BELL RINGER Simplify the following expressions without using your calculator. 1) 6 2/3 + 1/2 2) 2 * 3(1/2 3/5) 3) 5/3 + 7 + 1/2 4 4) 3 + 4 ( 7) + 3 + 4 ( 2) 1) 36/6 4/6 + 3/6 32/6 + 3/6 35/6
UNIVERSITY OF CAMBRIDGE INTERNATIONAL EXAMINATIONS General Certificate of Education Ordinary Level STATISTICS 4040/01
 UNIVERSITY OF CAMBRIDGE INTERNATIONAL EXAMINATIONS General Certificate of Education Ordinary Level STATISTICS 4040/01 Paper 1 Additional Materials: Answer Booklet/Paper Graph paper (2 sheets) Mathematical
Description of Data I
 Description of Data I (Summary and Variability measures) Objectives: Able to understand how to summarize the data Able to understand how to measure the variability of the data Able to use and interpret
KING FAHD UNIVERSITY OF PETROLEUM & MINERALS DEPARTMENT OF MATHEMATICAL SCIENCES DHAHRAN, SAUDI ARABIA. Name: ID# Section
 KING FAHD UNIVERSITY OF PETROLEUM & MINERALS DEPARTMENT OF MATHEMATICAL SCIENCES DHAHRAN, SAUDI ARABIA STAT 11: BUSINESS STATISTICS I Semester 04 Major Exam #1 Sunday March 7, 005 Please circle your instructor
Both the quizzes and exams are closed book. However, For quizzes: Formulas will be provided with quiz papers if there is any need.
 Both the quizzes and exams are closed book. However, For quizzes: Formulas will be provided with quiz papers if there is any need. For exams (MD1, MD2, and Final): You may bring one 8.5 by 11 sheet of
Chapter 3. Numerical Descriptive Measures. Copyright 2016 Pearson Education, Ltd. Chapter 3, Slide 1
 Chapter 3 Numerical Descriptive Measures Copyright 2016 Pearson Education, Ltd. Chapter 3, Slide 1 Objectives In this chapter, you learn to: Describe the properties of central tendency, variation, and
Numerical Descriptions of Data
 Numerical Descriptions of Data Measures of Center Mean x = x i n Excel: = average ( ) Weighted mean x = (x i w i ) w i x = data values x i = i th data value w i = weight of the i th data value Median =
2 Exploring Univariate Data
 2 Exploring Univariate Data A good picture is worth more than a thousand words! Having the data collected we examine them to get a feel for they main messages and any surprising features, before attempting
Chapter 3 Descriptive Statistics: Numerical Measures Part A
 Slides Prepared by JOHN S. LOUCKS St. Edward s University Slide 1 Chapter 3 Descriptive Statistics: Numerical Measures Part A Measures of Location Measures of Variability Slide Measures of Location Mean
NOTES: Chapter 4 Describing Data
 NOTES: Chapter 4 Describing Data Intro to Statistics COLYER Spring 2017 Student Name: Page 2 Section 4.1 ~ What is Average? Objective: In this section you will understand the difference between the three
STATISTICAL DISTRIBUTIONS AND THE CALCULATOR
 STATISTICAL DISTRIBUTIONS AND THE CALCULATOR 1. Basic data sets a. Measures of Center - Mean ( ): average of all values. Characteristic: non-resistant is affected by skew and outliers. - Median: Either
DATA HANDLING Five-Number Summary
 DATA HANDLING Five-Number Summary The five-number summary consists of the minimum and maximum values, the median, and the upper and lower quartiles. The minimum and the maximum are the smallest and greatest
Dot Plot: A graph for displaying a set of data. Each numerical value is represented by a dot placed above a horizontal number line.
 Introduction We continue our study of descriptive statistics with measures of dispersion, such as dot plots, stem and leaf displays, quartiles, percentiles, and box plots. Dot plots, a stem-and-leaf display,
Edexcel past paper questions
 Edexcel past paper questions Statistics 1 Chapters 2-4 (Continuous) S1 Chapters 2-4 Page 1 S1 Chapters 2-4 Page 2 S1 Chapters 2-4 Page 3 S1 Chapters 2-4 Page 4 Histograms When you are asked to draw a histogram
Diploma in Financial Management with Public Finance
 Diploma in Financial Management with Public Finance Cohort: DFM/09/FT Jan Intake Examinations for 2009 Semester II MODULE: STATISTICS FOR FINANCE MODULE CODE: QUAN 1103 Duration: 2 Hours Reading time:
22.2 Shape, Center, and Spread
 Name Class Date 22.2 Shape, Center, and Spread Essential Question: Which measures of center and spread are appropriate for a normal distribution, and which are appropriate for a skewed distribution? Eplore
Handout 4 numerical descriptive measures part 2. Example 1. Variance and Standard Deviation for Grouped Data. mf N 535 = = 25
 Handout 4 numerical descriptive measures part Calculating Mean for Grouped Data mf Mean for population data: µ mf Mean for sample data: x n where m is the midpoint and f is the frequency of a class. Example
STOR 155 Practice Midterm 1 Fall 2009
 STOR 155 Practice Midterm 1 Fall 2009 INSTRUCTIONS: BOTH THE EXAM AND THE BUBBLE SHEET WILL BE COLLECTED. YOU MUST PRINT YOUR NAME AND SIGN THE HONOR PLEDGE ON THE BUBBLE SHEET. YOU MUST BUBBLE-IN YOUR
FORMULA FOR STANDARD DEVIATION:
 Chapter 5 Review: Statistics Textbook p.210-282 Summary: p.238-239, p.278-279 Practice Questions p.240, p.280-282 Z- Score Table p.592 Key Concepts: Central Tendency, Standard Deviation, Graphing, Normal
Lecture 2 Describing Data
 Lecture 2 Describing Data Thais Paiva STA 111 - Summer 2013 Term II July 2, 2013 Lecture Plan 1 Types of data 2 Describing the data with plots 3 Summary statistics for central tendency and spread 4 Histograms
Descriptive Statistics (Devore Chapter One)
") Descriptive Statistics (Devore Chapter One) 1016-345-01 Probability and Statistics for Engineers Winter 2010-2011 Contents 0 Perspective 1 1 Pictorial and Tabular Descriptions of Data 2 1.1 Stem-and-Leaf
Descriptive Statistics (Devore Chapter One) 1016-345-01 Probability and Statistics for Engineers Winter 2010-2011 Contents 0 Perspective 1 1 Pictorial and Tabular Descriptions of Data 2 1.1 Stem-and-Leaf
Math 227 Elementary Statistics. Bluman 5 th edition
 Math 227 Elementary Statistics Bluman 5 th edition CHAPTER 6 The Normal Distribution 2 Objectives Identify distributions as symmetrical or skewed. Identify the properties of the normal distribution. Find
Exploratory Data Analysis
 Exploratory Data Analysis Stemplots (or Stem-and-leaf plots) Stemplot and Boxplot T -- leading digits are called stems T -- final digits are called leaves STAT 74 Descriptive Statistics 2 Example: (number
8.2 The Standard Deviation as a Ruler Chapter 8 The Normal and Other Continuous Distributions 8-1
 8.2 The Standard Deviation as a Ruler Chapter 8 The Normal and Other Continuous Distributions For Example: On August 8, 2011, the Dow dropped 634.8 points, sending shock waves through the financial community.
Summarising Data. Summarising Data. Examples of Types of Data. Types of Data
 Summarising Data Summarising Data Mark Lunt Arthritis Research UK Epidemiology Unit University of Manchester Today we will consider Different types of data Appropriate ways to summarise these data 17/10/2017
1 Describing Distributions with numbers
 1 Describing Distributions with numbers Only for quantitative variables!! 1.1 Describing the center of a data set The mean of a set of numerical observation is the familiar arithmetic average. To write
Percentiles One way to look at quartile points is to say that, for a sorted list of values, Q 1 is the value that has 25% of the rest of the values
 Percentiles One way to look at quartile points is to say that, for a sorted list of values, Q 1 is the value that has 25% of the rest of the values that are less than it, Q 2 is the value that has 50%
CHAPTER 2 Describing Data: Numerical
 CHAPTER Multiple-Choice Questions 1. A scatter plot can illustrate all of the following except: A) the median of each of the two variables B) the range of each of the two variables C) an indication of
Edexcel past paper questions
 Edexcel past paper questions Statistics 1 Chapters 2-4 (Discrete) Statistics 1 Chapters 2-4 (Discrete) Page 1 Stem and leaf diagram Stem-and-leaf diagrams are used to represent data in its original form.
PSYCHOLOGICAL STATISTICS
 UNIVERSITY OF CALICUT SCHOOL OF DISTANCE EDUCATION B Sc COUNSELLING PSYCHOLOGY (2011 Admission Onwards) II Semester Complementary Course PSYCHOLOGICAL STATISTICS QUESTION BANK 1. The process of grouping
2 2 In general, to find the median value of distribution, if there are n terms in the distribution the
 THE MEDIAN TEMPERATURES MEDIAN AND CUMULATIVE FREQUENCY The median is the third type of statistical average you will use in his course. You met the other two, the mean and the mode in pack MS4. THE MEDIAN
Chapter 5 The Standard Deviation as a Ruler and the Normal Model
 Chapter 5 The Standard Deviation as a Ruler and the Normal Model 55 Chapter 5 The Standard Deviation as a Ruler and the Normal Model 1. Stats test. Nicole scored 65 points on the test. That is one standard
Lesson 12: Describing Distributions: Shape, Center, and Spread
 : Shape, Center, and Spread Opening Exercise Distributions - Data are often summarized by graphs. We often refer to the group of data presented in the graph as a distribution. Below are examples of the
AP Statistics Unit 1 (Chapters 1-6) Extra Practice: Part 1
 Extra Practice: Part 1") AP Statistics Unit 1 (Chapters 1-6) Extra Practice: Part 1 1. As part of survey of college students a researcher is interested in the variable class standing. She records a 1 if the student is a freshman,
AP Statistics Unit 1 (Chapters 1-6) Extra Practice: Part 1 1. As part of survey of college students a researcher is interested in the variable class standing. She records a 1 if the student is a freshman,
The Mathematics of Normality
 MATH 110 Week 9 Chapter 17 Worksheet The Mathematics of Normality NAME Normal (bell-shaped) distributions play an important role in the world of statistics. One reason the normal distribution is important
STATISTICS 4040/23 Paper 2 October/November 2014
 Cambridge International Examinations Cambridge Ordinary Level *9099999814* STATISTICS 4040/23 Paper 2 October/November 2014 Candidates answer on the question paper. Additional Materials: Pair of compasses
Please show work for all calculated answers. Show work in a neat and organized manner.
 Math 083 Review for Exam 1 Name Please show work for all calculated answers. Show work in a neat and organized manner. 1) Using the frequency table for a monthly budget, find all of the relative frequencies
Link full download:
 - Descriptive Statistics: Tabular and Graphical Method Chapter 02 Essentials of Business Statistics 5th Edition by Bruce L Bowerman Professor, Richard T O Connell Professor, Emily S. Murphree and J. Burdeane
Categorical. A general name for non-numerical data; the data is separated into categories of some kind.
 Chapter 5 Categorical A general name for non-numerical data; the data is separated into categories of some kind. Nominal data Categorical data with no implied order. Eg. Eye colours, favourite TV show,
1. State whether the following groups are populations or samples. You are encouraged to justify your answers.
 MATH 2210 Exam 1 Review Solution Note: This review is NOT comprehensive, so do not limit your study to it. 1. State whether the following groups are populations or samples. You are encouraged to justify
Example - Let X be the number of boys in a 4 child family. Find the probability distribution table:
 Chapter7 Probability Distributions and Statistics Distributions of Random Variables tthe value of the result of the probability experiment is a RANDOM VARIABLE. Example - Let X be the number of boys in
Chapter 3. Lecture 3 Sections
 Chapter 3 Lecture 3 Sections 3.4 3.5 Measure of Position We would like to compare values from different data sets. We will introduce a z score or standard score. This measures how many standard deviation
UNIVERSITY OF TORONTO SCARBOROUGH Department of Computer and Mathematical Sciences. STAB22H3 Statistics I Duration: 1 hour and 45 minutes
 UNIVERSITY OF TORONTO SCARBOROUGH Department of Computer and Mathematical Sciences STAB22H3 Statistics I Duration: 1 hour and 45 minutes Last Name: First Name: Student number: Aids allowed: - One handwritten
Keystone Practice Questions #1
 Name Period Keystone Practice Questions #1 Directions: Fill in the blank with the letter of the best answer. 1. What is the slope of the line that passes through the points (, ) and (5, 1)? (A) (B) (C)
Instructor: A.E.Cary. Math 243 Final Exam
 Name: Instructor: A.E.Cary Instructions: Show all your work in a manner consistent with that demonstrated in class. Round your answers where appropriate. Use 3 decimal places when rounding answers. The
A LEVEL MATHEMATICS ANSWERS AND MARKSCHEMES SUMMARY STATISTICS AND DIAGRAMS. 1. a) 45 B1 [1] b) 7 th value 37 M1 A1 [2]
![A LEVEL MATHEMATICS ANSWERS AND MARKSCHEMES SUMMARY STATISTICS AND DIAGRAMS. 1. a) 45 B1 [1] b) 7 th value 37 M1 A1 [2]](/thumbs/81/83043398.jpg "A LEVEL MATHEMATICS ANSWERS AND MARKSCHEMES SUMMARY STATISTICS AND DIAGRAMS. 1. a) 45 B1 [1] b) 7 th value 37 M1 A1 [2]") 1. a) 45 [1] b) 7 th value 37 [] n c) LQ : 4 = 3.5 4 th value so LQ = 5 3 n UQ : 4 = 9.75 10 th value so UQ = 45 IQR = 0 f.t. d) Median is closer to upper quartile Hence negative skew [] Page 1 . a) Orders
1. a) 45 [1] b) 7 th value 37 [] n c) LQ : 4 = 3.5 4 th value so LQ = 5 3 n UQ : 4 = 9.75 10 th value so UQ = 45 IQR = 0 f.t. d) Median is closer to upper quartile Hence negative skew [] Page 1 . a) Orders
Introduction to Descriptive Statistics
 Introduction to Descriptive Statistics 17.871 Types of Variables ~Nominal (Quantitative) Nominal (Qualitative) categorical Ordinal Interval or ratio Describing data Moment Non-mean based measure Center
Overview/Outline. Moving beyond raw data. PSY 464 Advanced Experimental Design. Describing and Exploring Data The Normal Distribution
 PSY 464 Advanced Experimental Design Describing and Exploring Data The Normal Distribution 1 Overview/Outline Questions-problems? Exploring/Describing data Organizing/summarizing data Graphical presentations
Variance, Standard Deviation Counting Techniques
 Variance, Standard Deviation Counting Techniques Section 1.3 & 2.1 Cathy Poliak, Ph.D. cathy@math.uh.edu Department of Mathematics University of Houston 1 / 52 Outline 1 Quartiles 2 The 1.5IQR Rule 3 Understanding
CHAPTER 6. ' From the table the z value corresponding to this value Z = 1.96 or Z = 1.96 (d) P(Z >?) =
 P(Z >?) =") Solutions to End-of-Section and Chapter Review Problems 225 CHAPTER 6 6.1 (a) P(Z < 1.20) = 0.88493 P(Z > 1.25) = 1 0.89435 = 0.10565 P(1.25 < Z < 1.70) = 0.95543 0.89435 = 0.06108 (d) P(Z < 1.25) or Z
Solutions to End-of-Section and Chapter Review Problems 225 CHAPTER 6 6.1 (a) P(Z < 1.20) = 0.88493 P(Z > 1.25) = 1 0.89435 = 0.10565 P(1.25 < Z < 1.70) = 0.95543 0.89435 = 0.06108 (d) P(Z < 1.25) or Z
MgtOp 215 TEST 1 (Golden) Spring 2016 Dr. Ahn. Read the following instructions very carefully before you start the test.
 Spring 2016 Dr. Ahn. Read the following instructions very carefully before you start the test.") MgtOp 15 TEST 1 (Golden) Spring 016 Dr. Ahn Name: ID: Section (Circle one): 4, 5, 6 Read the following instructions very carefully before you start the test. This test is closed book and notes; one summary
MgtOp 15 TEST 1 (Golden) Spring 016 Dr. Ahn Name: ID: Section (Circle one): 4, 5, 6 Read the following instructions very carefully before you start the test. This test is closed book and notes; one summary
DATA SUMMARIZATION AND VISUALIZATION
 APPENDIX DATA SUMMARIZATION AND VISUALIZATION PART 1 SUMMARIZATION 1: BUILDING BLOCKS OF DATA ANALYSIS 294 PART 2 PART 3 PART 4 VISUALIZATION: GRAPHS AND TABLES FOR SUMMARIZING AND ORGANIZING DATA 296
NOTES TO CONSIDER BEFORE ATTEMPTING EX 2C BOX PLOTS
 NOTES TO CONSIDER BEFORE ATTEMPTING EX 2C BOX PLOTS A box plot is a pictorial representation of the data and can be used to get a good idea and a clear picture about the distribution of the data. It shows
Some estimates of the height of the podium
 Some estimates of the height of the podium 24 36 40 40 40 41 42 44 46 48 50 53 65 98 1 5 number summary Inter quartile range (IQR) range = max min 2 1.5 IQR outlier rule 3 make a boxplot 24 36 40 40 40
3.1 Measures of Central Tendency
 3.1 Measures of Central Tendency n Summation Notation x i or x Sum observation on the variable that appears to the right of the summation symbol. Example 1 Suppose the variable x i is used to represent
Exotic Tea Prices. Year
 Price, cents per pound UNDERSTANDING HOW TO READ GRAPHS Information is often presented in the form of a graph, a diagram that shows numerical data in a visual form. Graphs enable us to see relationships
STAT 113 Variability
 STAT 113 Variability Colin Reimer Dawson Oberlin College September 14, 2017 1 / 48 Outline Last Time: Shape and Center Variability Boxplots and the IQR Variance and Standard Deviaton Transformations 2
HIGHER SECONDARY I ST YEAR STATISTICS MODEL QUESTION PAPER
 HIGHER SECONDARY I ST YEAR STATISTICS MODEL QUESTION PAPER Time - 2½ Hrs Max. Marks - 70 PART - I 15 x 1 = 15 Answer all the Questions I. Choose the Best Answer 1. Statistics may be called the Science
3.5 Applying the Normal Distribution (Z-Scores)
") 3.5 Applying the Normal Distribution (Z-Scores) The Graph: Review of the Normal Distribution Properties: - it is symmetrical; the mean, median and mode are equal and fall at the line of symmetry - it is
3.5 Applying the Normal Distribution (Z-Scores) The Graph: Review of the Normal Distribution Properties: - it is symmetrical; the mean, median and mode are equal and fall at the line of symmetry - it is
Math 2200 Fall 2014, Exam 1 You may use any calculator. You may not use any cheat sheet.
 1 Math 2200 Fall 2014, Exam 1 You may use any calculator. You may not use any cheat sheet. Warning to the Reader! If you are a student for whom this document is a historical artifact, be aware that the
Descriptive Statistics
 Petra Petrovics Descriptive Statistics 2 nd seminar DESCRIPTIVE STATISTICS Definition: Descriptive statistics is concerned only with collecting and describing data Methods: - statistical tables and graphs
Solution Manual for Essentials of Business Statistics 5th Edition by Bowerman
 Link full donwload: https://testbankservice.com/download/solutionmanual-for-essentials-of-business-statistics-5th-edition-by-bowerman Solution Manual for Essentials of Business Statistics 5th Edition by
Fall 2011 Exam Score: /75. Exam 3
 Math 12 Fall 2011 Name Exam Score: /75 Total Class Percent to Date Exam 3 For problems 1-10, circle the letter next to the response that best answers the question or completes the sentence. You do not
The Central Limit Theorem: Homework
 The Central Limit Theorem: Homework EXERCISE 1 X N(60, 9). Suppose that you form random samples of 25 from this distribution. Let X be the random variable of averages. Let X be the random variable of sums.
CHAPTER 2 DESCRIBING DATA: FREQUENCY DISTRIBUTIONS AND GRAPHIC PRESENTATION
 CHAPTER 2 DESCRIBING DATA: FREQUENCY DISTRIBUTIONS AND GRAPHIC PRESENTATION 1. Maxwell Heating & Air Conditioning far exceeds the other corporations in sales. Mancell Electric & Plumbing and Mizelle Roofing
Name: Homework Assignment Six Due Friday, Feb. 27 th
 Name: Homework Assignment Six Due Friday, Feb. 27 th Suggest Reading: Chapter 5 Section 1 3, Chapter 6 Section 1- Section 2 1. List the probability model for the below situations. (Remember to list the
Chapter 3. Descriptive Measures. Copyright 2016, 2012, 2008 Pearson Education, Inc. Chapter 3, Slide 1
 Chapter 3 Descriptive Measures Copyright 2016, 2012, 2008 Pearson Education, Inc. Chapter 3, Slide 1 Chapter 3 Descriptive Measures Mean, Median and Mode Copyright 2016, 2012, 2008 Pearson Education, Inc.
Example - Let X be the number of boys in a 4 child family. Find the probability distribution table:
 Chapter8 Probability Distributions and Statistics Section 8.1 Distributions of Random Variables tthe value of the result of the probability experiment is a RANDOM VARIABLE. Example - Let X be the number
6683/01 Edexcel GCE Statistics S1 Gold Level G2
 Paper Reference(s) 6683/01 Edexcel GCE Statistics S1 Gold Level G Time: 1 hour 30 minutes Materials required for examination papers Mathematical Formulae (Green) Items included with question Nil Candidates
Converting to the Standard Normal rv: Exponential PDF and CDF for x 0 Chapter 7: expected value of x
 Key Formula Sheet ASU ECN 22 ASWCC Chapter : no key formulas Chapter 2: Relative Frequency=freq of the class/n Approx Class Width: =(largest value-smallest value) /number of classes Chapter 3: sample and
Measures of Center. Mean. 1. Mean 2. Median 3. Mode 4. Midrange (rarely used) Measure of Center. Notation. Mean
 Measure of Center. Notation. Mean") Measure of Center Measures of Center The value at the center or middle of a data set 1. Mean 2. Median 3. Mode 4. Midrange (rarely used) 1 2 Mean Notation The measure of center obtained by adding the values
Measure of Center Measures of Center The value at the center or middle of a data set 1. Mean 2. Median 3. Mode 4. Midrange (rarely used) 1 2 Mean Notation The measure of center obtained by adding the values
Chapter 3: Probability Distributions and Statistics
 Chapter 3: Probability Distributions and Statistics Section 3.-3.3 3. Random Variables and Histograms A is a rule that assigns precisely one real number to each outcome of an experiment. We usually denote
IOP 201-Q (Industrial Psychological Research) Tutorial 5
 Tutorial 5") IOP 201-Q (Industrial Psychological Research) Tutorial 5 TRUE/FALSE [1 point each] Indicate whether the sentence or statement is true or false. 1. To establish a cause-and-effect relation between two variables,
IOP 201-Q (Industrial Psychological Research) Tutorial 5 TRUE/FALSE [1 point each] Indicate whether the sentence or statement is true or false. 1. To establish a cause-and-effect relation between two variables,
3) Marital status of each member of a randomly selected group of adults is an example of what type of variable?
 Marital status of each member of a randomly selected group of adults is an example of what type of variable?") MATH112 STATISTICS; REVIEW1 CH1,2,&3 Name CH1 Vocabulary 1) A statistics student wants to find some information about all college students who ride a bike. She collected data from other students in her
MATH112 STATISTICS; REVIEW1 CH1,2,&3 Name CH1 Vocabulary 1) A statistics student wants to find some information about all college students who ride a bike. She collected data from other students in her
A.REPRESENTATION OF DATA
 A.REPRESENTATION OF DATA (a) GRAPHS : PART I Q: Why do we need a graph paper? Ans: You need graph paper to draw: (i) Histogram (ii) Cumulative Frequency Curve (iii) Frequency Polygon (iv) Box-and-Whisker
MEASURES OF CENTRAL TENDENCY & VARIABILITY + NORMAL DISTRIBUTION
 MEASURES OF CENTRAL TENDENCY & VARIABILITY + NORMAL DISTRIBUTION 1 Day 3 Summer 2017.07.31 DISTRIBUTION Symmetry Modality 单峰, 双峰 Skewness 正偏或负偏 Kurtosis 2 3 CHAPTER 4 Measures of Central Tendency 集中趋势
The normal distribution is a theoretical model derived mathematically and not empirically.
 Sociology 541 The Normal Distribution Probability and An Introduction to Inferential Statistics Normal Approximation The normal distribution is a theoretical model derived mathematically and not empirically.
Numerical summary of data
 Numerical summary of data Introduction to Statistics Measures of location: mode, median, mean, Measures of spread: range, interquartile range, standard deviation, Measures of form: skewness, kurtosis,
The Binomial Distribution
 The Binomial Distribution January 31, 2018 Contents The Binomial Distribution The Normal Approximation to the Binomial The Binomial Hypothesis Test Computing Binomial Probabilities in R 30 Problems The
CHAPTER 1. Find the mean, median and mode for the number of returns prepared by each accountant.
 CHAPTER 1 TUTORIAL 1. Explain the term below : i. Statistics ii. Population iii. Sample 2. A questionnaire provides 58 Yes, 42 No and 20 no-opinion. i. In the construction of a pie chart, how many degrees
BIOL The Normal Distribution and the Central Limit Theorem
 BIOL 300 - The Normal Distribution and the Central Limit Theorem In the first week of the course, we introduced a few measures of center and spread, and discussed how the mean and standard deviation are
Math 14, Homework 6.2 p. 337 # 3, 4, 9, 10, 15, 18, 19, 21, 22 Name
 Name 3. Population in U.S. Jails The average daily jail population in the United States is 706,242. If the distribution is normal and the standard deviation is 52,145, find the probability that on a randomly
The Binomial Distribution
 The Binomial Distribution January 31, 2019 Contents The Binomial Distribution The Normal Approximation to the Binomial The Binomial Hypothesis Test Computing Binomial Probabilities in R 30 Problems The
Example. Chapter 8 Probability Distributions and Statistics Section 8.1 Distributions of Random Variables
 Chapter 8 Probability Distributions and Statistics Section 8.1 Distributions of Random Variables You are dealt a hand of 5 cards. Find the probability distribution table for the number of hearts. Graph
Statistics (This summary is for chapters 18, 29 and section H of chapter 19)
") Statistics (This summary is for chapters 18, 29 and section H of chapter 19) Mean, Median, Mode Mode: most common value Median: middle value (when the values are in order) Mean = total how many = x n =
Statistics (This summary is for chapters 18, 29 and section H of chapter 19) Mean, Median, Mode Mode: most common value Median: middle value (when the values are in order) Mean = total how many = x n =
Statistics vs. statistics
 Statistics vs. statistics Question: What is Statistics (with a capital S)? Definition: Statistics is the science of collecting, organizing, summarizing and interpreting data. Note: There are 2 main ways