Do Older Americans Have More Income Than We Think?
|
|
|
- Rosemary Goodwin
- 5 years ago
- Views:
Transcription
1 Do Older Americans Have More Income Than We Think? Adam Bee and Josh Mitchell U.S. Census Bureau Presented at National Tax Association Meetings Philadelphia November 9, 2017 The views expressed in this research, including those related to statistical, methodological, technical, or operational issues, are solely those of the author and do not necessarily reflect the official positions or policies of the Census Bureau. The authors accept responsibility for all errors. This presentation is released to inform interested parties of ongoing research and to encourage discussion of work in progress. This presentation reports the results of research and analysis undertaken by Census Bureau staff. It has undergone more limited review than official publications.
2 Motivation Broad concern about well-being of Americans as they near and enter retirement Have people saved enough? Data quality concerns as well Discrepancies between survey income aggregates and other data sources such as National Income and Product Accounts and administrative records (ADREC) By themselves, aggregate discrepancies cannot address questions about the distribution of income 2
3 Contributions Bring unique data sources together to develop new, nationally representative estimates of median household income and poverty for the population 65+ through 2012 Explore which ADREC data sources are most important for our findings Reassess Importance of DB and DC income for current retirees Relative importance of Social Security income Transition to retirement (Retirement Consumption Puzzle) 3
4 Data: 2013 CPS ASEC Approximately 75,000 households 15,000 households with householder age 65+ Represents civilian noninstitutionalized population Source for official 2012 Income and Poverty Report Uses traditional income questions PVS Process to assign Protected Identification Key (PIK) Logit to estimate inverse probabilities and reweight PIK sample 4
5 Validating Five Types of Income in CPS ASEC Records from SSA: Earnings (wages and self-employment) Social Security (OASDI) Supplemental Security Income (SSI) Records from IRS: Dividends and Interest, from Form 1040 [keep CPS values for non-filers] Retirement Income, from Form 1099-R Retirement: pension, annuity, IRA, 401(k), etc. Survivor Disability 5
6 CPS Income as Percent of ADREC 130% 120% 110% 100% 90% 80% 70% 60% 50% 40% 30% 20% 10% 0% Earnings Social Security SSI Interest Retirement and Income Dividends All Five Sources Age Age 65+ 6
7 What are Distributional Implications? Median household income Householders age 65+ Explore subgroups classified by demographic characteristics of householder Poverty Persons age 65+ Compare family income to threshold which varies by family size Three samples in analysis Full CPS sample (N=23,000 persons, 15,000 households) PIK reweighted sample (N=21,000 persons, 13,500 households) ADREC sample (same as PIK sample but replaced with ADREC income) 7
8 Median Household Income (Householder Age 65+) $50,000 $45,000 $40,000 $35,000 $30,000 $25,000 $20,000 $15,000 $10,000 $5,000 $0 $33,848 FULL CPS PIK CPS ADREC 8
9 Median Household Income (Householder Age 65+) $50,000 $45,000 $40,000 $35,000 $30,000 $25,000 $20,000 $15,000 $10,000 $5,000 $0 $33,848 $34,037 FULL CPS PIK CPS ADREC 9
10 Median Household Income (Householder Age 65+) $50,000 $45,000 $40,000 $35,000 $30,000 $25,000 $20,000 $15,000 $10,000 $5,000 $0 $33,848 $34,037 $44,371 FULL CPS PIK CPS ADREC 10
11 $60,000 $50,000 $40,000 $30,000 $20,000 $10,000 Median Household Income (Householder Age 65-74) $42,343 $42,939 $52,118 $0 FULL CPS PIK CPS ADREC 11
12 Median Household Income (Householder Age 75-84) $45,000 $40,000 $35,000 $30,000 $25,000 $20,000 $15,000 $10,000 $5,000 $0 $28,517 $28,566 $38,982 FULL CPS PIK CPS ADREC 12
13 Median Household Income (Householder Age 85+) $35,000 $30,000 $25,000 $20,000 $15,000 $10,000 $5,000 $0 $22,800 $22,875 $30,325 FULL CPS PIK CPS ADREC 13
14 $70,000 $60,000 $50,000 $40,000 $30,000 $20,000 $10,000 Median Household Income (Family Householder Age 65+) $49,196 $49,375 $62,144 $0 FULL CPS PIK CPS ADREC 14
15 Median Household Income (Non-Family Householder Age 65+) $30,000 $27,196 $25,000 $20,000 $20,856 $20,954 $15,000 $10,000 $5,000 $0 FULL CPS PIK CPS ADREC 15
16 Median Household Income (College Graduate Householder Age 65+) $90,000 $80,000 $70,000 $60,000 $50,000 $40,000 $30,000 $20,000 $10,000 $0 $60,083 $60,700 $78,231 FULL CPS PIK CPS ADREC 16
17 $50,000 $45,000 $40,000 $35,000 $30,000 $25,000 $20,000 $15,000 $10,000 $5,000 $0 Median Household Income (Some College Householder Age 65+) $36,452 $36,521 $47,137 FULL CPS PIK CPS ADREC 17
18 $40,000 $35,000 $30,000 $25,000 $20,000 $15,000 $10,000 $5,000 $0 Median Household Income (High School Graduate Householder Age 65+) $29,362 $29,514 $37,690 FULL CPS PIK CPS ADREC 18
19 $25,000 $20,000 Median Household Income (Less than High School Householder Age 65+) $19,769 $19,917 $23,381 $15,000 $10,000 $5,000 $0 FULL CPS PIK CPS ADREC 19
20 $50,000 $45,000 $40,000 $35,000 $30,000 $25,000 $20,000 $15,000 $10,000 $5,000 $0 Median Household Income (White, Not Hispanic Householder Age 65+) $35,559 $35,789 $46,811 FULL CPS PIK CPS ADREC 20
21 $35,000 $30,000 $25,000 $20,000 $15,000 $10,000 $5,000 $0 Median Household Income (Black Householder Age 65+) $25,182 $25,272 $32,224 FULL CPS PIK CPS ADREC 21
22 $50,000 $45,000 $40,000 $35,000 $30,000 $25,000 $20,000 $15,000 $10,000 $5,000 $0 Median Household Income (Asian Householder Age 65+) $37,445 $37,855 $47,526 FULL CPS PIK CPS ADREC 22
23 Median Household Income (Hispanic Householder Age 65+) $35,000 $30,000 $25,000 $20,000 $15,000 $10,000 $5,000 $0 $24,122 $23,803 $30,016 FULL CPS PIK CPS ADREC 23
24 Poverty Rate (Persons Age 65+) FULL CPS PIK CPS ADREC 24
25 Poverty Rate (Persons Age 65+) FULL CPS PIK CPS ADREC 25
26 Poverty Rate (Persons Age 65+) FULL CPS PIK CPS ADREC 26
27 Poverty Rate (Persons Age 65-74) FULL CPS PIK CPS ADREC 27
28 Poverty Rate (Persons Age 75-84) FULL CPS PIK CPS ADREC 28
29 Poverty Rate (Persons Age 85+) FULL CPS PIK CPS ADREC 29
30 Transition Matrix CPS PIK Sample Income-to-Poverty Linked CPS-Admin Sample Income-to-Poverty Ratio Ratio <50% % % % % % >300% Proportion of people Persons aged 65 and over <50% of poverty % % % % % >300% Proportion of people N (number of people) 21,239 Source : 2013 CPS ASEC linked to SSA and IRS administrative records. 30
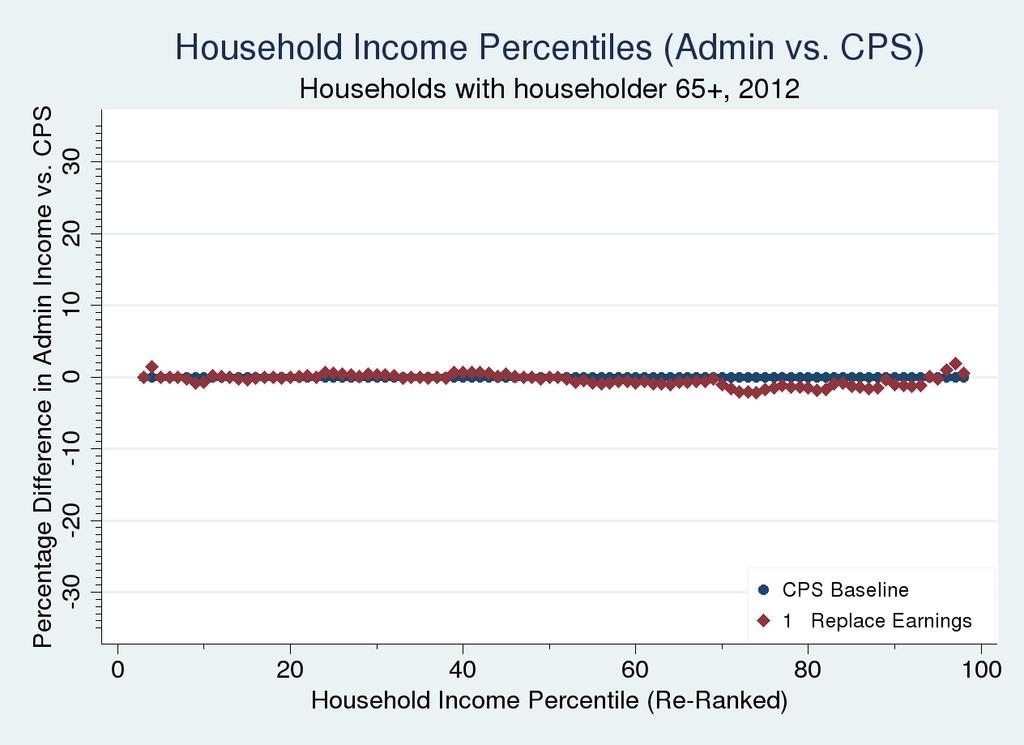
31 Which ADREC Source Is Driving our Results? Examine each percentile of the household income distribution Replace CPS income sources one at a time Re-rank households based on modified income Compute percent change for each percentile relative to CPS baseline 31
32 32
33 33
34 34
35 35
36 36
37 37
38 Correlation Coefficient Correlation of Log ADREC and CPS Income (Persons Age 65+, Intensive Margin) Earnings Social Security SSI Retirement Retirement (No IRA) 38
39 39
40 Percent with Any Social Security Income (Persons Age 65+) 100% 80% 84% 85% 86% 60% 40% 20% 0% FULL CPS PIK CPS ADREC 40
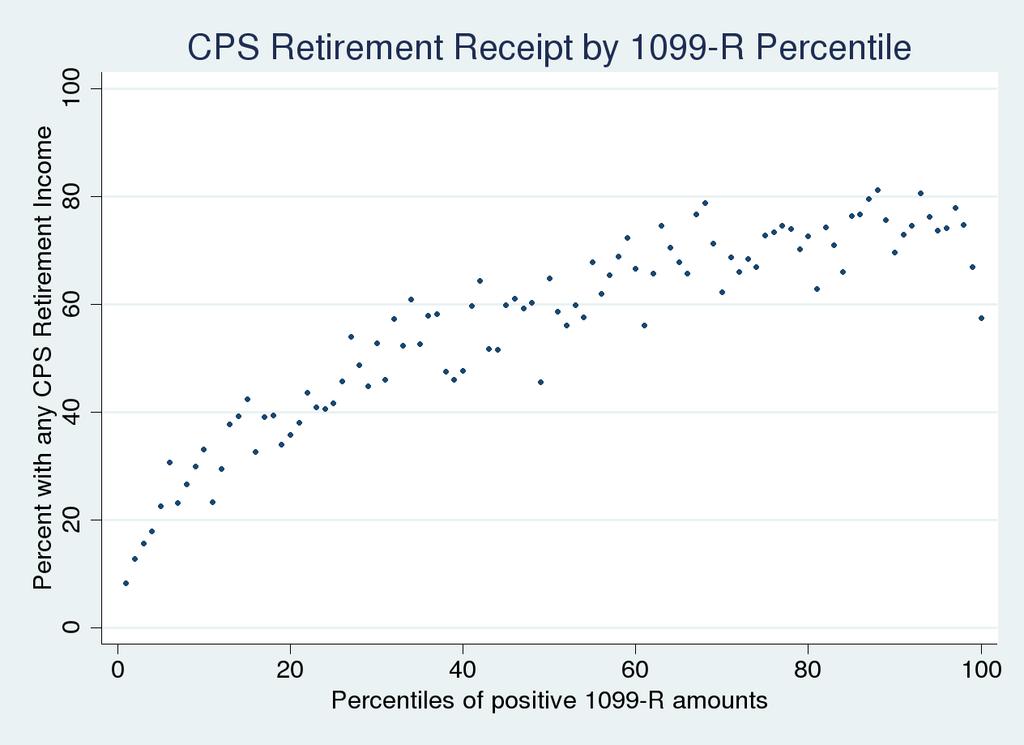
41 Percent with Any Retirement Income (Persons Age 65+) 100% 80% 60% 40% 20% 36% 37% 61% 0% FULL CPS PIK CPS ADREC 41
42 What Explains Retirement Income Underreporting? Demographic variables explain about 5 percent of variation Survey design features another 2 percent American Community Survey shows similar false negative rate Nature of 1099-R income matters the most 14 percent Amounts Volatility IRA versus employer-sponsored 42
43 43
44 Underreporting of Defined Benefit Income? Can examine specific government retirement plans Traditional DB plans, satisfy money income concept Examine CPS responses for persons age 65+ who receive 1099-R distribution from: Federal Civil Service Retirement System (CSRS) Military Retirement Fund CalPERS 44
45 Reported Receipt Among 1099-R Annuitants (Age 65+, Excludes Imputations) Any ES Fed CSRS Military CalPERS 45
46 Relative Importance of Different Income Sources Income of the Aged chartbook for population 65+ Previous edition also based on 2013 CPS ASEC Focus on aged units How does increase in ADREC retirement income affect relative importance of all income sources? 46
47 Percent of Aged Unit Beneficiaries with Social Security at least 90 Percent of Income 100% 90% 80% 70% 60% 50% 40% 30% 20% 10% 0% 36% 36% 18% Full CPS Sample CPS PIK Sample Linked CPS-Admin Sample 47
48 Long-Run Trends Use archived ADREC to construct consistent measures of income and poverty over time and compare to survey values Income quartiles for 1990, 1995, CPI-U-RS used to inflation-adjust to 2012 dollars Poverty rates for 1990, 1995,
49 Rates of Receipt of Social Security and Retirement Income Aged 65 and Over 100% 91% Linked SIPP-Admin SS Linked CPS-Admin SS 80% 91% CPS Survey SS 86% 84% 60% 45% Linked SIPP-Admin Retirement 61% Linked CPS-Admin Retirement 40% 40% 36% CPS Survey Retirement 20% 0%
50 $90,000 Income Quartiles, Aged 65 and Over $80,000 $70,000 $60,000 $50,000 $40,000 $30, th percentile Median $34,400 Linked SIPP-Admin $44,400 $33,800 Linked CPS-Admin Full ASEC Sample $28,700 $20,000 $10, th percentile $
51 Poverty Rates, Aged 65 and Over 20% 15% 10% 5% Full CPS Sample Linked CPS-Admin Sample 0%
52 Thank you! Contact: Adam Bee Josh Mitchell 52
Do Older Americans Have More Income Than We Think?
 Do Older Americans Have More Income Than We Think? Josh Mitchell and Adam Bee U.S. Census Bureau December 14, 2017 The views expressed in this research, including those related to statistical, methodological,
Aging Seminar Series:
 Aging Seminar Series: Income and Wealth of Older Americans Domestic Social Policy Division Congressional Research Service November 19, 2008 Introduction Aging Seminar Series Focus on important issues regarding
Income of the Aged Chartbook, 2002
 Cornell University ILR School DigitalCommons@ILR Federal Publications Key Workplace Documents 9-2004 Income of the Aged Chartbook, 2002 Social Security Administration Follow this and additional works at:
Income of the Aged Chartbook, 2004
 Cornell University ILR School DigitalCommons@ILR Federal Publications Key Workplace Documents 9-2006 Income of the Aged Chartbook, 2004 Social Security Administration Follow this and additional works at:
Income and Poverty Among Older Americans in 2008
 Income and Poverty Among Older Americans in 2008 Patrick Purcell Specialist in Income Security October 2, 2009 Congressional Research Service CRS Report for Congress Prepared for Members and Committees
ALL RETIREMENT PLAN COVERAGE TABLES
 ALL RETIREMENT PLAN COVERAGE TABLES 1. Employer-Sponsored Retirement Coverage, Civilian, 2008-2014 (%) 2. Employer-Sponsored Retirement Coverage, Private-Sector, 2003-2014 (%) 3. Employer-Sponsored Retirement
How Economic Security Changes during Retirement
 How Economic Security Changes during Retirement Barbara A. Butrica March 2007 The Retirement Project Discussion Paper 07-02 How Economic Security Changes during Retirement Barbara A. Butrica March 2007
BoomersattheBotom: HowWilLowIncomeBoomersCopewithRetirement? BarbaraA.Butrica,EricJ.Toder,andDesmondJ.Toohey TheUrbanInstitute
 BoomersattheBotom: HowWilLowBoomersCopewithRetirement? BarbaraA.Butrica,EricJ.Toder,andDesmondJ.Toohey TheUrbanInstitute Boomers at the Bottom: How Will Low Boomers Cope with Retirement? by Barbara A.
CRS Report for Congress Received through the CRS Web
 Order Code RL33387 CRS Report for Congress Received through the CRS Web Topics in Aging: Income of Americans Age 65 and Older, 1969 to 2004 April 21, 2006 Patrick Purcell Specialist in Social Legislation
Poverty Facts, million people or 12.6 percent of the U.S. population had family incomes below the federal poverty threshold in 2004.
 Poverty Facts, 2004 How Many People Are Poor? 36.6 million people or 12.6 percent of the U.S. population had family incomes below the federal poverty threshold in 2004. 1 How Much Money Do Families Need
PROJECTING POVERTY RATES IN 2020 FOR THE 62 AND OLDER POPULATION: WHAT CHANGES CAN WE EXPECT AND WHY?
 PROJECTING POVERTY RATES IN 2020 FOR THE 62 AND OLDER POPULATION: WHAT CHANGES CAN WE EXPECT AND WHY? Barbara A. Butrica, The Urban Institute Karen Smith, The Urban Institute Eric Toder, Internal Revenue
The Economic Well-being of the Aged Population in the Early 1990s, 2025, and 2060: An Analysis of Social Security Benefits and Retirement Income
 The Economic Well-being of the Aged Population in the Early 1990s, 2025, and 2060: An Analysis of Social Security Benefits and Retirement Income Barbara A. Butrica and Howard M. Iams March 2005 Draft:
Current Population Survey: Issues Continue for Retirement Plan Participation and Retiree Income Estimates
 June 12, 2018 No. 452 Current Population Survey: Issues Continue for Retirement Plan Participation and Retiree Income Estimates By Craig Copeland, Ph.D., Employee Benefit Research Institute A T A G L A
Sources of Income for Older Persons, 2006
 Fact Sheet Sources of for Older Persons, 2006 AARP Public Policy Institute Older persons with low income depend heavily on Social Security. Over the past 11 years, earnings have become a more important
PROJECTING POVERTY RATES IN 2020 FOR THE 62 AND OLDER POPULATION: WHAT CHANGES CAN WE EXPECT AND WHY?
 PROJECTING POVERTY RATES IN 2020 FOR THE 62 AND OLDER POPULATION: WHAT CHANGES CAN WE EXPECT AND WHY? Barbara A. Butrica, The Urban Institute Karen Smith, The Urban Institute Eric Toder, Internal Revenue
Health Status, Health Insurance, and Health Services Utilization: 2001
 Health Status, Health Insurance, and Health Services Utilization: 2001 Household Economic Studies Issued February 2006 P70-106 This report presents health service utilization rates by economic and demographic
Program on Retirement Policy Number 1, February 2011
 URBAN INSTITUTE Retirement Security Data Brief Program on Retirement Policy Number 1, February 2011 Poverty among Older Americans, 2009 Philip Issa and Sheila R. Zedlewski About one in three Americans
FIGURE I.1 / Per Capita Gross Domestic Product and Unemployment Rates. Year
 FIGURE I.1 / Per Capita Gross Domestic Product and Unemployment Rates 40,000 12 Real GDP per Capita (Chained 2000 Dollars) 35,000 30,000 25,000 20,000 15,000 10,000 5,000 Real GDP per Capita Unemployment
Social Security Income Measurement in Two Surveys
 Social Security Income Measurement in Two Surveys Howard Iams and Patrick Purcell Office of Research, Evaluation, and Statistics Social Security Administration Abstract Social Security is a major source
Redistribution under OASDI: How Much and to Whom?
 9 Redistribution under OASDI: How Much and to Whom? Lee Cohen, Eugene Steuerle, and Adam Carasso T his chapter presents the results from a study of redistribution in the Social Security program under current
SOURCES OF INCOME FOR OLDER PERSONS IN 2003
 SOURCES OF INCOME FOR OLDER PERSONS IN 2003 Social Security, pensions and personal savings, and earnings constitute three of the four pillars of retirement income security (the fourth being health insurance).
Retirement Plan Coverage of Baby Boomers: Analysis of 1998 SIPP Data. Satyendra K. Verma
 A Data and Chart Book by Satyendra K. Verma August 2005 Retirement Plan Coverage of Baby Boomers: Analysis of 1998 SIPP Data by Satyendra K. Verma August 2005 Components Retirement Plan Coverage in 1998:
Demographic and Economic Characteristics of Children in Families Receiving Social Security
 Each month, over 3 million children receive benefits from Social Security, accounting for one of every seven Social Security beneficiaries. This article examines the demographic characteristics and economic
Aging in America: Income and Assets of People on Medicare
 Aging in America: Income and Assets of People on Medicare November 6, 2015 National Health Policy Forum Gretchen Jacobson, Ph.D. Associate Director, Program on Medicare Policy Kaiser Family Foundation
Income and Poverty Among Older Americans in 2006
 Cornell University ILR School DigitalCommons@ILR Federal Publications Key Workplace Documents September 2007 Income and Poverty Among Older Americans in 2006 Patrick Purcell Congressional Research Service,
Demographic and Other Statistics for Women and Men Aged 50 and Older,
 Demographic and Other Statistics for Women and Men Aged 50 and Older, 1999-2001 Population in 2001 Proportion of Population Over Age 50 30.0 % 28.6 % 28.6 % 25.2 % Age Distribution: 50-61 41.9 49.6 45.5
Fast Facts & Figures About Social Security, 2005
 Fast Facts & Figures About Social Security, 2005 Social Security Administration Office of Policy Office of Research, Evaluation, and Statistics 500 E Street, SW, 8th Floor Washington, DC 20254 SSA Publication
Topics in Aging: Income and Poverty Among Older Americans in 2005
 Cornell University ILR School DigitalCommons@ILR Congressional Research Service (CRS) Reports and Issue Briefs Federal Publications September 2006 Topics in Aging: Income and Poverty Among Older Americans
ICI RESEARCH PERSPECTIVE
 ICI RESEARCH PERSPECTIVE 1401 H STREET, NW, SUITE 1200 WASHINGTON, DC 20005 202-326-5800 WWW.ICI.ORG JULY 2017 VOL. 23, NO. 5 WHAT S INSIDE 2 Introduction 4 Which Workers Would Be Expected to Participate
Distribution of Household Wealth in the U.S.: 2000 to 2011
 Cornell University ILR School DigitalCommons@ILR Federal Publications Key Workplace Documents 2014 Distribution of Household Wealth in the U.S.: Marina Vornovitsky U.S. Census Bureau Alfred Gottschalck
John L. Czajka and Randy Rosso
 F I N A L R E P O R T Redesign of the Income Questions in the Current Population Survey Annual Social and Economic Supplement: Further Analysis of the 2014 Split- Sample Test September 27, 2015 John L.
Measuring the Cost of Employment: Work-Related Expenses in the Supplemental Poverty Measure. No. 279 SEHSD No
 THE SURVEY OF INCOME AND PROGRAM PARTICIPATION Measuring the Cost of Employment: Work-Related in the Supplemental Poverty Measure Revised November 13, 2017 No. 279 SEHSD No. 2017-43 Abinash Mohanty Ashley
Errors in Survey Reporting and Imputation and their Effects on Estimates of Food Stamp Program Participation
 Errors in Survey Reporting and Imputation and their Effects on Estimates of Food Stamp Program Participation ITSEW June 3, 2013 Bruce D. Meyer, University of Chicago and NBER Robert Goerge, Chapin Hall
More than 62 million people receive Social Security each month, in one of three categories: Nearly 1 in 5 Americans gets Social Security benefits.
 National Academy of Social Insurance www.nasi.org August 2018 More than 62 million people receive Social Security each month, in one of three categories: Retirement insurance Survivors insurance Disability
The Relationship Between Income and Health Insurance, p. 2 Retirement Annuity and Employment-Based Pension Income, p. 7
 E B R I Notes E M P L O Y E E B E N E F I T R E S E A R C H I N S T I T U T E February 2005, Vol. 26, No. 2 The Relationship Between Income and Health Insurance, p. 2 Retirement Annuity and Employment-Based
CRS Report for Congress
 Order Code RL33116 CRS Report for Congress Received through the CRS Web Retirement Plan Participation and Contributions: Trends from 1998 to 2003 October 12, 2005 Patrick Purcell Specialist in Social Legislation
Poverty and Labor Force Statistics in the United States
 Poverty and Labor Force Statistics in the United States Marcella S. Jones-Puthoff Statistician, Age and Special Populations Branch Population Division U. S. Census Bureau Presentation for the Global Forum
Trends in Supplemental Nutrition Assistance Program Participation Rates: Fiscal Year 2010 to Fiscal Year 2014
 United States Department of Agriculture Current Perspectives on SNAP Participation Trends in Supplemental Nutrition Assistance Program Participation Rates: Fiscal Year 2010 to Fiscal Year 2014 Supplemental
Retirement Annuity and Employment-Based Pension Income, Among Individuals Aged 50 and Over: 2006
 Retirement Annuity and Employment-Based Pension Income, Among Individuals d 50 and Over: 2006 by Ken McDonnell, EBRI Introduction This article looks at one slice of the income pie of the older population:
Retirement Security: What s Working and What s Not? James Poterba MIT, NBER, & TIAA-CREF. Bipartisan Policy Center 30 July 2014
 Retirement Security: What s Working and What s Not? James Poterba MIT, NBER, & TIAA-CREF Bipartisan Policy Center 30 July 2014 Retirement Support: A Three Legged Stool? Three Legs: Social Security, Private
The Role of CPS Non-Response on Trends in Poverty and Inequality
 The Role of CPS Non-Response on Trends in Poverty and Inequality Charles Hokayem, U.S. Census Bureau James P. Ziliak, Department of Economics and Center for Poverty Research, University of Kentucky Christopher
CRS Report for Congress
 Order Code RL30122 CRS Report for Congress Pension Sponsorship and Participation: Summary of Recent Trends Updated September 6, 2007 Patrick Purcell Specialist in Income Security Domestic Social Policy
How the Census Bureau Measures Poverty
 How the Census Bureau Measures Poverty Following the Office of Management and Budget's (OMB) Statistical Policy Directive 14, the Census Bureau uses a set of money income thresholds that vary by family
In Baltimore City today, 20% of households live in poverty, but more than half of the
 Building Economic Opportunity in Baltimore: A Data Profile Baltimore Highlights In Baltimore City today, 20% of households live in poverty, but more than half of the city s population 55% is financially
Pension Sponsorship and Participation: Summary of Recent Trends
 Cornell University ILR School DigitalCommons@ILR Federal Publications Key Workplace Documents 9-11-2009 Pension Sponsorship and Participation: Summary of Recent Trends Patrick Purcell Congressional Research
Independence, MO Data Profile 2015
 , MO Data Profile 2015 5 year American Community Survey (ACS) Jackson County, Missouri Data sources: U.S. Census Bureau, American Community Survey (ACS), 2011 2015 (released December 8, 2016), compared
Evaluating Respondents Reporting of Social Security Income In the Survey of Income and Program Participation (SIPP) Using Administrative Data
 Using Administrative Data") Evaluating Respondents Reporting of Social Security Income In the Survey of Income and Program Participation (SIPP) Using Administrative Data Lydia Scoon-Rogers 1 U.S. Bureau of the Census HHES Division,
Evaluating Respondents Reporting of Social Security Income In the Survey of Income and Program Participation (SIPP) Using Administrative Data Lydia Scoon-Rogers 1 U.S. Bureau of the Census HHES Division,
Retirement Savings: How Much Will Workers Have When They Retire?
 Order Code RL33845 Retirement Savings: How Much Will Workers Have When They Retire? January 29, 2007 Patrick Purcell Specialist in Social Legislation Domestic Social Policy Division Debra B. Whitman Specialist
Trends in Supplemental Nutrition Assistance Program Participation Rates: Fiscal Year 2010 to Fiscal Year 2013
 United States Department of Agriculture Current Perspectives on SNAP Participation Trends in Supplemental Nutrition Assistance Program Participation Rates: Fiscal Year 2010 to Fiscal Year 2013 Supplemental
Topics in Aging: Income and Poverty Among Older Americans in 2004
 Cornell University ILR School DigitalCommons@ILR Congressional Research Service (CRS) Reports and Issue Briefs Federal Publications 11-1-2005 Topics in Aging: Income and Poverty Among Older Americans in
CHAPTER 5 PROJECTING RETIREMENT INCOME FROM PENSIONS
 CHAPTER 5 PROJECTING RETIREMENT INCOME FROM PENSIONS I. OVERVIEW The MINT 3. pension projection module estimates pension benefits and wealth from defined benefit (DB) plans, defined contribution (DC) plans,
Glossary of Terms & Frequently Asked Questions >Terms CSRS FERS Trans-FERS Survivor Benefits Thrift Savings Plan FEGLI
 Glossary of Terms & Frequently Asked Questions >Terms CSRS FERS Trans-FERS Survivor Benefits Thrift Savings Plan FEGLI CSRS 1. The Civil Service Retirement System (CSRS) is a defined benefit contributory
Health Insurance Coverage in 2013: Gains in Public Coverage Continue to Offset Loss of Private Insurance
 Health Insurance Coverage in 2013: Gains in Public Coverage Continue to Offset Loss of Private Insurance Laura Skopec, John Holahan, and Megan McGrath Since the Great Recession peaked in 2010, the economic
MEMORANDUM. Gloria Macdonald, Jennifer Benedict Nevada Division of Health Care Financing and Policy (DHCFP)
") MEMORANDUM To: From: Re: Gloria Macdonald, Jennifer Benedict Nevada Division of Health Care Financing and Policy (DHCFP) Bob Carey, Public Consulting Group (PCG) An Overview of the in the State of Nevada
MEMORANDUM To: From: Re: Gloria Macdonald, Jennifer Benedict Nevada Division of Health Care Financing and Policy (DHCFP) Bob Carey, Public Consulting Group (PCG) An Overview of the in the State of Nevada
CHAPTER 3 POPULATION AND ECONOMIC CHARACTERISTICS
 CHAPTER 3 POPULATION AND ECONOMIC CHARACTERISTICS INTRODUCTION Population trends in La Vista and its respective planning jurisdiction serve as valuable indicators of future development needs and patterns
National Health Interview Survey Early Release Program
 N ATIONAL CENTER FOR HEA LTH STATISTICS National Health Interview Survey Early Release Program Problems Paying Medical Bills Among Persons Under Age 6: Early Release of Estimates From the National Health
A Data and Chart Book. August by Retirement Plan Coverage of Boomers: Analysis of 2003 SIPP Data. Satyendra K. Verma. Satyendra K.
 A Data and Chart Book by Retirement Plan Coverage of Boomers: Analysis of 2003 SIPP Data Satyendra K. Verma by Satyendra K. Verma August 2006 August 2006 Components Retirement Retirement Plan Coverage
Pension Sponsorship and Participation: Summary of Recent Trends
 Cornell University ILR School DigitalCommons@ILR Federal Publications Key Workplace Documents 9-8-2008 Pension Sponsorship and Participation: Summary of Recent Trends Patrick Purcell Congressional Research
In 2012, according to the U.S. Census Bureau, about. A Profile of the Working Poor, Highlights CONTENTS U.S. BUREAU OF LABOR STATISTICS
 U.S. BUREAU OF LABOR STATISTICS M A R C H 2 0 1 4 R E P O R T 1 0 4 7 A Profile of the Working Poor, 2012 Highlights Following are additional highlights from the 2012 data: Full-time workers were considerably
California Workers Retirement Prospects
 21 CHAPTER 2 California Workers Retirement Prospects by Sylvia A. Allegretto, Nari Rhee, Joelle Saad-Lessler, and Lauren Schmitz INTRODUCTION While public debate rages about the costs of pensions and Social
Selected indicators of well-being for people aged 55-64: 1984, 1994, and 2004
 Selected indicators of well-being for people aged 55-64: 1984, 1994, and 2004 Howard M. Iams, John Phillips, Lionel Deang, and Irena Dushi Howard Iams is a senior research advisor with the Office of Research,
CHAPTER 7 SUPPLEMENTAL SECURITY INCOME AND LIVING ARRANGEMENTS
 CHAPTER 7 SUPPLEMENTAL SECURITY INCOME AND LIVING ARRANGEMENTS I. OVERVIEW In this chapter, we explain how MINT projects Supplemental Security Income (SSI) benefits and eligibility status from age 62 until
Table 1 Annual Median Income of Households by Age, Selected Years 1995 to Median Income in 2008 Dollars 1
 Fact Sheet Income, Poverty, and Health Insurance Coverage of Older Americans, 2008 AARP Public Policy Institute Median household income and median family income in the United States declined significantly
Women in the Labor Force: A Databook
 Cornell University ILR School DigitalCommons@ILR Federal Publications Key Workplace Documents 12-2010 Women in the Labor Force: A Databook Bureau of Labor Statistics Follow this and additional works at:
The Disappearing Defined Benefit Pension and Its Potential Impact on the Retirement Incomes of Boomers Barbara A. Butrica, Howard M. Iams, Karen E.
 The Disappearing Defined Benefit Pension and Its Potential Impact on the Retirement Incomes of Barbara A. Butrica, Howard M. Iams, Karen E. Smith, and Eric J. Toder January 2009 The Retirement Policy Program
Income Data for 2002: A Comparison of Eight Surveys
 Income Data for 2002: A Comparison of Eight Surveys Presentation to COPAFS Quarterly Meeting March 6, 2009 John L. Czajka Mathematica Policy Research, Inc. This presentation is based on: Income Data for
The State of Working America 12th Edition
 The State of Working America 12th Edition LAWRENCE MISHEL JOSH BIVENS ELISE GOULD HEIDI SHIERHOLZ Documentation and methodology EPI DIGITAL EDITION This chapter is from The State of Working America, 12th
5.3 Teenage Unemployment
 5.1 New Jobs Created 5.1.1 Net annual job growth rate 5.1.2 Broward County s ranking in net job growth rate Measurement: The net annual job growth rate is (1) the average number of jobs this year minus
Federal Employees: Pay and Pension Increases Since 1969
 Cornell University ILR School DigitalCommons@ILR Federal Publications Key Workplace Documents January 2008 Federal Employees: Pay and Pension Increases Since 1969 Patrick Purcell Congressional Research
UNDERSTANDING EXPENDITURE PATTERNS IN RETIREMENT. Barbara A. Butrica, Joshua H. Goldwyn, and Richard W. Johnson*
 UNDERSTANDING EXPENDITURE PATTERNS IN RETIREMENT Barbara A. Butrica, Joshua H. Goldwyn, and Richard W. Johnson* CRR WP 2005-03 Released: January 2005 Draft Submitted: December 2004 Center for Retirement
A Profile of the Working Poor, 2011
 Cornell University ILR School DigitalCommons@ILR Federal Publications Key Workplace Documents 4-2013 A Profile of the Working Poor, 2011 Bureau of Labor Statistics Follow this and additional works at:
Resource Tests and Eligibility for Federal Assistance Programs: Effects of Current Rules and Options for Change. Mark Merlis Independent Consultant
 Resource Tests and Eligibility for Federal Assistance Programs: Effects of Current Rules and Options for Change Mark Merlis Independent Consultant Resource Tests and Eligibility for Federal Assistance
Figure 2.1 The Longitudinal Employer-Household Dynamics Program
 Figure 2.1 The Longitudinal Employer-Household Dynamics Program Demographic Surveys Household Record Household-ID Data Integration Record Person-ID Employer-ID Data Economic Censuses and Surveys Census
In Debt and Approaching Retirement: Claim Social Security or Work Longer?
 AEA Papers and Proceedings 2018, 108: 401 406 https://doi.org/10.1257/pandp.20181116 In Debt and Approaching Retirement: Claim Social Security or Work Longer? By Barbara A. Butrica and Nadia S. Karamcheva*
Evaluating the BLS Labor Force projections to 2000
 Evaluating the BLS Labor Force projections to 2000 Howard N Fullerton Jr. Bureau of Labor Statistics, Office of Occupational Statistics and Employment Projections Washington, DC 20212-0001 KEY WORDS: Population
2016 HEALTH INSURANCE COVERAGE ESTIMATES
 2016 HEALTH INSURANCE COVERAGE ESTIMATES SHADAC Webinar Featuring U.S. Census Bureau Experts September 19, 2017 1:00 PM EDT You will be connected to broadcast audio through your computer. You can also
Women in the Labor Force: A Databook
 Cornell University ILR School DigitalCommons@ILR Federal Publications Key Workplace Documents 9-2007 Women in the Labor Force: A Databook Bureau of Labor Statistics Follow this and additional works at:
Contingent and Alternative Employment Arrangements, May U.S. BUREAU OF LABOR STATISTICS bls.gov
 Contingent and Alternative Employment Arrangements, May 2017 1 U.S. BUREAU OF LABOR STATISTICS bls.gov Gig economy No official BLS definition of gig economy or gig workers Researchers use many different
William (Larry) Minnix, Jr., Chair
 Minnix, Jr., Chair") William (Larry) Minnix, Jr., Chair The Honorable Barack Obama The White House Washington, DC 20500 Dear Mr. President: On behalf of the Leadership Council of Aging Organizations (LCAO), a coalition of
William (Larry) Minnix, Jr., Chair The Honorable Barack Obama The White House Washington, DC 20500 Dear Mr. President: On behalf of the Leadership Council of Aging Organizations (LCAO), a coalition of
Tables Describing the Asset and Vehicle Holdings of Low-Income Households in 2002
 Contract No.: FNS-03-030-TNN /43-3198-3-3724 MPR Reference No.: 6044-413 Tables Describing the Asset and Vehicle Holdings of Low-Income Households in 2002 Final Report May 2007 Carole Trippe Bruce Schechter
Assets of Low Income Households by SNAP Eligibility and Participation in Final Report. October 19, Carole Trippe Bruce Schechter
 Assets of Low Income Households by SNAP Eligibility and Participation in 2010 Final Report October 19, 2010 Carole Trippe Bruce Schechter This page has been left blank for double-sided copying. Contract
Proportion of income 1 Hispanics may be of any race.
 POLICY PAPER This report addresses how individuals from various racial and ethnic groups fare under the current Social Security system. It examines the relative importance of Social Security for these
Distribution of Family Wealth,
 Distribution of Family Wealth, 1963 2016 1963 1983 2016 $12 million 99th percentile $10,400,000 $9 $6 $3 0 10th 50th 90th 10th 50th 90th $-19 $41,028 $238,860 $724 $82,746 $520,133 0 0 Source: Urban Institute
Federal Employees: Pay and Pension Increases Since 1969
 Cornell University ILR School DigitalCommons@ILR Congressional Research Service (CRS) Reports and Issue Briefs Federal Publications February 2006 Federal Employees: Pay and Pension Increases Since 1969
Household Income Trends April Issued May Gordon Green and John Coder Sentier Research, LLC
 Household Income Trends April 2018 Issued May 2018 Gordon Green and John Coder Sentier Research, LLC Household Income Trends April 2018 Source This report on median household income for April 2018 is based
Women in the Labor Force: A Databook
 Cornell University ILR School DigitalCommons@ILR Federal Publications Key Workplace Documents 12-2011 Women in the Labor Force: A Databook Bureau of Labor Statistics Follow this and additional works at:
Federal Employees: Pension COLAs and Pay Adjustments Since 1969
 Cornell University ILR School DigitalCommons@ILR Federal Publications Key Workplace Documents 12-7-2010 Federal Employees: Pension COLAs and Pay Adjustments Since 1969 Katelin P. Isaacs Congressional Research
Health Insurance Coverage: Early Release of Estimates From the National Health Interview Survey, 2009
 Health Insurance Coverage: Early Release of Estimates From the National Health Interview Survey, 2009 by Robin A. Cohen, Ph.D., Michael E. Martinez, M.P.H., M.H.S.A., and Brian W. Ward, Ph.D., Division
Health Insurance Coverage: Early Release of Estimates From the National Health Interview Survey, 2010
 Health Insurance Coverage: Early Release of Estimates From the National Health Interview Survey, 2010 by Robin A. Cohen, Ph.D., Brian W. Ward, Ph.D., and Jeannine S. Schiller, M.P.H. Division of Health
Medicaid Undercount in the American Community Survey (ACS)
") Medicaid Undercount in the American Community Survey (ACS) Joanna Turner State Health Access Data Assistance Center (SHADAC) University of Minnesota FCSM, Washington, DC November 4, 2013 Acknowledgments
Medicaid Undercount in the American Community Survey (ACS) Joanna Turner State Health Access Data Assistance Center (SHADAC) University of Minnesota FCSM, Washington, DC November 4, 2013 Acknowledgments
Use of Administrative Records to Reduce Burden and Improve Quality. Amy O Hara CNSTAT Workshop on Respondent Burden March 8, 2016
 Use of Administrative Records to Reduce Burden and Improve Quality Amy O Hara CNSTAT Workshop on Respondent Burden March 8, 2016 1 Using administrative records in household surveys Reduce burden American
Using the American Community Survey (ACS) to Implement a Supplemental Poverty Measure (SPM) 1
 to Implement a Supplemental Poverty Measure (SPM) 1") Using the American Community Survey (ACS) to Implement a Supplemental Poverty Measure (SPM) 1 Trudi Renwick, Kathleen Short, Ale Bishaw and Charles Hokayem Social, Economic and Housing Statistics Division
Using the American Community Survey (ACS) to Implement a Supplemental Poverty Measure (SPM) 1 Trudi Renwick, Kathleen Short, Ale Bishaw and Charles Hokayem Social, Economic and Housing Statistics Division
How Does Dipping into Your Pension Affect Your Retirement Wealth? Gary V. Engelhardt
 How Does Dipping into Your Pension Affect Your Retirement Wealth? Gary V. Engelhardt No. 22/2001 Gary V. Engelhardt is Associate Professor of Economics and Senior Research Associate, Center for Policy
Commission District 4 Census Data Aggregation
 Commission District 4 Census Data Aggregation 2011-2015 American Community Survey Data, U.S. Census Bureau Table 1 (page 2) Table 2 (page 2) Table 3 (page 3) Table 4 (page 4) Table 5 (page 4) Table 6 (page
Need-Tested Benefits: Estimated Eligibility and Benefit Receipt by Families and Individuals
 Need-Tested Benefits: Estimated Eligibility and Benefit Receipt by Families and Individuals Gene Falk Specialist in Social Policy Alison Mitchell Analyst in Health Care Financing Karen E. Lynch Specialist
Women in the Labor Force: A Databook
 Cornell University ILR School DigitalCommons@ILR Federal Publications Key Workplace Documents 2-2013 Women in the Labor Force: A Databook Bureau of Labor Statistics Follow this and additional works at:
Getting More from Survey Income Measures: Empirically-based Recommendations for Improving Accuracy and Efficiency
 Getting More from Survey Income Measures: Empirically-based Recommendations for Improving Accuracy and Efficiency John L. Czajka* and Gabrielle Denmead** *Mathematica Policy Research 1100 First Street,
This PDF is a selection from a published volume from the National Bureau of Economic Research. Volume Title: Analyses in the Economics of Aging
 This PDF is a selection from a published volume from the National Bureau of Economic Research Volume Title: Analyses in the Economics of Aging Volume Author/Editor: David A. Wise, editor Volume Publisher:
2018:IIIQ Nevada Unemployment Rate Demographics Report*
 2018:IIIQ Nevada Unemployment Rate Demographics Report* Department of Employment, Training & Rehabilitation Research and Analysis Bureau Dr. Tiffany Tyler-Garner, Director Dennis Perea, Deputy Director
Northwest Census Data Aggregation
 Northwest Census Data Aggregation 2011-2015 American Community Survey Data, U.S. Census Bureau Table 1 (page 2) Table 2 (page 2) Table 3 (page 3) Table 4 (page 4) Table 5 (page 4) Table 6 (page 5) Table