Chapter 5: Probability models
|
|
|
- Kristina Pope
- 5 years ago
- Views:
Transcription
1 Chapter 5: Probability models 1. Random variables: a) Idea. b) Discrete and continuous variables. c) The probability function (density) and the distribution function. d) Mean and variance of a random variable. 2. Probability models: a) Bernoulli. b) Geometric. c) Binomial. d) Normal. e) Normal approximation to the binomial distribution. Recommended reading: Capítulos 22 y 23 del libro de Peña y Romo (1997)
2 5.1: Random variables A function which places a numerical value on each possible result of an experiment is called a random variable. We use capital letters, e.g. X, Y, Z, to represent random variables and lower case letters, x, y, z, to represent particular values of these variables. Discrete random variables can only take a discrete set of possible values. Continuous random variables can take an infinite number of values within some continuous range.
3 The probability function for a discrete r.v.: is the function which associates the probability P(X=x) to each possible value x. The possible values of a discrete r.v. X and their respective probabilities are often displayed in a probability distribution table: X x 1 x 2... x n P(X=x i ) p 1 p 2... p n Every probability function satisfies p1 p2 p3 p n 1 The distribution function for a discrete r.v.: Let X be a r.v. The distribution function of X is the function which gives, for each x, the cumulative probability up to x, that is, F( x) P( X x)
4 Mean, variance and standard deviation of a discrete r.v. The mean or expectation of a discrete r.v., X, which takes values x 1,, x 2,...with probabilities p 1, p 2,... Is given by the following expression: x P( X x ) x p The variance is defined by the formula which can be calculated using i i i xp i i i i i i ( x ) 2 2 i i The standard deviation is the root of the variance. Example: The probability distribution of the r.v. X is given in the following table: x i p i ? p i What is P(X=3)? Calculate the mean and variance.
5 5.2: Probability models Discrete models Continuous models Bernoulli trials and the geometric and binomial distributions The normal distribution and related distributions
6 Bernoulli trials and the geometric and binomial distributions A Bernoulli model is an experiment with the following characteristics: In each trial, there are only two possible results, success and failure. The result obtained in each trial is independent of the previous results. The probability of success is constant, P(success) = p, and does not change from one trial to the next.
7 The geometric distribution Suppose we have a Bernoulli model. What is the distribution of the number of failures, F, before the first success? P(F=0) = P(0 failures before the 1st success) = p P(F=1) = P(failure, success) = (1-p)p P(F=2) = P(failure, failure, success) = (1-p) 2 p P(F=f) = P( f failures before the 1st success) = (1-p) f p for f = 0, 1, 2, The distribution of F is called the geometric distribution with parameter p. E[F] = (1-p)/p V[X] = (1-p)/p 2
8 The binomial distribution Suppose we have a Bernoulli model. What is the distribution of the number of successes, X, in n trials? n r P( Obtener r éxitos) P( X r ) p (1 p) r for r = 0,1,2,, n. The distribution of X is called the binomial distribution with parameters n and p. nr E[X] = np V[X] = np(1-p)
9 EXAMPLE Calculate the probability that in a family with 4 children, 3 of them are boys. EXAMPLE The probability that a student has to repeat the year is 0,3. We pick a student at random. What is the probability that the first repeater is the 3rd student we pick? We choose 20 students at random. What is the chance that there are exactly 4 repeaters? EXAMPLE On average, 4% of the votes in an election are null. Calculate the expected number of null votes in a town with an electorate of 1000.

10 Calculation with Excel Binomial probabilities are tough to calculate by hand except in the simple cases of zero or 1 successes or failures. In Excel it is much easier!
11 Example (Test) Of all the charities in España, 30% are charities dedicated to children. If 50 Spanish charities are chosen at random how many of them are expected to be dedicated to children?
12 Example (Test) On average, one in every ten members of the CCOO union is a delegate. a) In interviews with CCOO members, what is the probability that the first delegate will be the second person interviewed? b) There are 4 CCOO members in La Chimbomba. What is the chance that none of them are delegates? c) In a sample of 100 CCOO members, what is the expected number of delegates?
 P( X x) The c.d.f. satisfies the conditions: It takes the value 0 for any x below the minimum possible value of the variable.")
13 DENSITY FUNCTION OF A CONTINUOUS R.V.: The density function of a continuous r.v. satisfies the following conditions: It only takes non-negative values, f(x) 0. The area under the curve is equal to 1. Distribution function. As with discrete variables, the distribution function gives the cumulative probability up to x, that is: F( x) P( X x) The c.d.f. satisfies the conditions: It takes the value 0 for any x below the minimum possible value of the variable. It takes the value 1 for all points over the maximum possible value of the variable.
.")
14 The normal or gaussian distribution Many variables have a bell shaped density. Examples: Weights of a population of the same age and sex. Heights of the same population. The grades in a course (urban myth). To say that a continuous variable X, has a normal distribution with mean and standard deviation, we write: X ~ N(, 2 )
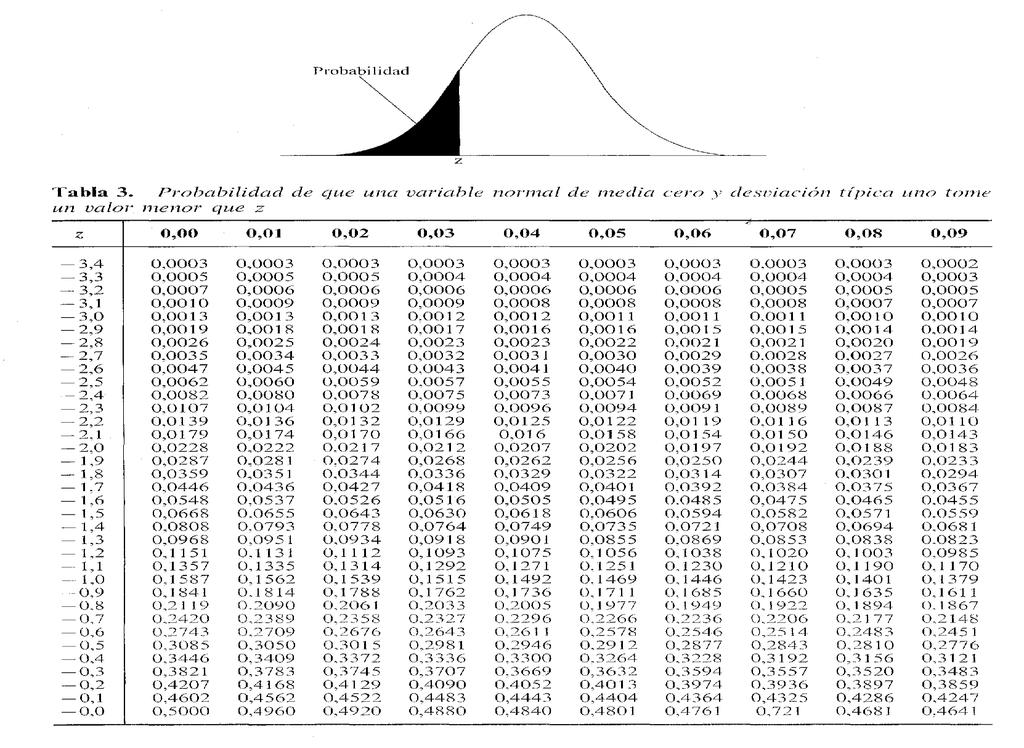
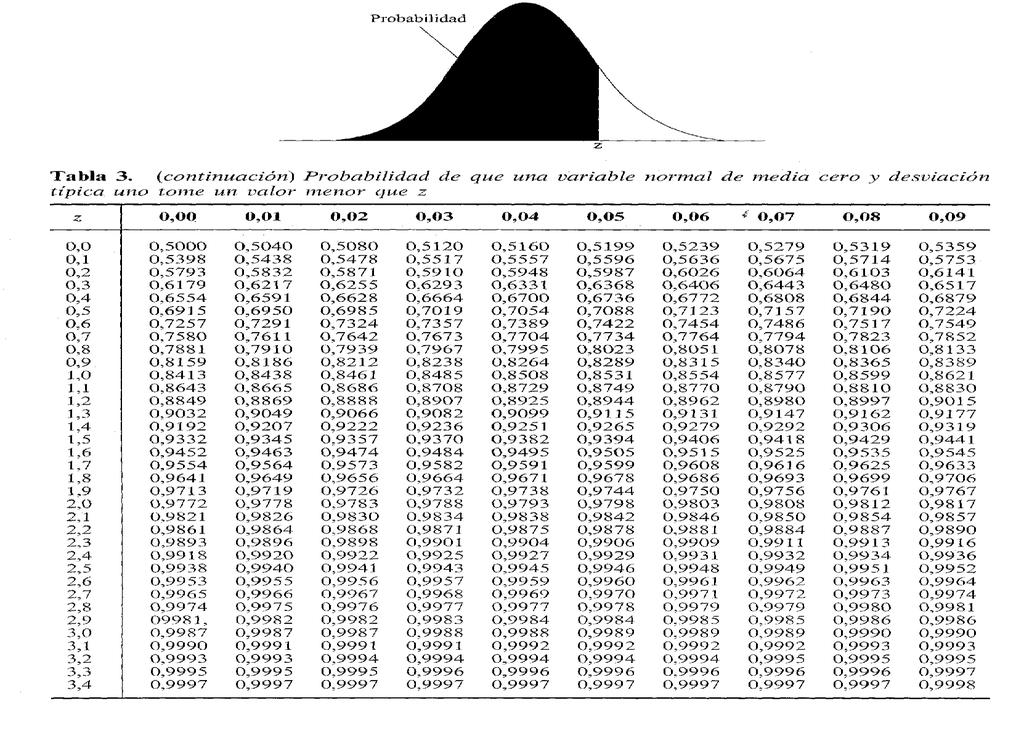
15 The standard normal distribution The normal distribution with mean 0 and standard deviation 1 is called the standard normal distribution. There are tables which allow us to calculate the probabilities for this distribution, N(0,1). If we have a normal r.v., X with mean and standard deviation we can convert this to a standard, N(0,1) r.v. using the transformation: Z X
16 Examples Let Z ~ N(0,1). Calculate the following probabilities P(Z < -1) P(Z > 1) P(-1,5 < Z < 2) Calculate the 90%, 95%, 97,5% and 99% percentiles of the standard normal distribution. (These values are useful in the next chapter) Let X ~ N(2,4). Calculate the following probabilities P(X < 0) P(-1 < X < 1)
17
18

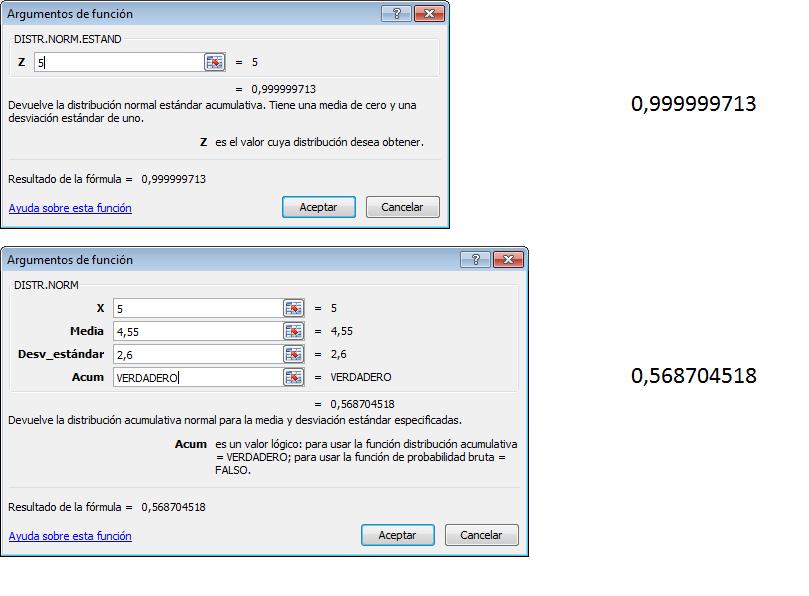
19 It is easier to do the calculations with Excel Calculation with Excel with the standard normal or directly with the original distribution.
20 Approximation of the binomial distribution using a normal When n is large enough, the binomial distribution, X~B(n, p), looks like a normal distribution, N np, np(1 p) The approximation is usually considered to be good if np > 5 and n(1-p) > 5. EXAMPLE We throw a fair coin in the air 400 times. What is the probability of getting between 180 and 210 heads?
21 The exact solution using Excel for the binomial distribution is 0,833. The estimated solution using the normal approximation is 0,819. This can be improved with a continuity correction and then the exact and approximate solutions are equal to 3 decimal places, but if we have Excel, why should we use an approximation? We will see in the next chapter.
22 Example (Test) According to the last CIS survey, the mean level of satisfaction with Mariano Rajoy is 3,09 with standard deviation 2,5. If these evaluations follow a normal distribution and a person is chosen at random, then the probability that they give Rajoy a rating of less than 3,09 is: a) 0,5. b) 0. c) d) 1.

23 Example (Test) The inflation rate follows a normal distribution with mean 1 and variance 4. Which of the following Excel formulas gives the probability that inflation will be negative?
24 Example: (Exam) The following table records the ratings of the government ministers in the last CIS survey: a) Supposing that the ratings of Chacón in Spain follow a normal distribution with mean 4,55 and standard deviation 2,6, calculate the probability that a Spaniard rates her below 4,55. b) For a set of three Spanish people, what is they probability that they all rate her below 5?* c) The lowest mean rated minister is González Sinde. If her ratings are normally distributed, calculate the probability that a randomly chosen Spaniard rates her exactly 5. *See the next slide.
25
A random variable (r. v.) is a variable whose value is a numerical outcome of a random phenomenon.
 is a variable whose value is a numerical outcome of a random phenomenon.") Chapter 14: random variables p394 A random variable (r. v.) is a variable whose value is a numerical outcome of a random phenomenon. Consider the experiment of tossing a coin. Define a random variable
Chapter 14: random variables p394 A random variable (r. v.) is a variable whose value is a numerical outcome of a random phenomenon. Consider the experiment of tossing a coin. Define a random variable
Section 7.5 The Normal Distribution. Section 7.6 Application of the Normal Distribution
 Section 7.6 Application of the Normal Distribution A random variable that may take on infinitely many values is called a continuous random variable. A continuous probability distribution is defined by
Chapter 3 Discrete Random Variables and Probability Distributions
 Chapter 3 Discrete Random Variables and Probability Distributions Part 3: Special Discrete Random Variable Distributions Section 3.5 Discrete Uniform Section 3.6 Bernoulli and Binomial Others sections
A random variable (r. v.) is a variable whose value is a numerical outcome of a random phenomenon.
 is a variable whose value is a numerical outcome of a random phenomenon.") Chapter 14: random variables p394 A random variable (r. v.) is a variable whose value is a numerical outcome of a random phenomenon. Consider the experiment of tossing a coin. Define a random variable
Chapter 14: random variables p394 A random variable (r. v.) is a variable whose value is a numerical outcome of a random phenomenon. Consider the experiment of tossing a coin. Define a random variable
Chapter 8. Variables. Copyright 2004 Brooks/Cole, a division of Thomson Learning, Inc.
 Chapter 8 Random Variables Copyright 2004 Brooks/Cole, a division of Thomson Learning, Inc. 8.1 What is a Random Variable? Random Variable: assigns a number to each outcome of a random circumstance, or,
Week 1 Variables: Exploration, Familiarisation and Description. Descriptive Statistics.
 Week 1 Variables: Exploration, Familiarisation and Description. Descriptive Statistics. Convergent validity: the degree to which results/evidence from different tests/sources, converge on the same conclusion.
Binomial Random Variables. Binomial Random Variables
 Bernoulli Trials Definition A Bernoulli trial is a random experiment in which there are only two possible outcomes - success and failure. 1 Tossing a coin and considering heads as success and tails as
2011 Pearson Education, Inc
 Statistics for Business and Economics Chapter 4 Random Variables & Probability Distributions Content 1. Two Types of Random Variables 2. Probability Distributions for Discrete Random Variables 3. The Binomial
Lecture 8. The Binomial Distribution. Binomial Distribution. Binomial Distribution. Probability Distributions: Normal and Binomial
 Lecture 8 The Binomial Distribution Probability Distributions: Normal and Binomial 1 2 Binomial Distribution >A binomial experiment possesses the following properties. The experiment consists of a fixed
Discrete Random Variables and Probability Distributions. Stat 4570/5570 Based on Devore s book (Ed 8)
") 3 Discrete Random Variables and Probability Distributions Stat 4570/5570 Based on Devore s book (Ed 8) Random Variables We can associate each single outcome of an experiment with a real number: We refer
3 Discrete Random Variables and Probability Distributions Stat 4570/5570 Based on Devore s book (Ed 8) Random Variables We can associate each single outcome of an experiment with a real number: We refer
Math 361. Day 8 Binomial Random Variables pages 27 and 28 Inv Do you have ESP? Inv. 1.3 Tim or Bob?
 Math 361 Day 8 Binomial Random Variables pages 27 and 28 Inv. 1.2 - Do you have ESP? Inv. 1.3 Tim or Bob? Inv. 1.1: Friend or Foe Review Is a particular study result consistent with the null model? Learning
AMS7: WEEK 4. CLASS 3
 AMS7: WEEK 4. CLASS 3 Sampling distributions and estimators. Central Limit Theorem Normal Approximation to the Binomial Distribution Friday April 24th, 2015 Sampling distributions and estimators REMEMBER:
CH 5 Normal Probability Distributions Properties of the Normal Distribution
 Properties of the Normal Distribution Example A friend that is always late. Let X represent the amount of minutes that pass from the moment you are suppose to meet your friend until the moment your friend
Business Statistics 41000: Probability 3
 Business Statistics 41000: Probability 3 Drew D. Creal University of Chicago, Booth School of Business February 7 and 8, 2014 1 Class information Drew D. Creal Email: dcreal@chicagobooth.edu Office: 404
ME3620. Theory of Engineering Experimentation. Spring Chapter III. Random Variables and Probability Distributions.
 ME3620 Theory of Engineering Experimentation Chapter III. Random Variables and Probability Distributions Chapter III 1 3.2 Random Variables In an experiment, a measurement is usually denoted by a variable
VIDEO 1. A random variable is a quantity whose value depends on chance, for example, the outcome when a die is rolled.
 Part 1: Probability Distributions VIDEO 1 Name: 11-10 Probability and Binomial Distributions A random variable is a quantity whose value depends on chance, for example, the outcome when a die is rolled.
Section Introduction to Normal Distributions
 Section 6.1-6.2 Introduction to Normal Distributions 2012 Pearson Education, Inc. All rights reserved. 1 of 105 Section 6.1-6.2 Objectives Interpret graphs of normal probability distributions Find areas
Homework: Due Wed, Nov 3 rd Chapter 8, # 48a, 55c and 56 (count as 1), 67a
, 67a") Homework: Due Wed, Nov 3 rd Chapter 8, # 48a, 55c and 56 (count as 1), 67a Announcements: There are some office hour changes for Nov 5, 8, 9 on website Week 5 quiz begins after class today and ends at
Homework: Due Wed, Nov 3 rd Chapter 8, # 48a, 55c and 56 (count as 1), 67a Announcements: There are some office hour changes for Nov 5, 8, 9 on website Week 5 quiz begins after class today and ends at
Business Statistics 41000: Probability 4
 Business Statistics 41000: Probability 4 Drew D. Creal University of Chicago, Booth School of Business February 14 and 15, 2014 1 Class information Drew D. Creal Email: dcreal@chicagobooth.edu Office:
ECON 214 Elements of Statistics for Economists 2016/2017
 ECON 214 Elements of Statistics for Economists 2016/2017 Topic The Normal Distribution Lecturer: Dr. Bernardin Senadza, Dept. of Economics bsenadza@ug.edu.gh College of Education School of Continuing and
Topic 6 - Continuous Distributions I. Discrete RVs. Probability Density. Continuous RVs. Background Reading. Recall the discrete distributions
 Topic 6 - Continuous Distributions I Discrete RVs Recall the discrete distributions STAT 511 Professor Bruce Craig Binomial - X= number of successes (x =, 1,...,n) Geometric - X= number of trials (x =,...)
Introduction to Statistics I
 Introduction to Statistics I Keio University, Faculty of Economics Continuous random variables Simon Clinet (Keio University) Intro to Stats November 1, 2018 1 / 18 Definition (Continuous random variable)
Lecture 23. STAT 225 Introduction to Probability Models April 4, Whitney Huang Purdue University. Normal approximation to Binomial
 Lecture 23 STAT 225 Introduction to Probability Models April 4, 2014 approximation Whitney Huang Purdue University 23.1 Agenda 1 approximation 2 approximation 23.2 Characteristics of the random variable:
Normal Distribution. Notes. Normal Distribution. Standard Normal. Sums of Normal Random Variables. Normal. approximation of Binomial.
 Lecture 21,22, 23 Text: A Course in Probability by Weiss 8.5 STAT 225 Introduction to Probability Models March 31, 2014 Standard Sums of Whitney Huang Purdue University 21,22, 23.1 Agenda 1 2 Standard
Example. Chapter 8 Probability Distributions and Statistics Section 8.1 Distributions of Random Variables
 Chapter 8 Probability Distributions and Statistics Section 8.1 Distributions of Random Variables You are dealt a hand of 5 cards. Find the probability distribution table for the number of hearts. Graph
MA : Introductory Probability
 MA 320-001: Introductory Probability David Murrugarra Department of Mathematics, University of Kentucky http://www.math.uky.edu/~dmu228/ma320/ Spring 2017 David Murrugarra (University of Kentucky) MA 320:
Examples: Random Variables. Discrete and Continuous Random Variables. Probability Distributions
 Random Variables Examples: Random variable a variable (typically represented by x) that takes a numerical value by chance. Number of boys in a randomly selected family with three children. Possible values:
Statistics 6 th Edition
 Statistics 6 th Edition Chapter 5 Discrete Probability Distributions Chap 5-1 Definitions Random Variables Random Variables Discrete Random Variable Continuous Random Variable Ch. 5 Ch. 6 Chap 5-2 Discrete
Chapter 3 Discrete Random Variables and Probability Distributions
 Chapter 3 Discrete Random Variables and Probability Distributions Part 4: Special Discrete Random Variable Distributions Sections 3.7 & 3.8 Geometric, Negative Binomial, Hypergeometric NOTE: The discrete
Chapter 3 - Lecture 5 The Binomial Probability Distribution
 Chapter 3 - Lecture 5 The Binomial Probability October 12th, 2009 Experiment Examples Moments and moment generating function of a Binomial Random Variable Outline Experiment Examples A binomial experiment
Bin(20,.5) and N(10,5) distributions
 and N(10,5) distributions") STAT 600 Design of Experiments for Research Workers Lab 5 { Due Thursday, November 18 Example Weight Loss In a dietary study, 14 of 0 subjects lost weight. If weight is assumed to uctuate up or down by
STAT 600 Design of Experiments for Research Workers Lab 5 { Due Thursday, November 18 Example Weight Loss In a dietary study, 14 of 0 subjects lost weight. If weight is assumed to uctuate up or down by
Discrete Probability Distribution
 1 Discrete Probability Distribution Key Definitions Discrete Random Variable: Has a countable number of values. This means that each data point is distinct and separate. Continuous Random Variable: Has
The Normal Probability Distribution
 1 The Normal Probability Distribution Key Definitions Probability Density Function: An equation used to compute probabilities for continuous random variables where the output value is greater than zero
Chapter 6: Random Variables. Ch. 6-3: Binomial and Geometric Random Variables
 Chapter : Random Variables Ch. -3: Binomial and Geometric Random Variables X 0 2 3 4 5 7 8 9 0 0 P(X) 3???????? 4 4 When the same chance process is repeated several times, we are often interested in whether
Statistical Methods in Practice STAT/MATH 3379
 Statistical Methods in Practice STAT/MATH 3379 Dr. A. B. W. Manage Associate Professor of Mathematics & Statistics Department of Mathematics & Statistics Sam Houston State University Overview 6.1 Discrete
5.4 Normal Approximation of the Binomial Distribution
 5.4 Normal Approximation of the Binomial Distribution Bernoulli Trials have 3 properties: 1. Only two outcomes - PASS or FAIL 2. n identical trials Review from yesterday. 3. Trials are independent - probability
Chapter 6: Random Variables
 Chapter 6: Random Variables Section 6.1 Discrete and Continuous Random Variables The Practice of Statistics, 4 th edition For AP* STARNES, YATES, MOORE Chapter 6 Random Variables 6.1 Discrete and Continuous
Example 1: Identify the following random variables as discrete or continuous: a) Weight of a package. b) Number of students in a first-grade classroom
 Weight of a package. b) Number of students in a first-grade classroom") Section 5-1 Probability Distributions I. Random Variables A variable x is a if the value that it assumes, corresponding to the of an experiment, is a or event. A random variable is if it potentially can
Section 5-1 Probability Distributions I. Random Variables A variable x is a if the value that it assumes, corresponding to the of an experiment, is a or event. A random variable is if it potentially can
MAKING SENSE OF DATA Essentials series
 MAKING SENSE OF DATA Essentials series THE NORMAL DISTRIBUTION Copyright by City of Bradford MDC Prerequisites Descriptive statistics Charts and graphs The normal distribution Surveys and sampling Correlation
STOR 155 Introductory Statistics (Chap 5) Lecture 14: Sampling Distributions for Counts and Proportions
 Lecture 14: Sampling Distributions for Counts and Proportions") The UNIVERSITY of NORTH CAROLINA at CHAPEL HILL STOR 155 Introductory Statistics (Chap 5) Lecture 14: Sampling Distributions for Counts and Proportions 5/31/11 Lecture 14 1 Statistic & Its Sampling Distribution
The UNIVERSITY of NORTH CAROLINA at CHAPEL HILL STOR 155 Introductory Statistics (Chap 5) Lecture 14: Sampling Distributions for Counts and Proportions 5/31/11 Lecture 14 1 Statistic & Its Sampling Distribution
The binomial distribution p314
 The binomial distribution p314 Example: A biased coin (P(H) = p = 0.6) ) is tossed 5 times. Let X be the number of H s. Fine P(X = 2). This X is a binomial r. v. The binomial setting p314 1. There are
Econ 250 Fall Due at November 16. Assignment 2: Binomial Distribution, Continuous Random Variables and Sampling
 Econ 250 Fall 2010 Due at November 16 Assignment 2: Binomial Distribution, Continuous Random Variables and Sampling 1. Suppose a firm wishes to raise funds and there are a large number of independent financial
Example - Let X be the number of boys in a 4 child family. Find the probability distribution table:
 Chapter8 Probability Distributions and Statistics Section 8.1 Distributions of Random Variables tthe value of the result of the probability experiment is a RANDOM VARIABLE. Example - Let X be the number
Chapter 6. The Normal Probability Distributions
 Chapter 6 The Normal Probability Distributions 1 Chapter 6 Overview Introduction 6-1 Normal Probability Distributions 6-2 The Standard Normal Distribution 6-3 Applications of the Normal Distribution 6-5
MATH 118 Class Notes For Chapter 5 By: Maan Omran
 MATH 118 Class Notes For Chapter 5 By: Maan Omran Section 5.1 Central Tendency Mode: the number or numbers that occur most often. Median: the number at the midpoint of a ranked data. Ex1: The test scores
Chapter 4 and 5 Note Guide: Probability Distributions
 Chapter 4 and 5 Note Guide: Probability Distributions Probability Distributions for a Discrete Random Variable A discrete probability distribution function has two characteristics: Each probability is
ECO220Y Continuous Probability Distributions: Normal Readings: Chapter 9, section 9.10
 ECO220Y Continuous Probability Distributions: Normal Readings: Chapter 9, section 9.10 Fall 2011 Lecture 8 Part 2 (Fall 2011) Probability Distributions Lecture 8 Part 2 1 / 23 Normal Density Function f
Statistics 511 Supplemental Materials
 Gaussian (or Normal) Random Variable In this section we introduce the Gaussian Random Variable, which is more commonly referred to as the Normal Random Variable. This is a random variable that has a bellshaped
Statistics Chapter 8
 Statistics Chapter 8 Binomial & Geometric Distributions Time: 1.5 + weeks Activity: A Gaggle of Girls The Ferrells have 3 children: Jennifer, Jessica, and Jaclyn. If we assume that a couple is equally
4 Random Variables and Distributions
 4 Random Variables and Distributions Random variables A random variable assigns each outcome in a sample space. e.g. called a realization of that variable to Note: We ll usually denote a random variable
Probability Distributions II
 Probability Distributions II Summer 2017 Summer Institutes 63 Multinomial Distribution - Motivation Suppose we modified assumption (1) of the binomial distribution to allow for more than two outcomes.
Probability Theory. Mohamed I. Riffi. Islamic University of Gaza
 Probability Theory Mohamed I. Riffi Islamic University of Gaza Table of contents 1. Chapter 2 Discrete Distributions The binomial distribution 1 Chapter 2 Discrete Distributions Bernoulli trials and the
ECON 214 Elements of Statistics for Economists
 ECON 214 Elements of Statistics for Economists Session 7 The Normal Distribution Part 1 Lecturer: Dr. Bernardin Senadza, Dept. of Economics Contact Information: bsenadza@ug.edu.gh College of Education
LECTURE 6 DISTRIBUTIONS
 LECTURE 6 DISTRIBUTIONS OVERVIEW Uniform Distribution Normal Distribution Random Variables Continuous Distributions MOST OF THE SLIDES ADOPTED FROM OPENINTRO STATS BOOK. NORMAL DISTRIBUTION Unimodal and
Probability Theory and Simulation Methods. April 9th, Lecture 20: Special distributions
 April 9th, 2018 Lecture 20: Special distributions Week 1 Chapter 1: Axioms of probability Week 2 Chapter 3: Conditional probability and independence Week 4 Chapters 4, 6: Random variables Week 9 Chapter
Discrete Probability Distributions
 Page 1 of 6 Discrete Probability Distributions In order to study inferential statistics, we need to combine the concepts from descriptive statistics and probability. This combination makes up the basics
The Binomial and Geometric Distributions. Chapter 8
 The Binomial and Geometric Distributions Chapter 8 8.1 The Binomial Distribution A binomial experiment is statistical experiment that has the following properties: The experiment consists of n repeated
Statistics and Probability
 Statistics and Probability Continuous RVs (Normal); Confidence Intervals Outline Continuous random variables Normal distribution CLT Point estimation Confidence intervals http://www.isrec.isb-sib.ch/~darlene/geneve/
Homework: Due Wed, Feb 20 th. Chapter 8, # 60a + 62a (count together as 1), 74, 82
, 74, 82") Announcements: Week 5 quiz begins at 4pm today and ends at 3pm on Wed If you take more than 20 minutes to complete your quiz, you will only receive partial credit. (It doesn t cut you off.) Today: Sections
Announcements: Week 5 quiz begins at 4pm today and ends at 3pm on Wed If you take more than 20 minutes to complete your quiz, you will only receive partial credit. (It doesn t cut you off.) Today: Sections
Chapter 7 1. Random Variables
 Chapter 7 1 Random Variables random variable numerical variable whose value depends on the outcome of a chance experiment - discrete if its possible values are isolated points on a number line - continuous
Mean of a Discrete Random variable. Suppose that X is a discrete random variable whose distribution is : :
 Dr. Kim s Note (December 17 th ) The values taken on by the random variable X are random, but the values follow the pattern given in the random variable table. What is a typical value of a random variable
Chpt The Binomial Distribution
 Chpt 5 5-4 The Binomial Distribution 1 /36 Chpt 5-4 Chpt 5 Homework p262 Applying the Concepts Exercises p263 1-11, 14-18, 23, 24, 26 2 /36 Objective Chpt 5 Find the exact probability for x successes in
 Problem A Grade x P(x) To get "C" 1 or 2 must be 1 0.05469 B A 2 0.16410 3 0.27340 4 0.27340 5 0.16410 6 0.05470 7 0.00780 0.2188 0.5468 0.2266 Problem B Grade x P(x) To get "C" 1 or 2 must 1 0.31150 be
3. The n observations are independent. Knowing the result of one observation tells you nothing about the other observations.
 Binomial and Geometric Distributions - Terms and Formulas Binomial Experiments - experiments having all four conditions: 1. Each observation falls into one of two categories we call them success or failure.
d) Find the standard deviation of the random variable X.
 Find the standard deviation of the random variable X.") Q 1: The number of students using Math lab per day is found in the distribution below. x 6 8 10 12 14 P(x) 0.15 0.3 0.35 0.1 0.1 a) Find the mean for this probability distribution. b) Find the variance
Q 1: The number of students using Math lab per day is found in the distribution below. x 6 8 10 12 14 P(x) 0.15 0.3 0.35 0.1 0.1 a) Find the mean for this probability distribution. b) Find the variance
ECON 214 Elements of Statistics for Economists 2016/2017
 ECON 214 Elements of Statistics for Economists 2016/2017 Topic Probability Distributions: Binomial and Poisson Distributions Lecturer: Dr. Bernardin Senadza, Dept. of Economics bsenadza@ug.edu.gh College
PROBABILITY DISTRIBUTIONS
 CHAPTER 3 PROBABILITY DISTRIBUTIONS Page Contents 3.1 Introduction to Probability Distributions 51 3.2 The Normal Distribution 56 3.3 The Binomial Distribution 60 3.4 The Poisson Distribution 64 Exercise
The normal distribution is a theoretical model derived mathematically and not empirically.
 Sociology 541 The Normal Distribution Probability and An Introduction to Inferential Statistics Normal Approximation The normal distribution is a theoretical model derived mathematically and not empirically.
CHAPTER 8 PROBABILITY DISTRIBUTIONS AND STATISTICS
 CHAPTER 8 PROBABILITY DISTRIBUTIONS AND STATISTICS 8.1 Distribution of Random Variables Random Variable Probability Distribution of Random Variables 8.2 Expected Value Mean Mean is the average value of
Math 14 Lecture Notes Ch The Normal Approximation to the Binomial Distribution. P (X ) = nc X p X q n X =
 = nc X p X q n X =") 6.4 The Normal Approximation to the Binomial Distribution Recall from section 6.4 that g A binomial experiment is a experiment that satisfies the following four requirements: 1. Each trial can have only
6.4 The Normal Approximation to the Binomial Distribution Recall from section 6.4 that g A binomial experiment is a experiment that satisfies the following four requirements: 1. Each trial can have only
Midterm Exam III Review
 Midterm Exam III Review Dr. Joseph Brennan Math 148, BU Dr. Joseph Brennan (Math 148, BU) Midterm Exam III Review 1 / 25 Permutations and Combinations ORDER In order to count the number of possible ways
Probability & Sampling The Practice of Statistics 4e Mostly Chpts 5 7
 Probability & Sampling The Practice of Statistics 4e Mostly Chpts 5 7 Lew Davidson (Dr.D.) Mallard Creek High School Lewis.Davidson@cms.k12.nc.us 704-786-0470 Probability & Sampling The Practice of Statistics
Statistics for Business and Economics
 Statistics for Business and Economics Chapter 5 Continuous Random Variables and Probability Distributions Ch. 5-1 Probability Distributions Probability Distributions Ch. 4 Discrete Continuous Ch. 5 Probability
Lecture Slides. Elementary Statistics Tenth Edition. by Mario F. Triola. and the Triola Statistics Series. Slide 1
 Lecture Slides Elementary Statistics Tenth Edition and the Triola Statistics Series by Mario F. Triola Slide 1 Chapter 6 Normal Probability Distributions 6-1 Overview 6-2 The Standard Normal Distribution
15.063: Communicating with Data Summer Recitation 3 Probability II
 15.063: Communicating with Data Summer 2003 Recitation 3 Probability II Today s Goal Binomial Random Variables (RV) Covariance and Correlation Sums of RV Normal RV 15.063, Summer '03 2 Random Variables
1/2 2. Mean & variance. Mean & standard deviation
 Question # 1 of 10 ( Start time: 09:46:03 PM ) Total Marks: 1 The probability distribution of X is given below. x: 0 1 2 3 4 p(x): 0.73? 0.06 0.04 0.01 What is the value of missing probability? 0.54 0.16
Model Paper Statistics Objective. Paper Code Time Allowed: 20 minutes
 Model Paper Statistics Objective Intermediate Part I (11 th Class) Examination Session 2012-2013 and onward Total marks: 17 Paper Code Time Allowed: 20 minutes Note:- You have four choices for each objective
Lecture 9. Probability Distributions. Outline. Outline
 Outline Lecture 9 Probability Distributions 6-1 Introduction 6- Probability Distributions 6-3 Mean, Variance, and Expectation 6-4 The Binomial Distribution Outline 7- Properties of the Normal Distribution
Probability Distributions for Discrete RV
 Probability Distributions for Discrete RV Probability Distributions for Discrete RV Definition The probability distribution or probability mass function (pmf) of a discrete rv is defined for every number
guessing Bluman, Chapter 5 2
 Bluman, Chapter 5 1 guessing Suppose there is multiple choice quiz on a subject you don t know anything about. 15 th Century Russian Literature; Nuclear physics etc. You have to guess on every question.
3. The n observations are independent. Knowing the result of one observation tells you nothing about the other observations.
 Binomial and Geometric Distributions - Terms and Formulas Binomial Experiments - experiments having all four conditions: 1. Each observation falls into one of two categories we call them success or failure.
What was in the last lecture?
 What was in the last lecture? Normal distribution A continuous rv with bell-shaped density curve The pdf is given by f(x) = 1 2πσ e (x µ)2 2σ 2, < x < If X N(µ, σ 2 ), E(X) = µ and V (X) = σ 2 Standard
Discrete Random Variables
 Discrete Random Variables In this chapter, we introduce a new concept that of a random variable or RV. A random variable is a model to help us describe the state of the world around us. Roughly, a RV can
Theoretical Foundations
 Theoretical Foundations Probabilities Monia Ranalli monia.ranalli@uniroma2.it Ranalli M. Theoretical Foundations - Probabilities 1 / 27 Objectives understand the probability basics quantify random phenomena
Lecture 9. Probability Distributions
 Lecture 9 Probability Distributions Outline 6-1 Introduction 6-2 Probability Distributions 6-3 Mean, Variance, and Expectation 6-4 The Binomial Distribution Outline 7-2 Properties of the Normal Distribution
Version A. Problem 1. Let X be the continuous random variable defined by the following pdf: 1 x/2 when 0 x 2, f(x) = 0 otherwise.
 = 0 otherwise.") Math 224 Q Exam 3A Fall 217 Tues Dec 12 Version A Problem 1. Let X be the continuous random variable defined by the following pdf: { 1 x/2 when x 2, f(x) otherwise. (a) Compute the mean µ E[X]. E[X] x
Math 224 Q Exam 3A Fall 217 Tues Dec 12 Version A Problem 1. Let X be the continuous random variable defined by the following pdf: { 1 x/2 when x 2, f(x) otherwise. (a) Compute the mean µ E[X]. E[X] x
4.2 Bernoulli Trials and Binomial Distributions
 Arkansas Tech University MATH 3513: Applied Statistics I Dr. Marcel B. Finan 4.2 Bernoulli Trials and Binomial Distributions A Bernoulli trial 1 is an experiment with exactly two outcomes: Success and
Objective: To understand similarities and differences between geometric and binomial scenarios and to solve problems related to these scenarios.
 AP Statistics: Geometric and Binomial Scenarios Objective: To understand similarities and differences between geometric and binomial scenarios and to solve problems related to these scenarios. Everything
Math 227 Elementary Statistics. Bluman 5 th edition
 Math 227 Elementary Statistics Bluman 5 th edition CHAPTER 6 The Normal Distribution 2 Objectives Identify distributions as symmetrical or skewed. Identify the properties of the normal distribution. Find
The Binomial Distribution
 The Binomial Distribution January 31, 2018 Contents The Binomial Distribution The Normal Approximation to the Binomial The Binomial Hypothesis Test Computing Binomial Probabilities in R 30 Problems The
chapter 13: Binomial Distribution Exercises (binomial)13.6, 13.12, 13.22, 13.43
13.6, 13.12, 13.22, 13.43") chapter 13: Binomial Distribution ch13-links binom-tossing-4-coins binom-coin-example ch13 image Exercises (binomial)13.6, 13.12, 13.22, 13.43 CHAPTER 13: Binomial Distributions The Basic Practice of Statistics
chapter 13: Binomial Distribution ch13-links binom-tossing-4-coins binom-coin-example ch13 image Exercises (binomial)13.6, 13.12, 13.22, 13.43 CHAPTER 13: Binomial Distributions The Basic Practice of Statistics
Chapter 4 Probability Distributions
 Slide 1 Chapter 4 Probability Distributions Slide 2 4-1 Overview 4-2 Random Variables 4-3 Binomial Probability Distributions 4-4 Mean, Variance, and Standard Deviation for the Binomial Distribution 4-5
The Binomial Distribution
 The Binomial Distribution January 31, 2019 Contents The Binomial Distribution The Normal Approximation to the Binomial The Binomial Hypothesis Test Computing Binomial Probabilities in R 30 Problems The
No, because np = 100(0.02) = 2. The value of np must be greater than or equal to 5 to use the normal approximation.
 = 2. The value of np must be greater than or equal to 5 to use the normal approximation.") 1) If n 100 and p 0.02 in a binomial experiment, does this satisfy the rule for a normal approximation? Why or why not? No, because np 100(0.02) 2. The value of np must be greater than or equal to 5 to
1) If n 100 and p 0.02 in a binomial experiment, does this satisfy the rule for a normal approximation? Why or why not? No, because np 100(0.02) 2. The value of np must be greater than or equal to 5 to
Lesson 97 - Binomial Distributions IBHL2 - SANTOWSKI
 Lesson 97 - Binomial Distributions IBHL2 - SANTOWSKI Opening Exercise: Example #: (a) Use a tree diagram to answer the following: You throwing a bent coin 3 times where P(H) = / (b) THUS, find the probability
Opening Exercise: Lesson 91 - Binomial Distributions IBHL2 - SANTOWSKI
 08-0- Lesson 9 - Binomial Distributions IBHL - SANTOWSKI Opening Exercise: Example #: (a) Use a tree diagram to answer the following: You throwing a bent coin times where P(H) = / (b) THUS, find the probability
Binomal and Geometric Distributions
 Binomal and Geometric Distributions Sections 3.2 & 3.3 Cathy Poliak, Ph.D. cathy@math.uh.edu Office in Fleming 11c Department of Mathematics University of Houston Lecture 7-2311 Cathy Poliak, Ph.D. cathy@math.uh.edu
The Binomial Probability Distribution
 The Binomial Probability Distribution MATH 130, Elements of Statistics I J. Robert Buchanan Department of Mathematics Fall 2017 Objectives After this lesson we will be able to: determine whether a probability
Lecture 6: Chapter 6
 Lecture 6: Chapter 6 C C Moxley UAB Mathematics 3 October 16 6.1 Continuous Probability Distributions Last week, we discussed the binomial probability distribution, which was discrete. 6.1 Continuous Probability
Chapter 7. Sampling Distributions and the Central Limit Theorem
 Chapter 7. Sampling Distributions and the Central Limit Theorem 1 Introduction 2 Sampling Distributions related to the normal distribution 3 The central limit theorem 4 The normal approximation to binomial