Corporate Presentation. September 2015
|
|
|
- Jeffry Mosley
- 5 years ago
- Views:
Transcription
1 Corporate Presentation September 2015
2 Future Oriented Information (See additional advisories at the end of this document) In the interest of providing information regarding Paramount Resources Ltd. ("Paramount" or the "Company") and its future plans and operations, this presentation contains certain forward-looking information and forward-looking statements. The projections, estimates and forecasts contained in such forward-looking information and statements necessarily involve a number of assumptions, and are subject to both known and unknown risks and uncertainties that may cause the Company's actual performance and financial results in future periods to differ materially from these projections, estimates or forecasts. The Advisories Appendix lists some of the material assumptions, risks and uncertainties that these projections, estimates and forecasts are based on and are subject to. Accordingly, shareholders and potential investors are cautioned that events or circumstances could cause actual results to differ materially from those predicted. Any use of information contained in this presentation is expressly forbidden. 2

3 Corporate Profile Corporate Profile Founded in 1974; IPO in 1978 TSX: POU Market Cap: MM $13.00/share ~ $1.4 Billion ~50% insider ownership Net Debt (June 30, 2015): $1.7 Billion 2015 Capital Guidance: $400 MM Low Risk/Repeatable Growth Operations focused on large-scale Deep Basin development Large contiguous acreage Multi-zone potential High condensate/gas ratios Owned and firm service access to infrastructure Significant near-term growth in production and cash flow Average 56,000 Boe/d for H Production mix evolving to ~50% liquids Strategic Investments Exposure to emerging plays: Duvernay Oil sands Liard Basin shale gas (1) Average sales volumes for July
 ~5 + Bcf")
 Potential conventional Devonian exploration Potential Duvernay Shale rock play *Graphic courtesy of www.")
 Internal estimates: EUR denotes Estimated Ultimate Recovery, DGIIP denotes Discovered Gas Initially In Place.")
4 Deep Basin Resource Paramount Acreage (gross): 500 Sections Cretaceous Rights 364 Sections Montney Rights 209 Sections Duvernay Rights Deep Basin liquids-rich gas resources in multiple stacked horizons Bcf/section DGIIP (1) ~5 + Bcf EUR/Hz well (1) >10 Tcf DGIIP + NGLs net to POU (1) Liquids-rich Montney gas play ~70 + Bcf/section DGIIP (1) ~ 22 Tcf DGIIP + NGLs net to POU (1) Potential conventional Devonian exploration Potential Duvernay Shale rock play *Graphic courtesy of (1) Internal estimates: EUR denotes Estimated Ultimate Recovery, DGIIP denotes Discovered Gas Initially In Place. Please refer to "Oil and Gas Measures and Definitions" in the Advisories section of this presentation for further information. 4
 at 6.2 MPa IP: 8.3 MMcf/d Cost: $8.")
 at 20.8 MPa IP: 12.0 MMcf/d Cost: $8.")

5 Cretaceous Gas Resource Hz Dunvegan well at Resthaven Tested 11.3 MMcf/d(1) at 6.2 MPa IP: 8.3 MMcf/d Cost: $8.3 MM d/c/t in 2010 Hz Falher well at Musreau Tested 16.4 MMcf/d(1) at 20.8 MPa IP: 12.0 MMcf/d Cost: $8.6 MM d/c/t in 2010 (1) Please refer to the heading "Test Results" in the Advisories section of this presentation for further information 5
 (1) : 17 Bbl/MMcf C2-C4 NGLs: 61 Bbl/MMcf Deep Cut Facility Economics (2) @")
 Please refer to the heading Well Economics in the Advisories section of this presentation for further")
6 Cretaceous Economics Assumptions Capital: $7.0 MM horizontal well IP 30 : 9.0 MMcf/d Natural Gas (raw): 4.9 Bcf Raw Condensate Gas Ratio (CGR) (1) : 17 Bbl/MMcf C2-C4 NGLs: 61 Bbl/MMcf Deep Cut Facility Economics $2.75 AECO US$45.00 WTI NPV 10% $ 1.6 MM IRR 23% Payout (Years) 2.9 P/I (1) 1.2 (1) Please refer to the heading Well Economics in the Advisories section of this presentation for further information (2) Excludes processing capital fees 6

 Bbl/MMcf Total Boe/d Wells IP 30 4.")


7 Montney Gas Resource Liquids-rich Montney gas play; Paramount holds ~315 net sections of Montney rights Musreau Montney Wells Natural Gas (1) MMcf/d Wellhead Liquids (1) Bbl/d CGR (1) Bbl/MMcf Total Boe/d Wells IP , IP IP Wells < 30 days onstream and wells in progress 36 Total Musreau Montney Wells 73 Karr Montney Wells Natural Gas (1) MMcf/d Wellhead Liquids (1) Bbl/d CGR (1) Bbl/MMcf Total Boe/d Wells IP IP IP Wells < 30 days onstream and wells in progress 2 Total Karr Montney Wells 19 (1) Please refer to the heading Musreau and Karr CGRs in the Advisories section of this presentation for further information 7

 3.5 2.2 P/I (1) 1.1 1.")
8 Montney "Rich" Well Economics "Rich" Montney Wells (1) IP 30 IP 90 IP 180 Gas MMcf/d Liquids Bbl/d CGR Bbl/MMcf Total Boe/d ,460 1, Wells < 30 days onstream and wells in progress Total Wells Assumptions Capital: $9.2 MM horizontal 1-mile lateral well IP30: 5.1 MMcf/d Natural Gas (raw): 3.0 Bcf Raw Condensate Gas Ratio (CGR)(1): 120 Bbl/MMcf (IP) (77 Bbl/MMcf lifetime average) C2-C4 NGLs: 90 Bbl/MMcf through Deep Cut Facility $2.75 AECO US$45.00 WTI US$65.00 WTI $ 1.3 MM $5.1 MM 18% 43% Payout (Years) P/I (1) NPV 10% IRR (1) Please refer to the headings Well Economics and Musreau and Karr CGRs in the Advisories section of this presentation for further information (2) Excludes processing capital fees 8
: 2.")
 2.3 1.4 P/I (1) 1.5 2.")
9 Montney "Ultra Rich" Well Economics "Ultra Rich" Montney Wells (1) Gas MMcf/d Liquids Bbl/d CGR (1) Bbl/MMcf Total Boe/d Wells IP ,187 8 IP IP Wells < 30 days onstream and wells in progress 19 Total 27 Assumptions Capital: $9.2 MM horizontal 1-mile lateral well IP 30 : 3.25 MMcf/d Natural Gas (raw): 2.0 Bcf Raw Condensate Gas Ratio (CGR) (1) : 320 Bbl/MMcf (IP) (192 Bbl/MMcf lifetime average) C2-C4 NGLs: 90 Bbl/MMcf through Deep Cut Facility Economics $2.75 AECO US$45.00 WTI US$65.00 WTI NPV 10% $ 4.1 MM $9.0 MM IRR 37% 80% Payout (Years) P/I (1) (1) Please refer to the headings Well Economics and Musreau and Karr CGRs in the Advisories section of this presentation for further information (2) Excludes processing capital fees 9
10 Montney Drilling/Completion Improvements Pad drilling/pad layout Bits/muds/motors Well design: monobores/orientation/reservoir placement Toe up/toe down: effects on production Natural gas fueled rigs Plug and perf/sliding sleeves Cemented liners/open-hole packers (ECP s) Frac sizing/spacing/clusters Frac fluid selection/fluid handling Pumping techniques Frac fluid recycling Proppants Flow back/production practices Working with material and service providers to reduce costs 10

 1.0 Mile (1,400 m) 1.")
11 Montney Well Cost Progression Key Points Expected Well Cost ($MM) ($MM) 1.0 Mile Lateral 1.5 Mile Lateral Drill $4.3 $5.1 Complete $3.9 $5.8 Equip/Tie in. $1.0 $1.0 Total $9.2 $ mile well cost reductions from 2014 to 2015: $0.5 MM in drilling costs due to price reductions $2.1 MM in completion costs largely due to $1.4 MM reduction in frac oil and additional savings of $0.7 MM from price reductions Switching to 125T foam water for 1.0 mile completions from 60T oil estimated to save additional $0.4 MM Cost per meter of lateral 1.0 vs. 1.5 mile: ($M) 1.0 Mile (1,400 m) 1.5 Mile (2,200 m) Drill $3,070 $2,320 Complete $2,760 $2,630 11
12 Musreau 2015 Capex: $250 MM Drill 19 (19 net) horizontal Montney wells Drill 5 Cretaceous horizontal/directional wells Completed amine plant Completed condensate stabilizer expansion: $18 MM Musreau gathering system expansion: $31 MM 12
13 Karr 2015 Capex: $75 MM Multi-zone potential, including Halfway, Montney sour and Gething, Bluesky, Falher sweet commingled gas Current plant and gathering systems 40 MMcf/d; expanding by 40 MMcf/d in : Drill 6 (5.5 net) horizontal Montney wells Gathering System/Facility expansion: $15MM 13

")


 Please")

14 Deep Basin Processing Capacity Gross Raw Gas Capacity MMcf/d Net POU Raw Gas Capacity MMcf/d Potential Sales Volumes Boe/d (1) Musreau Deep Cut Facility ,000 Musreau Refrig Facility ,500 Smoky Deep Cut Facility ,000 Karr Capacity ,000 Other Musreau area capacity ,400 Stabilizer Expansion ,000 Subtotal ,900 Future Capacity Karr Expansion , Plant , Plant ,000 Subtotal ,000 Projected Total ,900 (1) Please refer to the heading Potential Sales Volumes in the Advisories section for further information. 14

15 Deep Basin Processing Capacity (1) (1) Please refer to the heading Deep Basin Processing Capacity in the Advisories section for further information. 15

16 Paramount Production History 16
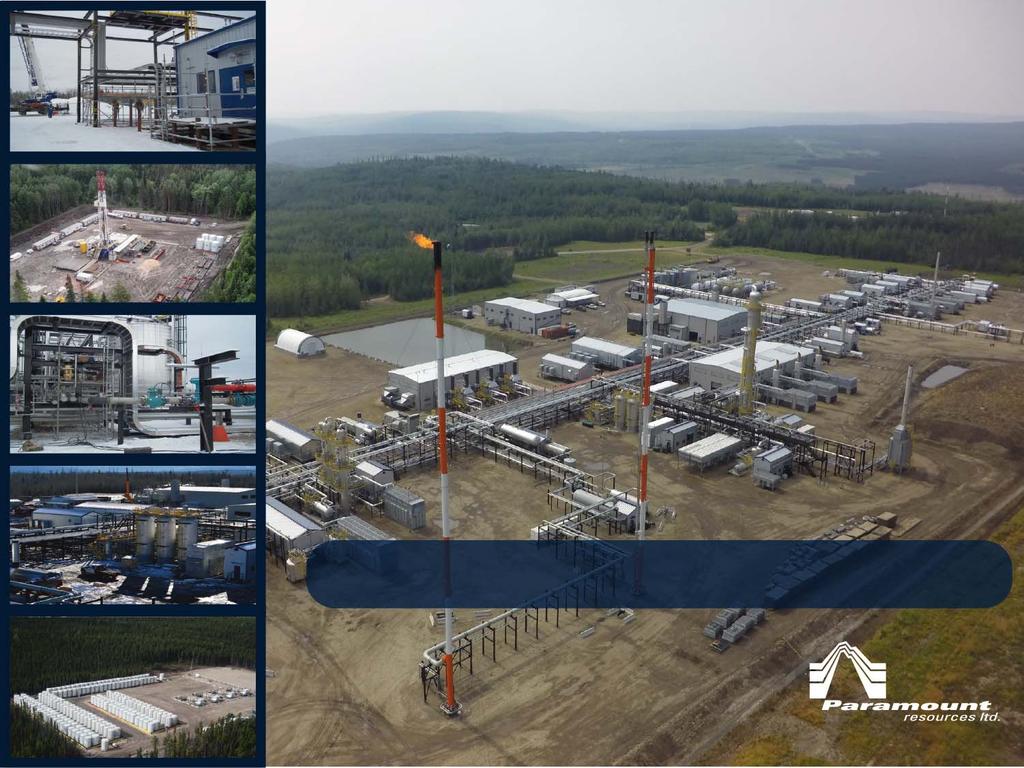
17 October 13, 2014 Musreau 8-13 Complex
18 Illustrative Deep-Cut - Montney Wells 200 MMcf/d x 23% Shrinkage = 154 MMcf/d Sales Gas (25,667 Boe/d) + 22,000 Bbl/d condensate + 18,000 Bbl/d NGLs Price (1) Deep-Cut Sales Gas $2.75/Mcf Yield Bbl/MMcf 154 MMcf/d $423,500 Condensate $65.00/Bbl ,000 Bbl/d $1,430,000 Butane $35.00/Bbl ,500 Bbl/d $87,500 Propane $10.00/Bbl 25 5,000 Bbl/d $50,000 Ethane $10.00/Bbl ,500 Bbl/d $105,000 Total: 65,667 Boe/d $2,096,000/day Royalty 5% ($104,800/day) Operating Cost ($3.00/Boe) ($197,000/day) Total: (1) Net of transportation 24.0 MMBoe/year $1,794,200/day $655 MM/year $27.29/Boe 18
19 Paramount Deep-Cut Montney - Illustrative Project Economics Paramount s shallow rights will add substantially to the RLI Paramount has de-risked a substantial amount of its land base and thus could have the potential to add a series of refrigeration or deep cut plants Simple Payout from free cash flow after start up is less than two years Resource Needed: 200 MMcf/d x 365 ~ 73 Bcf/year x 10 year RLI = 730 Bcf 70 ~ 50% recovery = ~ 20 Sections Cost 60 (5 MMcf/d wells) x $10 MM/well = $600 MM Gas Plant = $250 MM Total: $850 MM Annual Deep - Cut Cash Flow Annual Capital = 25 (3.0 Bcf) wells x $10 MM/well Free Cash Flow $655 MM/year $250 MM/year $405 MM/year 19
 acres of land")
 Hz Duvernay wells to date:")

 in 2015; awaiting tie in")

20 Willesden Green Duvernay Shale Play 64,452 (34,305 net) acres of land Drilled and completed 3 (2.5 net) Hz Duvernay wells to date: 03/ W5: > 1,000 Bbl/MMcf W5: > 200 Bbl/MMcf Drilled and completed W5 (0.5 net) in 2015; awaiting tie in Currently drilling W5 Paramount has explored for ideal combinations of rock quality/liquids ratio/pressure gradient 20
 Doig rights Montney/Doig Play 16 wells tied in at")
 Doig wells tested 2.")

 Seven Hz Montney wells to date NGL yields")
 Please refer to the heading \"Test Results\" in the")

21 Montney Valhalla: ~65 sections (~49 net) Montney/~60 sections (~44 net) Doig rights Montney/Doig Play 16 wells tied in at restricted rates (midstream constraints) Montney wells tested MMcf/d + NGLs/Condensate (1) Doig wells tested MMcf/d + NGLs/Condensate (1) Evaluating long term production/economics to determine future investment levels Birch: ~67 sections (~34 net) Montney rights Montney shale play (50% WI) Seven Hz Montney wells to date NGL yields average 60 Bbl/MMcf New 20 MMcf/d facility onstream September 2015 (1) Please refer to the heading "Test Results" in the Advisories section of this presentation for further information. (2) Based on results from Paramount's wells and publicly disclosed results of competitor wells. 21
22 Paramount Investments

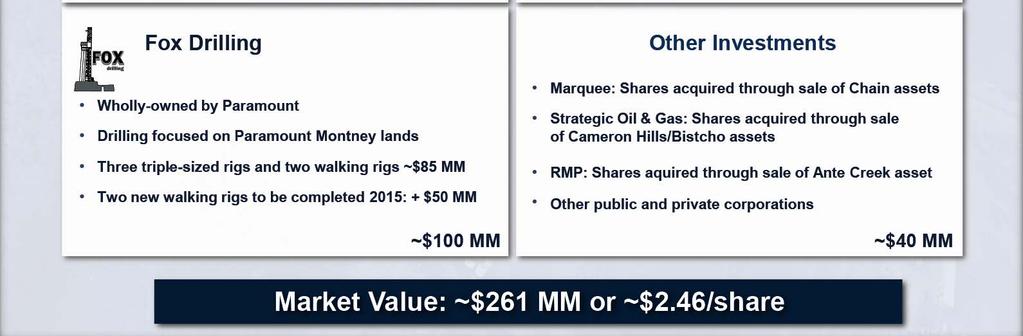
23 Paramount Investments 23
 As publicly")
24 Paramount 100% Subsidiary Investments (1) Independent evaluation by McDaniel & Associates Consultants Ltd. effective December 31, 2014 Please refer to "Oil Sands Measures and Definitions" in the Advisories section of this presentation for oil sands resources and related definitions (2) As publicly disclosed by a large U.S. public E&P company with significant landholdings in the Liard Basin. The resource evaluation disclosed by such E&P company was not noted as having been prepared independently or by a qualified reserves evaluator or auditor (as such terms are defined in NI ) or in accordance with the COGE Handbook. This information is relevant to Paramount s landholdings in the Liard Basin as the information is in respect of landholdings in the Liard Basin that are close to Paramount s lands and are, accordingly, likely to have similar geology. 24


25 Quarterly Operating Results 25

26 Simplified Illustrative Cash Flow H Sales Volumes 56,000 Boe/d 70,000 Boe/d 70,000 Boe/d CAPEX $81 MM $300 MM $300 MM WTI Price (US$/Bbl) $45/Bbl $70/Bbl $45/Bbl $70/Bbl $45/Bbl $70/Bbl EBITDA $159 MM $255 MM $434 MM $708 MM $434 MM $708 MM Long-Term Debt $1.8 B $1.7 B $1.8 B $1.4 B $1.7 B $1.1 B LTD/EBITDA (1) Credit facility utilization includes undrawn letters of credit 26

27 Conventional Reserves Columns may not add due to rounding. Conventional reserves only. Includes nominal amounts of estimated reserves in respect of Paramount's initial shale gas well at Patry, B.C. Reserves evaluated by McDaniel &Associates Consultants Ltd. in accordance with National Instrument definitions, standards and procedures. 27
28 Summary Exposure to significant reserve opportunities Deep Basin: Cretaceous, Montney Valhalla: Montney, Doig Birch: Montney Willesden Green: Duvernay Significant asset value Trilogy MEG Energy Cavalier Energy Liard Shale Gas Paramount continues to provide long-term value creation for shareholders 28
29 ADVISORIES APPENDIX
30 Advisories Forward-Looking Information Certain statements in this presentation constitute forward-looking information under applicable securities legislation. Forward-looking information typically contains statements with words such as "anticipate", "believe", "estimate", "will", "expect", "plan", "intend", "propose", or similar words suggesting future outcomes or an outlook. Forward looking information in this presentation includes, but is not limited to: projected production and sales volumes including the liquids component thereof; forecast capital expenditures; exploration, development and associated operational plans and strategies (including planned drilling and completion programs, well tie-ins and potential facility expansions and additions and the anticipated timing of such activities); reserves and resources estimates (including internal estimates of DGIIP, EUR and contingent resources related to Paramount's properties and the estimated net present values of reserves and resources); projected type well production profiles and associated net present value, internal rate of return and payout estimates (and the initial production rate, reserves, capital and operating cost, shrinkage, NGLs yield and NGLs pricing assumptions used to generate such profiles and estimates); forecast drilling and completion costs for new wells; projected timelines for, constructing, commissioning and/or starting-up new and expanded natural gas processing and associated facilities, and the Company's Deep Basin processing capacity following the completion of these facilities; illustrative deep-cut project economics (including the commodity price, royalty rate, capital and operating cost, production volume, NGLs yield, well reserves, reserve life index, cash flow and payout assumptions used therein); Paramount s potential ability to build and utilize additional processing facilities; projections of Paramount s utilized and unutilized bank credit facility and its ratio of long term debt to EBITDA (including the commodity price, capital expenditure, production volume and cash flow assumptions used therein); and general business strategies and objectives. Such forward-looking information is based on a number of assumptions which may prove to be incorrect. Assumptions have been made with respect to the following matters, in addition to any other assumptions identified in this presentation or Paramount s continuous disclosure documents: future natural gas, natural gas liquids (including condensate), oil and bitumen prices; royalty rates, taxes and capital, operating, general & administrative and other costs; foreign currency exchange rates and interest rates; general economic and business conditions; the ability of Paramount to obtain the required capital to finance its exploration, development and other operations; the ability of Paramount to obtain equipment, services, supplies and personnel in a timely manner and at an acceptable cost to carry out its activities; the ability of Paramount to secure adequate product processing, transportation, de-ethanization, fractionation and storage capacity on acceptable terms; the ability of Paramount to market its natural gas, natural gas liquids, oil and bitumen successfully to current and new customers; the ability of Paramount and its industry partners to obtain drilling success (including in respect of anticipated production volumes, reserves additions and liquids yields and resource recoveries) and operational improvements, efficiencies and results consistent with expectations; the timely receipt of required governmental and regulatory approvals; and anticipated timelines and budgets being met in respect of drilling programs and other operations (including well completions and tie-ins and the construction, commissioning and start-up of new and expanded facilities). Although Paramount believes that the expectations reflected in such forward looking information are reasonable, undue reliance should not be placed on them as Paramount can give no assurance that such expectations will prove to be correct. Forward-looking information is based on current expectations, estimates and projections that involve a number of risks and uncertainties which could cause actual results to differ materially from those anticipated by Paramount and described in the forward-looking information. These risks and uncertainties include and/or relate (but are not limited) to: 30
31 Advisories fluctuations in natural gas, natural gas liquids, oil and bitumen prices; changes in foreign currency exchange rates and interest rates; the uncertainty of estimates and projections relating to future revenue, future production, reserve additions, liquids (including condensate and natural gas ratios), resources recoveries, yields, royalty rates, taxes and costs and expenses; the ability to secure adequate product processing, transportation, deethanization, fractionation and storage capacity on acceptable terms; operational risks in exploring for, developing and producing natural gas, natural gas liquids, oil and bitumen; the ability to obtain equipment, services, supplies and personnel in a timely manner and at an acceptable cost; potential disruptions or unexpected technical or other difficulties in designing, developing, expanding or operating new, expanded or existing facilities (including third party facilities); industry wide processing, pipeline, de-ethanization, and fractionation infrastructure outages, disruptions and constraints; risks and uncertainties involving the geology of oil and gas deposits; the uncertainty of reserves and resources estimates (including internal estimates of DGIIP, EUR, and contingent resources); the ability to generate sufficient cash flow from operations and obtain financing at an acceptable cost to fund planned exploration, development and operational activities and meet current and future obligations (including costs of anticipated new and expanded facilities and other projects and product processing, transportation, de-ethanization, fractionation and similar commitments); changes in, or in the interpretation of, laws, regulations or policies (including environmental laws); the ability to obtain required governmental or regulatory approvals in a timely manner and to enter into and maintain leases and licenses; general business, economic and market conditions; the effects of weather; the timing and costs of future abandonment and reclamation obligations and potential liabilities for environmental damage and contamination; uncertainties regarding aboriginal claims and in maintaining relationships with local populations and other stakeholders; the outcome of existing and potential lawsuits, regulatory actions, audits and assessments; and other risks and uncertainties described elsewhere in this presentation and in Paramount s filings with Canadian securities authorities, including its Annual Information Form. The foregoing list of risks is not exhaustive. Additional information concerning these and other factors which could impact Paramount are included in Paramount s most recent Annual Information Form. The forward-looking information contained in this presentation is made as of the date hereof and, except as required by applicable securities law, Paramount undertakes no obligation to update publicly or revise any forward-looking statements or information, whether as a result of new information, future events or otherwise. Oil and Gas Measures and Definitions This presentation contains disclosure expressed as "Boe", "MMBoe" and "Boe/d". All oil and natural gas equivalency volumes have been derived using the ratio of six thousand cubic feet of natural gas to one barrel of oil. Equivalency measures may be misleading, particularly if used in isolation. A conversion ratio of six thousand cubic feet of natural gas to one barrel of oil is based on an energy equivalency conversion method primarily applicable at the burner tip and does not represent a value equivalency at the well head. During the six months ended June 30, 2015, the value ratio between crude oil and natural gas was approximately 23:1. This value ratio is significantly different from the energy equivalency ratio of 6:1. Using a 6:1 ratio would be misleading as an indication of value. Paramount has provided information with respect to certain of its plays and emerging opportunities which is "analogous information" as defined in NI This analogous information includes Paramount's internal estimates of DGIIP or EUR, all as defined in the Canadian Oil and Gas Evaluation Handbook ("COGEH") or by the Society of Petroleum Engineers - Petroleum Resources Management System ("SPE-PRMS"), and/or production type curves in respect of proved plus probable reserves. This analogous information is presented on a basin, sub-basin or area basis utilizing data derived from Paramount's internal sources, as well as from a variety of publicly available information sources which are predominantly independent in nature. These internal estimates are subject to the specific assumptions identified by Paramount in respect of such estimates plus other assumptions contained herein, and are not necessarily representative of the actual resources or production rates associated with Paramount's properties and wells. 31
32 Advisories Conventional reserve estimates include nominal amounts of volumes related to Paramount s completed shale gas well in the Liard Basin in British Columbia. The estimates of reserves for individual properties may not reflect the same confidence level as estimates of reserves for all properties, due to the effects of aggregation. Non-GAAP Measures In this presentation "Net Debt", "Funds Flow", "Free Cash Flow" and "EBITDA", collectively the non-gaap measures, are used and do not have any standardized meaning as prescribed by GAAP. Net Debt is a measure of a company's overall debt position after adjusting for certain working capital amounts and is used by Paramount s management to assess its overall leverage position. Funds flow refers to cash from operating activities before net changes in operating non-cash working capital, geological and geophysical expenses and asset retirement obligation settlements. Funds flow is commonly used in the oil and gas industry to assist management and investors in measuring a company s ability to fund capital programs and meet financial obligations. Free cash flow equals petroleum and natural gas sales less royalties, operating costs, transportation and processing costs and exploration and capital expenditures. EBITDA equals net loss: (i) before interest and financing expenses, share-based compensation, depreciation and depletion, exploration and evaluation expenses, gain or losses on the sale of oil and gas properties, accretion of asset retirement obligations, unrealized foreign exchange gains or losses, unrealized gains or losses on financial commodity contracts, write-downs of investments in securities, gains or losses on the sale of investments, income or loss from equity-accounted investments, income from discontinued operations and income tax expenses or recoveries; plus (ii) dividends from investees. EBITDA is commonly used to assist management and investors in measuring a company s ability to fund capital programs and meet financial obligations. Non-GAAP measures should not be considered in isolation or construed as alternatives to their most directly comparable measure calculated in accordance with GAAP, or other measures of financial performance calculated in accordance with GAAP. Non-GAAP measures are unlikely to be comparable to similar measures presented by other issuers. Test Results The test rates disclosed in this document represent the average rate of gas-flow during post clean-up production testing at the largest choke setting. The flow tests typically range from 4 to 55 hours in duration. Pressure transient analyses and well-test interpretations have not been carried out for any of these wells and, as such, all data should be considered preliminary until such analyses or interpretations have been done. Liquids yields have not been included in the test results as the bulk of the tested wells were fracture stimulated using frac oil with the result that substantially all liquids recovered during the test period were load fluid. Test results are not necessarily indicative of long-term performance or of ultimate recovery. Well Economics Condensate gas ratios ("CGRs") for wells are calculated by dividing total liquids produced at the wellhead by total raw natural gas produced at the wellhead. Sales volumes will be lower due to shrinkage. The term "P/I" refers to profitability index and is calculated by dividing estimated net cash flows (before tax, discounted at 10 percent) by capital invested (discounted at 10 percent). 32
33 Advisories cont d Musreau and Karr CGRs Production rates are the average gross volumes per day measured at the wellhead over the initial 30, 90 and 180 producing days commencing from the day after load oil volumes were completely recovered (the "Post-load Recovery Period"). CGRs were calculated for each well over the applicable Post-load Recovery Period by dividing total liquids volumes by total natural gas during such period. CGRs were calculated as of July 31, 2015 for the Musreau Montney wells and as of August 31, 2015 for the Karr-Gold Creek Montney wells. Onstream dates of wells range from January 2012 to May Potential Sales Volumes The term "Potential Sales Volumes" as used in the table on the "Deep Basin Processing Capacity" page, means the potential volumes of saleable natural gas and NGLs (expressed on a combined basis in Boe/d) that could result from processing the associated quantities of raw natural gas set out in the "Net POU Raw Gas Capacity" column in that table. These potential sales volumes should not be construed as a projection of Paramount's Deep Basin production at or by any particular date, as they will include some unavoidably commingled third-party production, and are subject to a number of factors and contingencies including the following: (a) production volumes sufficient to fill Paramount's capacity will not be available in all periods and under certain conditions; (b) during maintenance periods and at other times, the facilities will not operate at design capacity; and (c) NGLs sales volumes will vary depending on the liquids content of individual wells and the manner in which the facilities are operated. The potential sales volumes for each facility have been estimated assuming that natural gas processing and condensate stabilization capacity is fully utilized. Deep Basin Processing Capacity The term "Deep Basin Processing Capacity" as used in the table on the "Deep Basin Processing Capacity" page, means the aggregate capacity of the Company's owned and firm service natural gas and condensate processing facilities in the Alberta Deep Basin. These capacity estimates are subject to a number of assumptions and risks and should not be construed as projections of Paramount's Deep Basin area production volumes at or by any particular date or dates. The Company's net sales volumes will be lower than the capacity shown because of a number of factors including, but not limited to: (a) some unavoidably commingled third-party volumes will be processed using Paramount capacity; (b) the liquids content of wells will vary; (c) production volumes sufficient to fill capacity will not be available in all periods and under certain conditions; and (d) during maintenance periods and at other times, the facilities will not operate at design capacity. Capacity increases are shown at the mid-point of the period in which new facilities and facilities expansions are scheduled to be completed. However, the completion of such facilities may occur at any point during such period or may occur in a different period and the actual ramp-up will be different than depicted. 33
34 Advisories cont d Oil Sands Measures and Definitions "Contingent resources (development pending)" are those quantities of bitumen resources that are estimated, as of a given date, to be potentially recoverable from known accumulations using established technology but which are classified as resources rather than reserves due to one or more non-technical contingencies (such as the absence of detailed design estimates) which can be expected to be resolved within a reasonable time frame. Once these non-technical contingencies are removed, these resources will be re-classified as reserves. Specifically, low, best and high estimates of contingent resources will become proved, probable and possible reserves respectively. "Economic contingent resources" are a sub-category of contingent bitumen resources that are considered to be currently economically recoverable based on the reserves evaluator s then current forecasts of commodity prices and costs. "Best estimate" is considered to be the best estimate of the quantity of contingent resources that will actually be recovered. It is equally likely that the quantities recovered will be greater or less than the best estimate (or stated another way, there is a 50 percent confidence level that the actual quantities recovered will equal or exceed the best estimate amount). "Net present value" or "NPV" of Cavalier s economic contingent resources at Hoole represents McDaniel s estimates of Cavalier s share of future net revenues, before the deduction of income taxes, from these reserves and resources discounted at 10%. In calculating these NPVs McDaniel considered items such as revenues, royalties, operating costs, abandonment costs and capital expenditures (but excluded financing and general and administrative costs). Their calculations assume natural gas is used as a fuel for steam generation, and are based on their forecast commodity prices as of January 1, 2015 and forecast costs as of December 31, Royalties were calculated based on Alberta s Royalty Framework applicable to oil sands projects. McDaniel s estimated NPVs do not represent fair market value. There is no certainty that it will be commercially viable to produce any portion of Cavalier s contingent resources at Hoole. In addition, Cavalier currently has no detailed cost estimates in place for its Hoole Grand Rapids Project or a firm timeline for proceeding with the project, as it is still seeking financing and has not yet received approval from its board of directors to proceed with the project. If the Hoole Grand Rapids Project does proceed it will use steam assisted gravity drainage. 34
35
Corporate Presentation. May 2016
 Corporate Presentation May 2016 Future Oriented Information (See additional advisories at the end of this document) In the interest of providing information regarding Paramount Resources Ltd. ("Paramount"
Corporate Presentation. April, 2017
 Corporate Presentation April, 2017 Future Oriented Information (See additional advisories at the end of this document) In the interest of providing information regarding Paramount Resources Ltd. ("Paramount"
Corporate Presentation. March 2017
 Corporate Presentation March 2017 Future Oriented Information (See additional advisories at the end of this document) In the interest of providing information regarding Paramount Resources Ltd. ("Paramount"
Corporate Presentation. January 2017
 Corporate Presentation January 2017 Future Oriented Information (See additional advisories at the end of this document) In the interest of providing information regarding Paramount Resources Ltd. ("Paramount"
Corporate Presentation. August 2016
 Corporate Presentation August 2016 Future Oriented Information (See additional advisories at the end of this document) In the interest of providing information regarding Paramount Resources Ltd. ("Paramount"
EPAC OIL & GAS INVESTOR CONFERENCE. June 12, 2013
 EPAC OIL & GAS INVESTOR CONFERENCE June 12, 2013 1 Future Oriented Information (See additional advisories at the end of this document) In the interest of providing information regarding Paramount Resources
Corporate Presentation. April 2015
 Corporate Presentation April 2015 Future Oriented Information (See additional advisories at the end of this document) In the interest of providing information regarding Paramount Resources Ltd. ("Paramount"
Corporate Presentation. January 2015
 Corporate Presentation January 2015 Future Oriented Information (See additional advisories at the end of this document) In the interest of providing information regarding Paramount Resources Ltd. ("Paramount"
Strategic Transactions Review. July 2017
 Strategic Transactions Review July 2017 Future Oriented Information In the interest of providing information regarding Paramount Resources Ltd. ("Paramount", "PRL" or the "Company") and its future plans
Liquids sales revenue totaled $38.0 million in the first quarter of 2017, 69 percent of the Company s total petroleum and natural gas sales revenue.
 Paramount Resources Ltd. Announces First Quarter 2017 Results: Sales Volumes Average 16,163 Boe/d; Karr 6-18 Facility Expansion On- Stream Ahead of Schedule Calgary, Alberta May 10, 2017 OIL AND GAS OPERATIONS
Corporate Presentation
 Corporate Presentation July 2018 Advisories In the interest of providing information regarding Paramount Resources Ltd. ("Paramount", "PRL" or the "Company") and its future plans and operations, this presentation
Liquids sales comprised 59 percent of total revenue and 40 percent of total sales volumes in the second quarter of 2015.
 PARAMOUNT RESOURCES LTD. ANNOUNCES SECOND QUARTER 2015 RESULTS; SALES VOLUMES INCREASE 107% TO 42,604 BOE/D; LIQUIDS SALES VOLUMES INCREASE 320% TO 16,877 BBL/D August 5, 2015 Calgary, Alberta OIL AND
Annual Information Form For the Year Ended December 31, 2016
 Annual Information Form For the Year Ended December 31, 2016 March 8, 2017 TABLE OF CONTENTS TABLE OF CONTENTS... 2 INTRODUCTORY INFORMATION... 3 NOTE REGARDING FORWARD-LOOKING STATEMENTS AND ADVISORIES...
Corporate Presentation. January 2018
 Corporate Presentation January 2018 Future Oriented Information In the interest of providing information regarding Paramount Resources Ltd. ("Paramount", "PRL" or the "Company") and its future plans and
Paramount Resources Ltd. Reports Second Quarter 2018 Results Calgary, Alberta August 8, 2018
 Paramount Resources Ltd. Reports Second Quarter 2018 Results Calgary, Alberta August 8, 2018 OIL AND GAS OPERATIONS Paramount s sales volumes averaged 86,741 Boe/d in the second quarter of 2018. Liquids
Corporate Presentation
 Corporate Presentation January 2019 Advisories In the interest of providing information regarding Paramount Resources Ltd. ("Paramount", "PRL" or the "Company") and its future plans and operations, this
CEQUENCE ENERGY ANNOUNCES OPERATIONAL UPDATE AND 2014 RESERVES AND FINANCIAL AND OPERATING RESULTS
 CEQUENCE ENERGY ANNOUNCES OPERATIONAL UPDATE AND 2014 RESERVES AND FINANCIAL AND OPERATING RESULTS CALGARY, March 5, 2015 Cequence Energy Ltd. ("Cequence" or the "Company") (TSX: CQE) is pleased to announce
Paramount Resources Ltd. Reports First Quarter 2018 Results Calgary, Alberta May 9, 2018
 Paramount Resources Ltd. Reports First Quarter 2018 Results Calgary, Alberta May 9, 2018 OIL AND GAS OPERATIONS Paramount s sales volumes averaged 92,203 Boe/d in the first quarter of 2018 compared to
Corporate Presentation
 Corporate Presentation April 2019 Advisories In the interest of providing information regarding Paramount Resources Ltd. ("Paramount", "PRL" or the "Company") and its future plans and operations, this
Corporate Presentation
 Corporate Presentation March 2019 Advisories In the interest of providing information regarding Paramount Resources Ltd. ("Paramount", "PRL" or the "Company") and its future plans and operations, this
The Company has commenced drilling its second exploratory vertical evaluation well on its Liard Basin Besa River shale gas lands.
 OPERATIONAL UPDATE Oil and Gas Operations Sales volumes in the third quarter were impacted by scheduled and unscheduled third party downstream NGLs processing disruptions, which shut-in up to 6,000 Boe/d
Corporate Presentation. February 2018
 Corporate Presentation February 2018 Advisories In the interest of providing information regarding Paramount Resources Ltd. ("Paramount", "PRL" or the "Company") and its future plans and operations, this
Paramount Resources Ltd. Reports Third Quarter 2018 Results Calgary, Alberta - November 8, 2018
 Paramount Resources Ltd. Reports Third Quarter 2018 Results Calgary, Alberta - November 8, 2018 OIL AND GAS OPERATIONS Sales volumes averaged 80,471 Boe/d in the third quarter of 2018, including 29,831
take a closer look Encana Corporation Key Resource Play Statistics As at June 30, 2011
 take a closer look Encana Corporation Key Resource Play Statistics As at June 3, 211 Definitions Supply Cost: The flat NYMEX natural gas price that yields a risked internal rate of return of 9% and does
Paramount Resources Ltd. Reports 2018 Annual Results and Provides 2019 Guidance
 Paramount Resources Ltd. Reports 2018 Annual Results and Provides 2019 Guidance Calgary, Alberta March 7, 2019 OIL AND GAS OPERATIONS Annual sales volumes averaged 85,941 Boe/d (37 percent liquids) in
Annual Information Form For the Year Ended December 31, 2017
 Annual Information Form For the Year Ended December 31, 2017 March 7, 2018 TABLE OF CONTENTS TABLE OF CONTENTS... 2 INTRODUCTORY INFORMATION... 3 NOTE REGARDING FORWARD-LOOKING STATEMENTS AND ADVISORIES...
CEQUENCE ENERGY ANNOUNCES 35% GROWTH IN RESERVES AND 2012 FINANCIAL AND OPERATING RESULTS
 CEQUENCE ENERGY ANNOUNCES 35% GROWTH IN RESERVES AND 2012 FINANCIAL AND OPERATING RESULTS CALGARY, March 7, 2013 Cequence Energy Ltd. ("Cequence" or the "Company") (TSX: "CQE") is pleased to announce its
CHINOOK ENERGY INC. ANNOUNCES FOURTH QUARTER 2016 RESULTS AND PROVIDES OPERATIONAL UPDATE
 CHINOOK ENERGY INC. ANNOUNCES FOURTH QUARTER 2016 RESULTS AND PROVIDES OPERATIONAL UPDATE CALGARY, ALBERTA March 23, 2017 Chinook Energy Inc. ("our", "we", or "us") (TSX: CKE) is pleased to announce its
CEQUENCE ENERGY ANNOUNCES 2015 FINANCIAL AND OPERATING RESULTS
 CEQUENCE ENERGY ANNOUNCES 2015 FINANCIAL AND OPERATING RESULTS CALGARY, March 29, 2015 Cequence Energy Ltd. ("Cequence" or the "Company") (TSX: CQE) is pleased to announce its operating and financial results
TSX V: HME. Achieved a two year average F&D cost of $9.22/boe (including changes in FDC) for a recycle ratio of 1.8.
 for a recycle ratio of 1.8.") HEMISPHERE ENERGY INCREASES PROVED PLUS PROBABLE RESERVE VALUE BY 77% TO $116.6 MILLION (DISCOUNTED AT 10%), AND NET ASSET VALUE BY 68% TO $1.12 PER SHARE TSX V: HME Vancouver, British Columbia, March
HEMISPHERE ENERGY INCREASES PROVED PLUS PROBABLE RESERVE VALUE BY 77% TO $116.6 MILLION (DISCOUNTED AT 10%), AND NET ASSET VALUE BY 68% TO $1.12 PER SHARE TSX V: HME Vancouver, British Columbia, March
Net wells drilled
 FINANCIAL AND OPERATING HIGHLIGHTS (1) ($ millions, except as noted) Three months ended September 30 Nine months ended September 30 2010 2009 Change % 2010 2009 Change % Financial Petroleum and natural
A N N U A L R E P O R T
 2009 ANNUAL REPORT Letter to Shareholders 2 Review of Operations 4 Management s Discussion & Analysis 18 Financial Statements 40 Corporate Information IBC Annual Meeting of Shareholders Shareholders are
CHINOOK ENERGY INC. ANNOUNCES SECOND QUARTER 2017 RESULTS
 CHINOOK ENERGY INC. ANNOUNCES SECOND QUARTER 2017 RESULTS CALGARY, ALBERTA August 10, 2017 Chinook Energy Inc. ("our", "we", or "us") (TSX: CKE) is pleased to announce its second quarter 2017 financial
September 28, 2018 SEPTEMBER PRESENTATION
 September 28, 2018 SEPTEMBER PRESENTATION BIGSTONE PROLIFIC, LIQUIDS RICH MONTNEY Pure play MONTNEY E&P company with WORLD CLASS ASSETS: Successful delineation drilling to the west and south Growing condensate
CEQUENCE ENERGY ANNOUNCES 2015 INDEPENDENT RESERVES EVALUATION
 CEQUENCE ENERGY ANNOUNCES 2015 INDEPENDENT RESERVES EVALUATION CALGARY, February 22, 2016 Cequence Energy Ltd. ("Cequence" or the "Company") (TSX: CQE) is pleased to announce the results of its year end
Advantage Announces 2011 Year End Financial Results and Provides Interim Guidance
 Press Release Page 1 of 10 Advantage Oil & Gas Ltd Advantage Announces 2011 Year End Financial Results and Provides Interim Guidance (TSX: AAV, NYSE: AAV) CALGARY, ALBERTA, March 22, 2012 ( Advantage or
Yangarra Announces First Quarter 2018 Financial and Operating Results
 Suite 1530, 715 5 Avenue S.W. Calgary, Alberta T2P 2X6 Phone: (403) 262-9558 Fax: (403) 262-8281 Webpage: www.yangarra.ca Email: info@yangarra.ca May 9, 2018 Yangarra Announces First Quarter 2018 Financial
ANNUAL INFORMATION FORM For the Year Ended December 31, 2010
 ANNUAL INFORMATION FORM For the Year Ended December 31, 2010 March 3, 2011 TABLE OF CONTENTS INTRODUCTORY INFORMATION... 2 NOTE REGARDING FORWARD-LOOKING STATEMENTS AND ADVISORIES... 2 CORPORATE STRUCTURE...
Premium Pipestone Asset Acquisition. August 9, 2018
 Premium Pipestone Asset Acquisition August 9, 2018 READER ADVISORY GENERAL A final short form prospectus containing important information relating to the offering (the "Offering") of subscription receipts
DELPHI ENERGY CORP. REPORTS 2018 YEAR END RESULTS
 DELPHI ENERGY CORP. REPORTS 2018 YEAR END RESULTS CALGARY, ALBERTA March 13, 2019 Delphi Energy Corp. ( Delphi or the Company ) is pleased to announce its financial and operational results for the year
Obsidian Energy. Corporate Presentation. January 2018
 Obsidian Energy Corporate Presentation January 2018 Important Notices to the Readers This presentation should be read in conjunction with the Company's audited consolidated financial statements, management's
SURVIVE TO THRIVE 2016 CAPP SCOTIABANK INVESTMENT SYMPOSIUM
 SURVIVE TO THRIVE 2016 CAPP SCOTIABANK INVESTMENT SYMPOSIUM April 12, 2016 1 CORPORATE PROFILE Corporate Summary Q4/2015 Avg. Daily Production 67,934 boe/d Production Mix 1 ~60% liquids/40% gas Corporate
NEWS RELEASE FEBRUARY 14, 2018 TOURMALINE ADDS 558 MMBOE OF 2P RESERVES, GROWS LIQUID RESERVES BY 73% AND 2P RESERVE VALUE BY $2.
 NEWS RELEASE FEBRUARY 14, 2018 TOURMALINE ADDS 558 MMBOE OF 2P RESERVES, GROWS LIQUID RESERVES BY 73% AND 2P RESERVE VALUE BY $2.4 BILLION (1) Calgary, Alberta - Tourmaline Oil Corp. (TSX:TOU) ( Tourmaline
BELLATRIX ANNOUNCES 2018 YEAR END RESERVES HIGHLIGHTED BY 13% RESERVE GROWTH AND LOW COST RESERVE ADDITIONS
 For Immediate Release Calgary, Alberta TSX: BXE BELLATRIX ANNOUNCES 2018 YEAR END RESERVES HIGHLIGHTED BY 13% RESERVE GROWTH AND LOW COST RESERVE ADDITIONS CALGARY, ALBERTA (March 14, 2019) Bellatrix Exploration
Obsidian Energy. Peters & Co. Annual Energy Conference. January 2018
 Obsidian Energy Peters & Co. Annual Energy Conference January 2018 Important Notices to the Readers This presentation should be read in conjunction with the Company's audited consolidated financial statements,
CANADIAN NATURAL RESOURCES LIMITED ANNOUNCES 2016 YEAR END RESERVES CALGARY, ALBERTA FEBRUARY 14, 2017 FOR IMMEDIATE RELEASE
 CANADIAN NATURAL RESOURCES LIMITED ANNOUNCES 2016 YEAR END RESERVES CALGARY, ALBERTA FEBRUARY 14, 2017 FOR IMMEDIATE RELEASE Canadian Natural Resources Limited ( Canadian Natural or the Company ) is pleased
InPlay Oil Corp. Announces Second Quarter 2018 Financial and Operating Results and Increases Production Guidance
 InPlay Oil Corp. Announces Second Quarter 2018 Financial and Operating Results and Increases Production Guidance August 9, 2018 - Calgary Alberta InPlay Oil Corp. (TSX: IPO) (OTCQX: IPOOF) ( InPlay or
PETERS & CO. LIMITED ENERGY CONFERENCE
 PETERS & CO. LIMITED ENERGY CONFERENCE Sherri Brillon, Executive Vice-President & CFO Encana Corporation September 9, 2014 Business Strategy GETTING BACK TO WINNING VISION: LEADING NORTH AMERICAN RESOURCE
PAINTED PONY ANNOUNCES A 52% INCREASE IN PROVED PLUS PROBABLE RESERVES TO 1.7 TCFE WITH A NET PRESENT VALUE DISCOUNTED AT 10% OF $1.
 1 FOR IMMEDIATE RELEASE March 4, 2014 PAINTED PONY ANNOUNCES A 52% INCREASE IN PROVED PLUS PROBABLE RESERVES TO 1.7 TCFE WITH A NET PRESENT VALUE DISCOUNTED AT 10% OF $1.5 BILLION March 4, 2014 Calgary,
HEMISPHERE ENERGY ANNOUNCES Q FINANCIAL AND OPERATING RESULTS
 HEMISPHERE ENERGY ANNOUNCES Q2 2017 FINANCIAL AND OPERATING RESULTS TSX V: HME Vancouver, British Columbia, August 23, 2017 Hemisphere Energy Corporation (TSX V: HME) ("Hemisphere" or the "Company") announces
InPlay Oil Corp. Announces First Quarter 2018 Financial and Operating Results Highlighted by a 24 % Increase in Light Oil Production
 InPlay Oil Corp. Announces First Quarter 2018 Financial and Operating Results Highlighted by a 24 % Increase in Light Oil Production May 10, 2018 - Calgary Alberta InPlay Oil Corp. (TSX: IPO) (OTCQX: IPOOF)
May 2018 HIGH-MARGIN, LIQUIDS-RICH PRODUCTION IN THE WORLD- CLASS MONTNEY BIGSTONE REGION
 May 2018 HIGH-MARGIN, LIQUIDS-RICH PRODUCTION IN THE WORLD- CLASS MONTNEY BIGSTONE REGION WHY OWN DELPHI. Pure play MONTNEY E&P company with WORLD CLASS ASSETS: Robust well economics driven by: High condensate
CEQUENCE ENERGY LTD. ANNOUNCES OVER 36 % GROWTH IN RESERVES AND RESERVE VALUE AND FOURTH QUARTER AND YEAR END 2011 RESULTS
 CEQUENCE ENERGY LTD. ANNOUNCES OVER 36 % GROWTH IN RESERVES AND RESERVE VALUE AND FOURTH QUARTER AND YEAR END 2011 RESULTS CALGARY, March 8, 2012 Cequence Energy Ltd. ("Cequence" or the "Company") (TSX:
SPARTAN ENERGY CORP. ANNOUNCES STRATEGIC SOUTHEAST SASKATCHEWAN LIGHT OIL ACQUISITION
 Suite 500, 850 2 nd Street SW Calgary, AB T2P 0R8 Canada Ph.: (403) 355-8920 Fax: (403) 355-2779 SPARTAN ENERGY CORP. ANNOUNCES STRATEGIC SOUTHEAST SASKATCHEWAN LIGHT OIL ACQUISITION CALGARY, ALBERTA (May
TSXV: TUS September 8, 2015
 TSXV: TUS September 8, 2015 TSXV: TUS SEPTEMBER 8, 2015 2 Why Buy Tuscany Now? Tuscany has built a large inventory of horizontal oil locations on properties with significant potential oil in place 80 to
POSITIONED FOR LIQUIDS-RICH GAS GROWTH
 POSITIONED FOR LIQUIDS-RICH GAS GROWTH December 2017 1 Summary of Forward-Looking Statements or Information FORWARD- LOOKING INFORMATION AND DEFINITIONS Certain information included in this presentation
Bank of America Merrill Lynch 2016 Energy Credit Conference
 Bank of America Merrill Lynch 2016 Energy Credit Conference New York, New York, June 8, 2016 Rod Gray Chief Financial Officer Advisory Forward-Looking Statements In the interest of providing Baytex's shareholders
CEQUENCE ENERGY ANNOUNCES SECOND QUARTER FINANCIAL AND OPERATING RESULTS
 CEQUENCE ENERGY ANNOUNCES SECOND QUARTER FINANCIAL AND OPERATING RESULTS CALGARY, August 10, 2017 Cequence Energy Ltd. ("Cequence" or the "Company") (TSX: CQE) is pleased to announce its operating and
DELPHI ENERGY RELEASES YEAR END 2015 RESERVES
 DELPHI ENERGY RELEASES YEAR END 2015 RESERVES CALGARY, ALBERTA February 29, 2016 Delphi Energy Corp. ( Delphi or the Company ) is pleased to report its crude oil and natural gas reserves information for
Year-end 2017 Reserves
 Year-end 2017 Reserves Baytex's year-end 2017 proved and probable reserves were evaluated by Sproule Unconventional Limited ( Sproule ) and Ryder Scott Company, L.P. ( Ryder Scott ), both independent qualified
NEWS RELEASE NOVEMBER 7, 2018
 NEWS RELEASE NOVEMBER 7, 2018 TOURMALINE DELIVERS STRONG Q3 EARNINGS AND CASH FLOW GROWTH, INCREASES 2018 EXIT AND 2019 PRODUCTION ESTIMATES AND REDUCES 2019 CAPITAL PROGRAM Calgary, Alberta - Tourmaline
DELPHI ENERGY CORP. REPORTS 2018 YEAR END RESERVES
 DELPHI ENERGY CORP. REPORTS 2018 YEAR END RESERVES CALGARY, ALBERTA March 4, 2019 Delphi Energy Corp. ( Delphi or the Company ) is pleased to announce its crude oil and natural gas reserves information
CEQUENCE ENERGY ANNOUNCES SECOND QUARTER 2018 FINANCIAL RESULTS
 CEQUENCE ENERGY ANNOUNCES SECOND QUARTER 2018 FINANCIAL RESULTS CALGARY, August 10, 2018 Cequence Energy Ltd. ("Cequence" or the "Company") (TSX: CQE) is pleased to announce its operating and financial
FORM F1 STATEMENT OF RESERVES DATA AND OTHER OIL AND GAS INFORMATION. Year Ended December 31, 2016
 FORM 51-101F1 STATEMENT OF RESERVES DATA AND OTHER OIL AND GAS INFORMATION Year Ended December 31, 2016 March 2, 2017 TABLE OF CONTENTS DATE OF STATEMENT AND RELEVANT DATES... 1 DISCLOSURE OF RESERVES
Yangarra Announces Second Quarter 2018 Financial and Operating Results
 Suite 1530, 715 5 Avenue S.W. Calgary, Alberta T2P 2X6 Phone: (403) 262-9558 Fax: (403) 262-8281 Webpage: www.yangarra.ca Email: info@yangarra.ca August 8, Yangarra Announces Second Quarter Financial and
Liquid Rich Montney Natural Gas Resource Play In the Deep Basin - West Central Alberta Q3 2012
 Liquid Rich Montney Natural Gas Resource Play In the Deep Basin - West Central Alberta Q3 2012 Forward-looking Statement Certain information and statements contained in this presentation contain forward-looking
NEWS RELEASE FEBRUARY 20, 2019 TOURMALINE ADDS 338 MMBOE OF RESERVES IN 2018, 2P RESERVES INCREASED TO 2.46 BILLION BOE
 NEWS RELEASE FEBRUARY 20, 2019 TOURMALINE ADDS 338 MMBOE OF RESERVES IN 2018, 2P RESERVES INCREASED TO 2.46 BILLION BOE Calgary, Alberta - Tourmaline Oil Corp. (TSX:TOU) ( Tourmaline or the ) is pleased
Heavy Oil. Gems. November TSX:PXX; OMX:PXXS
 Heavy Oil TSX:PXX; OMX:PXXS November 2010 Gems www.blackpearlresources.ca 1 Introduction Corporate: Symbol: PXX, PXXS Exchanges: TSX, OMX Shares Outstanding (MM): Basic (1) 282.9 Fully Diluted(options
ANNUAL MEETING OF SHAREHOLDERS
 President & Chief Executive Officer s Message 1 2017 Highlights 4 2017 Overview 6 Review of Operations 8 Management s Discussion & Analysis 22 Financial Statements 52 Corporate Information 88 ANNUAL MEETING
NEWS RELEASE CHINOOK ENERGY ANNOUNCES STRATEGIC TRANSACTION TO CREATE A WELL CAPITALIZED MONTNEY FOCUSED GROWTH COMPANY
 NEWS RELEASE CHINOOK ENERGY ANNOUNCES STRATEGIC TRANSACTION TO CREATE A WELL CAPITALIZED MONTNEY FOCUSED GROWTH COMPANY CALGARY, ALBERTA June 13, 2016 Chinook Energy Inc. (TSX: CKE) ("Chinook" or the "Company")
Annual and Special Shareholder Meeting May 17, 2018
 Annual and Special Shareholder Meeting May 17, 2018 2017 in Review Mandate: Increase light oil exposure Increase netbacks Reduce operating Costs Maintain dividend 2 Grande Prairie Acquisition (March 2017)
A SPRINGBOARD FOR GROWTH
 A SPRINGBOARD FOR GROWTH May 2011 1 TSX:PXX OMX:PXXS www.blackpearlresources.ca Cautionary Statements FORWARD LOOKING STATEMENTS This presentation contains certain forward looking statements and forward
PETRUS RESOURCES ANNOUNCES FOURTH QUARTER AND YEAR END 2017 FINANCIAL & OPERATING RESULTS AND YEAR END RESERVE INFORMATION
 PETRUS RESOURCES ANNOUNCES FOURTH QUARTER AND YEAR END 2017 FINANCIAL & OPERATING RESULTS AND YEAR END RESERVE INFORMATION CALGARY, ALBERTA, Thursday, March 8 th, 2018 Petrus Resources Ltd. ( Petrus or
April 2018 HIGH-MARGIN, LIQUIDS-RICH PRODUCTION IN THE WORLD- CLASS MONTNEY BIGSTONE REGION
 April 2018 HIGH-MARGIN, LIQUIDS-RICH PRODUCTION IN THE WORLD- CLASS MONTNEY BIGSTONE REGION WHY OWN DELPHI. Pure play MONTNEY E&P company with WORLD CLASS ASSETS: Robust well economics driven by: High
POSITIONED FOR LIQUIDS RICH GAS GROWTH
 POSITIONED FOR LIQUIDS RICH GAS GROWTH September 2017 1 Summary of Forward Looking Statements or Information FORWARD LOOKING INFORMATION AND DEFINITIONS Certain information included in this presentation
Athabasca Oil Corporation Announces 2018 Year end Results
 FOR IMMEDIATE RELEASE March 6, 2019 Athabasca Oil Corporation Announces 2018 Year end Results CALGARY Athabasca Oil Corporation (TSX: ATH) ( Athabasca or the Company ) is pleased to provide its 2018 year
FINANCIAL AND OPERATING HIGHLIGHTS (1) ($ millions, except as noted)
 ($ millions, except as noted)") 2008 First Quarter Report FINANCIAL AND OPERATING HIGHLIGHTS (1) ($ millions, except as noted) Three Months Ended March 31, 2008 December 31, 2007 Change % Financial Petroleum and natural gas sales 77.0
2008 First Quarter Report FINANCIAL AND OPERATING HIGHLIGHTS (1) ($ millions, except as noted) Three Months Ended March 31, 2008 December 31, 2007 Change % Financial Petroleum and natural gas sales 77.0
CEQUENCE ENERGY ANNOUNCES OPERATIONAL UPDATE, 2016 FINANCIAL AND OPERATING RESULTS AND RESERVES
 CEQUENCE ENERGY ANNOUNCES OPERATIONAL UPDATE, 2016 FINANCIAL AND OPERATING RESULTS AND RESERVES CALGARY, March 13, 2017 Cequence Energy Ltd. ("Cequence" or the "Company") (TSX: CQE) is pleased to provide
Encana reports fourth quarter and full-year 2018 financial and operating results
 Encana reports fourth quarter and full-year 2018 financial and operating results February 28, 2019 Sustainable model delivered free cash flow, strong growth in proved reserves and high-margin liquids Fourth
Driving New Growth TSX:PGF. Peters & Co Presentation September 11, 2018
 Driving New Growth Peters & Co Presentation September 11, 2018 Advisories Caution Regarding Forward Looking Information: This presentation contains forward-looking statements within the meaning of securities
January 2018 HIGH-MARGIN, LIQUIDS-RICH PRODUCTION IN THE WORLD- CLASS MONTNEY BIGSTONE REGION
 January 2018 HIGH-MARGIN, LIQUIDS-RICH PRODUCTION IN THE WORLD- CLASS MONTNEY BIGSTONE REGION WHY OWN DELPHI. Pure play MONTNEY E&P company with WORLD CLASS ASSETS: Robust well economics driven by: High
For Immediate Release Granite Oil Corp. Announces 2017 Record Year End Reserve Metrics and Operational Update
 For Immediate Release Granite Oil Corp. Announces 2017 Record Year End Reserve Metrics and Operational Update CALGARY, ALBERTA (Marketwired March 7, 2018) GRANITE OIL CORP. ( Granite or the Company ) (TSX:GXO)(OTCQX:GXOCF)
Light Oil North America Jeff Wilson, Senior Vice-President, Exploration
 Light Oil North America Jeff Wilson, Senior Vice-President, Exploration Investor Open House Premium Value Defined Growth Independent 1 Forward Looking Statements Certain statements relating to Canadian
KELT REPORTS SIGNIFICANT INCREASES IN RESERVES AND PRODUCTION IN 2014
 PRESS RELEASE (Stock Symbol KEL TSX) February 10, 2015 Calgary, Alberta KELT REPORTS SIGNIFICANT INCREASES IN RESERVES AND PRODUCTION IN 2014 Kelt Exploration Ltd. ( Kelt or the Company ) has released
Liquids-Rich Montney Natural Gas Resource Play in Alberta s Deep Basin Q4 2012
 Liquids-Rich Montney Natural Gas Resource Play in Alberta s Deep Basin Q4 2012 Forward-Looking Statements Certain information and statements contained in this presentation contain forward-looking information
to announce Operating Results March 22, 2011 boe/d. $38.5 million to funds from cash flow for $45.1 million the increasing optimization of our other
 Press Release Advantage Oil & Gas Ltd Page 1 of 6 News Release Advantage Announces 2010 Year End Financial Results Glacier Production Exceeding 100 mmcf/d March 22, 2011 (TSX: AAV, NYSE: AAV) CALGARY,
TD Securities Duvernay Overview October 8, 2013
 TD Securities Duvernay Overview October 8, 2013 Forward-Looking Statement This presentation contains forward-looking information that involves various risks, uncertainties and other factors. All information
CHINOOK ENERGY INC. ANNOUNCES SECOND QUARTER 2016 RESULTS
 CHINOOK ENERGY INC. ANNOUNCES SECOND QUARTER 2016 RESULTS CALGARY, ALBERTA August 10, 2016 Chinook Energy Inc. ("our", "we", "us" or "Chinook") (TSX: CKE) is pleased to announce its second quarter financial
Forward-Looking Information and Definitions
 2013 National Bank Financial Markets Energy Conference Intermediate Energy Growth & Yield Conference Toronto, Ontario February 13 th & 14 th, 2013 Forward-Looking Information and Definitions Certain information
BELLATRIX EXPLORATION LTD. ANNOUNCES FOURTH QUARTER 2018 AND YEAR END FINANCIAL AND OPERATING RESULTS
 For Immediate Release TSX: BXE BELLATRIX EXPLORATION LTD. ANNOUNCES FOURTH QUARTER 2018 AND YEAR END FINANCIAL AND OPERATING RESULTS CALGARY, ALBERTA (March 14, 2019) - Bellatrix Exploration Ltd. ( Bellatrix,
INPLAY OIL CORP. ANNOUNCES 2016 YEAR END RESERVES AND AN OPERATIONS UPDATE
 March 14, 2017 INPLAY OIL CORP. ANNOUNCES 2016 YEAR END RESERVES AND AN OPERATIONS UPDATE CALGARY, ALBERTA (March 14, 2017) InPlay Oil Corp. ("InPlay" or the "Company") (TSX:IPO) is pleased to present
DELPHI ENERGY CORP. REPORTS 2017 YEAR END RESULTS AND RESERVES AND PROVIDES OPERATIONS UPDATE
 DELPHI ENERGY CORP. REPORTS 2017 YEAR END RESULTS AND RESERVES AND PROVIDES OPERATIONS UPDATE CALGARY, ALBERTA March 7, 2018 Delphi Energy Corp. ( Delphi or the Company ) is pleased to announce its financial
Annual General Meeting May 21, cequence. energy ltd
 Annual General Meeting May 21, 2014 cequence energy ltd Forward-Looking Information and Definitions Summary of Forward-Looking Statements or Information Certain information included in this presentation
HEMISPHERE ENERGY ANNOUNCES 2017 FOURTH QUARTER AND YEAR-END FINANCIAL AND OPERATING RESULTS
 HEMISPHERE ENERGY ANNOUNCES 2017 FOURTH QUARTER AND YEAR-END FINANCIAL AND OPERATING RESULTS TSX-V: HME Vancouver, British Columbia, April 26, 2018 Hemisphere Energy Corporation (TSX-V: HME) ("Hemisphere"
TRILOGY ENERGY CORPORATION 2011 ANNUAL REPORT
 TRILOGY ENERGY CORPORATION 2011 ANNUAL REPORT OUR ASSETS DICTATE OUR STRATEGY FINANCIAL HIGHLIGHTS 1 MESSAGE TO SHAREHOLDERS 2 REVIEW OF OPERATIONS 5 OPERATING AREAS 12 RESERVES 22 ENVIRONMENTAL HEALTH
Horizon Petroleum Ltd.
 Horizon Petroleum Ltd. Suite 1500, 700 4 th Ave. S.W., Calgary, AB, CANADA, T2P 3J4 www.horizon-petroleum.com Horizon Petroleum Announces NI51-101 Reserves and Resources Report for Poland Acquisition,
Q First Quarter Report
 Q1 2017 First Quarter Report Financial and Operating Highlights 2017 2016 Financial ($000, except as otherwise indicated) Sales including realized hedging $ 72,957 $ 41,625 Funds from operations $ 53,972
Peters & Co North American Oil & Gas Conference September 11, 2012 The Game Plan Robert J. Waters, Senior Vice-President and Chief Financial
 Peters & Co. 2012 North American Oil & Gas Conference September 11, 2012 The Game Plan Robert J. Waters, Senior Vice-President and Chief Financial Officer Corporate Profile Ticker Symbol (TSX & NYSE) ERF
FINANCIAL AND OPERATING HIGHLIGHTS (THREE MONTHS ENDED MARCH 31, 2018)
") FOR IMMEDIATE RELEASE: May 14, 2018 TSX SYMBOLS: ZAR; ZAR.DB.A ZARGON OIL & GAS LTD. PROVIDES 2018 FIRST QUARTER RESULTS AND PROVIDES SECOND HALF 2018 GUIDANCE CALGARY, ALBERTA Zargon Oil & Gas Ltd. (
FOR IMMEDIATE RELEASE: May 14, 2018 TSX SYMBOLS: ZAR; ZAR.DB.A ZARGON OIL & GAS LTD. PROVIDES 2018 FIRST QUARTER RESULTS AND PROVIDES SECOND HALF 2018 GUIDANCE CALGARY, ALBERTA Zargon Oil & Gas Ltd. (
Encana Investor Presentation. January 2019
 Encana Investor Presentation January 2019 D E M O N S T R A T I N G T H E P O W E R O F A L E A D I N G S H A L E P O R T F O L I O A Premium E&P Company 2 Premium positions in 3 top shale plays supports