|
|
|
- Carol Reynolds
- 5 years ago
- Views:
Transcription
1
2 FIRST METRO SAVE & LEARN BALANCED FUND, INC President s Report
3 FINANCIAL HIGHLIGHTS AS OF FIRST METRO SAVE AND LEARN BALANCED FUND, INC. (An Open-End Mutual Fund Company) STATEMENTS OF COMPREHENSIVE INCOME Years Ended December % VAR INVESTMENT INCOME Trading gain - net (Notes 7, 8 and 15) 268,459,432 16,774, % Interest income (Note 11) 16,710,167 8,773,981 90% Dividend income 12,450,867 8,923,069 40% Miscellaneous income 1,083,767 - n.a. 298,704,233 34,471, % OPERATING EXPENSES n.a. Management fees (Note 15) 24,141,863 12,586,447 92% Taxes and licenses 5,508,034 5,467,384 1% Brokers commission 3,690,396 2,496,334 48% Custodian and clearing fees 238, ,005 3% Directors and officers fees (Note 15) 217, ,000 0% Professional fees 271, ,024 28% Miscellaneous 541, , % 34,608,520 21,371,506 62% NET INVESTMENT INCOME BEFORE INCOME TAX 264,095,713 13,099, % PROVISION FOR FINAL TAX (Note 13) 3,315,549 1,568, % NET INVESTMENT INCOME (Note 14) 260,780,164 11,531, % OTHER COMPREHENSIVE INCOME n.a. Changes in the fair value of available-for-sale investments (21,870,191) 25,858, % TOTAL COMPREHENSIVE INCOME 238,909,973 37,389, %
4 FIRST METRO SAVE AND LEARN BALANCED FUND, INC. (An Open-End Mutual Fund Company) STATEMENTS OF FINANCIAL POSITION FINANCIAL HIGHLIGHTS AS OF Years Ended December % VAR ASSETS Cash and Cash Equivalents (Notes 6 and 15) 102,250,390 21,195, % Financial Assets at Fair Value through Profit or Loss (Note 7) 1,292,226, ,629, % Available-for-Sale Investments (Note 7) 204,628, ,876,584 28% Loans and Receivables (Notes 8 and 15) 11,990,845 87,313,394-86% Creditable Withholding Taxes 70,673 60,347 17% 1,611,167, ,075, % LIABILITIES Accounts Payable and Accrued Expenses (Notes 9 and 15) 33,348,245 7,900, % Derivative Liabilities (Note 8) - 741, % 33,348,245 8,642, % EQUITY Capital Stock (Note 10) 482,672,086 92,917, % Additional Paid-in Capital (Note 10) 473,231,561 18,220, % Deposits for Future Shares Subscriptions (Note 10) 288,233, ,204,998-47% Net Unrealized Gain on AFS Investments (Note 7) 3,987,900 25,858,091-85% Retained Earnings 329,693,304 94,231, % 1,577,818, ,433, % TOTAL LIABILITIES AND EQUITY 1,611,167, ,075, %
5 FINANCIAL HIGHLIGHTS AS OF SALBF: SUMMARY OF INCOME STATEMENT % VAR. TOTAL INCOME 110,660, ,799, % TOTAL EXPENSES 26,450, ,257, % IBIT 84,210, ,541, % NET INCOME 77,408, ,328, % SALBF: SUMMARY OF BALANCE SHEET % VAR. TOTAL ASSETS 2,594,535, ,614,848, % TOTAL LIABILITIES 23,238, ,930, % CAPITAL 2,471,297, ,583,918, %
6 PORTFOLIO ALLOCATION 12/30/ /30/2013 RANK STOCK DESCRIPTION % STOCK DESCRIPTION % PSB Philippine Savings Bank 6.41% 1 PSB Philippine Savings Bank 5.45% MBT Metropolitan Bank and Trust Corp. 5.39% 2 GTCAP GT Capital Holdings, Inc. 4.59% SM SM Investment Corporation 5.04% 3 COSCO Cosco Capital, Inc. 4.29% PIP Pepsi-Cola Products Philippines 4.96% 4 SM Sm Investments Corporation 4.10% PGOLD Puregold Price Club Inc 4.35% 5 MWIDE Megawide Construction Corporation 3.79% AC Ayala Corporation 3.91% 6 TEL PLDT 3.74% BDO Banco de Oro Unibank Inc. 3.84% 7 AC Ayala Corporation 3.72% ALI Ayala Land, Inc. 3.75% 8 MBT Metropolitan Bank and Trust Co. 3.21% VLL Vista Land and Lifescapes Inc 3.43% 9 PIP Pepsi-Cola Products Philippines, Inc. 3.17% GTCAP GT Capital Holdings, Inc. 3.40% 10 SMPH Sm Prime Holdings 2.46%


7 J-12 F-12 M-12 A-12 M-12 J-12 J-12 A-12 S-12 O-12 N-12 D-12 J-13 F-13 M-13 A-13 M-13 ASSETS UNDER MANAGEMENT AS OF ,000,000,000 2,500,000,000 2,000,000,000 1,500,000,000 1,000,000, ,000,000 0 SALBF AUM As of P1.5 Bln up 100% YTD As of P2.5 Bln up 56% YTD


8 ASSETS UNDER MANAGEMENT AS OF SALBF MARKET SHARE 46% Sun Life Prosperity Balanced Fund, Inc. Philam Fund, Inc. ALFM Growth Fund, Inc. SALBF 1% 1% 19% GSIS Mutual Fund, Inc. Optima Balanced Fund, Inc. 2% 1% 6% 6% 18% ATRKE Philippine Balanced Fund, Inc. NCM Mutual Fund of the Phils., Inc. Bahay Pari Solidaritas Fund, Inc.


9 46% ASSETS UNDER MANAGEMENT AS OF SALBF MARKET SHARE Sun Life Prosperity Balanced Fund, Inc. ALFM Growth Fund, Inc. Philam Fund, Inc. 1% 1% 0% 1% 4% 21% First Metro Save and Learn Balanced Fund, Inc. PAMI Horizon Fund, Inc. ATRKE Philippine Balanced Fund, Inc. NCM Mutual Fund of the Phils., Inc. 7% 19% Bahay Pari Solidaritas Fund, Inc. Optima Balanced Fund, Inc.
10 COMPARATIVE FUND PERFORMANCE AS OF Period 1-yr 3-yr 5-yr YTD Rank Bahay Pari Solidaritas Fund 25.69% 19.09% na 25.48% 1 Sunlife Prosperity Balanced Fund 25.88% 19.26% 9.50% 25.38% 2 SALBF: % 29.28% 24.02% 25.27% 3 Optima Balanced Fund 24.89% 19.15% 9.36% 24.89% 4 Philam Fund 24.59% 23.94% 11.80% 24.60% 5 GSIS Mutual Fund 23.73% 22.50% 11.46% 23.74% 6 ATRKE Philippine Balanced Fund 23.34% 19.46% 8.30% 23.36% 7 NCM Mutual Fund 22.02% na na 21.52% 8 ALFM Growth Fund 19.49% 22.08% na 19.17% 9 Average (Other Funds) 23.88% 21.85% 12.41% 23.71% SALBF's RANK As of SALBF Yield Fr Total Return % CAGR 18.65%
11
12 EQUITIES MARKET OUTLOOK July 2013


13 MONEY FLOW REVERSAL


 Indonesia (USD 2.")
14 CASH OUTFLOWS TURN WORLD S BEST STOCKS TO WORST: SOUTHEAST ASIA Stock markets in Indonesia, the Philippines and Thailand have gone from being the world s best to among the worst as the threat of reduced bond purchases by the U.S. Federal Reserve sends foreign investors to the exit. (Source: Bloomberg) Korea (USD 4.8 B) Taiwan (USD 4.1 B) Indonesia (USD 2.1 B) Thailand (USD 1.6B) Philippines (USD 387 M) Vietnam (USD 71M)
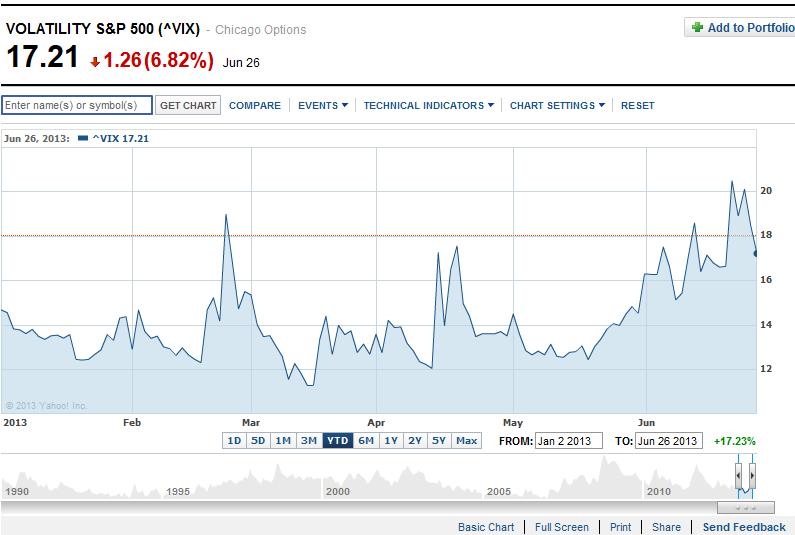
15 VOLATILITY IS BACK!

16 Fundamentals Shaken by Structural Stress China United Sates GDP Growth (1Q13) 7.6% 1.8% Unemployment 4.10% 7.6% Inflation (CPI) 2.10% 1.4% National Savings 50% 13.8% Debt -to-gdp 23% 105% Budget-deficit 1.5% of GDP 8.5% of GDP China Credit Rating Fitch: A+ Fitch: AAA - China has the resources to continue state support for companies - can tap its huge FX reserves of around US$3.5 Trillion - Still has trade surplus of $20.4 bn - Current account surplus of 2.3% of GDP ($47.6 bn)
17 China Risks 1. China economic slowdown/hard landing: growth trimmed to 7.7% from 8.0%, by IMF and World Bank and could slow to 6.0% in Shadow banking: strong credit growth driver - potential source of financial instability 3. Lending boom: which historically precedes financial crises 4. Asset bubble risk: e.g. real estate 5. Policy risk: e.g. effective communication of the Central Bank s intentions

18 OECD: PHL is Strong and Least Vulnerable Composite Coincident Indicators firmed up to points last quarter from points the preceding three months, while the Composite Leading Indicators edged up points from points. Composite Ci
19 E EXPENSIVE BUT HAS UPSIDE PSEi 8,000 7,000 6,000 5,000 4,000 3,000 2,000 1, P/E Estimate 18.7x P/E
20 ACCELERATING GDP UNDERPINS EPS GROWTH Real GDP (in Php tn) EPS Growth % E
21 GDP GROWTH RATES 1Q2004 (Presidential Election Year) 1Q2007 (General Election Year) FY2013 Estimate 7.0% - 7.5% /31/2003 3/31/2004 3/31/2005 3/31/2006 3/31/2007 3/31/2008 3/31/2009 3/31/2010 3/31/2011 3/31/2012 3/31/ /31/2013 1Q2010 (Presidential Election Year)


22 2013 YTD TOTAL RETURN, 2013E EPS GROWTH % SERVICES HOLDING FIRMS PROPERTY FINANCIALS -7.31% INDUSTRIAL MINING & OIL 1.00% 19.53% 18.09% 18.29% 11.30% 21.04% 9.97% 34.17% 31.40% 25.00% -40% -30% -20% -10% 0% 10% 20% 30% 40%
23 SECTOR GDP DRIVERS Growth Rates % Household Consumption Government Consumption Service Sector

24 PHL GROSS INTERNATIONAL RESERVES VS. FOREIGN DEBT
25 PHL CURRENT ACCOUNT & BALANCE OF PAYMENTS
26 PHL NET DEBT/EQUITY
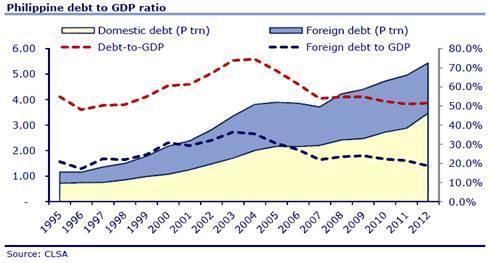
27 PHL DEBT-TO-GDP
28
29 7/11/2008 1/27/2009 8/15/2009 3/3/2010 9/19/2010 4/7/ /24/2011 5/11/ /27/2012 6/15/2013 SALEF vs PSEi Performance Comparison SALBF VS PSEI PERFORMANCE COMPARISON YTD 1Y 3Y 5Y 2012 SALBF 7% 13% 83% 211% 25% PSEi 9% 20% 89% 151% 33% -22% -15% SALBF PSEi
30 7/4/2008 1/20/2009 8/8/2009 2/24/2010 9/12/2010 3/31/ /17/2011 5/4/ /20/2012 6/8/2013 SALEF vs PSEi Performance Comparison SALEF VS PSEI PERFORMANCE COMPARISON SALEF: -19% PSEi: -22% YTD 1Y 3Y 5Y 2012 SALEF 5% 12% 89% 209% 27% PSEi 8% 19% 89% 151% 33% PSEi SALEF


31 SECTOR PICKS FINANCIALS 15% PROPERTY 14% HOLDING FIRMS 22% POWER & ENERGY 22% CONSUMERS 27%


32 A NEW ERA THE NEW NORMAL 1. Monetary tightening 2. Rate increases 3. Sterilization of excess liquidity 4. Market corrections 5. Prevention of economic overheating

33 WHAT THE US RECOVERY MEANS TO PHL Short term Negative impact due to volatility Long term Positive impact due to more trade US is our biggest trading partner Money flows will return to EMs with solid fundamentals
34 FORECAST PSEi target 7,200 by year-end Underpinned by 20% EPS growth (normalized for banks) 18.7x PE In sync w/ accelerating 2013 GDP, 7.0%-7.5% GDP Growth Drivers: Nearly 100M population, bigger than Malaysia, Taiwan, HK and Singapore combined. Government expenditure PPP, Double-digit Public % Private Construction Growth Services Sector Projected GDP per capita at USD2,850 in 2013 (from USD2,600 in 2012) Investment grade credit rating Strong liquidity Fastest growing economy in Asia with 1Q13 GDP of 7.8%

35 E n d o f R e p o r t
36
37 FIRST METRO SAVE & LEARN DOLLAR BOND FUND, INC President s Report
38 FIRST METRO SAVE AND LEARN DOLLAR BOND FUND, INC. (Formerly First Metro Save and Learn Money Market Fund, Inc.) (An Open-End Mutual Fund Company) STATEMENTS OF COMPREHENSIVE INCOME FINANCIAL HIGHLIGHTS AS OF Years Ended December % VAR INVESTMENT INCOME Interest income (Notes 11 and 14) 7,809,724 7,138, % Trading gains 0.0% 7,809,724 7,138, % OPERATING EXPENSES n.a. Management fees (Note 14) 1,284,327 1,339, % Directors and officers fees (Note 14) 222, , % Custodian and clearing fees 110,627 60, % Professional fees 67,760 56, % Taxes and licenses 30,072 27, % Miscellaneous 21,399 33, % 1,736,185 1,740, % INVESTMENT INCOME BEFORE INCOME TAX 6,073,539 5,398, % PROVISION FOR FINAL TAX (Note 12) 1,561,945 1,522, % NET INVESTMENT INCOME 4,511,594 3,876, %
39 FINANCIAL HIGHLIGHTS AS OF FIRST METRO SAVE AND LEARN DOLLAR BOND FUND, INC. (Formerly First Metro Save and Learn Money Market Fund, Inc.) (An Open-End Mutual Fund Company) STATEMENTS OF FINANCIAL POSITION Years Ended December % VAR ASSETS Cash and cash equivalents (Notes 6 and 14) 211,576, ,701, % Accrued interest receivable (Notes 7 and 14) 388, , % 211,964, ,206, % LIABILITIES Accounts payable and accrued expenses (Notes 8 and 14) 213, , % EQUITY Capital stock (Note 9) 19,834,265 19,715, % Additional paid-in capital (Note 9) 181,997, ,845, % Retained earnings 9,919,981 5,416, % 211,751, ,977, % 211,964, ,206, %
40 FINANCIAL HIGHLIGHTS AS OF SALDBF: SUMMARY OF INCOME STATEMENT % VAR. TOTAL INCOME 2,446, ,982, % TOTAL EXPENSES 892, , % IBIT 1,554, ,174, % NET INCOME 1,065, ,377, % SALDBF: SUMMARY OF BALANCE SHEET % VAR. TOTAL ASSETS 212,935, ,964, % TOTAL LIABILITIES 267, , % CAPITAL 212,667, ,778, %


41 SALDBF PORTFOLIO ALLOCATION PORTFOLIO ALLOCATION AS OF Loans and receivables 15% AFS investments 22% Cash & cash equivalents 63%
42 J-12 F-12 M-12 A-12 M-12 J-12 J-12 A-12 S-12 O-12 N-12 D-12 J-13 F-13 M-13 A-13 M-13 J-13 ASSETS UNDER MANAGEMENT AS OF ,000, ,000, ,000, ,000, ,000, ,000, ,000, ,000, ,000, ,000, ,000, ,000,000 SALDBF AUM As of P212 Mln Up2.8% YTD As of P213 Mln up 0.4% YTD


43 ASSETS UNDER MANAGEMENT AS OF % SALMMF MARKET SHARE 19% ALFM Money Market Fund, Inc. ATR KimEng Money Market Fund, Inc. SALMMF 0% 13% 66% Philam Managed Income Fund, Inc. Sun Life Prosperity Money Market Fund
44 COMPARATIVE FUND PERFORMANCE AS OF Period 30-day 90-day 180-day YTD Rank ALFM Money Market Fund 0.15% 0.69% na 3.02% 1 Philam Managed Income Fund -0.08% 0.44% 1.04% 2.43% 2 SALMF: % 0.50% 1.02% 2.19% 3 Sunlife Prosperity Money Market Fund 0.01% 0.04% 0.10% 0.37% 4 Average (Other Funds) 0.06% 0.42% 0.72% 2.00% SALMF's RANK SALMMF Yield Fr Total Return 6.05% CAGR 1.66%
45 E n d o f R e p o r t
46
47 FIRST METRO SAVE & LEARN FIXED-INCOME FUND, INC President s Report
48 FIRST METRO SAVE AND LEARN FIXED-INCOME FUND, INC. (An Open-End Mutual Fund Company) STATEMENTS OF COMPREHENSIVE INCOME INCOME FINANCIAL HIGHLIGHTS AS OF % VAR Trading gain - net (Notes 7 and 8) 163,021,732 93,821,050 74% Interest income (Note 12) 60,005,863 26,272, % Miscellaneous Income 4,051,071 n.a. EXPENSES 227,078, ,093,963 89% Management fees (Note 16) 40,909,200 18,763, % Taxes and licenses (Note 17) 7,753,848 4,611,339 68% Professional fees 172, ,680-32% Directors and officers fees (Note 16) 232, ,000 9% Custodian and clearing fees 111,631 60,099 86% Miscellaneous 1,576,210 1,444,221 9% 50,755,369 25,344, % INVESTMENT INCOME BEFORE INCOME TAX 176,323,297 94,749,241 86% PROVISION FOR INCOME TAX (Note 13) 10,060,443 3,532, % NET INVESTMENT INCOME (Note 14) 166,262,854 91,216,336 82% OTHER COMPREHENSIVE INCOME Changes in fair values of available-for-sale investments 4,663,464 4,312,799 8% Income tax effect (Notes 7 and 13) Years Ended December 31 TOTAL COMPREHENSIVE INCOME 170,926,318 95,529,135 79%
49 FIRST METRO SAVE AND LEARN FIXED-INCOME FUND, INC. (An Open-End Mutual Fund Company) STATEMENTS OF FINANCIAL POSITION FINANCIAL HIGHLIGHTS AS OF Years Ended December % VAR ASSETS Cash and cash equivalents (Notes 6 and 16) 270,806, ,376,674-65% Financial assets at fair value through profit or loss (Note 7) 1,198,684,928 - n.a. Available-for-sale investments (Note 7) 273,388,234 59,153, % Loans and receivables (Notes 8 and 16) 186,242, ,384,859-20% Other assets 659, , % TOTAL ASSETS 1,929,781,873 1,070,223,890 80% LIABILITIES Accounts payable and accrued expenses (Notes 9 and 16) 15,416,135 9,127,268 69% Derivative liabilities (Note 8) - 3,138,280 n.a. 15,416,135 12,265,548 26% EQUITY Capital stock (Note 10) 995,304, ,474, % Additional paid-in capital (Note 10) 555,469,510 93,693, % Deposits for future shares subscriptions (Note 10) 78,085, ,292,479-85% Net unrealized gain on AFS investments (Note 7) 8,976,263 4,312, % Retained earnings 276,530, ,184, % 1,914,365,738 1,057,958,342 81% TOTAL LIABILITIES AND EQUITY 1,929,781,873 1,070,223,890 80%
50 FINANCIAL HIGHLIGHTS AS OF SALFIF: SUMMARY OF INCOME STATEMENT % VAR. TOTAL INCOME 467,186, ,611, % TOTAL EXPENSES 38,548, ,665, % IBIT 428,637, ,945, % NET INCOME 420,138, ,273, % SALFIF: SUMMARY OF BALANCE SHEET % VAR. TOTAL ASSETS 3,161,468, ,925,853, % TOTAL LIABILITIES 113,253, ,332, % CAPITAL 3,048,215, ,920,520, %
51 PORTFOLIO ALLOCATION RANK INSTRUMENT % INSTRUMENT % FXTN 59.91% 1 FXTN 52.63% Bonds 18.17% 2 Bonds 18.60% Time Deposits 13.85% 3 Retail Treasury Bond 10.65% Loans and Discounts 8.08% 4 Loans and Discounts 9.52% 5 Time Deposits 8.60%
52 J-12 F-12 M-12 A-12 M-12 J-12 J-12 A-12 S-12 O-12 N-12 D-12 J-13 F-13 M-13 A-13 M-13 J-13 ASSETS UNDER MANAGEMENT AS OF ,500,000,000 3,000,000,000 2,500,000,000 2,000,000,000 1,500,000,000 1,000,000, ,000,000 0 SALFIF AUM As of P1.9 Bln Up 82% YTD As of P3.0 Bln up 59% YTD


53 ASSETS UNDER MANAGEMENT AS OF ALFM Peso Bond Fund, Inc. SALFIF MARKET SHARE 1% Cocolife Fixed Income Fund, Inc. Ekklesia Mutual Fund, Inc. 0% 1% 8% 3% 0% 3% 0% 9% 75% SALFIF Grepalife Bond Fund Corporation Philam Bond Fund, Inc. Philequity Peso Bond Fund, Inc. Prudentialife Fixed Income Fund, Inc. Sun Life Prosperity Bond Fund, Inc. Sun Life Prosperity GS Fund, Inc.

54 ASSETS UNDER MANAGEMENT AS OF SALFIF MARKET SHARE ALFM Peso Bond Fund, Inc. 80% Philam Bond Fund, Inc. 0% 0% 1% 0% 0% 2% 3% 7% 7% Sun Life Prosperity Bond Fund, Inc. First Metro Save and Learn Fixed Income Fund, Inc. Cocolife Fixed Income Fund, Inc. Sun Life Prosperity GS Fund, Inc. Grepalife Bond Fund Corporation Philequity Peso Bond Fund, Inc. Ekklesia Mutual Fund, Inc. Prudentialife Fixed Income Fund, Inc.
55 COMPARATIVE FUND PERFORMANCE AS OF Period 1-yr 3-yr 5-yr YTD Rank SALFIF: % 11.97% 8.56% 11.31% 1 Grepalife Bond Fund 10.71% NA NA 10.77% 2 Philam Bond Fund 10.33% 8.34% 6.51% 8.97% 3 Philequity Peso Bond Fund 6.91% NA NA 8.03% 4 Prudential Fixed Income Fund 7.82% 5.24% 2.82% 7.82% 5 Cocolife Fixed Income Fund 7.67% 8.89% 8.94% 7.63% 6 Ekklesia Mutual Fund 7.05% 7.87% 6.04% 6.82% 7 Sun Life Prosperity GS Fund 6.48% 7.68% 6.28% 6.05% 8 ALFM Peso Bond Fund 5.99% 7.23% 6.14% 5.87% 9 Sun Life Prosperity Bond Fund 5.84% 7.38% 5.87% 5.75% 10 Average (Other Funds) 8.03% 8.08% 6.40% 7.90% SALFIF's RANK As of SALFIF Yield Fr Total Return 83.61% CAGR 8.77%
56

57 First Metro Asset Management, Inc. FUND PERFORMANCE AND OUTLOOK SAVE AND LEARN FIXED INCOME FUND July 13, 2013
58 2013 PERFORMANCE as of July 12, 2013 Fund Size: PhP3,112,328,501 NAVPU: YTD Return: 18.17% 5-Year Government Bond 3-Year Government Bond China Bank TD (30 days) BDO TD (30 days) Metrobank TD (30 days) Gross % % 1.250% 1.250% 0.875% Net % % 1.00% 1.00% 0.70%
59 2013 PERFORMANCE NAVPU January 2008 July 12, NAVPU % % 12.05% % % %

60 2013 PERFORMANCE 20-Year Government Securities Yield January 2008 July 12, YTD 2013 Trading Gain 9.250M M M M M Interest Income M M M M M

61 2013 PERFORMANCE SALFIF vs Industry as of July 12, Dec Jul-13 YTD % change SALFIF % Philequity Peso Bond Fund, Inc % Prudential Fixed Income Fund % Ekklesia Mutual Fund % Philam Bond Fund % Sun Life Prosperity Bond Fund % Ayala Life Fixed Income Fund % Grepalife Bond Fund Corp % Sun Life Prosperity GS Fund % Cocolife Fixed Income Fund %
62 2013 PERFORMANCE Portfolio Mix as of July 12, 2013 Trading Portfolio PRINCIPAL NET RATE/ YTM % OF FUND CASH 79,309, % 2.926% TIME DEPOSIT 275,355, % % PROMISSORY NOTES 30,000, % 1.107% GOVERNMENT SECURITIES 1,382,430, % % SUBTOTAL 1,767,095, % % Annuity Portfolio PRINCIPAL NET RATE/ YTM % OF FUND CORPORATE NOTES 445,950, % % CORPORATE BONDS 497,860, % % SUBTOTAL 943,810, % % TOTAL PORTFOLIO 2,710,905, % 100%
63 PHILIPPINE INTEREST RATES Dec 30, Dec 29, 2011 Dec 28, m 6m 1y 2y 3y 4y 5y 6y 7y 8y 9y 10y 15y 20y 25y
64 PHILIPPINE INTEREST RATES Dec 28, July 12, m 6m 1y 2y 3y 4y 5y 6y 7y 8y 9y 10y 15y 20y 25y
65 PHILIPPINE INTEREST RATES July 12, Year-End m 6m 1y 2y 3y 4y 5y 6y 7y 8y 9y 10y 15y 20y 25y

66 E n d o f R e p o r t
SALEF AUM ASSETS UNDER MANAGEMENT
 Jan-11 Feb-11 Mar-11 Apr-11 May-11 Jun-11 Jul-11 Aug-11 Sep-11 Oct-11 Nov-11 Dec-11 Jan-12 Feb-12 Mar-12 Apr-12 May-12 Jun-12 ASSETS UNDER MANAGEMENT 5,000,000,000 4,500,000,000 4,000,000,000 3,500,000,000
Fund Performance and Composition As of August 31, 2016 PAST 30 DAYS 0.14% 0.07% Year-To-Date 1.04% 0.61% Year-On-Year 1.54% 0.88%
 PNB Prime Peso Money Market Fund MONEY MAET This fund is best suited for conservative investors who are after investment returns better than deposits. The PNB Prime Peso Money Market Fund is invested in
EAST WEST BANKING CORPORATION EASTWEST PESO MONEY MARKET FUND KEY INFORMATION AND INVESTMENT DISCLOSURE STATEMENT. For the Month 31 May 2018
 EAST WEST BANKING CORPORATION > Your dream Our focus < EASTWEST PESO MONEY MARKET FUND KEY INFORMATION AND INVESTMENT DISCLOSURE STATEMENT For the Month 31 May 2018 FUND FACTS Classification: Peso Money
EAST WEST BANKING CORPORATION EASTWEST DOLLAR INTERMEDIATE TERM BOND FUND KEY INFORMATION AND INVESTMENT DISCLOSURE STATEMENT
 EAST WEST BANKING CORPORATION > Your dream Our focus < EASTWEST DOLLAR INTERMEDIATE TERM BOND FUND KEY INFORMATION AND INVESTMENT DISCLOSURE STATEMENT For the Month 29 September 2017 FUND FACTS Classification:
EAST WEST BANKING CORPORATION EASTWEST PESO MONEY MARKET FUND KEY INFORMATION AND INVESTMENT DISCLOSURE STATEMENT. For the Month 31 January 2019
 EAST WEST BANKING CORPORATION EASTWEST PESO MONEY MARKET FUND KEY INFORMATION AND INVESTMENT DISCLOSURE STATEMENT > Your dream Our focus < For the Month 31 January 2019 FUND FACTS Classification: Peso
EAST WEST BANKING CORPORATION EASTWEST PESO MONEY MARKET FUND KEY INFORMATION AND INVESTMENT DISCLOSURE STATEMENT. For the Month 29 November 2018
 EAST WEST BANKING CORPORATION EASTWEST PESO MONEY MARKET FUND KEY INFORMATION AND INVESTMENT DISCLOSURE STATEMENT > Your dream Our focus < For the Month 29 November 2018 FUND FACTS Classification: Peso
EAST WEST BANKING CORPORATION EASTWEST PESO MONEY MARKET FUND KEY INFORMATION AND INVESTMENT DISCLOSURE STATEMENT. For the Month 31 July 2017
 EAST WEST BANKING CORPORATION EASTWEST PESO MONEY MARKET FUND KEY INFORMATION AND INVESTMENT DISCLOSURE STATEMENT For the Month 31 July 2017 FUND FACTS Classification: Peso Money Net Asset Value per Unit
EAST WEST BANKING CORPORATION EASTWEST DOLLAR INTERMEDIATE TERM BOND FUND KEY INFORMATION AND INVESTMENT DISCLOSURE STATEMENT
 EAST WEST BANKING CORPORATION > Your dream Our focus < EASTWEST DOLLAR INTERMEDIATE TERM BOND FUND KEY INFORMATION AND INVESTMENT DISCLOSURE STATEMENT For the Month 29 December 2017 FUND FACTS Classification:
EAST WEST BANKING CORPORATION EASTWEST PESO MONEY MARKET FUND KEY INFORMATION AND INVESTMENT DISCLOSURE STATEMENT. For the Quarter 31 March 2017
 EAST WEST BANKING CORPORATION EASTWEST PESO MONEY MARKET FUND KEY INFORMATION AND INVESTMENT DISCLOSURE STATEMENT For the Quarter 31 March 2017 FUND FACTS Classification: Peso Money Market Net Asset Value
APRIL LYNN TAN, CFA VP & HEAD OF RESEARCH
 APRIL LYNN TAN, CFA VP & HEAD OF RESEARCH Stay the Course! PSEi on track to hit 10,000 by 2020 at the latest 11000 10000 PSEi 10,000 10,000 9000 8000 7,500 7000 6000 5000 4000 3000 2012 2013 2014 2015
EAST WEST BANKING CORPORATION EASTWEST PESO MONEY MARKET FUND KEY INFORMATION AND INVESTMENT DISCLOSURE STATEMENT. For the Quarter 31 December 2015
 EAST WEST BANKING CORPORATION > Your dream Our focus < EASTWEST PESO MONEY MARKET FUND KEY INFORMATION AND INVESTMENT DISCLOSURE STATEMENT For the Quarter 31 December 2015 FUND FACTS Classification: Peso
EAST WEST BANKING CORPORATION EASTWEST DOLLAR INTERMEDIATE TERM BOND FUND KEY INFORMATION AND INVESTMENT DISCLOSURE STATEMENT
 EAST WEST BANKING CORPORATION > Your dream Our focus < EASTWEST DOLLAR INTERMEDIATE TERM BOND FUND KEY INFORMATION AND INVESTMENT DISCLOSURE STATEMENT For the Month 31 January 2018 FUND FACTS Classification:
Yield ( ). Outstanding Amount (billion) Growth Rate (%) Q Q Q Q Q PHP USD PHP USD PHP USD q-o-q y-o-y q-o-q y-o-y
. Outstanding Amount (billion) Growth Rate (%) Q Q Q Q Q PHP USD PHP USD PHP USD q-o-q y-o-y q-o-q y-o-y") 72 Asia Bond Monitor Philippines Yield Movements Between 1 March and 15 May, local currency (LCY) government bond yields in the Philippines rose for the 0.25-, 0.5-, 1-, 2-, 10-, and 25-year tenors; and
72 Asia Bond Monitor Philippines Yield Movements Between 1 March and 15 May, local currency (LCY) government bond yields in the Philippines rose for the 0.25-, 0.5-, 1-, 2-, 10-, and 25-year tenors; and
EAST WEST BANKING CORPORATION EASTWEST DOLLAR INTERMEDIATE TERM BOND FUND KEY INFORMATION AND INVESTMENT DISCLOSURE STATEMENT
 EAST WEST BANKING CORPORATION > Your dream Our focus < EASTWEST DOLLAR INTERMEDIATE TERM BOND FUND KEY INFORMATION AND INVESTMENT DISCLOSURE STATEMENT For the Month 31 August 2017 FUND FACTS Classification:
L-1 Part 2 Introduction to Indonesia Case Study
 L-1 Part 2 Introduction to Indonesia Case Study IMF Singapore Regional Training Institute OT 18.52 Macroeconomic Diagnostics February 26 March 2, 2018 Presenter Stephan Danninger This training material
EAST WEST BANKING CORPORATION EASTWEST PESO MONEY MARKET FUND KEY INFORMATION AND INVESTMENT DISCLOSURE STATEMENT. For the Month 30 April 2018
 EAST WEST BANKING CORPORATION > Your dream Our focus < EASTWEST PESO MONEY MARKET FUND KEY INFORMATION AND INVESTMENT DISCLOSURE STATEMENT For the Month 30 April 2018 FUND FACTS Classification: Peso Money
AXA UL Funds. Annual Report 2017
 AXA UL Funds Annual Report 2017 Table of Contents Statement of Assets and Liabilities Philippine Economy: 2017 Snapshot Local Equity Market Fixed Income Market Update Wealth Equity Fund Opportunity Fund
Philippine Country Report Asia Securities Forum Ismael G. Cruz Philippine Association of Securities Brokers Dealers
 Philippine Country Report Asia Securities Forum 2016 Ismael G. Cruz Philippine Association of Securities Brokers Dealers PHL GDP Growth Of 6.2% from 2010 to 2015, Accelerating from 4.9% in 2000-2009, and
Philippines. Yield Movements. 80 Asia Bond Monitor
 80 Asia Bond Monitor Philippines Yield Movements Between 1 March and 15 May, local currency (LCY) government bond yields in the Philippines rose for all tenors except the 3-year, 7-year, and 10-year maturities,
Fund Performance Review
 Fund Performance Review DR. VICENTE K. FABELLA Treasurer 2017, Looking back 2017 is the year of optimisms, surprises and the unexpected. It produces exceptionally good investment returns as both advanced
Sustaining Resilience, Expanding Opportunities for Inclusive Growth
 1 Sustaining Resilience, Expanding Opportunities for Inclusive Growth Deputy Governor Diwa C. Guinigundo Bangko Sentral ng Pilipinas Source: Google images 2 PH emerges as growth leader in the ASEAN pack
CTBC BANK (PHILIPPINES) CORPORATION - TRUST AND INVESTMENT SERVICES DEPARTMENT
 CORPORATION - TRUST AND INVESTMENT SERVICES DEPARTMENT") CTBC BANK (PHILIPPINES) CORPORATION - TRUST AND INVESTMENT SERVICES DEPARTMENT CTBC MONEY MARKET FUND KEY INFORMATION AND INVESTMENT DISCLOSURE STATEMENT QUARTER ENDED SEPTEMBER 30, 2018 FUND FACTS Classification
CTBC BANK (PHILIPPINES) CORPORATION - TRUST AND INVESTMENT SERVICES DEPARTMENT CTBC MONEY MARKET FUND KEY INFORMATION AND INVESTMENT DISCLOSURE STATEMENT QUARTER ENDED SEPTEMBER 30, 2018 FUND FACTS Classification
Content. Message from the President. Fund Manager s Report. Independent Auditors Report. Statements of Financial Position
 Content Message from the President Fund Manager s Report Independent Auditors Report Statements of Financial Position Statements of Comprehensive Income Statements of Changes in Net Assets Attributable
SMSF Investment Seminar Sydney. 18 Oct 2010
 SMSF Investment Seminar Sydney 18 Oct 2010 Important Notice This document has been prepared by Asian Masters Fund Limited (Asian Masters Fund). The material that follows is a presentation of general background
Understanding the Global ASEAN Consumer
 Understanding the Global ASEAN Consumer The Philippines Millennials Roberto B. Tan Treasurer of the Philippines February 2015 ASEAN Offers a Future of Prosperity and Stability Combined GDP of nearly USD3tr
Presentation on Equity Markets. 10 th Jul 18
 Presentation on Equity Markets 10 th Jul 18 Performance: Regional markets 2 Performance: Sectoral Indices 3 International: Factors influencing markets Global Growth: Trade War: EM Currency: Expected growth
China: Beyond the headlines. Bill Maldonado HSBC Global Asset Management
 China: Beyond the headlines Bill Maldonado HSBC Global Asset Management Are you a China Bull or a Bear? Source: Various news publications 2 Bear myth #1: Hard landing? GDP: Growth is slowing, but it s
Philippines. Yield Movements
 Philippines 71 Philippines Yield Movements Between 1 June and 15 August, the yields of Philippine local currency (LCY) bonds of all tenors increased except for the 3-month tenor, which decreased 58 basis
The China Opportunity in the Post-Crisis Era
 The China Opportunity in the Post-Crisis Era Louis Cheung Group President May 2010 P.0 May, 2010 Summary Ⅰ THE CHINA GROWTH STORY Despite recent volatility, the Chinese market remains very attractive Fundamentals
INDONESIA ECONOMIC QUARTERLY MARCH 2013
 INDONESIA ECONOMIC QUARTERLY MARCH 213 PRESSURES MOUNTING Jim Brumby, PREM Sector Manager & Lead Economist Paramadina Public Policy Institute, March 213 www.worldbank.org/id MARCH 213 IEQ LAUNCH PRESENTATION
Developments in Emerging East Asia Bond Markets
 Developments in Emerging East Asia Bond Markets Donghyun Park, Principal Economist Economic Research and Regional Cooperation Department, Asian Development Bank Overview The outlook for economic growth
A Product of Wealth Securities, Inc.
 A Product of Wealth Securities, Inc. Index Value Change % Chg PSEi 5,204.84 35.24 0.6817 All Shares 3,472.24 31.49 0.9152 Financials 1,292.15 2.75 0.2133 Industrial 7,851.72 14.73 0.1873 Holding Firms
Philippines. Yield Movements
 Market Summaries Philippines Yield Movements Between end-september and end-december, Philippine local currency (LCY) government bond yields fell for most tenors with the exception of the 2- and 3-year
Philippines. Yield Movements. Size and Composition
 Philippines 67 Philippines Yield Movements Between 1 June and 14 August, Philippine local currency (LCY) government bond yields fell for most tenors (Figure 1). Yields for tenors of 2 years and below fell
JOM SILKKITIE ASIA EQUITY INVESTMENT FUND Monthly Report April 2018
 JOM Silkkitie Asia Equity Investment Fund s NAV was 260.83 at the end of April, so the performance during the month stood at +2.03%. Since fund inception (31 st July 2009) the NAV has increased by +160.83%,
Changing Economic Landscape and its impact on procurement and supply chains Jonathan Ravelas
 Changing Economic Landscape and its impact on procurement and supply chains Jonathan Ravelas Presentation Outline I. World Economy II. Outlook on the Philippines III. Risks IV. Implications to Supply Chain/Procurement
ASIA EX JAPAN: NEITHER BOOM NOR DOOM
 2016 Global Market Outlook Press Briefing ASIA EX JAPAN: NEITHER BOOM NOR DOOM Anh Lu Portfolio Manager (Asia ex Japan Equity Strategy) The Good news, the Bad News, Our Outlook The Good News Not a crisis
BTMU ASEAN TOPICS. YUMA TSUCHIYA ECONOMIC RESEARCH OFFICE SINGAPORE 23 JANUARY 2018
 BTMU ASEAN TOPICS YUMA TSUCHIYA ECONOMIC RESEARCH OFFICE SINGAPORE yuma_tsuchiya@sg.mufg.jp 23 JANUARY 218 (ORIGINAL JAPANESE VERSION RELEASED ON 28 DECEMBER 217) The Bank of Tokyo-Mitsubishi UFJ, Ltd.
Philippines. Yield Movements. Size and Composition
 Philippines 71 Philippines Yield Movements Between end-june and end-december 2013, yields fell for most Philippine local currency (LCY) bonds, particularly for those with tenors of 3 years and less (Figure
ASEAN+3 Regional Economic Outlook (AREO) 2017: Risks and Opportunities 24 May 2017, Renmin University, China
 2017: Risks and Opportunities 24 May 2017, Renmin University, China") 22 May 2017 ASEAN+3 Regional Economic Outlook (AREO) 2017: Risks and Opportunities 24 May 2017, Renmin University, China Introduction: About AMRO Mandate Conduct macroeconomic and financial surveillance
22 May 2017 ASEAN+3 Regional Economic Outlook (AREO) 2017: Risks and Opportunities 24 May 2017, Renmin University, China Introduction: About AMRO Mandate Conduct macroeconomic and financial surveillance
FY2017, FY2018, FY2019 Economic Outlook - Firm outlook on both domestic and overseas economic growth remains unchanged -
 REVISED to reflect the 2 nd QE for the Oct-Dec Qtr of 2017 FY2017, FY2018, FY2019 Economic Outlook - Firm outlook on both domestic and overseas economic growth remains unchanged - March 8, 2018 Copyright
Indonesia Economic Update QNB Group. October 2014
 Indonesia Economic Update QNB Group October 214 Indonesia Overview The economy has enormous long-term potential based on a rich endowment of natural resources and a large population; the new Jokowi administration
The region has been very successful in mobilizing resources
 The region has been very successful in mobilizing resources US$ billions International reserves (minus gold) US$ billions Financial sector assets 16 12 14 12 Tha Phl Sgp Mys 1 Tha Phl Sgp Mys 1 8 6 Kor
2008 Economic and Market Outlook
 Economic and Market Outlook Presented by: Gareth Watson Warren Jestin Vincent Delisle December 7 Economic Outlook Warren Jestin The Global Economic Landscape is Changing Rapidly Gears Down Emerging Powerhouses
Headlines: Market Summary WEDNESDAY, 10 MAY 2012 INDICES
 WEDNESDAY, 10 MAY 2012 (As of May 18, 2012) Headlines: Alliance Global, Inc. (AGI): 1Q12 core net income Php4.15Bil up 46% y/y Atlas Consolidated Mining (AT): 1Q12 net profits fall sharply on higher operating
Monetary Policy under Fed Normalization and Other Challenges
 Javier Guzmán Calafell, Deputy Governor, Banco de México* Santander Latin America Day London, June 28 th, 2018 */ The opinions and views expressed in this document are the sole responsibility of the author
Nigeria Economic Update QNB Group. September 2014
 Nigeria Economic Update QNB Group September 21 Nigeria Overview A rebasing of GDP in 213 has made Nigeria the biggest economy in Africa with the largest population; the economy is growing rapidly but remains
EASTWEST BANKING CORPORATION EASTWEST PESO MONEY MARKET FUND KEY INFORMATION AND INVESTMENT DISCLOSURE STATEMENT. For the Quarter 30 June 2015
 EASTWEST BANKING CORPORATION > Your dream Our focus < EASTWEST PESO MONEY MARKET FUND KEY INFORMATION AND INVESTMENT DISCLOSURE STATEMENT For the Quarter 30 June 2015 FUND FACTS Classification: Peso Money
Switzerland Economic Update QNB Group. September 2014
 Switzerland Economic Update QNB Group September 14 Switzerland Overview Switzerland s efficient capital markets, highly skilled human capital and low corporate tax rates make it the world's most competitive
Life Insurance in the Philippines, Key Trends and Opportunities to 2017
 Life Insurance in the Philippines, Key Trends and Opportunities to 2017 Reportstack Summary The Philippines has one of the fastest-growing and most promising life insurance segments in Southeast Asia.
EQUITY FUND. May 31, 2013
 EQUITY FUND The PSE index eased 0.69% in May to close at 7,021.95 points. Local stocks succumbed to profit-taking after the index hit an intra-day high of 7,406.65 points mid-month on concerns of steep
Charting Brunei s Economy
 Charting Brunei s Economy Designed to help executives catch up with the economy and incorporate macro impacts into company s planning. Annual subscription includes 2 semiannual issues published in June
Economic and Financial Market Highlights (20-26 March 2010)
") Economic and Financial Market Highlights (-6 March ) Indicators continue to point to strong recoveries amidst rising inflation, but with lingering concerns about the global outlook and sluggish decline
Economic and Financial Market Highlights (-6 March ) Indicators continue to point to strong recoveries amidst rising inflation, but with lingering concerns about the global outlook and sluggish decline
Philippines. Yield Movements. Size and Composition
 Philippines 73 Philippines Yield Movements Between 1 September and 15 October, yield movements for Philippine local currency (LCY) government bond yields were mixed (Figure 1). At the short-end of the
Mexico: 2016 IMF ARTICLE IV CONSULTATION
 Mexico: 2016 IMF ARTICLE IV CONSULTATION Wilson Center, January 9, 2017 Western Hemisphere Department International Monetary Fund BACKGROUND Growth in Economic Activity and Employment Have Remained Stable
RUSSIAN ECONOMIC OUTLOOK AND MONETARY POLICY CHALLENGES RUSSIAN ECONOMIC OUTLOOK AND MONETARY POLICY CHALLENGES. Bank of Russia.
 RUSSIAN ECONOMIC OUTLOOK AND MONETARY POLICY CHALLENGES Bank of Russia July 218 < -1% -1-9% -9-8% -8-7% -7-6% -6-5% -5-4% -4-3% -3-2% -2-1% -1 % 1% 1 2% 2 3% 3 4% 4 5% 5 6% 6 7% 7 8% 8 9% 9 1% 1 11% 11
Recent Asia experiences with capital flows
 Recent Asia experiences with capital flows Rob Subbaraman, Chief Economist Asia Ex-Japan December 2007 Asia ex-japan's total balance of payments % of GDP 10 8 6 4 2 0-2 -4 1996 1997 1998 1999 2000 2001
B-GUIDE: Economic Outlook
 Aug-12 Apr-13 Dec-13 Aug-14 Apr-15 Dec-15 Aug-16 Apr-17 Jul-15 Nov-15 Mar-16 Jul-16 Nov-16 Mar-17 Jul-17 Quarterly Economic Outlook: Quarter 4 2017 4 January 2018 B-GUIDE: Economic Outlook The economy
Economic Briefing for the Philippine Association of National Advertisers. 24 February 2010
 Economic Briefing for the Philippine Association of National Advertisers 24 February 2010 1 Presentation flow 11 themes for 2011 1. Economic growth is real. 2. Service oriented economy. 3. Consumption
FINANCE TO ENSURE ASIA S ECONOMIC GROWTH DR. RANEE JAYAMAHA CHAIRPERSON - HATTON NATIONAL BANK PLC
 FINANCE TO ENSURE ASIA S ECONOMIC GROWTH DR. RANEE JAYAMAHA CHAIRPERSON - HATTON NATIONAL BANK PLC TABLE 1 : REAL GDP GROWTH OF SOUTHEAST ASIA, CHINA AND INDIA (ANNUAL PERCENTAGE CHANGE) PROJECTIONS ASEAN-6
Sandra Crowl, CAIA. Member of the Investment Committee
 Sandra Crowl, CAIA Member of the Investment Committee 1 Macro Backdrop and Investment Ideas for 2018 2 Emerging Markets Tailwinds Overall consumption growth, annual change Global trade growth, in volume
Emerging Markets Debt: Outlook for the Asset Class
 Emerging Markets Debt: Outlook for the Asset Class By Steffen Reichold Emerging Markets Economist May 2, 211 Emerging market debt has been one of the best performing asset classes in recent years due to
Business Outlook for ASEAN Country 2017 Thailand Insurance Symposium December 2016 Bangkok, Thailand. Clarence Wong Chief Economist Asia
 Business Outlook for ASEAN Country 2017 Thailand Insurance Symposium 2016 19 December 2016 Bangkok, Thailand Clarence Wong Chief Economist Asia Agenda What are our top economic concerns? What does this
Philippines. Yield Movements
 Philippines 117 Philippines Yield Movements Between 31 August and 15 October, the yields of Philippine local currency (LCY) bonds of all tenors jumped an average of 189 basis points (bps) (Figure 1). The
FY2018, FY2019 Economic Outlook - The Japanese economy is continuing to follow a recovery track -
 REVISED to reflect the 2 nd QE for the Apr-Jun Qtr of 2018 FY2018, FY2019 Economic Outlook - The Japanese economy is continuing to follow a recovery track - September 10, 2018 Copyright Mizuho Research
Asia Watch. The US giveth, the US taketh away. Group Economics Emerging Markets Research. Group Economics: Enabling smart decisions.
 Asia Watch Group Economics Emerging Markets Research 1 June 18 Arjen van Dijkhuizen Senior Economist Tel: +31 68 85 arjen.van.dijkhuizen@nl.abnamro.com The US giveth, the US taketh away Growth momentum
Quarterly Economic Outlook: Quarter on 25 September 2018 Strong Economic Expansions amidst Uncertainty of Trade War
 Foregin Direct Investment (Billion USD) China U.S. Asia World Quarterly Economic Outlook: Quarter 3 2018 on 25 September 2018 Strong Economic Expansions amidst Uncertainty of Trade War Thai Economy: Thai
Monthly Economic Insight
 Monthly Economic Insight Prepared by : TMB Analytics Date: 22 February 2018 Executive Summary Synchronized global economic growth continued to brighten global economic outlook and global trade outlook.
Indonesia Market Report Asia Securities Forum Susy Meilina & Wientoro Prasetyo Chairperson of APEI (Indonesia Securities Association)
") Indonesia Market Report Asia Securities Forum 2016 Susy Meilina & Wientoro Prasetyo Chairperson of APEI (Indonesia Securities Association) Indonesia Market Report Economic Performance Capital Market Performance
Indonesia Market Report Asia Securities Forum 2016 Susy Meilina & Wientoro Prasetyo Chairperson of APEI (Indonesia Securities Association) Indonesia Market Report Economic Performance Capital Market Performance
The Outlook for Asian & Australian Economies
 The Outlook for Asian & Australian Economies Asian economies maintain stable growth led by domestic demand although growth pace slows down slightly AKI FUKUCHI, YOKO HAGIWARA ECONOMIC RESEARCH OFFICE TOKYO
Looking past the abyss 穿越市場陰霾
 January 2012 Looking past the abyss 穿越市場陰霾 -- 2012 Outlook Issued by The Hongkong and Shanghai Banking Corporation Limited Market Overview Market performance in 2011 Equities Fixed Income Source: Morningstar
Principal Asia Pacific High Dividend Equity Fund Grasp the Chance for Yielding Growth and Income! August 2018
 Principal Prosperity Series Principal Asia Pacific High Dividend Equity Fund Grasp the Chance for Yielding Growth and Income! August 218 Important Notes 1. The Principal Asia Pacific High Dividend Equity
EASTWEST BANKING CORPORATION
 EASTWEST BANKING CORPORATION > Your dream Our focus < INFINITY DOLLAR INTERMEDIATE TERM BOND FUND KEY INFORMATION AND INVESTMENT DISCLOSURE STATEMENT For the Quarter 31 March 2015 FUND FACTS Classification:
Capital and Business Alliance with Security Bank Corporation
 The Bank of Tokyo-Mitsubishi UFJ, Ltd. Capital and Business Alliance with Security Bank Corporation Tokyo, January 1---The Bank of Tokyo-Mitsubishi UFJ, Ltd. (BTMU) (President: Nobuyuki Hirano) announced
Philippines. Yield Movements. 112 Asia Bond Monitor
 112 Asia Bond Monitor Philippines Yield Movements Between 1 September and 31 October, yields movements for Philippine local currency (LCY) government bonds were mixed (Figure 1). Yields at the short-end
Charting Myanmar s Economy
 Charting Myanmar s Economy Designed to help executives catch up with the economy and incorporate macro impacts into company s planning. Annual subscription includes 2 semiannual issues published in June
CLSA Investor forum. September 14, 2017
 CLSA Investor forum September 14, 2017 Agenda Opportunity Industry and Competitive landscape Company strategy and performance 2 Agenda Opportunity Industry and Competitive landscape Company strategy and
The World Economic & Financial System: Risks & Prospects
 The World Economic & Financial System: Risks & Prospects Dr. Jacob A. Frenkel Chairman & CEO Group of Thirty (G30).Bank Indonesia 7th Annual International Seminar Global Financial Tsunami: What Can We
Eighth UNCTAD Debt Management Conference
 Eighth UNCTAD Debt Management Conference Geneva, 14-16 November 2011 Interactions between Government Domestic Borrowing Needs and the Corporate Sector by Mr. Roberto Juanchito T. Dispo President / Director,
Bank of America Merrill Lynch The Future of Financials Conference. November 6, Citi Investor Relations
 Citi Investor Relations Bank of America Merrill Lynch The Future of Financials Conference November 6, 2018 Francisco Aristeguieta CEO, Citigroup Asia Pacific Agenda Franchise Overview Asia Institutional
Yen and Yuan. The Impact of Exchange Rate Fluctuations on the Asian Economies. C. H. Kwan RIETI
 Yen and Yuan The Impact of Exchange Rate Fluctuations on the Asian Economies C. H. Kwan RIETI November 21 The Yen-dollar Rate as the Major Determinant of Asian Economic Growth -4-3 -2 Stronger Yen Yen
A Rising Young Democracy FMG INDIA FUND
 A Rising Young Democracy 2019 The Opportunity India is one of the largest and fastest growing emerging market economies It is forecast that India will become the world s most populous country by 2024 It
Developing Asia s Short-Run Economic Outlook and Main Risks
 Developing Asia s Short-Run Economic Outlook and Main Risks Dr. Donghyun Park, Asian Development Bank Workshop on Bond Market Development in Emerging East Asia Raffles Hotel Le Royal Phnom Penh, Cambodia,
MARKET REVIEW & OUTLOOK February 2018
 MARKET REVIEW & OUTLOOK February 2018 1.0 Fixed Income Economics During the month, Malaysia s 4Q2017 GDP was released. Real Gross Domestic Product ( GDP ) grew 5.9% YoY, slightly slower than the 6.2% recorded
Emerging Market Debt Outlook
 Emerging Market Debt Outlook Live Webcast hosted by: Luz Padilla Portfolio Manager Emerging Markets Fixed Income Fund (DBLEX/DLENX) June 15, 2010 Fund Offerings Emerging Markets Fixed Income Fund Retail
France Economic Update QNB Group. September 2014
 France Economic Update QNB Group September 2014 France Overview France is the ninth largest economy in the world on a purchasing power parity basis and service-oriented; high indebtedness and lack of reforms
Southeast Asia s Dynamic Economies. Presented by: Manuel Galatas General Manager, BBVA Asia Madrid, 26 April 2011
 Southeast Asia s Dynamic Economies Presented by: Manuel Galatas General Manager, BBVA Asia Madrid, 26 April 211 Outline 1 Overview of ASEAN economies 2 Southeast Asian Economies the ASEAN-5 Political landscape
International Monetary Fund. World Economic Outlook. Jörg Decressin Senior Advisor Research Department, IMF
 International Monetary Fund World Economic Outlook Jörg Decressin Senior Advisor Research Department, IMF IMF Presentation April 3, The recovery is solidifying but it will take some time before it significantly
Global/Regional Economic and Financial Outlook. Odd Per Brekk Director IMF Regional Office for Asia and the Pacific APEC SFOM, June
 Global/Regional Economic and Financial Outlook Odd Per Brekk Director IMF Regional Office for Asia and the Pacific APEC SFOM, June 11-12 2015 2015/SFOM13/002 Session: 1 Global/Regional Economic and Financial
CONSENSUS FORECAST Philippines
 CONSENSUS FORECAST Contents... 2 Calendar... 12 Notes... 1 Order Form... 1 July 21 Publication date: 2 June 21 Information available: up to and including 2 June 21 Forecasts collected: 1 June - 2 June
FULL-YEAR RESULTS 2007 & OUTLOOK
 FULL-YEAR RESULTS 2007 & OUTLOOK Presentation by: President & CEO Niels Henrik Jensen Group CFO Michael Østerlund Madsen 28 February 2008 Copenhagen AGENDA Group highlights 2007 Performance Foods Industrial
Public Islamic Asia Leaders Equity Fund (PIALEF)
") Fund Information Fund Name (PIALEF) Fund Category Equity (Shariah-compliant) Fund Investment Objective To achieve capital growth over the medium to long term period by investing mainly in stocks of companies
Fund Information Fund Name (PIALEF) Fund Category Equity (Shariah-compliant) Fund Investment Objective To achieve capital growth over the medium to long term period by investing mainly in stocks of companies
INDONESIA. Figure 1. Less affected by shocks (Rupiah exchange rate before and after bombings) I. Recent Economic and Social Developments.
 I. Recent Economic and Social Developments.") INDONESIA The next few months are crucial to Indonesia s mediumterm economic picture. A new economic policy package and early implementation steps by the new government would draw further attention from
INDONESIA The next few months are crucial to Indonesia s mediumterm economic picture. A new economic policy package and early implementation steps by the new government would draw further attention from
Themes in bond investing June 2009
 For professional investors only Not for public distribution May 2011 Themes in bond investing June 2009 China: an update on the market and government policy Introduction After disappointing performance
JOM FUNDS CURRENT ACCOUNT IN THE PHILIPPINES Monthly Report February 2014
 musd JOM FUNDS In this monthly comment, some views on company meetings of the first Asia trip in 2014. PHILIPPINES First trip to Philippines since late-summer 2012. The growth story seems to be stronger
A Rising Young Democracy
 A Rising Young Democracy Q2 2015 FMG INDIA FUND The Opportunity India is one of the largest and fastest growing emerging market economies; It is forecast that India will overtake China by 2030 as the world
Asia Key Economic and Financial Indicators 20-Oct-16
 Asia Key Economic and Financial Indicators -Oct- ASEAN Brunei (BN) Cambodia (KH) Indonesia () Laos (LA) Malaysia () Myanmar (MM) Philippines () Singapore () Thailand () Vietnam () East Asia China (CN)
Asia Bond Monitor March 2015
 June 1 asianbondsonline.adb.org Key Developments in Asian Local Currency Markets Consumer price inflation in Malaysia accelerated to.1% year-on-year (y-o-y) in May from 1.8% y-o-y in April, mainly due
Asia and the Pacific: Economic Outlook. PFTAC Steering Committee Meeting March 27, 2018 Suva, Fiji
 Asia and the Pacific: Economic Outlook PFTAC Steering Committee Meeting March 27, 2018 Suva, Fiji 1 Growth in the region remains strong... Growth Projections: World and Selected Asia (Percent change from
ASIA BOND MONITOR NOVEMBER 2010
 ASIA BOND MONITOR NOVEMBER 2010 ASIA BOND MONITOR NOVEMBER 2010 2010 Asian Development Bank All rights reserved. Published 2010. Printed in the Philippines. Printed using vegetable oil-based inks on recycled