GRAYSWAN SCORECARDS 01 DECEMBER 2017
|
|
|
- Lorin Garrett
- 5 years ago
- Views:
Transcription
 is an authorised Financial Services Provider (FSP No: 42290).")
1 GRAYSWAN SCORECARDS 01 DECEMBER 2017 Gray Swan Financial Services (Pty) Ltd (Reg No: 2010/009813/07) is an authorised Financial Services Provider (FSP No: 42290).
2 we keep the score, you secure the win EMPOWERING YOU TO INVEST WITH THE BEST INVESTMENT CONSULTING I WEALTH MANAGEMENT I REPORTING 2
3 At GraySwan we do not intend to predict the unpredictable. GraySwans are risks that have unintended consequences but can be identified and should be managed or avoided. Our superior investment and risk advisory services empower you to do exactly that. In theory a "Black Swan" as first described in AD 82 depicted a creature that did not exist. However, in 1790 a Black Swan was discovered and therefore proved the existence of the improbable. Nicholas Taleb used the bird in his book, The Black Swan, to explain that the belief that "all swans are white" is based on the limits of our experience. Some occurrences are unpredictable because they deviate so far beyond what is normally expected. Such experiences are rare but when they occur they have massive consequences. "Black Swan" events are therefore random and unexpected. They are unpredictable unknowns. However, GraySwans, as we coined the term, are risks that can be identified and which have unintended consequences on investors portfolios and therefore should be managed or avoided. INVESTMENT CONSULTING I WEALTH MANAGEMENT I REPORTING 3
4 WANT MORE SCORECARDS? We are your compass to navigate through the investment world. LOCAL SPECIALIST ASSET CLASS Money Market ScoreCard Enhanced Cash ScoreCard Bond ScoreCard Flexible Fixed Interest ScoreCard Credit Bond ScoreCard Inflation Linked Bond ScoreCard Listed Property ScoreCard Passive SWIX ScoreCard Quantitative Equity ScoreCard Equity ALSI ScoreCard Constrained Equity ScoreCard Unconstrained Equity ScoreCard BEE Equity ScoreCard Long Short Equity ScoreCard & Long Short FoF ScoreCard Mid & Small Cap Equity ScoreCard RESPONSIBLE INVESTMENT RI Balanced ScoreCard RI Equity ScoreCard RI Fixed Interest ScoreCard LOCAL BALANCED Guaranteed Fund ScoreCard Domestic Absolute Return ScoreCard Domestic Balanced ScoreCard INVESTMENT CONSULTING I WEALTH MANAGEMENT I REPORTING 4
5 MORE SCORECARDS We are your compass to navigate through the investment world. LOCAL MEDICAL AID Medical Aid Money Market ScoreCard Medical Aid Absolute Return ScoreCard SHARIAH Shariah Balanced ScoreCard Shariah Equity ScoreCard GLOBAL BALANCED Global Absolute Return ScoreCard Global Balanced ScoreCard MULTI-MANAGER Multi-Manager Money Market ScoreCard Multi-Manager Equity ScoreCard Multi-Manager Balanced ScoreCard OFFSHORE SPECIALIST Offshore Balanced ScoreCard Offshore Passive Equity ACWI ScoreCard Offshore Passive Equity DM ScoreCard Offshore Passive Equity EM ScoreCard Offshore Equity ScoreCard Offshore Listed Property ScoreCard Offshore Emerging Markets Equity ScoreCard Offshore China Equity ScoreCard Offshore Africa Equity ScoreCard CONSOLIDATED GraySwan Risk Profile ScoreCard INVESTMENT CONSULTING I WEALTH MANAGEMENT I REPORTING 5
6 TABLE OF CONTENT SA MONEY MARKET FUNDS SA ENHANCED CASH FUNDS SA BOND FUNDS SA LISTED PROPERTY FUNDS Page 7 Page 14 Page 21 Page 28 + Compliance Checklist SA CONSTRAINED EQUITY FUNDS SA UNCONSTRAINED EQUITY FUNDS AFRICA EQUITY EX SOUTH AFRICA FUNDS SA GLOBAL BALANCED FUNDS Page 35 Page 42 Page 51 Page 58
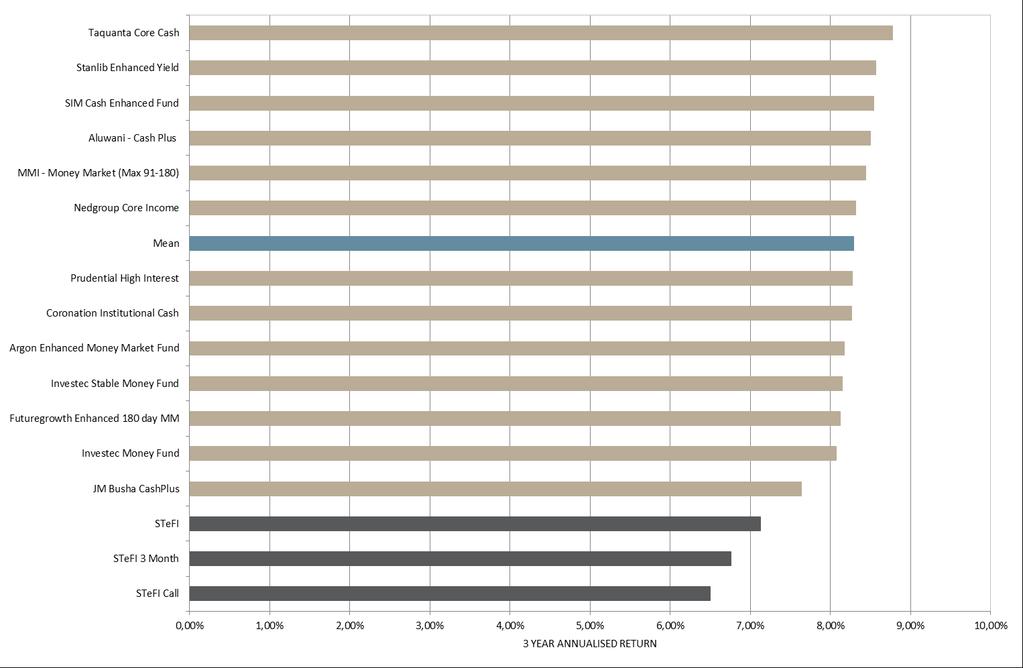
7 SA MONEY MARKET FUNDS We always count 7

8 3 YEAR PERFORMANCE 8
9 5 YEAR PERFORMANCE Pan-African Money Market Taquanta Pooled Cash Coronation Strategic Cash MMI - Money Market (Max 90) Aluwani - Core Money Market Cadiz Money Market Mean SIM Moderate Cash Prescient Money Market Composite Futuregrowth 90 Day Core Money Market Nedgroup Money Market Stanlib Money Market Portfolio Prudential Money Market Nedgroup Corporate Money Market Fund ABSA AM Money Market Allan Gray Money Market STeFI STeFI 3 Month OMIG MacroSolutions (Profile Banker) STeFI Call 0.00% 1.00% 2.00% 3.00% 4.00% 5.00% 6.00% 7.00% 8.00% 9.00% 5 YEAR ANNUALISED RETURN 9
10 ABSOLUTE PERFORMANCE Portfolio 3 Months YTD ABSA AM Money Market 1,93% 12 8,17% 14 8,17% 14 8,23% 12 7,80% 12 6,97% 14 6,80% 12 7,58% 12 Allan Gray Money Market 1,89% 15 7,88% 15 7,88% 15 7,79% 15 7,46% 15 6,76% 15 6,59% 14 7,42% 14 Aluwani - Core Money Market 2,09% 4 8,91% 4 8,91% 4 8,72% 4 8,22% 4 7,43% 5 7,22% 5 8,04% 5 Cadiz Money Market 2,03% 5 8,48% 6 8,48% 6 8,31% 8 8,09% 6 7,33% 6 7,00% 6 7,84% 6 Coronation Strategic Cash 1,95% 11 8,72% 5 8,72% 5 8,64% 5 8,20% 5 7,64% 3 7,58% 1 8,34% 1 Futuregrowth 90 Day Core Money Market 1,95% 10 8,36% 9 8,36% 9 8,29% 10 7,82% 10 7,10% 9 6,85% 11 7,72% 9 MMI - Money Market (Max 90) 2,11% 3 8,95% 3 8,95% 3 8,90% 3 8,39% 3 7,60% 4 7,43% 4 8,22% 3 Nedgroup Corporate Money Market Fund 1,97% 8 8,27% 11 8,27% 11 8,14% 14 7,73% 14 6,97% 13 Nedgroup Money Market 1,97% 9 8,24% 13 8,24% 13 8,17% 13 7,78% 13 7,08% 10 6,87% 9 7,73% 8 OMIG MacroSolutions (Profile Banker) 1,68% 16 6,98% 16 6,98% 16 7,01% 16 6,63% 16 6,05% 16 5,89% 15 6,75% 15 Pan-African Money Market 2,14% 2 9,50% 1 9,50% 1 9,23% 1 8,68% 1 7,78% 1 7,58% 2 8,18% 4 Prescient Money Market Composite 2,01% 6 8,38% 7 8,38% 7 8,30% 9 7,87% 9 7,16% 8 6,98% 7 7,83% 7 Prudential Money Market 1,93% 13 8,27% 12 8,27% 12 8,58% 6 7,89% 8 7,04% 12 6,75% 13 7,57% 13 SIM Moderate Cash 1,93% 14 8,36% 8 8,36% 8 8,34% 7 7,91% 7 7,16% 7 6,93% 8 7,72% 10 Stanlib Money Market Portfolio 2,00% 7 8,33% 10 8,33% 10 8,27% 11 7,81% 11 7,07% 11 6,85% 10 7,67% 11 Taquanta Pooled Cash 2,15% 1 9,34% 2 9,34% 2 9,03% 2 8,53% 2 7,66% 2 7,54% 3 8,29% 2 STeFI 1,80% 7,54% 7,54% 7,47% 7,13% 6,50% 6,33% 7,14% Top Quartile 2,05% 8,77% 8,77% 8,66% 8,20% 7,47% 7,33% 8,11% Mean 1,98% 8,45% 8,45% 8,37% 7,92% 7,17% 6,99% 7,79% Median 1,97% 8,36% 8,36% 8,30% 7,88% 7,13% 6,93% 7,73% Bottom Quartile 1,93% 8,26% 8,26% 8,21% 7,79% 7,03% 6,83% 7,62% STeFI 3 Month 1,71% 7,15% 7,15% 7,10% 6,76% 6,19% 6,04% 6,85% STeFI Call 1,65% 6,88% 6,88% 6,86% 6,50% 5,94% 5,79% 6,59% 10
11 ABSOLUTE CALENDAR YEAR PERFORMANCE Portfolio ABSA AM Money Market 12,02% 15 9,47% 11 7,42% 13 6,31% 6 5,86% 11 5,53% 12 5,94% 15 6,94% 10 8,29% 8 8,17% 14 Allan Gray Money Market 12,13% 12 9,54% 10 7,44% 11 5,87% 14 5,61% 14 5,36% 15 6,08% 13 6,81% 14 7,70% 15 7,88% 15 Aluwani - Core Money Market 12,70% 6 10,09% 2 7,81% 4 6,54% 5 6,31% 5 5,99% 6 6,49% 5 7,23% 6 8,54% 6 8,91% 4 Cadiz Money Market 12,84% 4 9,73% 6 7,53% 8 5,96% 11 5,84% 12 6,28% 4 6,13% 12 7,65% 1 8,15% 12 8,48% 6 Coronation Strategic Cash 13,23% 1 9,72% 7 8,40% 1 7,35% 1 6,70% 3 6,78% 1 6,82% 1 7,32% 5 8,56% 5 8,72% 5 Futuregrowth 90 Day Core Money Market 12,95% 2 9,66% 8 7,46% 10 5,95% 12 5,90% 9 5,78% 7 6,28% 8 6,87% 13 8,23% 9 8,36% 9 MMI - Money Market (Max 90) 12,74% 5 10,08% 3 8,02% 3 6,87% 3 6,58% 4 6,19% 5 6,67% 2 7,37% 4 8,86% 3 8,95% 3 Nedgroup Corporate Money Market Fund 5,50% 14 6,19% 11 6,91% 11 8,02% 14 8,27% 11 Nedgroup Money Market 12,68% 7 9,73% 5 7,65% 7 6,00% 10 5,97% 8 5,70% 10 6,38% 6 7,00% 9 8,10% 13 8,24% 13 OMIG MacroSolutions (Profile Banker) 12,05% 14 8,46% 15 6,37% 15 5,40% 15 5,16% 15 4,82% 16 5,54% 16 5,87% 16 7,04% 16 6,98% 16 Pan-African Money Market 12,11% 13 9,19% 14 7,70% 6 6,69% 4 7,32% 1 6,32% 3 6,59% 3 7,59% 2 8,95% 1 9,50% 1 Prescient Money Market Composite 12,55% 9 10,13% 1 7,72% 5 6,28% 7 6,03% 7 5,65% 11 6,56% 4 7,02% 8 8,22% 10 8,38% 7 Prudential Money Market 12,44% 10 9,44% 12 7,20% 14 5,89% 13 5,71% 13 5,51% 13 6,06% 14 6,51% 15 8,90% 2 8,27% 12 SIM Moderate Cash 12,68% 8 9,28% 13 7,42% 12 6,11% 9 6,08% 6 5,74% 8 6,37% 7 7,06% 7 8,31% 7 8,36% 8 Stanlib Money Market Portfolio 12,39% 11 9,63% 9 7,51% 9 6,14% 8 5,87% 10 5,71% 9 6,22% 10 6,88% 12 8,21% 11 8,33% 10 Taquanta Pooled Cash 12,87% 3 9,85% 4 8,09% 2 7,03% 2 6,92% 2 6,50% 2 6,23% 9 7,55% 3 8,72% 4 9,34% 2 STeFI 11,70% 9,13% 6,93% 5,73% 5,54% 5,19% 5,91% 6,47% 7,39% 7,54% Top Quartile 12,79% 9,79% 7,77% 6,61% 6,44% 6,21% 6,51% 7,33% 8,60% 8,77% Mean 12,56% 9,60% 7,58% 6,29% 6,12% 5,84% 6,29% 7,04% 8,30% 8,45% Median 12,68% 9,66% 7,53% 6,14% 5,97% 5,72% 6,26% 7,01% 8,26% 8,36% Bottom Quartile 12,26% 9,46% 7,43% 5,95% 5,85% 5,52% 6,12% 6,87% 8,13% 8,26% STeFI 3 Month 11,71% 8,64% 6,58% 5,48% 5,34% 5,03% 5,65% 6,08% 7,05% 7,15% STeFI Call 11,34% 8,36% 6,26% 5,29% 5,11% 4,79% 5,42% 5,79% 6,84% 6,88% 11
12 3 YEAR ANNUALISED VOLATILITY & RETURN 12
13 5 YEAR ANNUALISED VOLATILITY & RETURN 13
14 SA ENHANCED CASH FUNDS We always count 14
15 3 YEAR PERFORMANCE 15
16 5 YEAR PERFORMANCE 16
17 ABSOLUTE PERFORMANCE Portfolio 3 Months YTD Aluwani - Cash Plus 2,05% 7 9,25% 2 9,25% 2 9,07% 5 8,50% 4 7,71% 3 7,55% 3 8,32% 3 Argon Enhanced Money Market Fund 2,01% 11 8,83% 10 8,83% 10 8,80% 7 8,17% 9 7,34% 10 7,08% 10 7,84% 11 Coronation Institutional Cash 2,09% 5 8,96% 7 8,96% 7 8,59% 11 8,27% 8 7,53% 6 7,35% 7 8,08% 8 Futuregrowth Enhanced 180 day MM 1,99% 12 8,64% 11 8,64% 11 8,62% 10 8,12% 11 7,27% 11 7,06% 11 7,94% 9 Investec Money Fund 2,04% 9 8,61% 12 8,61% 12 8,54% 12 8,07% 12 7,34% 9 7,32% 8 8,15% 6 Investec Stable Money Fund 2,04% 8 8,96% 8 8,96% 8 8,69% 9 8,15% 10 7,23% 12 7,12% 9 7,91% 10 JM Busha CashPlus 2,11% 3 8,47% 13 8,47% 13 8,02% 13 7,64% 13 7,00% 13 6,92% 12 7,75% 12 MMI - Money Market (Max ) 2,17% 2 9,21% 3 9,21% 3 8,93% 6 8,44% 5 7,70% 5 7,59% 2 8,36% 2 Nedgroup Core Income 2,10% 4 8,84% 9 8,84% 9 8,72% 8 8,31% 6 7,51% 7 7,43% 5 8,22% 5 Prudential High Interest 2,06% 6 9,01% 6 9,01% 6 9,09% 4 8,27% 7 7,45% 8 SIM Cash Enhanced Fund 1,98% 13 9,08% 5 9,08% 5 9,17% 3 8,54% 3 7,70% 4 7,39% 6 8,13% 7 Stanlib Enhanced Yield 2,03% 10 9,11% 4 9,11% 4 9,33% 2 8,57% 2 7,76% 2 7,51% 4 8,31% 4 Taquanta Core Cash 2,25% 1 9,69% 1 9,69% 1 9,34% 1 8,77% 1 7,88% 1 7,70% 1 8,43% 1 STeFI 1,80% 7,54% 7,54% 7,47% 7,13% 6,50% 6,33% 7,14% Top Quartile 2,10% 9,11% 9,11% 9,09% 8,50% 7,70% 7,52% 8,31% Mean 2,07% 8,97% 8,97% 8,84% 8,30% 7,49% 7,34% 8,12% Median 2,05% 8,96% 8,96% 8,80% 8,27% 7,51% 7,37% 8,14% Bottom Quartile 2,03% 8,83% 8,83% 8,62% 8,15% 7,34% 7,11% 7,94% STeFI 3 Month 1,71% 7,15% 7,15% 7,10% 6,76% 6,19% 6,04% 6,85% STeFI Call 1,65% 6,88% 6,88% 6,86% 6,50% 5,94% 5,79% 6,59% 17
18 ABSOLUTE CALENDAR YEAR PERFORMANCE Portfolio Aluwani - Cash Plus 12,83% 7 10,04% 5 8,03% 6 7,04% 3 6,78% 3 6,42% 4 6,67% 3 7,37% 5 8,89% 5 9,25% 2 Argon Enhanced Money Market Fund 12,09% 11 9,83% 9 7,23% 12 6,08% 13 6,60% 6 5,88% 10 6,32% 10 6,93% 11 8,78% 6 8,83% 10 Coronation Institutional Cash 12,94% 4 9,15% 12 7,61% 11 7,00% 4 6,57% 7 5,97% 9 6,89% 1 7,62% 2 8,23% 12 8,96% 7 Futuregrowth Enhanced 180 day MM 13,22% 1 9,89% 8 7,73% 8 6,15% 12 6,25% 12 5,67% 12 6,36% 9 7,14% 8 8,60% 9 8,64% 11 Investec Money Fund 13,12% 2 10,01% 6 8,24% 3 6,89% 6 6,71% 5 6,25% 7 6,25% 12 7,14% 7 8,48% 10 8,61% 12 Investec Stable Money Fund 12,24% 10 10,05% 4 7,83% 7 6,65% 8 6,36% 11 5,82% 11 5,91% 13 7,07% 9 8,43% 11 8,96% 8 JM Busha CashPlus 11,96% 12 10,32% 1 7,70% 9 6,50% 10 6,15% 13 5,63% 13 6,46% 5 6,89% 12 7,57% 13 8,47% 13 MMI - Money Market (Max ) 12,79% 9 10,14% 3 8,25% 2 7,09% 2 6,92% 2 6,46% 3 6,71% 2 7,47% 4 8,66% 7 9,21% 3 Nedgroup Core Income 12,89% 5 9,98% 7 8,30% 1 6,93% 5 6,71% 4 6,34% 6 6,28% 11 7,50% 3 8,60% 8 8,84% 9 Prudential High Interest 6,54% 9 6,44% 10 6,08% 8 6,39% 7 6,67% 13 9,16% 3 9,01% 6 SIM Cash Enhanced Fund 12,80% 8 9,50% 11 7,62% 10 6,46% 11 6,55% 8 6,36% 5 6,53% 4 7,31% 6 9,26% 2 9,08% 5 Stanlib Enhanced Yield 12,87% 6 10,23% 2 8,06% 4 6,77% 7 6,51% 9 6,64% 2 6,46% 6 7,04% 10 9,56% 1 9,11% 4 Taquanta Core Cash 13,01% 3 9,77% 10 8,06% 5 7,12% 1 7,06% 1 6,74% 1 6,36% 8 7,65% 1 8,98% 4 9,69% 1 STeFI 11,70% 9,13% 6,93% 5,73% 5,54% 5,19% 5,91% 6,47% 7,39% 7,54% Top Quartile 12,95% 10,08% 8,11% 7,00% 6,71% 6,42% 6,53% 7,47% 8,98% 9,11% Mean 12,73% 9,91% 7,89% 6,71% 6,58% 6,17% 6,43% 7,21% 8,71% 8,97% Median 12,85% 9,99% 7,93% 6,77% 6,57% 6,25% 6,39% 7,14% 8,66% 8,96% Bottom Quartile 12,65% 9,81% 7,68% 6,50% 6,44% 5,88% 6,32% 7,04% 8,48% 8,83% STeFI 3 Month 11,71% 8,64% 6,58% 5,48% 5,34% 5,03% 5,65% 6,08% 7,05% 7,15% STeFI Call 11,34% 8,36% 6,26% 5,29% 5,11% 4,79% 5,42% 5,79% 6,84% 6,88% 18
19 3 YEAR ANNUALISED VOLATILITY & RETURN 19
20 5 YEAR ANNUALISED VOLATILITY & RETURN 20
21 SA BOND FUNDS We always count 21
22 3 YEAR PERFORMANCE 22
23 5 YEAR PERFORMANCE 23
24 ABSOLUTE PERFORMANCE Portfolio 3 Months YTD ABAX Bond Fund 2,84% 6 11,91% 3 11,91% 3 14,67% 2 9,00% 4 ABSA AM Bond 2,36% 17 12,41% 2 12,41% 2 14,50% 4 9,03% 3 7,55% 7 9,59% 16 9,04% 21 Aluwani Active Bond 2,30% 19 11,09% 14 11,09% 14 13,66% 13 7,62% 17 6,84% 18 9,60% 14 9,61% 8 Argon SA Bond Fund 2,57% 9 11,73% 7 11,73% 7 14,03% 9 8,24% 8 7,66% 4 9,62% 12 9,21% 20 Cadiz Houseview Bond Fund 1,11% 24 8,95% 24 8,95% 24 12,16% 24 7,04% 24 6,57% 23 9,30% 21 9,23% 19 Coronation Active Bond 3,03% 2 11,55% 9 11,55% 9 14,07% 7 8,08% 11 7,53% 8 10,09% 5 9,78% 6 Coronation Strategic Bond 3,07% 1 11,07% 15 11,07% 15 13,57% 16 8,00% 12 7,65% 6 10,24% 4 10,09% 4 Futuregrowth Active Bond 2,38% 15 10,62% 23 10,62% 23 13,09% 22 7,28% 23 6,92% 16 9,63% 11 9,46% 14 Futuregrowth Core Bond 2,48% 13 11,07% 16 11,07% 16 13,46% 18 7,49% 19 6,95% 14 9,64% 10 9,38% 16 Futuregrowth Infrastructure & Development 2,89% 3 11,76% 6 11,76% 6 14,17% 6 8,97% 5 8,64% 1 11,55% 1 11,16% 1 Futuregrowth Yield Enhanced Bond 2,84% 5 11,88% 4 11,88% 4 14,40% 5 9,09% 2 8,63% 2 11,47% 2 11,08% 2 Investec Corporate Bond 2,49% 12 12,53% 1 12,53% 1 14,81% 1 9,57% 1 7,76% 3 10,69% 3 10,55% 3 Investec Flexible Bond 2,67% 7 11,43% 10 11,43% 10 13,59% 15 8,18% 10 7,21% 9 9,59% 15 9,50% 13 Investec Triple Alpha 2,35% 18 11,40% 11 11,40% 11 13,67% 12 8,19% 9 7,02% 12 9,67% 9 9,53% 12 JM Busha Bond Plus 2,22% 22 10,69% 21 10,69% 21 13,18% 21 7,80% 14 6,81% 21 9,05% 22 8,77% 22 MMI - SA Bond 2,24% 21 10,78% 20 10,78% 20 13,36% 19 7,43% 21 6,74% 22 9,52% 18 9,54% 11 Pan-African Active Bond 2,16% 23 10,90% 18 10,90% 18 13,33% 20 7,45% 20 6,83% 20 9,54% 17 9,42% 15 Prescient Bond Quant Composite 2,54% 10 11,15% 13 11,15% 13 13,61% 14 7,75% 15 6,96% 13 9,34% 20 9,24% 18 Prescient Bond Quantplus Composite 2,87% 4 11,81% 5 11,81% 5 14,07% 8 8,57% 6 7,66% 5 9,45% 19 9,63% 7 Prowess Corporate Bond Fund 2,37% 16 10,93% 17 10,93% 17 12,21% 23 7,59% 18 6,83% 19 9,03% 23 Prudential Yield Enhanced Bonds 2,42% 14 10,64% 22 10,64% 22 13,54% 17 7,74% 16 6,94% 15 9,88% 8 9,59% 10 SIM Institutional Total Return Bond Fund 2,30% 20 10,84% 19 10,84% 19 13,75% 11 7,39% 22 6,86% 17 9,61% 13 9,30% 17 Stanlib Core Bond 2,62% 8 11,64% 8 11,64% 8 14,54% 3 8,27% 7 7,17% 10 9,98% 6 9,60% 9 Vunani Domestic Active Bond 2,53% 11 11,17% 12 11,17% 12 14,01% 10 7,94% 13 7,16% 11 9,90% 7 9,88% 5 ALBI 2,22% 10,22% 10,22% 12,80% 6,92% 6,27% 8,82% 8,58% Top Quartile 2,71% 11,74% 11,74% 14,10% 8,34% 7,60% 9,94% 9,74% Mean 2,48% 11,25% 11,25% 13,73% 8,07% 7,26% 9,83% 9,66% Median 2,49% 11,16% 11,16% 13,66% 7,97% 7,02% 9,62% 9,53% Bottom Quartile 2,34% 10,89% 10,89% 13,44% 7,56% 6,85% 9,53% 9,32% BEASSA Inflation Linked 1,52% 2,93% 2,93% 4,59% 4,28% 4,90% 8,37% 8,81% STeFI 1,80% 7,54% 7,54% 7,47% 7,13% 6,50% 6,33% 7,14% 24
25 ABSOLUTE CALENDAR YEAR PERFORMANCE Portfolio ABAX Bond Fund -1,51% 6 17,49% 2 11,91% 3 ABSA AM Bond 14,91% 21-0,61% 21 14,45% 21 9,13% 18 15,76% 20 0,71% 23 10,26% 11-1,14% 5 16,63% 8 12,41% 2 Aluwani Active Bond 18,60% 2 1,33% 7 16,41% 9 9,63% 12 17,21% 10 1,38% 20 10,18% 12-3,52% 22 16,28% 13 11,09% 14 Argon SA Bond Fund 16,98% 20-1,04% 23 13,81% 22 6,83% 23 18,54% 3 2,68% 6 11,08% 5-2,46% 12 16,37% 12 11,73% 7 Cadiz Houseview Bond Fund 17,79% 12 0,72% 13 16,07% 16 8,99% 22 17,15% 13 1,93% 13 9,97% 14-2,52% 13 15,47% 23 8,95% 24 Coronation Active Bond 17,78% 13 0,00% 17 16,12% 15 9,85% 6 17,66% 6 2,30% 10 11,33% 4-2,98% 14 16,65% 7 11,55% 9 Coronation Strategic Bond 18,54% 5 1,14% 9 16,34% 11 9,70% 9 18,25% 4 2,75% 5 11,68% 3-2,33% 11 16,12% 15 11,07% 15 Futuregrowth Active Bond 18,49% 6-0,13% 18 16,14% 14 9,69% 10 17,21% 9 2,42% 9 10,50% 7-3,46% 20 15,61% 22 10,62% 23 Futuregrowth Core Bond 17,64% 15-0,27% 20 16,40% 10 9,34% 15 17,30% 8 2,11% 11 10,33% 8-3,53% 23 15,91% 18 11,07% 16 Futuregrowth Infrastructure & Development 18,31% 7 1,57% 6 18,91% 1 11,38% 2 19,64% 1 3,67% 1 12,80% 2-0,71% 2 16,63% 9 11,76% 6 Futuregrowth Yield Enhanced Bond 18,69% 1 1,06% 10 18,44% 3 11,29% 3 19,58% 2 3,29% 2 12,81% 1-0,82% 3 16,98% 4 11,88% 4 Investec Corporate Bond 17,80% 11 2,63% 2 18,70% 2 11,56% 1 17,16% 12 3,21% 3 7,02% 23-0,20% 1 17,13% 3 12,53% 1 Investec Flexible Bond 18,58% 3 0,40% 15 16,03% 17 9,09% 20 16,05% 18 1,95% 12 9,75% 16-1,87% 8 15,79% 20 11,43% 10 Investec Triple Alpha 18,05% 8 0,60% 14 16,48% 8 9,82% 7 16,49% 17 1,90% 14 8,82% 22-2,00% 9 15,99% 17 11,40% 11 JM Busha Bond Plus 13,71% 22 1,89% 5 13,65% 23 9,15% 17 15,97% 19 1,28% 22 9,60% 20-2,22% 10 15,73% 21 10,69% 21 MMI - SA Bond 18,55% 4 1,33% 8 16,33% 12 9,59% 13 17,17% 11 1,34% 21 10,28% 9-3,51% 21 16,00% 16 10,78% 20 Pan-African Active Bond 17,87% 9 0,77% 12 16,81% 6 9,10% 19 16,85% 15 1,70% 16 10,27% 10-3,41% 19 15,82% 19 10,90% 18 Prescient Bond Quant Composite 17,34% 18 0,96% 11 15,39% 18 9,48% 14 15,56% 21 1,59% 19 10,13% 13-3,08% 16 16,13% 14 11,15% 13 Prescient Bond Quantplus Composite 17,59% 17 3,58% 1 14,88% 20 9,17% 16 13,53% 23 3,01% 4 9,68% 17-1,63% 7 16,37% 11 11,81% 5 Prowess Corporate Bond Fund 2,28% 4 15,34% 19 9,02% 21 14,15% 22 2,49% 7 9,03% 21-1,09% 4 13,50% 24 10,93% 17 Prudential Yield Enhanced Bonds 17,60% 16 0,03% 16 17,30% 4 10,56% 5 17,15% 14 1,77% 15 9,87% 15-2,99% 15 16,52% 10 10,64% 22 SIM Institutional Total Return Bond Fund 17,72% 14-0,78% 22 16,82% 5 9,67% 11 16,69% 16 1,70% 17 10,66% 6-4,28% 24 16,73% 6 10,84% 19 Stanlib Core Bond 17,02% 19-0,19% 19 16,27% 13 10,61% 4 17,77% 5 1,62% 18 9,61% 19-3,26% 18 17,51% 1 11,64% 8 Vunani Domestic Active Bond 17,82% 10 2,33% 3 16,72% 7 9,73% 8 17,59% 7 2,44% 8 9,68% 18-3,26% 17 16,93% 5 11,17% 12 ALBI 16,97% -0,99% 14,96% 8,82% 15,99% 0,64% 10,15% -3,93% 15,45% 10,22% Top Quartile 18,45% 1,45% 16,76% 9,83% 17,63% 2,59% 10,58% -1,60% 16,67% 11,74% Mean 17,61% 0,85% 16,25% 9,67% 16,98% 2,14% 10,23% -2,41% 16,26% 11,25% Median 17,79% 0,77% 16,33% 9,63% 17,16% 1,95% 10,18% -2,49% 16,32% 11,16% Bottom Quartile 17,59% -0,07% 15,71% 9,14% 16,27% 1,66% 9,68% -3,30% 15,89% 10,89% BEASSA Inflation Linked 13,62% 7,66% 10,97% 13,05% 19,37% 0,79% 11,15% 3,68% 6,27% 2,93% STeFI 11,70% 9,13% 6,93% 5,73% 5,54% 5,19% 5,91% 6,47% 7,39% 7,54% 25
26 3 YEAR ANNUALISED VOLATILITY & RETURN 26
27 5 YEAR ANNUALISED VOLATILITY & RETURN 27
28 SA LISTED PROPERTY FUNDS We always count 28
29 3 YEAR PERFORMANCE 29
30 5 YEAR PERFORMANCE 30
31 ABSOLUTE PERFORMANCE Portfolio 3 Months YTD ABSA AM Property Equity Fund 8,03% 9 29,20% 1 29,20% 1 20,14% 1 23,46% 1 24,40% 1 Catalyst SA Property Composite Portfolios 8,88% 1 18,58% 6 18,58% 6 14,65% 5 15,10% 3 16,74% 4 19,12% 2 16,23% 2 Coronation Property Equity 7,60% 11 15,71% 13 15,71% 13 12,61% 13 11,77% 15 14,92% 10 18,70% 3 16,11% 3 Bridge Fund Managers Listed Property -3,43% 16-0,56% 16-0,56% 16 7,60% 16 7,78% 16 11,86% 16 Investec Property Equity Fund 8,10% 8 18,44% 7 18,44% 7 12,49% 14 13,00% 7 15,28% 6 18,69% 4 15,87% 5 Meago Composite 8,70% 3 20,26% 3 20,26% 3 15,63% 2 14,02% 5 15,36% 5 18,26% 8 Metope Listed Property 8,79% 2 20,62% 2 20,62% 2 15,17% 3 15,28% 2 17,26% 3 20,24% 1 17,16% 1 MMI - SA Property 8,60% 4 19,87% 5 19,87% 5 13,94% 7 13,22% 6 14,59% 12 17,65% 9 14,47% 9 Old Mutual SA Listed Property Index Fund 8,30% 6 17,27% 9 17,27% 9 13,71% 9 12,25% 12 14,28% 14 Old Mutual SA Quoted Property Fund 6,09% 15 15,09% 15 15,09% 15 9,95% 15 12,48% 10 14,96% 8 18,29% 7 15,40% 7 Prescient Property Equity Composite 8,31% 5 17,37% 8 17,37% 8 13,38% 11 12,74% 8 14,99% 7 16,15% 11 14,51% 8 Prudential Enhanced SA Property Fund 6,22% 14 15,29% 14 15,29% 14 13,21% 12 12,41% 11 14,76% 11 18,33% 6 15,79% 6 Satrix Property Index Fund 8,25% 7 17,01% 10 17,01% 10 13,47% 10 11,96% 13 13,87% 15 Sesfikile SA Listed Property 7,81% 10 19,99% 4 19,99% 4 15,08% 4 15,03% 4 17,33% 2 SIM Property Fund 7,50% 13 16,01% 11 16,01% 11 13,93% 8 11,87% 14 14,42% 13 16,74% 10 13,79% 10 STANLIB Institutional Property 7,59% 12 15,93% 12 15,93% 12 14,19% 6 12,67% 9 14,92% 9 18,45% 5 16,04% 4 SAPY 8,32% 17,15% 17,15% 13,62% 11,71% 13,86% 17,65% 14,87% Top Quartile 8,38% 19,90% 19,90% 14,76% 14,27% 15,71% 18,69% 16,09% Mean 7,21% 17,26% 17,26% 13,70% 13,44% 15,62% 18,24% 15,54% Median 8,06% 17,32% 17,32% 13,82% 12,71% 14,94% 18,33% 15,83% Bottom Quartile 7,57% 15,88% 15,88% 13,06% 12,18% 14,55% 17,96% 14,73% JSE SWIX 9,63% 21,21% 21,21% 12,35% 9,36% 12,75% 14,55% 11,67% ALBI 2,22% 10,22% 10,22% 12,80% 6,92% 6,27% 8,82% 8,58% 31
32 ABSOLUTE CALENDAR YEAR PERFORMANCE Portfolio ABSA AM Property Equity Fund 35,57% 8 11,27% 3 42,30% 1 30,40% 1 11,72% 4 29,20% 1 Catalyst SA Property Composite Portfolios -4,26% 7 15,95% 3 27,84% 7 7,92% 11 35,53% 9 9,88% 7 29,39% 3 16,00% 3 10,84% 7 18,58% 6 Coronation Property Equity -2,90% 5 16,34% 2 28,46% 6 10,24% 3 38,84% 1 12,87% 2 27,17% 12 10,11% 11 9,60% 12 15,71% 13 Bridge Fund Managers Listed Property 12,34% 1 36,84% 6 11,24% 4 25,72% 16 8,15% 15 16,43% 1-0,56% 16 Investec Property Equity Fund -0,87% 2 11,72% 11 28,99% 5 8,23% 9 38,54% 2 9,86% 8 28,43% 6 14,04% 6 6,83% 15 18,44% 7 Meago Composite 14,05% 9 27,77% 8 8,68% 7 34,86% 11 8,23% 14 27,36% 10 10,88% 9 11,18% 5 20,26% 3 Metope Listed Property -2,91% 6 14,84% 8 31,41% 1 8,46% 8 38,29% 3 11,24% 5 30,07% 2 15,52% 4 9,96% 11 20,62% 2 MMI - SA Property -9,06% 10 15,68% 4 22,80% 10 10,25% 2 37,22% 4 8,02% 15 26,03% 15 11,78% 7 8,30% 14 19,87% 5 Old Mutual SA Listed Property Index Fund 8,58% 13 26,93% 13 9,39% 13 10,26% 9 17,27% 9 Old Mutual SA Quoted Property Fund -5,22% 8 15,33% 5 29,37% 4 8,99% 6 35,38% 10 9,69% 10 28,65% 5 17,70% 2 5,04% 16 15,09% 15 Prescient Property Equity Composite 3,32% 1 13,21% 10 16,63% 11 8,06% 10 30,78% 14 9,63% 11 27,97% 8 11,47% 8 9,53% 13 17,37% 8 Prudential Enhanced SA Property Fund -2,20% 3 15,25% 7 30,57% 2 9,72% 5 34,81% 12 10,04% 6 27,34% 11 10,82% 10 11,17% 6 15,29% 14 Satrix Property Index Fund 8,01% 16 26,34% 14 8,98% 14 10,04% 10 17,01% 10 Sesfikile SA Listed Property 36,85% 5 13,09% 1 29,17% 4 14,91% 5 10,38% 8 19,99% 4 SIM Property Fund -8,48% 9 15,31% 6 24,32% 9 6,97% 12 32,21% 13 9,83% 9 27,53% 9 7,87% 16 11,88% 3 16,01% 11 STANLIB Institutional Property -2,70% 4 17,38% 1 29,40% 3 9,76% 4 36,16% 7 9,47% 12 27,99% 7 9,71% 12 12,46% 2 15,93% 12 SAPY -4,47% 14,07% 29,62% 8,93% 35,88% 8,39% 26,64% 7,99% 10,20% 17,15% Top Quartile -2,32% 15,81% 29,38% 9,88% 37,13% 11,24% 28,78% 15,06% 11,31% 19,90% Mean -3,53% 15,00% 27,05% 9,14% 35,85% 10,06% 28,65% 12,98% 10,35% 17,26% Median -2,91% 15,31% 28,46% 8,84% 35,86% 9,85% 27,75% 11,17% 10,32% 17,32% Bottom Quartile -4,98% 14,44% 26,04% 8,19% 34,99% 9,24% 27,11% 9,63% 9,58% 15,88% JSE SWIX -21,67% 29,91% 20,86% 4,26% 29,09% 20,71% 15,42% 3,62% 4,13% 21,21% ALBI 16,97% -0,99% 14,96% 8,82% 15,99% 0,64% 10,15% -3,93% 15,45% 10,22% 32
33 3 YEAR ANNUALISED VOLATILITY & RETURN 33
34 5 YEAR ANNUALISED VOLATILITY & RETURN 34
35 SA CONSTRAINED EQUITY FUNDS We always count 35
36 3 YEAR PERFORMANCE 36
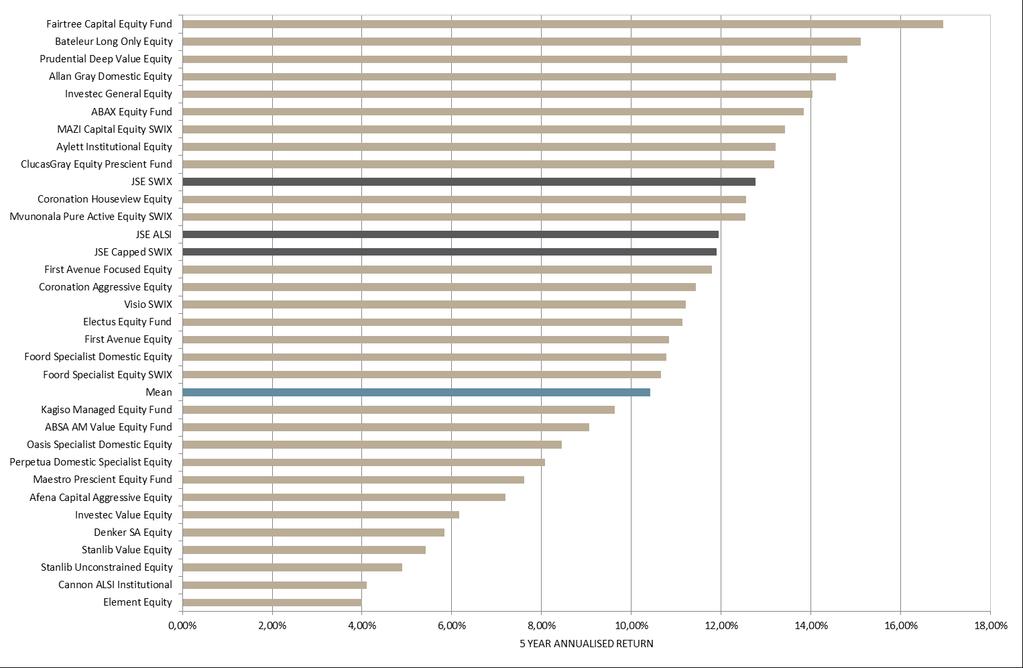
37 5 YEAR PERFORMANCE 37
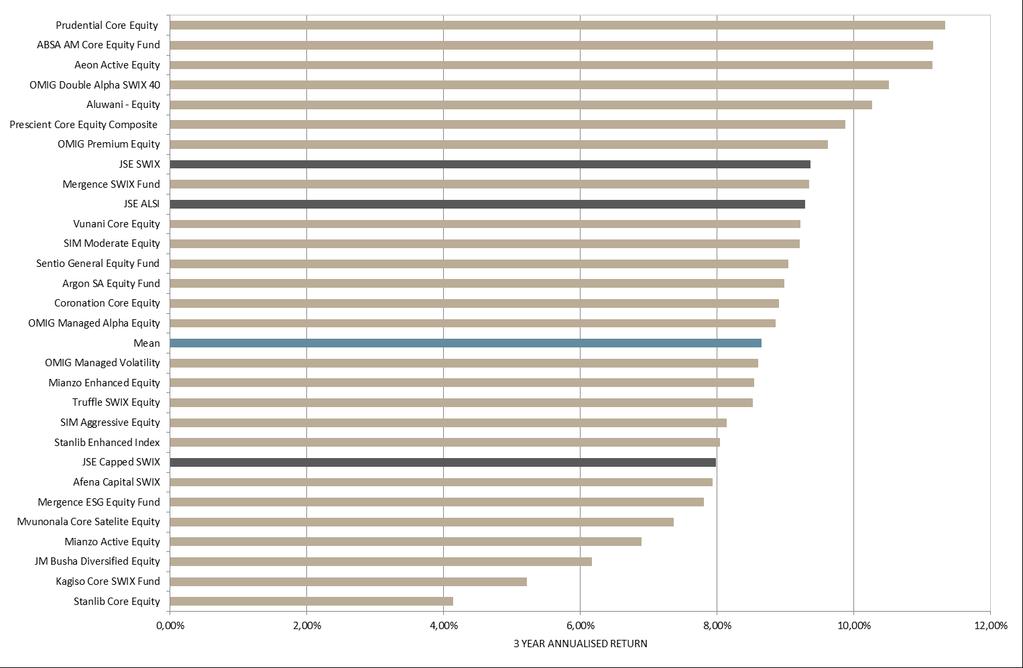
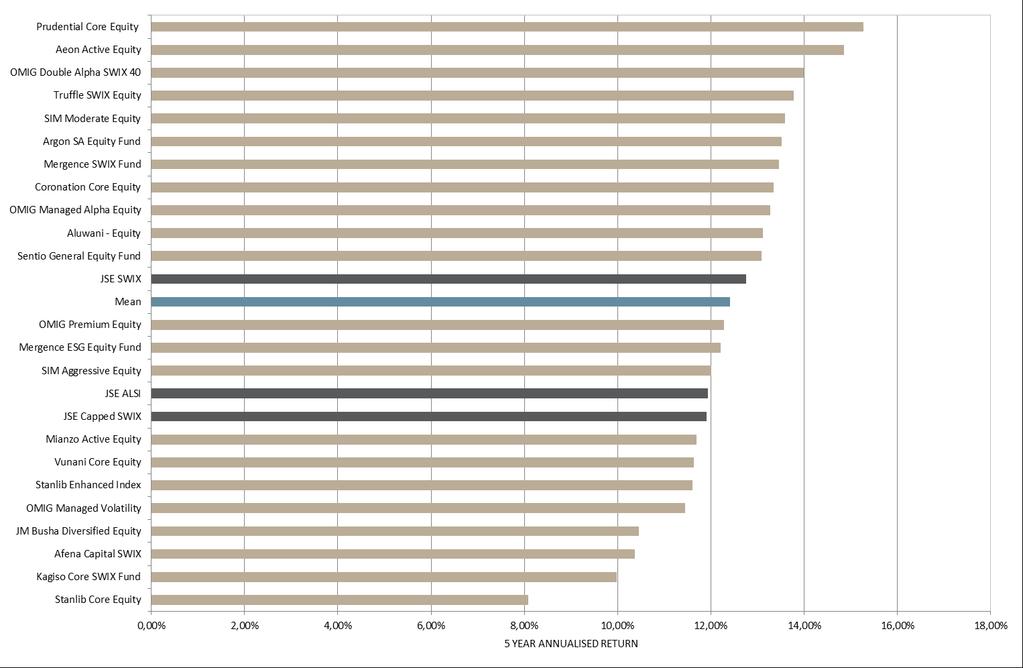
38 ABSOLUTE PERFORMANCE Portfolio 3 Months YTD 1 Aeon Active Equity 10,08% 5 25,79% 1 25,79% 1 13,20% 5 11,14% 3 14,85% 2 15,48% 4 ABSA AM Core Equity Fund 5,96% 23 22,18% 6 22,18% 6 11,71% 13 11,15% 2 Afena Capital SWIX 8,31% 15 17,79% 14 17,79% 14 12,99% 6 7,93% 20 10,36% 20 11,28% 16 9,67% 10 Aluwani - Equity 10,91% 2 24,35% 3 24,35% 3 10,57% 16 10,26% 5 13,11% 10 14,68% 9 12,16% 4 Argon SA Equity Fund 5,89% 24 17,45% 15 17,45% 15 8,57% 24 8,98% 12 13,51% 6 13,95% 11 11,02% 7 Benguela SA Equity 9,97% 8 19,70% 11 19,70% 11 12,73% 9 Coronation Core Equity 8,90% 14 21,94% 7 21,94% 7 13,45% 4 8,90% 13 13,34% 8 15,47% 5 13,82% 1 JM Busha Diversified Equity 9,87% 10 18,39% 13 18,39% 13 12,57% 10 6,16% 24 10,45% 19 Kagiso Core SWIX Fund 5,69% 25 15,28% 24 15,28% 24 10,57% 17 5,21% 25 9,97% 21 12,35% 15 10,50% 9 Mergence ESG Equity Fund 7,40% 18 15,57% 23 15,57% 23 9,11% 22 7,80% 21 12,20% 13 Mergence SWIX Fund 7,06% 20 16,36% 18 16,36% 18 10,36% 18 9,34% 8 13,45% 7 14,23% 10 11,88% 5 Mianzo Active Equity 8,94% 13 16,26% 19 16,26% 19 12,80% 7 6,89% 23 11,68% 15 Mianzo Enhanced Equity 10,00% 7 20,45% 10 20,45% 10 14,00% 2 8,54% 16 Mvunonala Core Satelite Equity 10,12% 4 22,44% 5 22,44% 5 8,09% 25 7,36% 22 OMIG Double Alpha SWIX 40 10,07% 6 25,47% 2 25,47% 2 12,50% 11 10,51% 4 13,99% 3 15,78% 2 OMIG Managed Alpha Equity 6,89% 22 16,16% 20 16,16% 20 8,89% 23 8,85% 14 13,26% 9 15,48% 3 12,23% 3 OMIG Managed Volatility 8,98% 11 17,18% 17 17,18% 17 9,17% 21 8,59% 15 11,45% 18 15,27% 7 OMIG Premium Equity 6,90% 21 17,43% 16 17,43% 16 11,41% 14 9,62% 7 12,27% 12 15,36% 6 Prescient Core Equity Composite 9,89% 9 21,61% 9 21,61% 9 12,80% 8 9,87% 6 Prudential Core Equity 10,90% 3 23,19% 4 23,19% 4 14,20% 1 11,34% 1 15,26% 1 16,52% 1 13,78% 2 Sentio General Equity Fund 12,06% 1 16,04% 21 16,04% 21 10,22% 19 9,04% 11 13,09% 11 SIM Aggressive Equity 1,90% 27 13,95% 25 13,95% 25 13,57% 3 8,13% 18 12,00% 14 13,16% 13 10,98% 8 SIM Moderate Equity 7,25% 19 19,58% 12 19,58% 12 12,21% 12 9,20% 10 13,59% 5 15,07% 8 Stanlib Core Equity 7,73% 16 13,41% 27 13,41% 27 6,45% 26 4,13% 26 8,08% 22 12,76% 14 8,98% 11 Stanlib Enhanced Index 8,95% 12 21,66% 8 21,66% 8 10,67% 15 8,04% 19 11,60% 17 13,89% 12 11,17% 6 Truffle SWIX Equity 2,18% 26 13,79% 26 13,79% 26 5,39% 27 8,52% 17 13,77% 4 Vunani Core Equity 7,62% 17 16,00% 22 16,00% 22 10,03% 20 9,22% 9 11,63% 16 JSE SWIX 9,63% 21,21% 21,21% 12,35% 9,36% 12,75% 14,55% 11,67% Top Quartile 9,98% 21,80% 21,80% 12,80% 9,55% 13,49% 15,47% 12,20% Mean 8,16% 18,87% 18,87% 11,05% 8,64% 12,40% 14,42% 11,47% Median 8,90% 17,79% 17,79% 11,41% 8,88% 12,68% 14,87% 11,17% Bottom Quartile 6,98% 16,10% 16,10% 9,60% 7,96% 11,61% 13,71% 10,74% JSE ALSI 7,44% 20,95% 20,95% 11,42% 9,28% 11,93% 13,31% 10,67% JSE Capped SWIX 8,44% 16,49% 16,49% 10,68% 7,98% 11,90%
39 ABSOLUTE CALENDAR YEAR PERFORMANCE Portfolio Aeon Active Equity 27,82% 10 20,64% 9 3,18% 17 27,14% 16 28,22% 2 13,50% 16 7,13% 9 1,87% 19 25,79% 1 ABSA AM Core Equity Fund 10,04% 2 2,14% 17 22,18% 6 Afena Capital SWIX -18,83% 3 31,91% 5 17,48% 15 2,73% 18 19,05% 21 20,25% 18 8,26% 24-1,52% 21 8,39% 3 17,79% 14 Aluwani - Equity -19,81% 5 31,29% 6 19,32% 12 5,91% 7 27,88% 14 21,58% 16 13,59% 15 9,65% 4-1,68% 25 24,35% 3 Argon SA Equity Fund -21,45% 9 27,39% 13 18,64% 14 0,89% 19 26,00% 18 25,26% 10 16,22% 4 9,81% 3 0,36% 23 17,45% 15 Benguela SA Equity 6,17% 6 19,70% 11 Coronation Core Equity -13,36% 1 33,31% 3 24,74% 2 5,58% 8 28,28% 12 29,00% 1 12,25% 17 0,34% 19 5,55% 10 21,94% 7 JM Busha Diversified Equity 34,58% 2 22,58% 14 12,06% 18-5,58% 26 7,03% 5 18,39% 13 Kagiso Core SWIX Fund -19,90% 6 33,50% 2 20,97% 7 4,30% 12 25,08% 19 25,94% 7 9,65% 22-4,73% 25 6,05% 7 15,28% 24 Mergence ESG Equity Fund 4,53% 11 31,02% 9 21,55% 17 16,79% 2 5,22% 15 3,02% 16 15,57% 23 Mergence SWIX Fund -18,89% 4 30,73% 7 14,44% 16 6,22% 5 26,87% 17 25,45% 9 14,61% 12 7,31% 8 4,68% 13 16,36% 18 Mianzo Active Equity 3,69% 13 28,19% 13 27,52% 4 11,56% 19-4,02% 24 9,45% 2 16,26% 19 Mianzo Enhanced Equity 14,38% 14-1,61% 22 7,91% 4 20,45% 10 Mvunonala Core Satelite Equity 16,64% 3 5,91% 13-4,57% 27 22,44% 5 OMIG Double Alpha SWIX 40 20,54% 10 6,02% 6 31,27% 6 23,80% 12 15,19% 9 6,64% 11 0,87% 21 25,47% 2 OMIG Managed Alpha Equity -21,40% 8 27,54% 11 22,72% 4 3,58% 14 33,53% 3 24,91% 11 15,69% 6 8,78% 5 2,07% 18 16,16% 20 OMIG Managed Volatility 24,82% 1 10,76% 2 31,13% 7 16,24% 22 15,49% 7 7,45% 7 1,71% 20 17,18% 17 OMIG Premium Equity 18,98% 13 12,21% 1 31,73% 5 17,97% 21 14,79% 11 6,12% 12 5,70% 9 17,43% 16 Prescient Core Equity Composite 4,25% 16 4,63% 14 21,61% 9 Prudential Core Equity -16,06% 2 27,49% 12 20,42% 11 6,67% 3 30,01% 11 28,06% 3 15,11% 10 5,82% 14 5,86% 8 23,19% 4 Sentio General Equity Fund 4,55% 10 31,05% 8 23,02% 13 15,97% 5 6,70% 10 4,70% 12 16,04% 21 SIM Aggressive Equity -21,03% 7 33,53% 1 22,85% 3 3,48% 15 20,04% 20 25,61% 8 10,95% 20-1,97% 23 13,19% 1 13,95% 25 SIM Moderate Equity 33,07% 4 21,88% 6 4,62% 9 27,46% 15 26,84% 5 14,49% 13 3,42% 17 5,30% 11 19,58% 12 Stanlib Core Equity -29,62% 11 28,54% 9 22,68% 5 6,45% 4 35,68% 1 18,64% 20 10,09% 21-0,37% 20-0,07% 24 13,41% 27 Stanlib Enhanced Index -21,55% 10 29,81% 8 20,95% 8 3,34% 16 30,85% 10 18,89% 19 15,48% 8 2,96% 18 0,67% 22 21,66% 8 Truffle SWIX Equity 26,57% 6 17,84% 1 15,05% 1-2,39% 26 13,79% 26 Vunani Core Equity 31,80% 4 21,88% 15 9,19% 23 7,60% 6 4,38% 15 16,00% 22 JSE SWIX -21,67% 29,91% 20,86% 4,26% 29,09% 20,71% 15,42% 3,62% 4,13% 21,21% Top Quartile -18,86% 33,07% 22,69% 6,12% 31,27% 26,41% 15,54% 7,41% 5,95% 21,80% Mean -20,17% 30,46% 20,75% 5,20% 28,98% 23,63% 13,74% 4,25% 3,81% 18,87% Median -19,90% 30,73% 20,80% 4,55% 30,01% 24,35% 14,55% 5,87% 4,63% 17,79% Bottom Quartile -21,43% 27,82% 19,23% 3,53% 27,14% 21,56% 11,93% -0,19% 1,29% 16,10% JSE ALSI -23,23% 32,13% 18,98% 2,57% 26,68% 21,43% 10,88% 5,13% 2,63% 20,95% JSE Capped SWIX 29,09% 20,71% 15,42% 2,78% 5,16% 16,49% 39
40 3 YEAR ANNUALISED VOLATILITY & RETURN 40
41 5 YEAR ANNUALISED VOLATILITY & RETURN 41
42 SA UNCONSTRAINED EQUITY FUNDS We always count 42
43 3 YEAR PERFORMANCE 43
44 5 YEAR PERFORMANCE 44
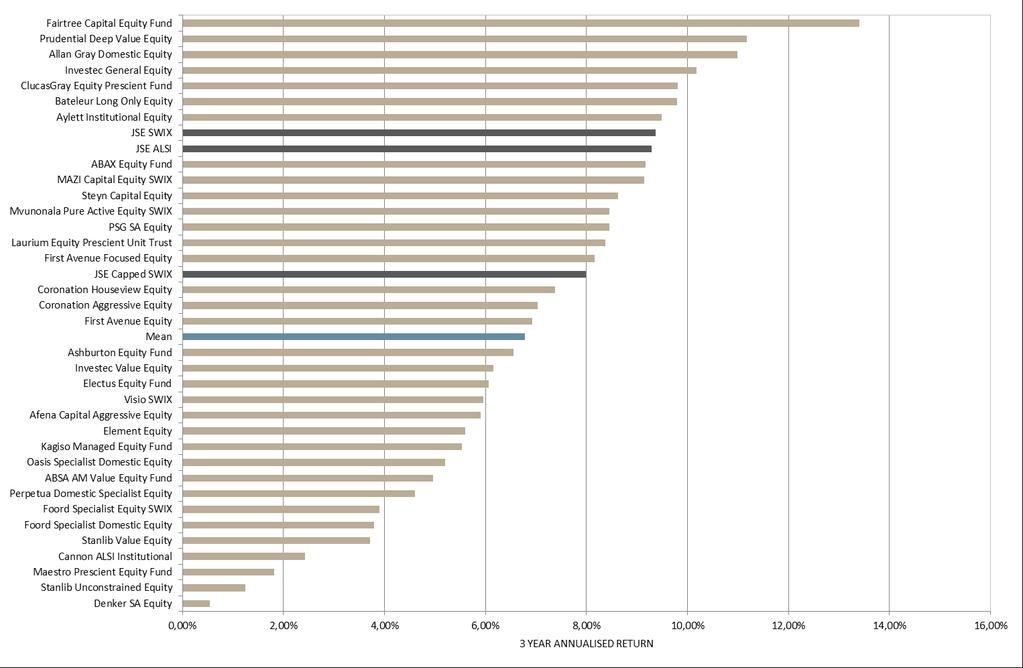
45 ABSOLUTE PERFORMANCE Portfolio 3 Months YTD ABAX Equity Fund 6,75% 17 18,32% 7 18,32% 7 8,24% 19 9,16% 8 13,83% 6 15,63% 4 12,43% 11 ABSA AM Value Equity Fund 7,21% 15 14,09% 16 14,09% 16 9,32% 17 4,95% 26 9,06% 20 12,29% 13 12,78% 8 Afena Capital Aggressive Equity 8,02% 10 11,42% 23 11,42% 23 17,90% 4 5,89% 22 7,19% 24 Allan Gray Domestic Equity 9,36% 4 14,44% 14 14,44% 14 13,97% 10 10,98% 3 14,56% 4 15,15% 5 13,09% 5 Ashburton Equity Fund 2,65% 28 12,99% 19 12,99% 19 7,95% 21 6,55% 18 Aylett Institutional Equity 9,24% 5 13,40% 17 13,40% 17 15,83% 7 9,49% 7 13,21% 8 14,18% 11 13,62% 3 Bateleur Long Only Equity 5,54% 19 14,18% 15 14,18% 15 8,00% 20 9,78% 6 15,10% 2 Cannon ALSI Institutional 4,61% 23-0,56% 32-0,56% 32 9,77% 15 2,42% 31 4,10% 29 6,14% 22 4,82% 21 ClucasGray Equity Prescient Fund 10,79% 1 18,40% 6 18,40% 6 14,19% 9 9,80% 5 13,17% 9 Coronation Aggressive Equity 3,71% 25 15,96% 10 15,96% 10 15,97% 5 7,03% 16 11,43% 13 14,26% 10 12,93% 7 Coronation Houseview Equity 5,65% 18 15,74% 11 15,74% 11 11,19% 14 7,37% 15 12,55% 10 14,72% 7 12,97% 6 Denker SA Equity 3,03% 27-1,69% 33-1,69% 33 7,29% 25 0,54% 34 5,84% 26 9,15% 17 8,18% 16 Electus Equity Fund 3,15% 26 11,23% 24 11,23% 24 9,43% 16 6,05% 20 11,13% 15 12,31% 12 9,39% 15 Element Equity 4,81% 22 15,50% 12 15,50% 12 18,50% 3 5,60% 23 4,00% 30 6,16% 21 6,00% 19 Fairtree Capital Equity Fund 9,96% 3 21,47% 3 21,47% 3 15,97% 6 13,40% 1 16,94% 1 First Avenue Equity 7,57% 12 14,65% 13 14,65% 13 5,63% 29 6,92% 17 10,84% 16 First Avenue Focused Equity 7,35% 13 16,94% 8 16,94% 8 5,87% 27 8,15% 14 11,79% 12 Foord Specialist Domestic Equity -0,33% 32 5,39% 29 5,39% 29 4,24% 32 3,79% 29 10,77% 17 14,74% 6 12,72% 9 JSE SWIX 9,63% 21,21% 21,21% 12,35% 9,36% 12,75% 14,55% 11,67% Top Quartile 8,16% 16,14% 16,14% 14,14% 9,01% 13,20% 14,74% 12,97% Mean 5,58% 12,20% 12,20% 10,45% 6,77% 10,41% 12,36% 10,61% Median 6,20% 13,31% 13,31% 8,80% 6,74% 10,98% 13,25% 12,43% Bottom Quartile 3,29% 8,96% 8,96% 7,27% 5,01% 7,72% 9,21% 8,18% JSE ALSI 7,44% 20,95% 20,95% 11,42% 9,28% 11,93% 13,31% 10,67% JSE Capped SWIX 8,44% 16,49% 16,49% 10,68% 7,98% 11,90% 45
46 ABSOLUTE PERFORMANCE (continued) Portfolio 3 Months YTD Foord Specialist Equity SWIX -0,23% 31 5,51% 28 5,51% 28 4,39% 31 3,90% 28 10,65% 18 14,59% 8 12,63% 10 Investec General Equity 5,53% 20 13,21% 18 13,21% 18 7,71% 22 10,17% 4 14,02% 5 14,45% 9 10,80% 12 Investec Value Equity 1,12% 30-4,04% 34-4,04% 34 21,37% 1 6,14% 19 6,16% 25 7,34% 20 7,30% 17 Kagiso Managed Equity Fund 5,51% 21 16,20% 9 16,20% 9 13,47% 12 5,53% 24 9,63% 19 11,79% 15 10,23% 13 Laurium Equity Prescient Unit Trust 8,20% 9 19,44% 4 19,44% 4 7,27% 26 8,36% 13 Maestro Prescient Equity Fund -2,49% 34 1,97% 31 1,97% 31 0,66% 34 1,81% 32 7,61% 23 9,39% 16 MAZI Capital Equity SWIX 7,76% 11 18,55% 5 18,55% 5 7,49% 23 9,14% 9 13,42% 7 17,83% 1 15,11% 1 Mvunonala Pure Active Equity SWIX 9,12% 6 23,84% 1 23,84% 1 8,28% 18 8,44% 11 12,54% 11 Oasis Specialist Domestic Equity 7,14% 16 11,80% 21 11,80% 21 13,40% 13 5,19% 25 8,44% 21 11,86% 14 9,56% 14 Perpetua Domestic Specialist Equity 8,29% 8 8,60% 26 8,60% 26 14,79% 8 4,60% 27 8,06% 22 Prudential Deep Value Equity 10,77% 2 23,06% 2 23,06% 2 13,72% 11 11,17% 2 14,81% 3 15,67% 3 13,21% 4 PSG SA Equity 8,41% 7 10,02% 25 10,02% 25 20,68% 2 8,44% 12 Stanlib Unconstrained Equity 7,31% 14 12,20% 20 12,20% 20 7,36% 24 1,25% 33 4,89% 28 8,85% 19 4,88% 20 Stanlib Value Equity -1,08% 33 4,14% 30 4,14% 30 4,18% 33 3,71% 30 5,41% 27 8,99% 18 6,37% 18 Steyn Capital Equity 1,41% 29 6,95% 27 6,95% 27 5,68% 28 8,62% 10 Visio SWIX 3,95% 24 11,60% 22 11,60% 22 5,50% 30 5,95% 21 11,20% 14 16,34% 2 13,85% 2 JSE SWIX 9,63% 21,21% 21,21% 12,35% 9,36% 12,75% 14,55% 11,67% Top Quartile 8,16% 16,14% 16,14% 14,14% 9,01% 13,20% 14,74% 12,97% Mean 5,58% 12,20% 12,20% 10,45% 6,77% 10,41% 12,36% 10,61% Median 6,20% 13,31% 13,31% 8,80% 6,74% 10,98% 13,25% 12,43% Bottom Quartile 3,29% 8,96% 8,96% 7,27% 5,01% 7,72% 9,21% 8,18% JSE ALSI 7,44% 20,95% 20,95% 11,42% 9,28% 11,93% 13,31% 10,67% JSE Capped SWIX 8,44% 16,49% 16,49% 10,68% 7,98% 11,90% 46
47 ABSOLUTE CALENDAR YEAR PERFORMANCE Portfolio ABAX Equity Fund -21,58% 16 28,71% 17 20,81% 15 8,91% 4 27,06% 10 28,04% 4 14,77% 9 11,01% 6-0,97% 29 18,32% 7 ABSA AM Value Equity Fund -3,61% 1 36,64% 2 24,32% 8 6,27% 9 24,03% 16 18,74% 22 12,39% 20-3,25% 23 4,74% 18 14,09% 16 Afena Capital Aggressive Equity 2,72% 18 20,02% 21 17,05% 25 1,80% 29-14,58% 32 24,76% 3 11,42% 23 Allan Gray Domestic Equity -11,93% 3 25,67% 20 20,17% 17 9,00% 3 19,58% 22 24,51% 13 15,92% 6 5,23% 13 13,51% 11 14,44% 14 Ashburton Equity Fund 13,13% 18 3,82% 15 3,13% 22 12,99% 19 Aylett Institutional Equity -8,70% 2 35,91% 4 22,04% 13 5,62% 10 20,50% 19 23,83% 14 14,41% 12-2,18% 22 18,32% 7 13,40% 17 Bateleur Long Only Equity 26,92% 6 20,29% 1 13,44% 3 2,15% 26 14,18% 15 Cannon ALSI Institutional -26,55% 18 35,40% 5 18,69% 18-1,71% 22 12,91% 24 16,02% 28-1,90% 31-10,83% 28 21,16% 6-0,56% 32 ClucasGray Equity Prescient Fund 26,23% 11 23,14% 16 13,89% 16 1,53% 19 10,13% 14 18,40% 6 Coronation Aggressive Equity -15,08% 6 36,73% 1 27,92% 2 5,05% 11 25,82% 13 30,91% 2 7,06% 27-8,84% 25 15,98% 9 15,96% 10 Coronation Houseview Equity -16,50% 11 35,11% 6 25,81% 5 3,50% 16 27,60% 8 32,52% 1 10,11% 24 0,10% 20 6,83% 16 15,74% 11 Denker SA Equity -17,48% 13 32,02% 11 23,05% 10 1,55% 20 21,45% 17 18,02% 23 10,70% 21-11,71% 29 17,09% 8-1,69% 33 Electus Equity Fund -26,70% 19 32,14% 9 23,68% 9 2,47% 19 17,89% 23 24,63% 12 14,00% 15-0,39% 21 7,66% 15 11,23% 24 Element Equity -12,38% 4 26,68% 18 14,76% 20 3,96% 14 11,16% 25 2,16% 29 1,14% 30-16,14% 33 21,57% 4 15,50% 12 Fairtree Capital Equity Fund 31,72% 5 24,93% 11 20,07% 2 8,42% 10 10,71% 13 21,47% 3 First Avenue Equity 31,19% 6 20,21% 20 13,85% 17 9,52% 8-2,68% 31 14,65% 13 First Avenue Focused Equity 20,78% 19 14,28% 13 12,86% 4-4,14% 33 16,94% 8 Foord Specialist Domestic Equity -15,96% 8 31,21% 14 25,83% 4 8,10% 5 32,47% 3 28,49% 3 16,05% 5 2,90% 17 3,11% 23 5,39% 29 JSE SWIX -21,67% 29,91% 20,86% 4,26% 29,09% 20,71% 15,42% 3,62% 4,13% 21,21% Top Quartile -15,08% 35,11% 25,53% 7,50% 29,73% 25,92% 14,99% 8,68% 15,74% 16,14% Mean -18,43% 31,61% 22,19% 5,04% 24,40% 21,65% 11,72% 0,39% 9,29% 12,20% Median -16,50% 32,02% 22,29% 4,74% 25,67% 23,45% 13,87% 2,84% 4,92% 13,31% Bottom Quartile -21,58% 29,95% 20,24% 3,08% 20,25% 18,20% 9,94% -9,33% 2,23% 8,96% JSE ALSI -23,23% 32,13% 18,98% 2,57% 26,68% 21,43% 10,88% 5,13% 2,63% 20,95% JSE Capped SWIX 29,09% 20,71% 15,42% 2,78% 5,16% 16,49% 47
48 ABSOLUTE CALENDAR YEAR PERFORMANCE (continued) Portfolio Foord Specialist Equity SWIX -15,96% 7 31,39% 13 25,71% 6 7,83% 6 32,27% 4 27,86% 5 15,65% 8 2,92% 16 3,28% 21 5,51% 28 Investec General Equity -25,10% 17 26,48% 19 14,60% 22 6,51% 8 25,14% 15 22,44% 17 17,72% 3 15,26% 1 2,47% 25 13,21% 18 Investec Value Equity -13,04% 5 32,04% 10 25,00% 7 1,48% 21 3,03% 26-0,29% 30 13,09% 19-18,81% 34 53,50% 1-4,04% 34 Kagiso Managed Equity Fund -20,27% 15 36,24% 3 22,51% 11 4,64% 13 20,17% 20 25,11% 10 7,67% 26-8,71% 24 10,81% 12 16,20% 9 Laurium Equity Prescient Unit Trust 10,59% 7-3,67% 32 19,44% 4 Maestro Prescient Equity Fund 18,40% 19-4,38% 23 25,51% 14 23,77% 15 10,49% 23 4,13% 14-0,63% 28 1,97% 31 MAZI Capital Equity SWIX -16,44% 10 31,51% 12 28,81% 1 12,44% 2 36,69% 2 26,12% 8 14,49% 11 12,50% 5-2,54% 30 18,55% 5 Mvunonala Pure Active Equity SWIX 21,63% 18 16,38% 4 8,77% 9-5,32% 34 23,84% 1 Oasis Specialist Domestic Equity -18,60% 14 24,89% 21 20,92% 14 7,18% 7 26,15% 12 16,55% 26 10,52% 22-9,49% 26 15,02% 10 11,80% 21 Perpetua Domestic Specialist Equity 17,68% 24 9,43% 25-13,15% 31 21,32% 5 8,60% 26 Prudential Deep Value Equity -16,97% 12 29,95% 16 20,42% 16 4,74% 12 27,41% 9 26,77% 7 14,53% 10 6,23% 12 5,09% 17 23,06% 2 PSG SA Equity 15,86% 7-12,43% 30 32,36% 2 10,02% 25 Stanlib Unconstrained Equity -38,40% 21 32,60% 7 14,66% 21 3,81% 15 30,43% 7 16,26% 27 5,23% 28-9,96% 27 2,73% 24 12,20% 20 Stanlib Value Equity -29,53% 20 32,17% 8 22,08% 12 3,45% 17 21,15% 18 19,22% 21-2,13% 32 2,78% 18 4,21% 20 4,14% 30 Steyn Capital Equity 14,75% 2 4,42% 19 6,95% 27 Visio SWIX -16,34% 9 30,31% 15 27,88% 3 12,74% 1 36,92% 1 25,34% 9 14,07% 14 6,85% 11-0,27% 27 11,60% 22 JSE SWIX -21,67% 29,91% 20,86% 4,26% 29,09% 20,71% 15,42% 3,62% 4,13% 21,21% Top Quartile -15,08% 35,11% 25,53% 7,50% 29,73% 25,92% 14,99% 8,68% 15,74% 16,14% Mean -18,43% 31,61% 22,19% 5,04% 24,40% 21,65% 11,72% 0,39% 9,29% 12,20% Median -16,50% 32,02% 22,29% 4,74% 25,67% 23,45% 13,87% 2,84% 4,92% 13,31% Bottom Quartile -21,58% 29,95% 20,24% 3,08% 20,25% 18,20% 9,94% -9,33% 2,23% 8,96% JSE ALSI -23,23% 32,13% 18,98% 2,57% 26,68% 21,43% 10,88% 5,13% 2,63% 20,95% JSE Capped SWIX 29,09% 20,71% 15,42% 2,78% 5,16% 16,49% 48
49 3 YEAR ANNUALISED VOLATILITY & RETURN 49
50 5 YEAR ANNUALISED VOLATILITY & RETURN 50
51 AFRICA EQUITY EX SOUTH AFRICA FUNDS We always count 51
52 3 YEAR PERFORMANCE 52
53 5 YEAR PERFORMANCE 53
54 ABSOLUTE PERFORMANCE Portfolio 3 Months YTD Absa Africa Equity Fund 5,19% 13 24,62% 15 24,62% 15 4,74% 13-4,16% 10 All Seasons Africa Fund 8,25% 7 34,99% 9 34,99% 9 9,40% 9-4,34% 11-0,58% 11 0,92% 7 Allan Gray Africa Equity ex ZA 9,26% 6 52,85% 2 52,85% 2 19,63% 3-1,19% 8 1,34% 7 Altree Africa Opportunities Fund 9,32% 5 27,88% 12 27,88% 12 2,03% 16-7,17% 16-3,66% 15 2,12% 5-1,89% 2 Ashburton Africa Equity Opportunities Fund 8,14% 8 38,38% 5 38,38% 5 6,48% 11-6,08% 14 Ashmore EM Frontier Fund 1,95% 18 25,43% 14 25,43% 14 0,89% 18-6,39% 15 0,18% 8 3,27% 4-0,26% 1 Coronation African Frontiers 9,88% 4 36,93% 7 36,93% 7 15,48% 5-0,31% 6 4,52% 2 6,71% 1 Duet Africa Opportunities Fund 5,12% 14 18,30% 19 18,30% 19-2,91% 20-8,48% 19-2,95% 12 1,52% 6 Imara African Opportunities 20,22% 2 21,71% 16 21,71% 16 7,00% 10-2,23% 9 1,44% 6 3,63% 2-2,48% 3 Investec Africa I 7,22% 10 35,57% 8 35,57% 8 2,48% 15-8,00% 17-4,79% 16-0,58% 9 Laurium Limpopo Africa Equity Fund 7,01% 11 47,84% 3 47,84% 3 18,10% 4 7,12% 1 Metsi Fund 4,57% 15 25,45% 13 25,45% 13 1,83% 17-8,41% 18-3,38% 14 0,83% 8 Momentum Africa ex SA Equity Fund 7,70% 9 37,35% 6 37,35% 6 3,86% 14-4,93% 12-0,36% 10 3,49% 3 Old Mutual African Frontiers Fund 5,31% 12 33,68% 10 33,68% 10 9,68% 8-0,11% 5 2,85% 4 Prescient Africa Equity Fund 1,15% 19 21,62% 17 21,62% 17 0,10% 19-9,50% 20-3,09% 13 Prudential SICAV SIF Africa Fund 2,30% 17 28,99% 11 28,99% 11 10,57% 7 0,15% 4 2,72% 5 Rudiarius BCI Africa Equity Fund 3,87% 16 21,50% 18 21,50% 18 6,44% 12-5,09% 13 Sanlam African Frontier Markets Fund 16,09% 3 44,49% 4 44,49% 4 14,97% 6 0,16% 3 3,25% 3 Steyn Capital Africa Fund 24,12% 1 66,01% 1 66,01% 1 20,40% 2 3,80% 2 8,73% 1 Sustainable Capital Africa Alpha 0,16% 20 15,77% 20 15,77% 20 31,65% 1-0,39% 7 0,03% 9 MSCI Africa ex SA Index 2,62% 22,31% 22,31% 6,13% -3,22% 0,21% 1,95% -4,00% Top Quartile 9,28% 37,61% 37,61% 15,10% -0,26% 2,75% 3,49% -1,08% Mean 7,84% 32,97% 32,97% 9,14% -3,28% 0,39% 2,43% -1,54% Median 7,11% 31,33% 31,33% 6,74% -4,25% 0,11% 2,12% -1,89% Bottom Quartile 4,39% 23,89% 23,89% 2,36% -6,58% -2,99% 0,92% -2,18% MSCI Emerging Markets 7,44% 37,28% 37,28% 23,55% 9,10% 4,35% 4,47% 1,68% MSCI World 5,51% 22,40% 22,40% 14,71% 9,26% 11,64% 9,85% 5,03% 54
55 ABSOLUTE CALENDAR YEAR PERFORMANCE Portfolio Absa Africa Equity Fund -19,74% 7-11,97% 11 24,62% 15 All Seasons Africa Fund 2,05% 5 15,05% 9-25,06% 8 28,46% 8 19,96% 14-7,48% 13-26,87% 17-11,33% 10 34,99% 9 Allan Gray Africa Equity ex ZA 36,46% 4 19,97% 13-7,67% 14-32,59% 19-6,37% 6 52,85% 2 Altree Africa Opportunities Fund -32,54% 1 3,53% 4 32,03% 2-9,32% 1 19,05% 13 22,33% 6-15,19% 16-23,16% 10-18,60% 16 27,88% 12 Ashburton Africa Equity Opportunities Fund -5,35% 8-26,92% 18-18,06% 15 38,38% 5 Ashmore EM Frontier Fund -44,63% 2 35,96% 1 22,54% 6-18,46% 5 28,32% 9 25,35% 3-1,88% 4-19,41% 6-18,84% 17 25,43% 14 Coronation African Frontiers 24,40% 2 25,94% 3-16,37% 4 27,91% 11 21,61% 7 3,56% 3-25,72% 13-2,60% 2 36,93% 7 Duet Africa Opportunities Fund 25,89% 4-18,81% 6 28,21% 10 29,79% 1-13,46% 15-18,69% 5-20,32% 18 18,30% 19 Imara African Opportunities -47,70% 3 11,90% 3 21,10% 7-12,43% 2 16,77% 14 20,22% 12-4,42% 6-18,36% 4-5,93% 5 21,71% 16 Investec Africa I 32,18% 1-30,99% 10 33,76% 5 21,02% 9-16,95% 18-25,85% 14-22,54% 20 35,57% 8 Laurium Limpopo Africa Equity Fund 6,30% 1-11,88% 1-5,66% 4 47,84% 3 Metsi Fund 20,14% 8-18,82% 7 30,10% 7 17,02% 16-6,35% 11-25,91% 15-17,35% 13 25,45% 13 Momentum Africa ex SA Equity Fund 24,54% 5-15,23% 3 26,95% 12 22,46% 5-6,68% 12-20,33% 8-21,47% 19 37,35% 6 Old Mutual African Frontiers Fund -28,61% 9 32,67% 6 19,70% 15-3,54% 5-17,15% 2-10,01% 9 33,68% 10 Prescient Africa Equity Fund 43,07% 2 20,97% 10-4,69% 7-26,03% 16-17,61% 14 21,62% 17 Prudential SICAV SIF Africa Fund 20,64% 11-5,63% 9-17,84% 3-5,22% 3 28,99% 11 Rudiarius BCI Africa Equity Fund -24,54% 12-6,76% 7 21,50% 18 Sanlam African Frontier Markets Fund -31,32% 11 41,02% 3 23,94% 4-5,78% 10-23,98% 11-8,51% 8 44,49% 4 Steyn Capital Africa Fund 44,49% 1 28,13% 2 6,05% 2-22,85% 9-12,67% 12 66,01% 1 Sustainable Capital Africa Alpha 21,30% 8-16,45% 17-42,98% 20 49,72% 1 15,77% 20 MSCI Africa ex SA Index -46,79% 7,12% 17,72% -30,51% 41,12% 18,31% -5,76% -19,52% -7,91% 22,31% Top Quartile -38,59% 24,40% 25,94% -15,80% 35,79% 22,83% -3,76% -19,23% -6,26% 37,61% Mean -41,63% 15,57% 24,38% -20,49% 31,23% 22,15% -5,87% -23,54% -9,61% 32,97% Median -44,63% 11,90% 24,54% -18,81% 29,28% 21,16% -5,71% -23,57% -11,65% 31,33% Bottom Quartile -46,17% 3,53% 21,10% -26,83% 27,99% 20,15% -7,63% -25,94% -18,20% 23,89% MSCI Emerging Markets -53,33% 78,51% 18,88% -18,42% 18,22% -2,60% -2,19% -14,92% 11,19% 37,28% MSCI World -40,71% 29,99% 11,76% -5,54% 15,83% 26,68% 4,94% -0,87% 7,51% 22,40% 55
56 3 YEAR ANNUALISED VOLATILITY & RETURN 56
57 5 YEAR ANNUALISED VOLATILITY & RETURN 57
58 SA GLOBAL BALANCED FUNDS We always count 58
59 3 YEAR PERFORMANCE 59
60 5 YEAR PERFORMANCE 60
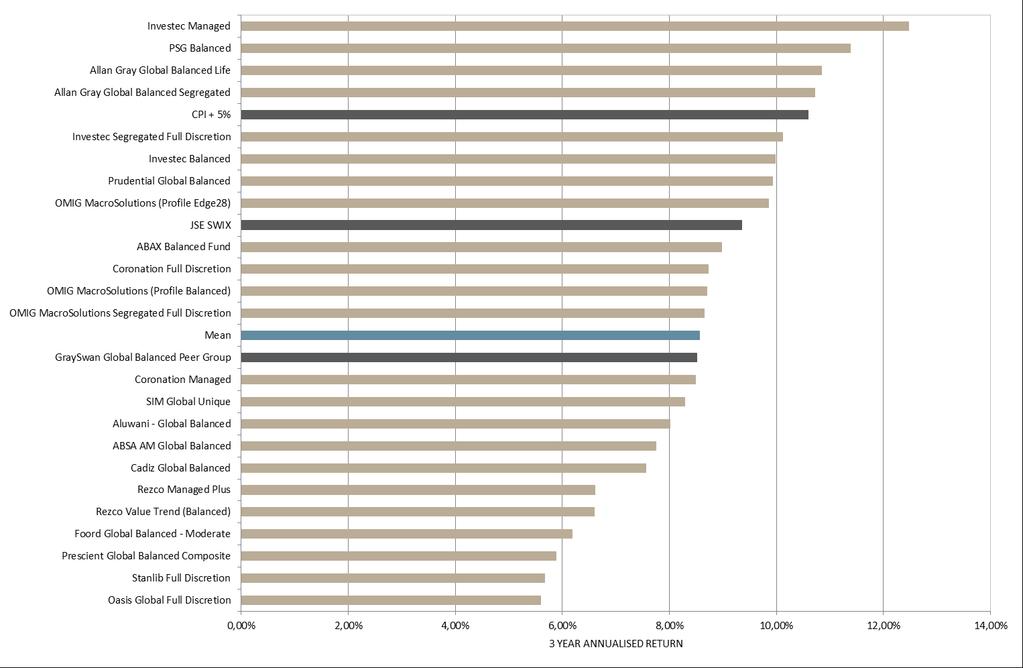
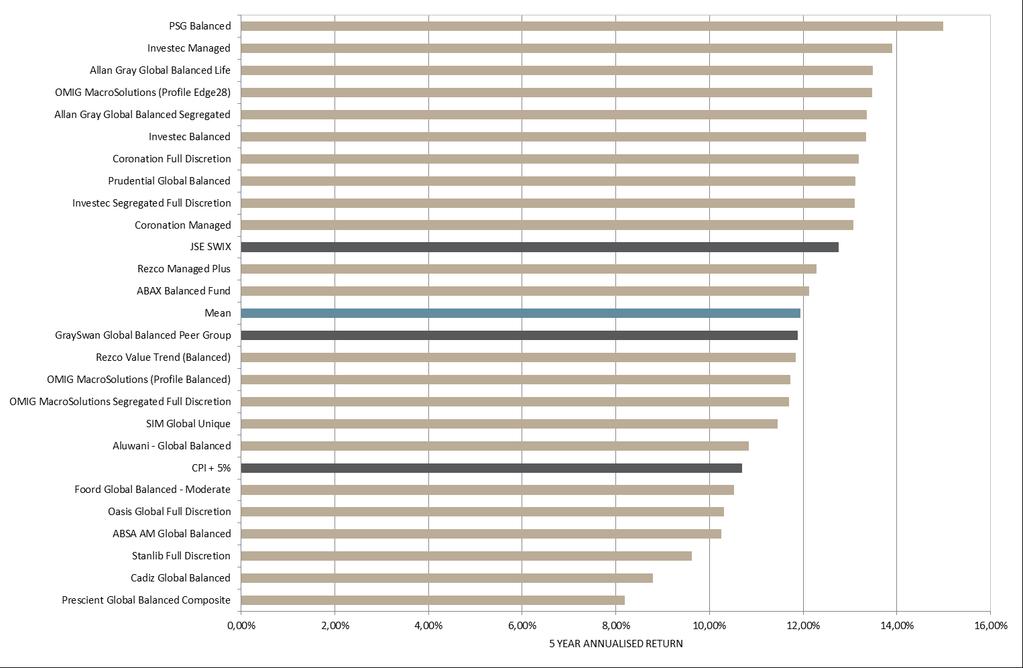
61 ABSOLUTE PERFORMANCE Portfolio 3 Months YTD ABAX Balanced Fund 0,51% 20 9,07% 18 9,07% 18 10,35% 3 8,98% 9 12,13% 12 ABSA AM Global Balanced 3,22% 8 11,26% 17 11,26% 17 7,41% 15 7,74% 16 10,25% 20 Allan Gray Global Balanced Life 3,42% 5 11,87% 16 11,87% 16 9,81% 5 10,84% 3 13,48% 3 13,46% 10 12,13% 5 Allan Gray Global Balanced Segregated 3,47% 4 11,94% 15 11,94% 15 9,70% 6 10,72% 4 13,36% 5 13,28% 11 11,98% 8 Aluwani - Global Balanced 2,74% 9 13,71% 8 13,71% 8 6,86% 17 8,02% 15 10,83% 17 11,70% 17 10,25% 14 Cadiz Global Balanced 2,11% 15 12,06% 14 12,06% 14 8,91% 10 7,56% 17 8,79% 22 10,61% 19 Coronation Full Discretion 2,66% 11 14,13% 5 14,13% 5 8,65% 13 8,73% 10 13,18% 7 14,14% 4 12,70% 3 Coronation Managed 0,54% 19 12,54% 12 12,54% 12 10,23% 4 8,49% 13 13,06% 10 14,64% 3 13,25% 2 Foord Global Balanced - Moderate -1,41% 23 7,76% 20 7,76% 20 4,08% 21 6,18% 20 10,51% 18 13,23% 12 11,64% 10 Investec Balanced 2,44% 14 13,48% 9 13,48% 9 7,17% 16 9,97% 6 13,34% 6 13,60% 7 12,04% 7 Investec Managed 2,57% 12 13,78% 6 13,78% 6 9,19% 9 12,46% 1 13,90% 2 14,05% 5 11,45% 11 Investec Segregated Full Discretion 2,57% 13 13,77% 7 13,77% 7 7,56% 14 10,11% 5 13,09% 9 13,48% 9 11,88% 9 Oasis Global Full Discretion 1,73% 18 6,63% 23 6,63% 23 5,52% 19 5,60% 23 10,30% 19 11,63% 18 9,08% 17 OMIG MacroSolutions (Profile Balanced) 3,25% 7 14,19% 4 14,19% 4 8,67% 12 8,70% 11 11,72% 14 12,47% 14 10,18% 15 OMIG MacroSolutions (Profile Edge28) 5,22% 2 15,79% 1 15,79% 1 9,24% 7 9,85% 8 13,47% 4 13,50% 8 11,36% 12 OMIG MacroSolutions Segregated Full Discretion 3,36% 6 14,29% 3 14,29% 3 8,71% 11 8,65% 12 11,70% 15 12,46% 15 10,36% 13 Prescient Global Balanced Composite 2,74% 10 13,44% 10 13,44% 10 5,79% 18 5,88% 21 8,19% 23 8,82% 20 7,98% 19 Prudential Global Balanced 4,21% 3 14,49% 2 14,49% 2 10,47% 2 9,92% 7 13,11% 8 14,01% 6 12,08% 6 PSG Balanced 5,22% 1 12,94% 11 12,94% 11 13,74% 1 11,38% 2 14,98% 1 14,72% 2 12,46% 4 Rezco Managed Plus 0,06% 22 7,04% 22 7,04% 22 0,39% 23 6,61% 18 12,27% 11 Rezco Value Trend (Balanced) 0,23% 21 7,25% 21 7,25% 21 1,26% 22 6,60% 19 11,83% 13 14,98% 1 13,81% 1 SIM Global Unique 1,85% 17 12,37% 13 12,37% 13 9,21% 8 8,28% 14 11,44% 16 12,50% 13 10,13% 16 Stanlib Full Discretion 2,06% 16 8,64% 19 8,64% 19 4,44% 20 5,67% 22 9,62% 21 12,39% 16 8,98% 18 GraySwan Global Balanced Peer Group 2,30% 12,00% 12,00% 8,35% 8,51% 11,87% 13,01% 11,24% Top Quartile 3,30% 13,77% 13,77% 9,47% 9,95% 13,26% 14,02% 12,10% Mean 2,38% 11,84% 11,84% 7,71% 8,56% 11,94% 12,98% 11,25% Median 2,57% 12,54% 12,54% 8,67% 8,65% 12,13% 13,37% 11,64% Bottom Quartile 1,79% 10,17% 10,17% 6,32% 7,08% 10,67% 12,44% 10,22% CPI + 5% 2,11% 9,85% 9,85% 10,89% 10,59% 10,69% 10,56% 11,23% JSE SWIX 9,63% 21,21% 21,21% 12,35% 9,36% 12,75% 14,55% 11,67% 61
62 ABSOLUTE CALENDAR YEAR PERFORMANCE Portfolio ABAX Balanced Fund 23,56% 6 17,14% 21 16,91% 1 6,28% 19 11,64% 2 9,07% 18 ABSA AM Global Balanced 8,38% 11 20,01% 16 16,70% 22 11,57% 12 8,41% 15 3,70% 11 11,26% 17 Allan Gray Global Balanced Life -1,38% 4 15,95% 16 11,84% 18 13,06% 2 15,43% 21 25,33% 6 10,27% 19 12,93% 6 7,78% 4 11,87% 16 Allan Gray Global Balanced Segregated -1,06% 3 15,62% 17 11,68% 19 12,63% 3 15,14% 22 25,05% 7 10,29% 18 12,77% 7 7,51% 5 11,94% 15 Aluwani - Global Balanced -12,39% 14 24,91% 5 14,37% 10 5,93% 20 19,65% 19 20,67% 19 9,95% 20 10,37% 10 0,42% 19 13,71% 8 Cadiz Global Balanced 20,33% 10 15,91% 7 4,35% 21 21,55% 10 18,69% 20 3,18% 23 4,90% 23 5,86% 8 12,06% 14 Coronation Full Discretion -8,29% 7 25,13% 4 17,76% 3 8,21% 12 21,72% 8 28,88% 4 12,10% 10 8,88% 11 3,44% 12 14,13% 5 Coronation Managed -7,56% 6 25,89% 3 19,41% 1 9,05% 7 24,00% 5 30,10% 3 11,22% 14 5,09% 22 7,96% 3 12,54% 12 Foord Global Balanced - Moderate -5,62% 5 17,93% 14 17,16% 5 11,42% 4 25,57% 2 24,03% 10 11,00% 15 10,51% 9 0,53% 18 7,76% 20 Investec Balanced -10,96% 9 26,23% 1 14,09% 12 7,73% 14 20,60% 13 24,07% 9 13,35% 3 15,80% 4 1,21% 17 13,48% 9 Investec Managed -14,85% 17 21,33% 7 12,81% 16 8,79% 8 21,66% 9 23,45% 12 9,16% 22 19,30% 2 4,79% 9 13,78% 6 Investec Segregated Full Discretion -11,49% 11 26,17% 2 14,53% 9 7,59% 16 20,66% 12 22,33% 14 13,27% 5 15,41% 5 1,68% 16 13,77% 7 Oasis Global Full Discretion -14,39% 16 15,60% 18 11,95% 17 8,56% 9 21,49% 11 22,80% 13 12,91% 6 5,74% 21 4,43% 10 6,63% 23 OMIG MacroSolutions (Profile Balanced) -12,79% 15 18,14% 13 13,70% 15 7,84% 13 19,95% 18 20,84% 18 12,15% 7 8,76% 13 3,42% 13 14,19% 4 OMIG MacroSolutions (Profile Edge28) -11,76% 12 20,69% 9 14,17% 11 6,65% 18 20,27% 14 23,71% 11 14,72% 2 11,07% 8 3,07% 15 15,79% 1 OMIG MacroSolutions Segregated Full Discretion -12,02% 13 19,03% 12 14,03% 13 7,57% 17 19,99% 17 20,89% 17 12,14% 8 8,52% 14 3,40% 14 14,29% 3 Prescient Global Balanced Composite 0,74% 2 8,76% 20 10,31% 20 6,51% 19 12,88% 23 12,63% 23 10,88% 17 6,07% 20-1,35% 21 13,44% 10 Prudential Global Balanced -8,70% 8 19,99% 11 15,99% 6 8,39% 10 22,68% 7 24,83% 8 11,67% 11 8,83% 12 6,60% 6 14,49% 2 PSG Balanced -11,11% 10 21,38% 6 17,25% 4 10,14% 5 15,61% 20 28,31% 5 13,35% 4 6,80% 17 14,54% 1 12,94% 11 Rezco Managed Plus 24,88% 3 31,28% 1 12,13% 9 20,23% 1-5,85% 23 7,04% 22 Rezco Value Trend (Balanced) 6,86% 1 11,64% 19 14,01% 14 15,48% 1 32,65% 1 30,10% 2 11,00% 16 18,12% 3-4,39% 22 7,25% 21 SIM Global Unique -15,43% 18 20,96% 8 15,31% 8 7,66% 15 20,20% 15 21,61% 16 11,33% 13 6,44% 18 6,15% 7 12,37% 13 Stanlib Full Discretion -21,19% 19 17,78% 15 18,03% 2 9,34% 6 24,62% 4 22,30% 15 9,69% 21 8,17% 16 0,42% 20 8,64% 19 GraySwan Global Balanced Peer Group -8,92% 19,70% 14,61% 9,42% 21,11% 23,67% 10,88% 8,85% 4,81% 12,00% Top Quartile -6,59% 22,27% 16,28% 9,34% 23,12% 25,19% 12,53% 12,85% 6,37% 13,77% Mean -9,13% 19,67% 14,72% 8,82% 21,08% 23,29% 11,49% 10,41% 3,78% 11,84% Median -11,11% 20,16% 14,27% 8,38% 20,66% 23,45% 11,57% 8,83% 3,44% 12,54% Bottom Quartile -12,59% 17,32% 13,48% 7,59% 19,97% 20,87% 10,59% 6,62% 0,87% 10,17% CPI + 5% 16,79% 11,21% 8,66% 11,49% 10,89% 10,58% 11,09% 10,00% 11,94% 9,85% JSE SWIX -21,67% 29,91% 20,86% 4,26% 29,09% 20,71% 15,42% 3,62% 4,13% 21,21% 62
63 3 YEAR ANNUALISED VOLATILITY & RETURN 63
64 5 YEAR ANNUALISED VOLATILITY & RETURN 64
65 TAKE NOTE The essence of investment management is the management of risks, not the management of returns. - Benjamin Graham All performance calculations in excess of 12 months are annualised. All relative performance statistics are to the indicated benchmark. Performance numbers for South African funds are gross of fees. Performance numbers for Offshore funds are net of fees. Performance for South African funds are noted in ZAR. Performance for Offshore funds are noted in USD. The # indicates the ranking of the fund over the specified period of analysis. Usually funds with AUM in excess of R100 million and a track record longer than 12 months may be included in the GraySwan ScoreCards. INVESTMENT CONSULTING I WEALTH MANAGEMENT I REPORTING 65
66 As with our motto ALWAYS COUNT we test and verify everything, only thereafter do we trust. The GraySwan ScoreCards as well as our other range of quantitative reports form part of our initial quantitative screening of the universe of institutional investment managers / products / mandates. As part of our ongoing investment manager monitoring and research we maintain a proprietary local and offshore performance database of more than 1000 institutional mandates/products which we monitor across more than 30 different peer group surveys. In addition, we also monitor the universe of more than 1000 retail unit trust mandates/products not only for our private clients but also for potential investment by our institutional clients. We produce summary GraySwan ScoreCards for public consumption but also produce detailed (30 pager) ScoreCards exclusively for our clients. These detailed reports measure all major risk and performance statistics over multiple time frames and compare such to individual benchmarks, industry benchmarks and relative to each other. By dissecting all quantitative aspects, we provide our clients with the most comprehensive and transparent investment manager surveys in the South African investment industry. We aim to truly compare apples with apples and provide objective and fair results to our clients. We always count, then we test, we verify and only then do we trust. We use an evidence-based analytical approach empower us to identify investable opportunities for our clients after which we proceed with rigorous qualitative research and on site due diligence. INVESTMENT CONSULTING I WEALTH MANAGEMENT I REPORTING 66
67 GRAYSWAN REPORTS Market Summary Reports Fund Composite Reports We produce a unique and comprehensive range of reports that provides in-depth and transparent analyses of investments opportunities and decisions. Contact us for objective and value-add insights. Fact Sheet Reports Asset Allocation Reports Asset Class Composite Reports Investment Manager Reports Investment Manager Hit Rate Reports Fund & Manager Attribution Reports Transaction Cost Analysis Reports Securities Lending Income Reports Costs & Fees Reports Pre & Post Trade Transition Reports Regulation 28 Compliance Reports Regulation 30 Compliance Reports INVESTMENT CONSULTING I WEALTH MANAGEMENT I REPORTING 67


68 CONTACT US The core of our investment team has been working together for more than 10 years. Our collective investment experience exceeds a 110 years of advising to and managing most of the largest institutional client s assets in South Africa. Since the inception of GraySwan have we not lost any investment consultants, making us one of the most stable and experienced investment teams in the industry. DAVID MAETLA Head of PeerGroup ScoreCards david@grayswan.co.za GREGOIRE THERON Head of Manager Research greg@grayswan.co.za DISCLAIMER The GraySwan ScoreCards provide backward looking insight of the universe of institutional investment products and mandates. Users should seek appropriate professional advice from their investment advisors before taking any action in reliance on any information provided. All data is factual and is provided for informational purposes. The data is obtained from the investment managers and should be reliable. No guarantee, representation or warranty is given by GraySwan, and no responsibility or liability, contingent or otherwise, as to its quality, accuracy, timeliness, availability and completeness of the data and information provided. Past performance is no guarantee for future performance. This information is not advice as defined and contemplated in the Financial Advisory and Intermediary Services Act, 37 of 2002, as amended. GraySwan shall not be liable for any actions taken by any person based on the correctness of this information. INVESTMENT CONSULTING I WEALTH MANAGEMENT I REPORTING I (CT) I (JHB) 68


69 UN PRI is an international investor initiative sponsored by the UN and based on six principles for responsible investments. The aim is to help investors actively to incorporate environmental, social and governance issues into their investments.
STANLIB PLATFORM INVESTMENT PORTFOLIO RANGE
 STANLIB Class TIC (Total Investment Charge) Reg 28 Compliance STANLIB Absolute Plus Fund B1 1,36% Yes STANLIB Aggressive Income Fund B6 1,07% No STANLIB ALBI (NON TR) Index Tracker Fund B1 0,34% No STANLIB
ABSA Select Equity Fund x 0.25% 1.50% x
 FUND LIST PSG Asset Management Class Clean Class Rebate PSG Balanced Fund E 0.00% 1.00% PSG Equity Fund A x 0.40% 1.50% x PSG Equity Fund B x 0.40% 1.00% x PSG Equity Fund E 0.00% 0.75% x PSG Diversified
Medical-Aid Manager Watch TM Survey for the month ending September 2017
 Medical-Aid Manager Watch TM Survey for the month ending September 2017 Objective - The portfolios in this Survey are targeted at Medical Aids and are bound by the restrictions imposed by Regulation 30
Fund List. PSG Funds Platform Administration fee per year. Initial fee Ongoing fee 0.228% Annual Fund Fees (excl. VAT)
") FUND LIST PSG Funds Platform Administration fee per year Initial fee None Ongoing fee 0.228% The Ongoing Platform Administration fees are calculated on the value of your investment portfolios, deductible
FUND LIST PSG Funds Platform Administration fee per year Initial fee None Ongoing fee 0.228% The Ongoing Platform Administration fees are calculated on the value of your investment portfolios, deductible
About reputation. Mothobi Seseli Chief Executive Officer Argon Asset Management. 06 th November 2015
 About reputation Mothobi Seseli Chief Executive Officer Argon Asset Management 06 th November 2015 Asset management universe An African investment firm with global standards Bataung Capital Apr-05 Dec-06
Medical-Aid Manager Watch TM Survey for the month ending April 2018
 Medical-Aid Manager Watch TM Survey for the month ending April 2018 Objective - The portfolios in this Survey are targeted at Medical Aids and are bound by the restrictions imposed by Regulation 30 of
PlexCrown Unit Trust Survey: Fourth Quarter 2017
 PlexCrown Unit Trust Survey: Fourth Quarter 2017 Overview of retail rand-denominated unit trust and FSB-approved foreign collective investment scheme returns, fund s and management company s for the quarter
S.A. Money Market Manager Watch TM Survey for the month ending April 2016
 APRIL 2016 2016/04/30 2016/02/01 2016/01/01 2015/05/01 2013/05/01 2011/05/01 2009/05/01 2006/05/01 S.A. Money Market Manager Watch TM Survey for the month ending April 2016 S.A. Money Market Manager Watch
S.A. Money Market Manager Watch TM Survey for the month ending January 2017
 JANUARY 2017 31/01/2017 01/11/2016 01/01/2017 01/02/2016 01/02/2014 01/02/2012 01/02/2010 01/02/2007 S.A. Money Market Manager Watch TM Survey for the month ending January 2017 S.A. Money Market Manager
The Matrix Review. December 2018
 The Matrix Review December 2018 Why Matrix Fund Managers Diversified Business Long funds AUM = R5.9 billion Hedge funds AUM = R3.1 billion Robust investment process across asset classes Evolution Hedge
STANLIB Linked Range. STANLIB Linked Fund Range. STANLIB Linked Fund Range (Retail Growth) Other STANLIB Funds. STANLIB White Labelled Funds
 Other STANLIB Funds. STANLIB White Labelled Funds") Click on the relevant tab to view the list. STANLIB Linked Fund Range STANLIB ABSA Allan Gray Cadiz Coronation Foord Investec Liberty Marriott Melville Douglas Nedgroup Old Mutual Prescient Prudential
Click on the relevant tab to view the list. STANLIB Linked Fund Range STANLIB ABSA Allan Gray Cadiz Coronation Foord Investec Liberty Marriott Melville Douglas Nedgroup Old Mutual Prescient Prudential
A study of the independent / boutique asset management industry in South Africa. November 2016
 + A study of the independent / boutique asset management industry in South Africa November 2016 1 Notes : See appendix for sources, glossary of terms and definitions Significant number (126) of boutiques
Linked Investments Tax-Free Savings Plan
 Linked Investments Tax-Free Savings Plan Fund List Click on the relevant tab to view the list. # All fees are exclusive of VAT # No performance Fees are charged on these funds. Please refer to the fund
Absolute Return Manager Watch TM Survey for the month ending July 2018
 JULY 2018 2018/07/31 2018/05/01 2018/01/01 2017/08/01 2015/08/01 2013/08/01 2011/08/01 2008/08/01 Month Ending JULY 2018 2018/04/01 2018/01/01 2017/09/01 2017/05/01 2015/05/01 2011/05/01 2008/05/01 CPI
SOUTH AFRICAN RETIREMENT ANNUITY FUND (SARAF) SARAF INVESTMENT PERFORMANCE UPDATE FOR THE PERIOD ENDED 31 MARCH 2018
 SARAF INVESTMENT PERFORMANCE UPDATE FOR THE PERIOD ENDED 31 MARCH 2018") SOUTH AFRICAN RETIREMENT ANNUITY FUND (SARAF) SARAF INVESTMENT PERFORMANCE UPDATE FOR THE PERIOD ENDED 31 MARCH 2018 Investment Product Absa Global Value Feeder Fund -4.7% -8.5% 2.8% 9.5% 14.8% 8.5% Allan
SOUTH AFRICAN RETIREMENT ANNUITY FUND (SARAF) SARAF INVESTMENT PERFORMANCE UPDATE FOR THE PERIOD ENDED 31 MARCH 2018 Investment Product Absa Global Value Feeder Fund -4.7% -8.5% 2.8% 9.5% 14.8% 8.5% Allan
Absolute Return Manager Watch TM Survey for the month ending April 2018
 APRIL 201 2018/04/30 2018/02/01 2018/01/01 2017/05/01 2015/05/01 2013/05/01 2011/05/01 2008/05/01 Month Ending APRIL 2018 2018/01/01 2017/10/01 2017/09/01 2017/02/01 2015/02/01 2011/02/01 2008/02/01 CPI
Investor Platform Fund List
 Bond Income Multi Multi Risk expectation Bond Allan Gray Bond Fund Bond Fund GOVI Tracker Fund Multi Manager Bond Fund Momentum Bond Fund Nedgroup Investments Bond Fund Stanlib Bond Fund market Fund Multi
Founder 1964 MOMENTUM SMART PASSIVE +4 Open 2012 TRUSTEE CHOICE PORTFOLIO Open
 May 2016 Portfolio Number Founder 1964 MOMENTUM SMART PASSIVE +4 Open 2012 TRUSTEE CHOICE PORTFOLIO Open Provider ** MOMENTUM LIFESTAGES Open 1835 MOMENTUM MULTIMANAGER SMOOTH GROWTH FUND (GLOBAL) Open
SOUTH AFRICAN RETIREMENT ANNUITY FUND (SARAF) SARAF INVESTMENT PERFORMANCE UPDATE FOR THE PERIOD ENDED 30 SEPTEMBER 2017
 SARAF INVESTMENT PERFORMANCE UPDATE FOR THE PERIOD ENDED 30 SEPTEMBER 2017") SOUTH AFRICAN RETIREMENT ANNUITY FUND (SARAF) SARAF INVESTMENT PERFORMANCE UPDATE FOR THE PERIOD ENDED 30 SEPTEMBER 2017 Investment Product Absa Global Value Feeder Fund 5.8% 12.4% 17.5% 16.1% 22.1% 9.7%
SOUTH AFRICAN RETIREMENT ANNUITY FUND (SARAF) SARAF INVESTMENT PERFORMANCE UPDATE FOR THE PERIOD ENDED 30 SEPTEMBER 2017 Investment Product Absa Global Value Feeder Fund 5.8% 12.4% 17.5% 16.1% 22.1% 9.7%
Linked Investments Tax-Free Savings Plan. Fund List
 Linked Investments Tax-Free Savings Plan Fund List ABSA ABSA Absolute Fund C1 0.85% Conservative to Moderate ABSA Select Equity Fund C1 1.00% Aggressive BCI Anchor BCI Global Capital Plus Feeder Fund A
CLASSIC LIST OF FUNDS
 STANLIB Class Fund Charge (VAT excl.) Performance Risk Rating Regulation 28 Compliance STANLIB Money Market Fund *** R 0.50% Conservative STANLIB Institutional Money Market Fund **** B13 0.50% Conservative
Linked Investments Tax-Free Savings Plan
 STANLIB Linked Investments Tax-Free Savings Plan Fund List ABSA ABSA Absolute Fund C1 0.85% Conservative to Moderate ABSA Select Equity Fund C1 1.00% Aggressive BCI PortfolioMetrix BCI Global Equity Fund
CHALLENGING BELIEFS THE SOUTH AFRICAN EXPERIENCE MANAGED VOLATILITY
 CHALLENGING BELIEFS THE SOUTH AFRICAN EXPERIENCE MANAGED VOLATILITY Grant Watson Saliegh Salaam HIGH RISK = HIGH RETURN? Falling Risk Rising Risk 2 Source: Quantitative Investments, INET Negative returns
Linked Investments Tax-Free Savings Plan
 Linked Investments Tax-Free Savings Plan Click on the relevant tab to view the list. # All fees are exclusive of VAT # No performance Fees are charged on these funds. Please refer to the fund fact sheets
CLASSIC LIST OF FUNDS
 STANLIB Class Fund Charge (VAT excl.) Performance Risk Rating Regulation 28 Compliance STANLIB Money Market Fund *** R 0.50% Conservative STANLIB Institutional Money Market Fund **** B13 0.50% Conservative
In thousands Actual (113) 6m MA (198) 12m MA (191) Dec-07 Dec-09 Dec-11 Dec-13 Dec-15 Dec-17
 6m MA (198) 12m MA (191) Dec-07 Dec-09 Dec-11 Dec-13 Dec-15 Dec-17") may 2018 400 200 In thousands 0-200 -400-600 Actual (113) 6m MA (198) 12m MA (191) -800 Dec-07 Dec-09 Dec-11 Dec-13 Dec-15 Dec-17 40 30 Eurozone France Italy Portugal Germany Spain Greece Ireland 20 10
may 2018 400 200 In thousands 0-200 -400-600 Actual (113) 6m MA (198) 12m MA (191) -800 Dec-07 Dec-09 Dec-11 Dec-13 Dec-15 Dec-17 40 30 Eurozone France Italy Portugal Germany Spain Greece Ireland 20 10
Core portfolio. our client value proposition. autumn 2017
 Core portfolio our client value proposition autumn 2017 What do we mean by good governance? 04 Why partner with Momentum Wealth 04 Why the Core Portfolio range? 06 Glossary 08 Contact us 10 Page 2 of 10
SOUTH AFRICAN HEDGE FUND SURVEY
 SOUTH AFRICAN HEDGE SURVEY Return Statistics Returns MARKET RETURNS 1 month 3 months 6 months p.a. 5 years p.a. Ytd FTSE/JSE All Share Index 2.7% 9.6% 9.0% 30.1% 17.8% 22.2% 7.0% All Bond Index 0.3% 4.6%
SYGNIA PERFORMANCE MARCH EDITION 01 SYGNIA CONTINUES TO DELIVER TOP PERFORMANCE
 SYGNIA PERFORMANCE MARCH 2016. EDITION 01 SYGNIA CONTINUES TO DELIVER TOP PERFORMANCE 2015 saw the tail-end of an extraordinary bull market which started after the co-ordinated relaxation of monetary policies
SOUTH AFRICAN HEDGE FUND SURVEY MAY 2014
 SOUTH AFRICAN HEDGE SURVEY Return Statistics Returns MARKET RETURNS 1 month 3 months 6 months p.a. 5 years p.a. Ytd FTSE/JSE All Share Index 1.6% 6.2% 12.0% 21.8% 18.7% 20.2% 8.8% All Bond Index 1.2% 3.3%
OLD MUTUAL SUPERFUND SUPERFUND CHOICE AND PRESERVER INVESTMENT PORTFOLIOS AND FEES LIST
 OLD MUAL SUPERFUND SUPERFUND CHOICE AND PRESERVER INVESTMENT PORTFOLIOS AND FEES LIST AS AT 1 AUGUST 2015 Risk Profile Profile Name TRUSTEE CHOICE INVESTMENT PACKAGE 0.55% Capital : 0.70% per annum, deducted
SOUTH AFRICAN HEDGE FUND SURVEY JULY 2014
 SOUTH AFRICAN HEDGE SURVEY JULY 2014 Return Statistics Returns MARKET RETURNS 1 month 3 months 6 months p.a. 5 years p.a. Ytd FTSE/JSE All Share Index 0.9% 5.4% 15.5% 28.3% 21.8% 19.5% 12.8% All Bond Index
SOUTH AFRICAN HEDGE FUND SURVEY DECEMBER 2009
 SOUTH AFRICAN HEDGE FUND SURVEY DECEMBER 2009 COMMENTS DECEMBER 2009 THE HEDGE FUNDS For the months ended 31 December 2009, the SYmmETRY Hedge Index returned +14.1%, Long Short Equity returned +18.9%,
THE CORION REPORT. MONTHLY CIS INSIGHTS february 2019 PIONEERING. PARTNERING. PERFORMING. interactive PDF
 THE COION EPOT MONTHLY CIS INSIGHTS february 2019 interactive PDF PIONEEING. PATNEING. PEFOMING. FEB FEBUAY 2019 The Environment Asset Classes* Equity Industries The Equity market continued to rebound,
Sanlam Employee Benefits
 Sanlam Employee Benefits Sanlam Plus Pension & Provident Preservation monthly investment fact sheets March 2017 Sanlam Plus Pension & Provident Preservation March 2017 Member Investment Selection Menu
Morningstar Rating Analysis of South African Domiciled Asset Managers
 Morningstar South Africa Q3 2017 Morningstar Rating Analysis of South African Domiciled Asset Managers 30 September 2017 Authors: Matthew Mellors Matthew Vass Content Morningstar Rating Analysis of South
EXECUTIVE SUMMARY JULY 2017 THE CORION REPORT
 1 EXECUTIVE SUMMAY JULY 2017 THE COION EPOT MONTHLY CIS INSIGHTS / OCTOBE 2017 PIONEEING. PATNEING. PEFOMING. 2 EXECUTIVE SUMMAY OCTOBE 2017 The Environment Asset Classes* Equity Industries The Equity
Multi-Manager Watch TM Survey for the month ending November 2016
 NOVEMBER 20 2016/11/30 2016/09/01 2016/01/01 2015/12/01 2014/12/01 2013/12/01 2011/12/01 2009/12/01 2006/12/01 Multi-Manager Watch Survey Multi-Manager Watch TM Survey for the month ending November 2016
EXECUTIVE SUMMARY JULY 2017 THE CORION REPORT
 1 EXECUTIVE SUMMAY JULY 2017 THE COION EPOT MONTHLY CIS INSIGHTS / NOVEMBE 2017 PIONEEING. PATNEING. PEFOMING. 2 EXECUTIVE SUMMAY NOVEMBE 2017 The Environment During a volatile month for most asset classes,
Investment Platform Portfolio List as at 1 December 2016
 Investment Platform Portfolio List as at 1 December 2016 GENERAL INFORMATION OVERVIEW FEES (Excl. VAT) Name Hollard Prime Money Market Maximise interest income, preserve the fund s capital and provide
EXECUTIVE SUMMARY JULY 2017 THE CORION REPORT
 1 EXECUTIVE SUMMAY JULY 2017 THE COION EPOT MONTHLY CIS INSIGHTS / AUGUST 2018 PIONEEING. PATNEING. PEFOMING. 2 EXECUTIVE SUMMAY AUGUST 2018 The Environment The and weakened 12% in August due to the ongoing
SOUTH AFRICAN HEDGE FUND SURVEY
 SOUTH AFRICAN HEDGE SURVEY Licensed Financial Services Provider Hedge fund survey commentary INET: New Entrant: Exit: Exit: Exit: We have recently entered into a business relationship with the I-Net Bridge
SOUTH AFRICAN HEDGE FUND SURVEY
 SOUTH AFRICAN HEDGE SURVEY APRIL 2012 Licensed Financial Services Provider Hedge fund survey commentary INET: New Entrant: Exit: We have recently entered into a business relationship with the I-Net Bridge
SOUTH AFRICAN HEDGE FUND SURVEY
 SOUTH AFRICAN HEDGE SURVEY Licensed Financial Services Provider Return Statistics Returns MARKET RETURNS 1 month 3 months 6 months p.a. 5 years p.a. Ytd FTSE/JSE All Share Index -1.9% 4.5% 13.6% 19.3%
SOUTH AFRICAN HEDGE FUND SURVEY
 SOUTH AFRICAN HEDGE SURVEY Licensed Financial Services Provider Hedge fund survey commentary INET: New Entrant: Exit: We have recently entered into a business relationship with the I-Net Bridge Group to
SOUTH AFRICAN HEDGE FUND SURVEY
 SOUTH AFRICAN HEDGE SURVEY DECEMBER 2011 Licensed Financial Services Provider STEPHEN BRIERLEY Head Hedge Fund Manager Research Cell: +27 (0)21 504 7857 Tel: +27 (0)83 258 8198 Email: sbrierley@symmetry.co.za
SOUTH AFRICAN HEDGE FUND SURVEY
 SOUTH AFRICAN HEDGE SURVEY SEPTEMBER 2011 Licensed Financial Services Provider COMMENTS Hedge fund survey commentary New entrant: We welcome Murray Derksen and his Polar Star Fund to the survey. Murray
february 2019
 february 2019 Momentum multi-managed life stage portfolios returns for february 2019 Lifestages progression The portfolio range has a lifestage model which allows a member of a retirement fund
EXECUTIVE SUMMARY JULY 2017 THE CORION REPORT
 1 EXECUTIVE SUMMAY JULY 2017 THE COION EPOT MONTHLY CIS INSIGHTS / MACH 2018 PIONEEING. PATNEING. PEFOMING. 2 EXECUTIVE SUMMAY MACH 2018 The Environment Much of the performance theme experienced in February
Market Risk Portfolio May 2018 Page 1
 May 2018 M A R K E T R I S K P O R T F O L I O INVESTMENT OBJECTIVE. The Market Risk Portfolio aims to deliver a good return relative to headline inflation over the long term, but does not provide a guarantee.
NAME FEE NAV YIELD CPU HIGH LOW FUND MANAGER
 Markets and Commodity figures 03 June 2015 Unit Trust Data - brought to you by: NAME FEE NAV YIELD CPU HIGH LOW FUND MANAGER Growth 5 0 0 0 499.67 457.27 Anglorand Management Co EMH Diversified Income
SOLUTIONS RANGE. Authorised Financial Services Provider (FSP 612)
") SOLUTIONS RANGE Authorised Financial Services Provider (FSP 612) MONEY MARKET AND ENHANCED YIELD FUNDS Money Market The fund aims to achieve returns above the STefI Call Index, while minimising the risk
SOLUTIONS RANGE Authorised Financial Services Provider (FSP 612) MONEY MARKET AND ENHANCED YIELD FUNDS Money Market The fund aims to achieve returns above the STefI Call Index, while minimising the risk
Sanlam Investments Frequently Asked Questions Performance Fees April 2018
 Sanlam Investments Frequently Asked Questions Performance Fees April 2018 Disclosure The information to follow does not constitute financial advice as contemplated in terms of the Financial Advisory and
THE SHOPPING LIST BY GLACIER RESEARCH
 THE SHOPPING LIST BY GLACIER RESEARCH December 2016 - Review of Quarter 3 A reference guide to superior collective investment schemes in SA THINK WORLD CLASS FOREWORD Welcome to the Glacier Research Shopping
Sanlam Lifestage LIFESTAGE PROGRAMME LIFESTAGE PROGRAMME. How Sanlam Lifestage works. Sanlam Umbrella Fund Monthly Fact Sheet April 2018
 Accumulator phase Preserver phase Sanlam Umbrella Monthly Fact Sheet April 2018 Sanlam Lifestage Mandate description Sanlam Lifestage is the s trustee approved default investment strategy and aims to meet
ASSET MANAGERS The currently appointed asset managers for the Market Risk Portfolio are as follows:
 November 2018 M A R K E T R I S K P O R T F O L I O INVESTMENT OBJECTIVE. The Market Risk Portfolio aims to deliver a good return relative to headline inflation over the long term, but does not provide
EXECUTIVE SUMMARY JULY 2017 THE CORION REPORT
 1 EXECUTIVE SUMMAY JULY 2017 THE COION EPOT MONTHLY CIS INSIGHTS / JUNE 2018 PIONEEING. PATNEING. PEFOMING. 2 EXECUTIVE SUMMAY JUNE 2018 The Environment The Equity market ended up 8%, despite an escalating
General Investor Report as at 31/03/2018
 STANLIB TOP40 ETF A 49,24 0,27 13 788 601 The investment objective of the STANLIB TOP40 Exchange Traded Fund is to provide returns that replicate the performance of the FTSE/JSE TOP40 Index ( the index
EXECUTIVE SUMMARY JULY 2017 THE CORION REPORT MONTHLY CIS INSIGHTS OCTOBER 2018 PIONEERING. PARTNERING. PERFORMING.
 1 EXECUTIVE SUMMAY JULY 2017 THE COION EPOT MONTHLY CIS INSIGHTS OCTOBE 2018 PIONEEING. PATNEING. PEFOMING. EXECUTIVE SUMMAY OCTOBE 2018 THE ENVIONMENT Equities depreciated by 8%, in line with the global
LOCAL INVESTMENT PLATFORM FUND LIST. Effective 19 September 2018
 LOCAL INVESTMENT PLATFORM FUND LIST Effective 19 September 2018 CONTENTS Important definitions and notes 1 Allan Gray Local Investment Platform Fund List 5 Footnotes 11 Fundhouse ratings 12 Important information
Investment Portfolio Gross Return Gross Return Gross Return Volatility
 OLD MUTUAL SUPERFUND SUPERFUND CHOICE AND PRESERVER INVESTMENT PERFORMANCE UPDATE FOR THE PERIOD ENDED 30 NOVEMBER 2018 Quarter 1-year 3-year 5-year Broad Category Investment Portfolio Lower Reward Lower
LOCAL INVESTMENT PLATFORM FUND LIST EFFECTIVE 15 DECEMBER 2017 VERSION 9.13
 LOCAL INVESTMENT PLATFORM FUND LIST EFFECTIVE 15 DECEMBER 2017 VERSION 9.13 IMPORTANT DEFINITIONS AND NOTES The primary aim of our investment platform is to offer investors choice and ease of administration
TAX-FREE INVESTMENT FUND LIST. Effective 22 May 2018
 TAX-FREE INVESTMENT FUND LIST Effective 22 May 2018 CONTENTS Important definitions and notes 1 Tax-free investment unit trust list 3 Footnotes 7 Fundhouse ratings 8 Important information for investors
THE SHOPPING LIST BY GLACIER RESEARCH
 THE SHOPPING LIST BY GLACIER RESEARCH February 2017 - Review of Quarter 4 A reference guide to superior collective investment schemes in SA THINK WORLD CLASS FOREWORD Welcome to the Glacier Research Shopping
TAX-FREE INVESTMENT UNIT TRUST LIST EFFECTIVE 9 NOVEMBER 2017 VERSION 3.22
 TAX-FREE INVESTMENT UNIT TRUST LIST EFFECTIVE 9 NOVEMBER 2017 VERSION 3.22 IMPORTANT DEFINITIONS AND NOTES The primary aim of our investment platform is to offer investors choice and ease of administration
Delta Cautious Plus Wrap Fund
 31 August 2018 To make a lasting difference Fund Information Inception Date 01 July 2010 Fund Size Benchmark R 255.3 million SA Multi Asset Low Equity Risk Profile Low Risk X X X X X Fee Structure (incl
FIRSTGLOBAL ASSET MANAGEMENT QUARTERLY REPORT QUARTER 3
 FIRSTGLOBAL ASSET MANAGEMENT QUARTERLY REPORT QUARTER 3 September 2017 FIRSTGLOBAL Asset Management is an authorised financial services provider FSP nr 20987 MARKET COMMENTARY Edrich Jansen MCom Finance
NATIONAL FUND FOR MUNICIPAL WORKERS
 NATIONAL FUND FOR MUNICIPAL WORKERS Monthly Report as at 31 August 2018 Table of Contents Page Economic Commentary.... Total Fund a) Total Fund Information......... b) Manager and Product Information.........
South Africa. Fund Observer
 2015 2Q Q4 South Africa Fund Observer Morningstar Fund Observer 4th Quarter 2015 Contents Data: Individual Funds 3 Data: Fund Categories 4 Data: Fund Houses 5 Data: Market Performance 6 Commentary: Quarterly
FIRSTGLOBAL ASSET MANAGEMENT QUARTERLY REPORT QUARTER 4
 FIRSTGLOBAL ASSET MANAGEMENT QUARTERLY REPORT QUARTER 4 December 2017 FIRSTGLOBAL Asset Management is an authorised financial services provider FSP nr 20987 MARKET COMMENTARY Edrich Jansen MCom Finance
LOCAL INVESTMENT PLATFORM FUND LIST. Effective 11 July 2018
 LOCAL INVESTMENT PLATFORM FUND LIST Effective 11 July 2018 CONTENTS Important definitions and notes 1 Allan Gray Local Investment Platform Fund List 5 Footnotes 11 Fundhouse ratings 12 Important information
March 2007 Interim Results Reviewed. 15 May 2007
 March 2007 Interim Results Reviewed 15 May 2007 Agenda Financial highlights Overview of company Financial results Business review Other Retail Institutional CFM International UK & Ireland NAM - Namibia
THE CORION REPORT MONTHLY CIS INSIGHTS / APRIL 2017
 THE COION EPOT MONTHLY CIS INSIGHTS / APIL 2017 02 EXECUTIVE SUMMAY APIL 2017 ASSET CLASS ETUNS The Environment Local markets strengthened during April, along with most emerging markets. This was partly
ABRIDGED ANNUAL REPORT
 ABRIDGED ANNUAL REPORT FOR THE YEAR ENDED 31 MARCH 2018 CONTENTS PAGE RETAIL CLASS UNITS 3 OUR RETAIL HEDGE FUNDS 5 FINANCIAL INFORMATION 23 TRUSTEES REPORT 26 RETAIL CLASS UNITS Prescient RI Hedge Scheme
OLD MUTUAL SUPERFUND CHOICE, PRESERVER AND DEFERRED RETIREMENT INVESTMENT PORTFOLIOS AND FEES LIST
 OLD MUAL SUPERFUND CHOICE, PRESERVER AND DEFERRED RETIREMENT INVESTMENT PORTFOLIOS AND FEES LIST Name TRUSTEE CHOICE INVESTMENT PACKAGE Old Mutual Absolute Stable Growth Ptfolio 0.55% Capital : 0.70% per
General Investor Report as at 30/09/2017
 STANLIB TOP40 ETF - A A 49,91 0,27 14 089 053 The investment objective of the STANLIB TOP40 Exchange Traded Fund is to provide returns that replicate the performance of the FTSE/JSE TOP40 Index ( the index
Notes from the FTSE/JSE Advisory Committee Meeting held on Thursday, 2 March 2017
 To: From: Market Participants FTSE/JSE Date: 16 March 2017 Subject: 1. Background Notes from the FTSE/JSE Advisory Committee Meeting held on Thursday, 2 March 2017 The FTSE/JSE Advisory Committee (AC)
SOUTH AFRICAN EXCHANGE TRADED PRODUCTS REVIEW SOUTH AFRICAS LEADING INDEPENDENT INVESTMENT PLATFORM VOLUME ONE 2018
 VOLUME ONE 2018 SOUTH AFRICAN EXCHANGE TRADED PRODUCTS REVIEW SOUTH AFRICAS LEADING INDEPENDENT INVESTMENT PLATFORM ITRANSACT IS A LICENSED FINANCIAL SERVICES PROVIDER CONTENTS DOCUMENT PURPOSE 2 PART
Anchor Group Ltd Vunani Small Cap conference March 2015
 Anchor Group Ltd Vunani Small Cap conference March 2015 What is Anchor Group? Primarily Anchor Capital SA s fastest growing asset manager, with R11bn of assets Minority stakes in other asset management
Other Fees/Additional detail TRUSTEE CHOICE INVESTMENT PACKAGE LIFESTAGE INVESTMENT PACKAGE. Smoothing Lifestage Investment Option
 OLD MUAL SUPERFUND SUPERFUND CHOICE, PRESERVER AND DEFERRED RETIREMENT INVESTMENT PORTFOLIOS AND FEES LIST AS AT 1 DECEMBER 2017 Risk Name TRUSTEE CHOICE INVESTMENT PACKAGE Old Mutual Absolute Stable Growth
March 2010 Reviewed Interim Results. 6 May 2010
 March 2010 Reviewed Interim Results 6 May 2010 Agenda Financial highlights Overview of company Financial results Business review Retail Institutional International Transformation Other Market movements
Joint Forum. 4th Quarter Investment report to the. Sanlam Umbrella Fund. Create STRENGTH in numbers
 Investment report to the Joint Forum 4th Quarter 2014 Sanlam Umbrella Fund Create STRENGTH in numbers Sanlam Umbrella Fund Section Page number Background & Overview of the Fund 2 Default Strategies 3 Short
Hollard Linked Endowment Investment Portfolio List as at 28 February 2018
 Hollard Linked Endowment Investment Portfolio List as at 28 February 2018 Version Number: 280218 (please quote this number on the application, additional contribution and switch forms) 1. Unit Trust Funds
Sanlam Staff Umbrella Pension and Sanlam Staff Provident Fund (SSUF) Investment Information Brochure as on 31 March 2018
 Investment Information Brochure as on 31 March 2018") Sanlam Staff Umbrella Pension and Sanlam Staff Provident Fund (SSUF) Investment Information Brochure as on 31 March 2018 Last Update: April 2018 By Chrisna Swart Page 1 of 24 CONTENTS SECTION PAGE NUMBER
Sanlam Staff Umbrella Pension and Sanlam Staff Provident Fund (SSUF) Investment Information Brochure as on 31 March 2018 Last Update: April 2018 By Chrisna Swart Page 1 of 24 CONTENTS SECTION PAGE NUMBER
SYGNIA LIMITED PRESENTS 2016 INTERIM RESULTS FOR THE SIX MONTHS ENDED 31 MARCH 2016
 SYGNIA LIMITED PRESENTS 2016 INTERIM RESULTS FOR THE SIX MONTHS ENDED 31 MARCH 2016 AGENDA 1. OUR PERFORMANCE 2. SIX MONTHS SINCE LISTING 3. BUSINESS UPDATE INSTITUTIONAL RETAIL 4. FINANCIAL PERFORMANCE
Hollard Linked Endowment Investment Portfolio List as at 5 November 2018
 Hollard Linked Endowment Investment Portfolio List as at 5 November 2018 Version Number: 051118 (please quote this number on the application, additional contribution and switch forms) 1. Unit Trust Funds
The Rise of the Minnows
 www.indexinvestor.co.za Third Quarter 2015 The Rise of the Minnows By Daniel R Wessels A standout feature of the 2015 Rugby World Cup has been the much improved performances by the minnows of this four-year
ABSOLUTE RETURN FUNDS : THE REAL DEAL?
 ABSOLUTE RETURN FUNDS : THE REAL DEAL? Matt Brenzel obo Francois van Wyk: Chief Investment Officer 2011 Best Specialist Fund House Morningstar Award 2011 Best Flexible Asset Allocation Fund AGENDA Background
IMS. Risk Profiler Investec Investment Management Services. Name: Financial adviser: Risk profile prepared by:
 Risk Profiler Name: Financial adviser: Risk profile prepared by: This document or any of its content may not be in whole or in part, be copied, modified, distributed, retransmitted, redistributed, or released
STELLENBOSCH UNIVERSITY RETIREMENT FUND (USRF) OVERVIEW OF THE INVESTMENT FRAMEWORK OF USRF
 OVERVIEW OF THE INVESTMENT FRAMEWORK OF USRF") 1 STELLENBOSCH UNIVERSITY RETIREMENT FUND (USRF) OVERVIEW OF THE INVESTMENT FRAMEWORK OF USRF November 2016 1. BRIEF SUMMARY... 2 2. INTRODUCTION... 3 3. INVESTMENT OBJECTIVES... 4 4. INVESTMENT STRATEGIES...
1 STELLENBOSCH UNIVERSITY RETIREMENT FUND (USRF) OVERVIEW OF THE INVESTMENT FRAMEWORK OF USRF November 2016 1. BRIEF SUMMARY... 2 2. INTRODUCTION... 3 3. INVESTMENT OBJECTIVES... 4 4. INVESTMENT STRATEGIES...
MARKET & FUND COMMENTARY
 MARKET & FUND COMMENTARY 02.2014 During a volatile quarter ending February 2014, the JSE All Share Index rose by 5.5%, with large caps outperforming small caps by a wide margin. Resources (RESI20) rose
Investment Option Brochure
 Investment Option Brochure July 2017 Important definitions Fee A1 Class This is an annual fee payable to financial advisors by Prescient for marketing and distribution services. This fee is included in
Sanlam Umbrella Fund In-Fund options. A smooth path from pre- to post-retirement
 Sanlam Umbrella Fund In-Fund options A smooth path from pre- to post-retirement Continuous membership of the Sanlam Umbrella Fund The world of retirement is currently going through its most intense period
Hollard Linked Endowment Investment Portfolio List as at 16 July 2018
 Hollard Linked Endowment Investment Portfolio List as at 16 July 2018 Version Number: 160718 (please quote this number on the application, additional contribution and switch forms) 1. Unit Trust Funds
FACT SHEET: LONG-TERM GROWTH PORTFOLIO
 FACT SHEET: LONG-TERM GROWTH PORTFOLIO The investment objective of the Long-term Growth Portfolio is to achieve a real return (after deducting management expenses) relative to SA price inflation of 5.5%
CAPE JOINT PENSION FUND
 CAPE JOINT PENSION FUND Annual General Meeting 21 May 2004 STERLING FINANCIAL SERVICES Andrew Jones-Phillipson Presentation Structure Role of the Trustees Inflation and Rand Fund s Portfolio Structure
AUGUST 2017 etfsa.co.za MONTHLY SOUTH AFRICAN ETF, ETN AND UNIT TRUST PASSIVE INDEX TRACKING PERFORMANCE SURVEY
 AUGUST 2017 etfsa.co.za MONTHLY SOUTH AFRICAN ETF, ETN AND UNIT TRUST PASSIVE INDEX TRACKING PERFORMANCE SURVEY Mike Brown, Managing Director, etfsa.co.za The Performance Survey for the period ended 31
ABRIDGED ANNUAL REPORT FOR THE YEAR ENDED 31 MARCH 2017
 ABRIDGED ANNUAL REPORT FOR THE YEAR ENDED 31 MARCH 2017 CONTENTS PAGE Retail Class Units 3 Unit Trusts 6 Financial Information 30 Trustees Report 34 RETAIL CLASS UNITS PRESCIENT S ANNUAL MANAGEMENT FEE
STANLIB Balanced Cautious Fund
 STANLIB Balanced Cautious Fund 4 Why a STANLIB Balanced Cautious Fund? To enhance its balanced range STANLIB has introduced the STANLIB Balanced Cautious Fund to its range of asset allocation portfolios,
Collective Investments Schemes Report for the year ended 31 December 2015
 Collective Investments Schemes Report for the year ended 31 December 2015 CONTENTS Vision, mission and values 1 Section A Departmental structure 2 General overview 3 Regulatory developments 7 Section B