Wednesday, December 8, 2010
|
|
|
- Pierce Ryan
- 6 years ago
- Views:
Transcription
1 Page 1 Page 3 Page 4 Page 8 Page 9 Page 11 Page 13 Page 14 Market Commentary Style Allocation: DVY, QQQQ, IJJ Sector Allocation: FDN, GDX, IHE International Allocation: EWW, EWJ Commodity Allocation: IAU, DBA Currency Allocation: CYB Fixed Income Allocation: TIP, HYG Real Estate Allocation: ICF Market Commentary This is my last issue of the ETF Action newsletter. Going forward, I will provide investment advice via the recently launched ETF Profits premium service on TheStreet. We intend to continue to provide trading direction regarding our current model portfolio holdings, but I expect to close out many of these positions over the next month in order to focus on a more dynamic trading style. I look forward to being a part of this new product, and I hope that readers will continue to follow my advice on the new Web site. As I review the year-to-date results, the model portfolio has outperformed, thanks to some timely positions and a better mix of securities for current market conditions. Exposure to technology stocks via PowerShares QQQ (QQQQ) and First Trust Dow Jones Internet Index (FDN), as well as exposure to international markets and commodities, has provided a boost to returns. Holding bond and currency ETFs also reduced the volatility in the model portfolio during the market s summer correction. The model portfolio added another 2.34% last week, while the S&P 500 gained 3.66% over the same period. This is the first week in five that we have lost ground to the benchmark. Year to date, the S&P 500 continues to lag the model portfolio, which has gained 13.43% in 2010 vs. the 9.74% S&P 500 return. If the market typically gets it right, then there is a good chance that last Friday s employment report will either be revised upward or prove to be an aberration from the positive trend seen in other reports. Given the steady stream of improving data from other areas of the economy, the Bureau of Labor s report was surprisingly weak. Nevertheless, the market refused to relinquish any of its hard fought gains and is off to a fast start in early December. (Continued on the next page) PLEASE SEE IMPORTANT LEGAL DISCLAIMER ON LAST PAGE
2 Even though the entire report disappointed, the worst element of this important growth barometer was the payroll number. Nonfarm payrolls gained an anemic 39,000 last month, which was considerably less than both the 150,000 forecast and the revised 171,000 from the prior month s report. The private payroll component, which had been the silver lining for many months while the government laid off its census workers, also disappointed with only a 50,000 increase, which was less than one- third of the projected number. Furthermore, the unemployment rate moved up two ticks to 9.8%, putting it back to the highest level since May. Earlier in the week, initial jobless claims were also higher, but the holiday week is often volatile; the four-week average remains in a downward trend. The true silver lining of the report may be its effect on Washington policy makers. Not only will it help the Federal Reserve fend off its critics and allow it to execute further quantitative easing, the poor results may have spurred politicians to agree on the hotly debated extension of Bush-era tax credits. The theory seems to be that if investors can count on the Fed to follow through with its additional easing of monetary policy, as well as the current tax rates remaining in place -- even for small business owners who will do the bulk of the hiring --then they are likely to respond by bidding up share prices beyond their 2010 highs. Investors answered the call on Tuesday by pushing the S&P 500 and Nasdaq to new heights once a deal was struck on the tax package. Part of the reason the market remained resilient in the face of the somber employment news is that other data have provided evidence that the economy is on solid ground. The third-quarter gross domestic product (GDP) number was revised upward to an annualized 2.5%, with a stronger composition of growth in domestic demand and final sales. Recent manufacturing data have also been solid, helping to put fears of a double-dip recession to rest for the time being. The ISM manufacturing results remain in growth territory at 56.6, which is above the average dating back to 1948 for expansionary periods. Although poor employment results tend to weigh on the consumer s outlook, recent sentiment readings have been rising. Last week, the Conference Board consumer confidence index jumped to 54.1 in November from the prior month s 49.9 reading. The future expectations component improved the most, while respondents perceptions of the labor market had improved slightly. This week will bring us the preliminary reading for the University of Michigan Consumer Sentiment, which should extend October s gains. The November election results and early retail promotions probably boosted confidence. As always, please see below for updates on various components of the model portfolio and Watch Lists. 2

3 Style Allocation This category consists of broad funds that typically conform to the Morningstar Style Box (a tool that represents the characteristics of a security in a graphical format) definitions -- e.g., large-cap value, small-cap growth, etc. Portfolio Positions ishares Dow Jones Select Dividend Index (DVY) Target Allocation: 27% PowerShares QQQ (QQQQ) Target Allocation: 16% ishares S&P MidCap 400 Value Index (IJJ) Target Allocation: 12.5% IJJ: The outperformance of mid-cap stocks relative to the broader market that we saw in the first quarter is attempting to reassert itself once again. The bullish trend is supporting smalland mid-cap shares that can benefit from faster growth or corporate finance activities such as mergers and acquisitions. I will look for this trend to continue in Watch List WisdomTree Emerging Markets Small Cap Dividend (DGS) PowerShares FTSE RAFI US 1000 (PRF) ProShares UltraShort Russell2000 (TWM) WisdomTree DEFA Equity Income (DTH) 3
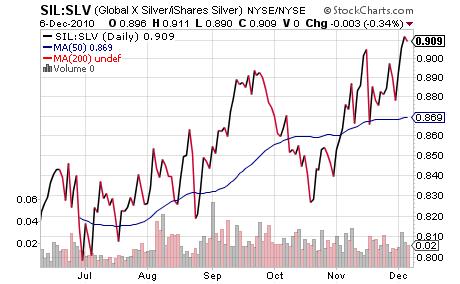
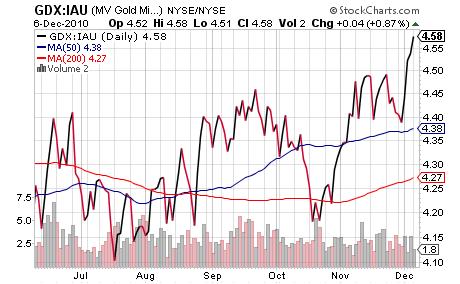
4 Sector Allocation This category consists of sector funds that provide targeted exposure to one or more industries. Portfolio Positions First Trust Dow Jones Internet Index Fund (FDN) Target Allocation: 5% Market Vectors Gold Miners ETF (GDX) Target Allocation: 5% ishares Dow Jones U.S. Pharmaceuticals Index Fund (IHE) Target Allocation: 2% GDX: Along with the precious metals (discussed below), mining shares have been performing very well of late. Over the past three months, Global X Silver Miners (SIL) has outperformed ishares Silver Trust (SLV) by about 10%, as shown by the chart of their relative prices below. Gold miners have also outperformed, but at a smaller rate. The recent pickup in GDX, however, is just a small bounce compared to the relative price level over the past few years. Gold is still trading about 40% higher per ounce than it was in March 2008, while GDX is trading about 14% higher. Since company earnings can increase faster than the price of gold, mining stocks will eventually gain much more than the metal if the current trend of low inflation and higher gold prices continues. In hockey, one skates to where the puck will be, not to where it is now. Similarly, many stock investors are looking at the miners as if gold is overpriced, when, in fact, it is the mining stocks that are underpriced; therefore, those stocks will likely trade higher in The one exception so far is the junior miner shares, which are tracked by the Market Vectors Junior Gold Miners (GDXJ). This ETF has outperformed ishares Gold Trust (IAU) by about 15%. Due to the small market capitalizations of many of these companies, in addition to the possibility of takeovers by larger producers, there is still much greater potential upside in the junior miner stocks. Whereas GDX should eventually see this level of outperformance over gold, GDXJ will continue to outpace GDX. Still, GDXJ can have violent reversals and will underperform whenever mining shares drop, giving investors an opportunity to add to their positions. (Continued on the next page) 4
5 (Continued on the next page) 5
 ishares Dow Jones U.S.")
 ishares Dow Jones U.S.")
6 Watch List ishares Dow Jones U.S. Oil Equipment Index Fund (IEZ) ishares Dow Jones U.S. Healthcare Provider Index Fund (IHF) SPDR KBW Regional Banking (KRE) ishares Dow Jones U.S. Utilities Sector Index Fund (IDU) IEZ: Last week, I showed the outperformance of IEZ relative to the S&P 500. Here is a shorterterm view, which shows that IEZ outperformed SPDR S&P 500 (SPY) every single day during the past week. (Continued on the next page) 6


7 KRE: The regional bank ETF KRE, has recently exhibited its own outperformance. However, if we look at a chart going back to the financial crisis in 2008 and 2009, we can see that KRE is near its lows relative to the S&P 500. Financial stocks have had only slightly positive returns year to date, and this explains why the S&P 500 looks set to finish 2010 with a gain in the single digits. Financials make up 15.5% of the S&P 500, which is second only to technology names. 7
 Target Allocation: 3% ishares MSCI Japan Index (EWJ) Target Allocation: 2.")
8 International Allocation This category consists of individual country or regional funds. Portfolio Positions ishares MSCI Mexico Investable Market Index (EWW) Target Allocation: 3% ishares MSCI Japan Index (EWJ) Target Allocation: 2.5% EWJ: The recent weakening of the yen has supported Japanese equities and EWJ s momentum has increased relative to other foreign ETFs. The Bank of Japan s monetary easing has also provided a boost. More important, however, has been the spurt in domestic demand thanks to government subsidies and the prospects for continuing export growth through a reacceleration of machine orders. Although the preliminary leading index for October fell more than a point to 97.2 this week (which is the fourth consecutive decline), I believe equities are on solid ground due to global growth and monetary easing. However, I will continue to watch for new developments that may cause a reversal in momentum. Watch List Claymore/AlphaShares China Small Cap Index ETF (HAO) Market Vectors Indonesia ETF (IDX) ishares MSCI Taiwan Index (EWT) ishares MSCI Chile Investable Market Index (ECH) SPDR S&P Emerging Europe (GUR) ProShares Short MSCI EAFE (EFZ) 8
 Target Allocation: 7% PowerShares DB Agriculture Fund (DBA) Target Allocation: 2% IAU: Gold and silver remain in strong bull markets as the year")
9 Commodity Allocation This category consists of funds that seek to replicate movements in the commodities markets. Portfolio Positions ishares COMEX Gold Trust (IAU) Target Allocation: 7% PowerShares DB Agriculture Fund (DBA) Target Allocation: 2% IAU: Gold and silver remain in strong bull markets as the year approaches its end, and the potential head-and-shoulders pattern visible last week was negated by the rally over the past week. Currency markets are as fragile as ever, with fear on all sides. Europe is concerned about sovereign debt, the U.S. is conducting what many fear will be a highly inflationary, or at the least very destabilizing, monetary policy, and China looks poised to take strong action to slow its economy. What we are seeing in the precious metals market is more of a simmer than a boil, however, as many investors remain on the sidelines of these markets. If concerns prove to be overblown, there is considerable short-term downside risk in gold and silver, but neither will turn negative for the year. Since late August, IAU is sitting on a gain of more than 20%, while SLV is up more than 60%. On the other hand, crisis has been a friend to the metals. Whether there is inflation or deflation, if it is accompanied by crisis, then the metals have had much higher prices in store. (Continued on the next page) 9
 ipath Dow Jones-UBS AIG Agriculture Subindex Total Return ETN (JJA) SLV: Please see the paragraph above headed by IAU")
10 Watch List PowerShares DB Base Metals Fund (DBB) ishares Silver Trust (SLV) ipath Dow Jones-UBS AIG Grains Subindex Total Return ETN (JJG) ipath Dow Jones-UBS AIG Agriculture Subindex Total Return ETN (JJA) SLV: Please see the paragraph above headed by IAU 10
 Target Allocation: 2.0% CYB: Although the bout of U.S.")
11 Currency Allocation This category consists of funds that seek to provide exposure to specific foreign currencies or baskets of currencies. Portfolio Positions WisdomTree Dreyfus Chinese Yuan (CYB) Target Allocation: 2.0% CYB: Although the bout of U.S. dollar strength this fall has also weighed on the yuan, the longerterm case for appreciation remains intact. Data such as China s exports and purchasing managers index (PMI) sentiment have been resilient, leading to a tightening of monetary policy in November. This should allow government officials to support additional currency appreciation, which in turn can help to control inflation. Right now its 200-day moving average may offer solid support, but we cannot rule out further dollar strengthening as we approach year-end. Watch List PowerShares DB U.S. Dollar Index Bullish Fund (UUP) WisdomTree Dreyfus New Zealand Dollar Fund (BNZ) CurrencyShares Euro Trust (FXE) (Continued on the next page) 11


12 UUP: Last week, I wrote that the U.S. dollar could experience a short-term pullback from overbought conditions, and we got the pullback from the end of last week to the start of this week. Judging from the action in the past year, the odds are that if the dollar has entered into a bullish period against the euro, then the recent dollar selloff has ended or will end in the next couple of days, and the dollar is about to resume its upward march. Since the strength in the U.S. dollar is mainly coming from the euro, the aggressive play is still with ProShares Ultra Short Euro (EUO). 12
 Target Allocation: 11% ishares iboxx $ High Yield Corporate Bond Fund (HYG) Target Allocation: 3% HYG: Although high-yield bonds benefited from")
13 Fixed-Income Allocation This category consists of funds that provide current income or high-yield opportunities. Portfolio Positions ishares Barclays TIPS Bond (TIP) Target Allocation: 11% ishares iboxx $ High Yield Corporate Bond Fund (HYG) Target Allocation: 3% HYG: Although high-yield bonds benefited from another strong corporate earnings season and the broad equity rally, they also suffered in the November selloff. Nevertheless, the return of risk appetites in early December and the continued low default rates may be putting another floor under these securities in the near term. Watch List ishares Barclays 20+ Year Treasury Bond Fund (TLT) ishares Barclays 3-7 Year Treasury Bond Fund (IEI) ishares Barclays Intermediate Credit Bond Fund (CIU) 13
 Target Allocation: 2% ICF: Although the domestic real estate investment trust (REIT) industry remains solidly bullish, it")
14 Real Estate Allocation This category consists of funds exposed to the domestic and global real-estate sectors. Portfolio Positions ishares Cohen & Steers Realty Majors Index Fund (ICF) Target Allocation: 2% ICF: Although the domestic real estate investment trust (REIT) industry remains solidly bullish, it remains to be seen whether it can return to outperforming the domestic stock market or global real estate. This is a traditionally weak season for residential real estate -- in particular, due to the difficulty in raising rents -- but I expect the low-growth economic environment and low interest rates to remain supportive of development. The low cost of funding will also support sporadic property acquisitions and merger activity. In the meantime, the global real estate picture may become mixed due to inflation and development controls in Hong Kong and China. Watch List ishares S&P Developed excluding-u.s. Property Index Fund (WPS) ishares FTSE NAREIT Residential Plus Capped Index Fund (REZ) 14
15 Contact Info Customer Service: Please or call TSCM (8726) Mon. Fri. 8 a.m. to 6 p.m. ET; or outside the U.S. and in Canada, call Reader Feedback and Questions: Please send an directly to Don. Again, please direct all account-related inquiries to customer service. Legal Information This information is confidential and is intended only for the authorized Subscriber. Please notify us if you have received this document in error by telephoning TSCM (8726). Don Dion is the author of TheStreet.com ETF Action by Don Dion (the Service ). Mr. Dion is also the beneficial owner of Dion Money Management, LLC, a registered investment advisor. The Service is an actively managed model portfolio of ETFs chosen by the author in accordance with his stated investment strategy. Your actual results may differ from results reported for the model portfolio for many reasons, including, without limitation: (i) performance results for the model portfolio do not reflect actual trading commissions that you may incur; (ii) performance results for the model portfolio do not account for the impact, if any, of certain market factors, such as lack of liquidity, that may affect your results; (iii) the price of ETFs chosen for the model portfolio may change in a short period of time, and although the "purchase" or "sale" of an ETF in the model portfolio will not be effected in the model portfolio until confirmation that the alert has been sent to all subscribers, delivery delays and other factors may cause the price you obtain to differ substantially from the price at the time the alert was sent; and (iv) the prices of ETFs in the model portfolio at the point in time you begin subscribing to the Service may be higher than such prices at the time such ETFs were chosen for inclusion in the model portfolio. Mr. Dion is not restricted from owning any exchange-traded fund, individual securities or options. The purchase and sale price Mr. Dion records for any trade shall be the market price of the ETF recorded fifteen minutes following the time stamp on the Service s subscription alerts. He or the investment portfolios he manages may not execute trades on any investment one (1) business day prior to, or one (1) business day prior following mention in his Service. Mr. Dion will disclose any positions in investments that he directly or indirectly holds or manages, and mentions in the Service. TheStreet.com, Inc. is a publisher. The Service contains Mr. Dion s own opinions and is provided for informational purposes only. You should not rely solely upon the Service for purposes of transacting securities or other investments, and you are encouraged to conduct your own research and due diligence, and to seek the advice of a qualified securities professional, before you make any investment. None of the information contained in the Service constitutes, or is intended to constitute a recommendation by Mr. Dion or TheStreet.com, Inc. of any particular security or trading strategy or a determination by Mr. Dion or TheStreet.com, Inc. that any security or trading strategy is suitable for any specific person. To the extent any of the information contained herein may be deemed to be investment advice, such information is impersonal and not tailored to the investment needs of any specific person. Past results are not necessarily indicative of future performance. To view our privacy policy, please click here. 15
Plan of Attack... Page 2 ETF Watch... Page 4 Model Portfolio... Page 8
 TABLE OF CONTENTS Market Background... Page 1 Plan of Attack... Page 2 ETF Watch... Page 4 Model Portfolio... Page 8 Market Background After a short holiday week that was much more difficult to navigate
The Investors Newsletter
 I N S I D E T H I S I S S U E 1 Perspectives 2 Summary of Indexes 3 Fundamentals & Indicators 4 Index Chart & Analysis economic reports from the past quarter are not indicating the push into higher prices
January 24, Michael Rechenthin, PhD Frank Kaberna
 January 24, 2017 This week we provide a list of ETFs that are currently exhibiting some of the most liquid options all with a tastytrade liquidity rating of 3 or 4 stars. To dive deeper into the ETFs and
EQUITY-FIXED INCOME CURRENCY-COMMODITY
 1 / 5 04/10/2016 USD ETFs 07/04/2017 Absolute Scoring & Ranking EQUITY-FIXED INCOME CURRENCY-COMMODITY Weekly Review www.trendandtiming.com 2/5 Weekly Report USD ETF EQUITIES EQUITY W-1 3-Nov-17 AVG AVG
Chart 2: Long-term valuation metrics suggest US stocks to be highly valued.
 November 19th, 2018 1 This is provided for informational purposes only and should not be considered a recommendation to buy or sell a particular security. Past performance is no guarantee of future returns.
February market performance. Equity Markets Index Price Indices. Property Index Price Index
 MARCH 2017 In February, global equity markets continued to trend higher boosted by optimism about US growth and reasonably good economic and corporate earnings data. In the United States, the Standard
Economic and Financial Markets Monthly Review & Outlook Detailed Report October 2017
 Economic and Financial Markets Monthly Review & Outlook Detailed Report October 17 NOT FDIC INSURED NO BANK GUARANTEE MAY LOSE VALUE Overview of the Economy Business and economic confidence indicators
Annual Returns: S&P 500 vs. ACWI ex-u.s. (Global Equities outside U.S.)
") 2015 Strategy Review Tactical Growth (Managed ETFs) December 31, 2015 The following report provides in-depth analysis into the successes and challenges of Tactical Growth throughout 2015, important research
2015 Strategy Review Tactical Growth (Managed ETFs) December 31, 2015 The following report provides in-depth analysis into the successes and challenges of Tactical Growth throughout 2015, important research
Market Watch. July Review Global economic outlook. Australia
 Market Watch Latest monthly commentary from the Investment Markets Research team at BT. Global economic outlook Australia Available data for the June quarter is consistent with a moderation in GDP growth
ETF Analysis. Value Index Growth
 ETF Analysis This analysis page is updated through August 31, 2018. This data is used in David Vomund s managed account program (www.vomundinvestments.com). Style Index ishares Style Index Funds Based
International & Global Commentaries
 International & Global Commentaries Market Review International Equity Global Select Looking Ahead Market Review In aggregate, global equities posted positive returns in the first quarter, with developed
Economic and Portfolio Outlook 4th Quarter 2014 (Released October 2014)
") Economic and Portfolio Outlook 4th Quarter 2014 (Released October 2014) Our economic outlook for the fourth quarter of 2014 for the U.S. is continued slow growth. We stated in our 3 rd quarter Economic
Economic and Portfolio Outlook 4th Quarter 2014 (Released October 2014) Our economic outlook for the fourth quarter of 2014 for the U.S. is continued slow growth. We stated in our 3 rd quarter Economic
EQUITY-FIXED INCOME CURRENCY-COMMODITY
 1 / 5 04/10/2016 USD ETFs 07/04/2017 Absolute Scoring & Ranking EQUITY-FIXED INCOME CURRENCY-COMMODITY Weekly Review www.trendandtiming.com 2/5 Weekly Report USD ETF EQUITIES EQUITY W-1 11-Aug-17 AVG AVG
Index Return Monitor. January 11, 2017
 Index Return Monitor January 11, 2017 BRAD BROWN, CFA INVESTMENT STRATEGY GROUP See Legal Disclaimer and Important Disclosure Footnotes at the end of this report for disclosures, including potential conflicts
Equity Market Review and Outlook
 REVIEW AND OUTLOOK Q3 2016 Equity Market Review and Outlook By Richard Skaggs, CFA, VP, Senior Equity Strategist KEY TAKEAWAYS Stocks rallied handily in the third quarter, led by global markets. The Fed
Are We There Yet? # Days. Quantitative Investment Decisions 999 Vanderbilt Beach Road Suite 200 Naples, Florida
 1 11 21 31 41 51 61 71 81 91 101 111 121 131 141 151 161 171 181 191 201 211 221 231 241 251 Are We There Yet? March lived up to expectations with a slightly negative Market return, -0.04%. The post-election
Prudential International Investments Advisers, LLC. Global Investment Strategy October 2009
 Prudential International Investments Advisers, LLC. Global Investment Strategy October 2009 By John Praveen, Chief Investment Strategist For Market Commentary Interviews Contact: Lisa Villareal, 973-367-2503/lisa.villareal@prudential.com
MAY 2018 Capital Markets Update
 MAY 2018 Market commentary U.S. ECONOMICS The U.S. added 223,000 jobs to payrolls in May, well above the consensus estimate of 180,000 and the expansion average of around 200,000. Sector job gains were
Eric C. Elbell, CFA, CAIA Area Senior Vice President. Kyongdo Min, CPA, CFA Area Vice President. April 11, 2018
 Eric C. Elbell, CFA, CAIA Area Senior Vice President Kyongdo Min, CPA, CFA Area Vice President April 11, 2018 Agenda We will address three key topics: Headline events that impacted markets during the quarter
Total
 The following report provides in-depth analysis into the successes and challenges of the Northcoast Tactical Growth managed ETF strategy throughout 2017, important research into the mechanics of the strategy,
May market performance. Index. Index. Global economies
 JUNE 2016 The recovery in equity and commodity prices from February lows continued into May with the third straight month of equity and commodity price rises. Oil prices continued to move higher, up another
MANAGED FUTURES INDEX
 MANAGED FUTURES INDEX COMMENTARY + STRATEGY FACTS JUNE 2018 CUMULATIVE PERFORMANCE ( SINCE JANUARY 2007* ) 120.00% 100.00% 80.00% 60.00% 40.00% 20.00% 0.00% AMFERI BARCLAY BTOP50 CTA INDEX S&P 500 S&P
Monthly Issue: February 2013
 Monthly Issue: February - US INDEXES - INTERNATIONAL INDEXES - COMMODITIES 6 CURRENCIES 7 BONDS 8 SUMMARY EURO SIGNALS By only a razor-thin margin the SPY managed to settle the month of January above a
FIVE KEYS TO EMERGING MARKET OUTLOOK John Lynch Chief Investment Strategist, LPL Financial Jeffrey Buchbinder, CFA Equity Strategist, LPL Financial
 LPL RESEARCH WEEKLY MARKET COMMENTARY KEY TAKEAWAYS We favor emerging market and U.S. equities for tactical asset allocations based primarily on our outlooks for global economic growth and earnings. We
Capital Markets Review First Quarter 2015
 Capital Markets Review First Quarter 2015 First-quarter 2015 saw a meaningful increase in volatility across asset classes, as numerous global forces continued to evolve. Everything from stocks and bonds
MANAGED FUTURES INDEX
 MANAGED FUTURES INDEX COMMENTARY + STRATEGY FACTS JULY 2018 CUMULATIVE PERFORMANCE ( SINCE JANUARY 2007* ) 120.00% 100.00% 80.00% 60.00% 40.00% 20.00% 0.00% AMFERI BARCLAY BTOP50 CTA INDEX S&P 500 S&P
Economic and Financial Markets Monthly Review & Outlook Detailed Report January 2018
 Economic and Financial Markets Monthly Review & Outlook Detailed Report January 1 NOT FDIC INSURED NO BANK GUARANTEE MAY LOSE VALUE Overview of the Economy Business and economic confidence continue to
Columbus Asset Allocation Report For Portfolio Rebalancing on
 Columbus Asset Allocation Report For Portfolio Rebalancing on 2017-08-31 Strategy Overview Columbus is a global asset allocation strategy designed to adapt to prevailing market conditions. It dynamically
January market performance. Equity Markets Price Indices Index
 Global Central Banks continue to lower interest rates. The RBA cuts the cash rate by 25bp to 2.25% (February 2015). The ECB finally announces Quantitative Easing 60b per month. Oil prices declined again
Sycamore Market Analysis
 Sycamore Market Analysis September 30, 2015 The third quarter came to an end with big gains for stocks. The rally did not quite reverse the effect of selling on Monday though with the S&P 500 still down
Capital Market Review
 Capital Market Review September 3, 215 Percent Percent MARKET/ECONOMIC OVERVIEW Risk Reprices Rapidly 2,2 1,9 1,6 1,3 S&P 5 April 29, 211 to Oct 3, 211 157 Days -19.4% May 21, 215 to Sep 3, 215 132 Days
Why is Investor Confidence Lagging?
 Veronica Willis Investment Strategy Analyst WEEKLY GUIDANCE ON ECONOMIC AND GEOPOLITICAL EVENTS Why is Investor Confidence Lagging? July 3, 2018 Key takeaways» Typically, late in the economic cycle, we
Financial Market Outlook: Stocks Rebounding from July Correction, Further Gains Likely. Bond Yields Range Bound
 For Market Commentary Interviews Contact: Lisa Villareal, 973-367-2503/lisa.villareal@prudential.com Financial Market Outlook & Strategy: Stocks Rebounding from July Correction, Further Gains Likely. Bond
Warehousing bullion for gold's supermarket As metal hits new highs, exchange-traded fund's $18 billion cache only grows
 Filed Pursuant To Rule 433 Registration No. 333-139016 January 14, 2008 Warehousing bullion for gold's supermarket As metal hits new highs, exchange-traded fund's $18 billion cache only grows By John Spence,
The Technical Portfolio
 Volume 15 Moving our Portfolio from Cash to Shorts Market Recap Page 1 Tightening Monetary Conditions Hurt Stocks Page 1-2 The S&P 500 Breaks a Ten Year Old Trend Page 2 Shorting the Major Indices Page
Financial Market Outlook: Stock Rally Continues with Faster & Stronger GDP Rebound, Earnings Recovery & Liquidity
 For Market Commentary Interviews Contact: Lisa Villareal, 973-367-2503/lisa.villareal@prudential.com Financial Market Outlook & Strategy: Further Stock Gains with Macro Sweet Spot & Earnings Recovery.
Chart 1: Dow Jones Industrial Average. Chart 2: Dow Jones Transportation Average
 December 17th, 2018 1 You are probably going to hear a lot about Dow Theory in the coming days and weeks. Just like the death crosses that have been occurring in several broad market indices, Dow Theory
for the week ending February 2, 2018
 for the week ending February 2, 2018 Market Focus: US Markets recorded its worst week in two years, some of the affects were due to a sharp rise in Treasury yields and underperforming tech and healthcare
Weekly Technical Review
 Ucap Hong Kong Asset Management Limited Weekly Technical Review 12 th January 2015 Highlights (1) Equity Markets MSCI World Index Weekly TheMSCIWorldIndexhasnowbrokenthe6yearTRENDLINEthatwetestedlastyearinSeptemberat
April 2016 Market Commentary
 April 2016 Market Commentary Domestic equity indices finished the month mixed, while international developed markets ended higher. The falling U.S. dollar continued to reverberate across markets, especially
Zenith Monthly Market Report Zenith Monthly Market Report (30 June 2010)
") Zenith Monthly Market Report (30 June 2010) Market Indicators Market Indicator End of Month Previous Month 1 Month Change 12 Months Ago 12 Month Change Interest Rates Overnight Cash 4.50 4.50 0.00% 3.00
Zenith Monthly Market Report (30 June 2010) Market Indicators Market Indicator End of Month Previous Month 1 Month Change 12 Months Ago 12 Month Change Interest Rates Overnight Cash 4.50 4.50 0.00% 3.00
GLOBAL EQUITY MARKET OUTLOOK
 LPL RESEARCH WEEKLY MARKET COMMENTARY KEY TAKEAWAYS 2017 was an excellent year for international equities, particularly EM. We favor the United States and EM equities for tactical global asset allocations
Outlook & Perspective
 Outlook & Perspective All data and information as of June 30, 2016 Approved for current clients. May be presented to prospective clients in a one-on-one setting only. Morningstar Investment Services LLC
Commentary. Things turn out best for the people who make the best of the way things turn out. - John Wooden
 LongRun Monthly Strategy Review Dec 2018 AR +0.1% AG -0.3% TMG -9.8% SP500-8.8% GDP -4.9% Commentary As noted last month, December got off to a bad start wiping out November s equity market gains in the
JANUARY 18, 2019 Market Commentary by Scott J. Brown, Ph.D., Chief Economist
 JANUARY 18, 2019 Market Commentary by Scott J. Brown, Ph.D., Chief Economist Fear and hope. Market participants remained concerned about the partial government shutdown, which has a larger and broader
Tracking the Growth Catalysts in Emerging Markets
 Tracking the Growth Catalysts in Emerging Markets September 14, 2016 by Nick Niziolek of Calamos Investments The following is an excerpt of remarks made on August 30, 2016. The majority of the improved
October 2014 Strong Dollar Effects to Investors Dollar Trend Forecast
 October 2014 Strong Dollar Effects to Investors In last month investment report, we have discussed our view for the dollar trend in the next 1 to 2 years (We said that following the changing monetary policy,
Market volatility to continue
 How much more? Renewed speculation that financial institutions may report increased US subprime-related losses has sent equity markets tumbling. How much more bad news can investors expect going forward?
The FRED Report Currency Review
 Financial Research, Education & Data July 2016 Charts as of 07/05/16 The FRED Report Currency Review Welcome to our second Special Research Report on the currency ETFs. The last report we did on these
for the week ending May 5 th, 2017
 for the week ending May 5 th, 2017 Market Focus: The S&P 500 was fractionally higher last week as better-than-expected economic data and political progress on the health care law failed to spur much of
20,000 - Check, What s next?
 1 11 21 31 41 51 61 71 81 91 101 111 121 131 141 151 161 171 181 191 201 211 221 231 241 251 20,000 - Check, What s next? The Dow Jones Industrial Average crossed the psychological 20,000 barrier on January
Fed described the economy as "slow" and said employers remained reluctant to create jobs and Inflation "somewhat low.
 08 Nov 2010 UNITED STATES The ISM manufacturing index rose to 56.9 in October from 54.4 in September, led by growth in autos, computers and exported goods. The ISM non-manufacturing index rose to 54.3
Quarterly market summary
 Quarterly market summary 4th Quarter 2016 Economic overview Economies around the world appear to be relatively resilient, with data signalling that in many countries, economic activities are expanding
Trade Log Combination Portfolios
 Trade Log Combination Portfolios LPL Financial Research As of December 22, 2011 Overview Table of Contents Absolute Return Diversified Plus: Tactical........ 2 Tactical Opportunities Diversified Plus:
On Our Radar September 2015
 On Our Radar September 2015 The Dow Jones Industrial Average (DJIA), S&P 500 and NASDAQ Composite fell 6.56 percent, 6.25 percent, and 6.85 percent, respectively, in August, which was highlighted by a
Rollercoaster Ride Ahead
 1 11 21 31 41 51 61 71 81 91 101 111 121 131 141 151 161 171 181 191 201 211 221 231 241 251 Rollercoaster Ride Ahead The Dow Jones Industrial Average reached a new high of 21,115.55 on March 1 st. With
Monthly Investment Compass Charting The Course Of The Markets
 Monthly Investment Compass Charting The Course Of The Markets April 22 nd, 2016 Monthly Investment Compass Executive Summary: April 22 nd 2016 U.S. Stock Market: The most important takeaway from the latest
JANUARY 25, 2019 Market Commentary by Scott J. Brown, Ph.D., Chief Economist
 JANUARY 25, 2019 Market Commentary by Scott J. Brown, Ph.D., Chief Economist Investor sentiment continued to bounce between fear and hope. The week began with continued concerns about the global economy
FLOW AND SHORT INTEREST ANALYSIS 27/04/2015 < Last closing date US Broad Indices 28/04/2015 1:23 AM CET < Report creation date & time
 27/4/ < Last closing date US Broad Indices 28/4/ 1:23 AM CET < Report creation date & time ETF Tracking (SI / Daily D_MAV D MAV MSCI World URTH 7. -.1% 2.8%.4% 6.4% Bullish Bullish MSCI Emerging EEM 44..4%
The DefiniTive GuiDe To etf TaxaTion 2014 Edition
 The Definitive Guide to ETF Taxation 2014 Edition table of contents Introduction... 3 What Drives ETF Taxation... 3 Equity and Fixed Income... 4 Taxation of Regulated Investment Companies (RIC)... 4 Commodity
for the week ending June 9 th, 2017
 for the week ending June 9 th, 2017 Market Focus: Stocks hit fresh all-time highs again last week, as a late-week shift in the Treasury market helped fuel a rally in bank shares that led the markets higher.
Prudential International Investments Advisers, LLC. Global Investment Strategy & Outlook For 2009
 Prudential International Investments Advisers, LLC. Global Investment Strategy & Outlook For 2009 December 17, 2009 By John Praveen, Chief Investment Strategist For Market Commentary Interviews Contact:
Fresno County Employees' Retirement Association
 Fresno County Employees' Retirement Association Investment Performance Review Period Ending: December 31, 2006 999 Third Avenue, Suite 3650 2321 Rosecrans Avenue, Suite 2250 Seattle, Washington 98104 El
Market Outlook Considerations Week Beginning September 4, 2017
 Market Outlook Considerations Week Beginning September 4, 2017 DISCLAIMER-FOR-EDUCATIONAL-PURPOSES-ONLY Bobby Coats, Ph.D. Professor Economics Department of Agricultural Economics and Agribusiness University
Danske Bank March 1 ST 2016 Economic Update,
 Monthly update: Tuesday 1 March 2016 Danske Bank Chief Economist, Twitter: angela_mcgowan Local job and investment announcements during January 2016: The NI economy suffered a significant blow during the
Retirement System Pension Plan Investment Performance Review Quarter Ended June 30, 2014
 Retirement System Pension Plan Investment Performance Review Quarter Ended June 30, 2014 Investment Advisors John Spagnola, Managing Director Joseph Federico, Analyst PFM Asset Management LLC Two Logan
Weekly Market Commentary
 LPL FINANCIAL RESEARCH Weekly Market Commentary November 18, 2014 Emerging Markets Opportunity Still Emerging Burt White Chief Investment Officer LPL Financial Jeffrey Buchbinder, CFA Market Strategist
GOLD & SILVER MINING SECTORS
 PC WONG DISCLAIMER The views by the author are his alone. All opinions expressed by the author are subject to change. The viewer is not to assume the performance of any company shares will equal its past
SEEKING PROTECTION AND PROFITS IN CHALLENGING TIMES
 THE AFTERSHOCK AFTERSHOCK MACRO VIEW The economy was boosted by a set of four interacting bubbles: 1) housing, 2) consumer spending, 3) private debt, and 4) the stock market. These four bubbles worked
2017 ANNUAL MANAGEMENT REPORT OF FUND PERFORMANCE
 MD Family of Funds 2017 ANNUAL MANAGEMENT REPORT OF FUND PERFORMANCE DISCLOSURE This annual management report of fund performance contains financial highlights but does not contain the complete annual
BROAD COMMODITY INDEX
 BROAD COMMODITY INDEX COMMENTARY + STRATEGY FACTS JUNE 2017 80.00% CUMULATIVE PERFORMANCE ( SINCE JANUARY 2007* ) 60.00% 40.00% 20.00% 0.00% -20.00% -40.00% -60.00% -80.00% ABCERI S&P GSCI ER BCOMM ER
The curious task of economics is to demonstrate to men how little they really know about what they imagine they can design."
 The curious task of economics is to demonstrate to men how little they really know about what they imagine they can design." -Friedrich August von Hayek 3 Months YTD 1 Year 3 Years 5 Years 10 Years S&P
PLEASE SEE IMPORTANT LEGAL DISCLAIMER ON LAST PAGE
 Page 1 Page 3 Page 6 Page 7 Page 8 The Market: Choppiness Anticipated New Ideas: LQD, MSFT, BA Updates: JCP, AAPL, RVBD, XLI, JPM Today s Indicator Reader Feedback & Questions: SDS, XEC, SWY The Market
A recap of last week s top economic news and what s to come.
 AGF INVESTMENTS September 5, 2017 A recap of last week s top economic news and what s to come. WEEKLY MARKET REVIEW CANADA REPORTS STRONG GDP GROWTH Canada s economy closed out the second quarter growing
Prudential International Investments Advisers, LLC. Global Investment Strategy June 2009
 Prudential International Investments Advisers, LLC. Global Investment Strategy June 2009 By John Praveen, Chief Investment Strategist For Market Commentary Interviews Contact: Lisa Villareal, 973-367-2503/lisa.villareal@prudential.com
EQUITY INDICES Close % chg Week % chg YTD EQUITY INDICES Close % chg Week % chg YTD
 Week ending: January 25, 2013 MAJOR NEWS: Markets were up owing to encouraging economic data and better-than-expected earnings reports. Looking ahead: Initial estimates of the U.S. GDP data to be released.
Financial Market Outlook: Further Stock Gain on Faster GDP Rebound and Earnings Recovery. Year-end Target Raised
 For Market Commentary Interviews Contact: Lisa Villareal, 973-367-2503/lisa.villareal@prudential.com Financial Market Outlook & Strategy: FurtherStock Gains Likely, Year-end Target Raised. Bond Under Pressure
COPYRIGHTED MATERIAL. Index
 Index Accounting issues, 173 175 ETF taxation, 174 175 ETFs vs. ETNs, 173 175 Accumulation-distribution (A-D), 4, 59 60, 133, 144 calculation by price/volume, 60 61 overview of, 59 60 RSI and, 62 67 Accumulation
November 2017 Monthly Commodity Market Overview Newsletter
 November 2017 Monthly Commodity Market Overview Newsletter By the ADMIS Research Team Stock Index Futures S&P 500, Dow Jones, NASDAQ and Russell 2000 futures registered new historical highs in November.
Chart 2: Oil prices are down considerably. This suggests that inflation is slowing.
 November 12th, 2018 1 This is provided for informational purposes only and should not be considered a recommendation to buy or sell a particular security. Past performance is no guarantee of future returns.
Investment Research Team Update
 Economic & Market Commentary Market Update February 2015 February was a great month for global stocks! The S&P 500 ( large cap stocks) was up 5.7% and small stocks (Russell 2000) gained 5.9%. The jobs
Market Month: April 2017
 Market Month: April 2017 The Markets (as of market close April 28, 2017) Equities continued their positive trend in April, spurred by favorable corporate earnings reports, proposed federal tax cuts, and
Q Commentary & SERVICES GROUP, INC. EALTH - # -
 Q1 2015 Commentary Overview As expected, 2015 started out with an increase in volatility across all asset classes. Global stocks experienced many large intraday moves, interest rates tested historic lows,
SIP Aggressive Portfolio
 SIP LIFESTYLE PORTFOLIOS FACT SHEET (NOV 2015) SIP Aggressive Portfolio SIP Aggressive Portfolio is a unitized fund, which is designed to provide long term capital growth. It is designed for those who
Market Outlook Considerations Week Beginning August 7, 2017
 Market Outlook Considerations Week Beginning August 7, 2017 DISCLAIMER-FOR-EDUCATIONAL-PURPOSES-ONLY Bobby Coats, Ph.D. Professor Economics Department of Agricultural Economics and Agribusiness University
Medium Risk Portfolio QUANTUM FUNDS PORTFOLIO REVIEW NOVEMBER DECEMBER 2014 OBJECTIVE AND STRATEGY COMPOSITION OF PORTFOLIO QUANTUM FUNDS
 QUANTUM FUNDS ($500 INVESTMENT) Medium Risk Portfolio QUANTUM FUNDS PORTFOLIO REVIEW NOVEMBER OBJECTIVE AND STRATEGY The fund pursues the objective of long-term total returns combined with capital preservation.
The Midas Touch Consulting Report 1st of March 2016
 The Midas Touch Consulting Report 1st of March 2016 1. Market Update During the last two weeks gold has been quite volatile moving between $1,191 and $1,252 without being able to establish a clear trend.
Schroder Asian Income Monthly Fund Update
 Monthly Fund Update Fund Performance As at 30 April 2016, in SGD 1 month Year to date 1 Year 3 Years (p.a.) Since launch* (p.a.) Fund (Bid-Bid) (%) Fund (Offer-Bid) (%) 0.9 1.9-2.3 2.3 8.0-4.1-3.2-7.2
JANUARY 4, 2019 Market Commentary by Scott J. Brown, Ph.D., Chief Economist
 JANUARY 4, 2019 Market Commentary by Scott J. Brown, Ph.D., Chief Economist Volatility remained elevated in the first few days of 2019, reflecting renewed concerns about China and the ongoing uncertainties
Economic Outlook. DMS Economic Outlook for next 12 months
 Economic Outlook DMS Economic Outlook for next 12 months GDP growth will be modest at approximately 2.5%, but the economy will experience periods of unstable growth. Consumer confidence will improve as
Market Maps. Bob Dickey, Technical Strategist, Portfolio Advisory Group. April RBC Capital Markets, LLC / Portfolio Advisory Group
 Market Maps Bob Dickey, Technical Strategist, Portfolio Advisory Group RBC Capital Markets, LLC / Portfolio Advisory Group All values in U.S. dollars and priced as of March 29, 2018, unless otherwise noted
COMMENTARY NUMBER 378 June Retail Sales, PPI, May Trade Deficit. July 14, 2011
 COMMENTARY NUMBER 378 June Retail Sales, PPI, May Trade Deficit July 14, 2011 At Best, Inflation-Adjusted Retail Sales Showed No Growth in Second-Quarter 2011 Trade Data Should Offer a Positive Contribution
PRUDENTIAL INTERNATIONAL INVESTMENTS ADVISERS, LLC. Global Investment Outlook
 PRUDENTIAL INTERNATIONAL INVESTMENTS ADVISERS, LLC. Global Investment Outlook September 2013 Financial Market Outlook: Stocks likely to Remain in Modest Uptrend with Low Rates & Plentiful Liquidity, Improving
PIMCO Global Optima Index
 PIMCO Global Optima Index Dynamically Blending Global Equity and U.S. Fixed Income Markets to Help Deliver Upside Growth Potential Issued by American General Life Insurance Company (AGL), an American International
MANAGED FUTURES INDEX
 MANAGED FUTURES INDEX COMMENTARY + STRATEGY FACTS JULY 2017 CUMULATIVE PERFORMANCE ( SINCE JANUARY 2007* ) 120.00% 100.00% 80.00% 60.00% 40.00% 20.00% 0.00% AMFERI BARCLAY BTOP50 CTA INDEX S&P 500 S&P
FLOW AND SHORT INTEREST ANALYSIS 04/03/2015 < Last closing date US Broad Indices 05/03/2015 3:52 AM CET < Report creation date & time
 4/3/ < Last closing date US Broad Indices /3/ 3:2 AM CET < Report creation date & time ETF Tracking (SI / Daily D_MAV D MAV MSCI World URTH 74.1 -.3% -.6% 3.4% 4.1% Bullish Bullish MSCI Emerging EEM 39.9-1.1%
Fourth Quarter 2015 Market Review. March 2016
 Fourth Quarter 2015 Market Review March 2016 Agenda Market Review Investment Outlook and Portfolio Positioning 2 2015 was a Challenging Year for Investment Returns Last year was the first time since 2001
Technical Speculator. Commodities
 Technical Speculator KEY POINTS: Improving dollar fundamentals limits upside strength for most commodities Livestock remains the top performer, again Have oil prices peaked? We suspect so Gasoline prices
Market Month: August 2018 The Markets (as of market close July 31, 2018)
") Market Month: August 2018 The Markets (as of market close July 31, 2018) Favorable economic indicators and encouraging corporate earnings reports helped propel stocks forward in July. Market growth has
Market Month: August 2018 The Markets (as of market close July 31, 2018) Favorable economic indicators and encouraging corporate earnings reports helped propel stocks forward in July. Market growth has
Will The Equity Markets Become Unglued Again & What Lies Ahead For ? Presentation Delivered on November 1, 2018 by Geoff Garbacz
 Will The Equity Markets Become Unglued Again & What Lies Ahead For 2018 19? Presentation Delivered on November 1, 2018 by Geoff Garbacz YTD Returns YTD Returns S&P 500 1997 to 2018 S&P 500 2013 to 2018