Enable Midstream Partners, LP. Fourth Quarter 2018 Investor Presentation
|
|
|
- Ferdinand Todd
- 5 years ago
- Views:
Transcription
1 Enable Midstream Partners, LP Fourth Quarter 2018 Investor Presentation
2 Forward-looking Statements Some of the information in this presentation may contain forward-looking statements. Forward-looking statements give our current expectations, contain projections of results of operations or of financial condition, or forecasts of future events. Words such as could, will, should, may, assume, forecast, position, predict, strategy, expect, intend, plan, estimate, anticipate, believe, project, budget, potential, or continue, and similar expressions are used to identify forward-looking statements. Without limiting the generality of the foregoing, forward-looking statements contained in this presentation include our expectations of plans, strategies, objectives, growth and operational performance, including revenue projections, capital expenditures and tax position. Forward-looking statements can be affected by assumptions used or by known or unknown risks or uncertainties. Consequently, no forward-looking statements can be guaranteed. A forward-looking statement may include a statement of the assumptions or bases underlying the forward-looking statement. We believe that we have chosen these assumptions or bases in good faith and that they are reasonable. However, when considering these forward-looking statements, you should keep in mind the risk factors and other cautionary statements in this presentation and in our Annual Report on Form 10-K for the year ended Dec. 31, 2017 ( Annual Report ), and in our Quarterly Report on Form 10-Q for the quarterly period ended Mar. 31, 2018 ( Quarterly Report ). Those risk factors and other factors noted throughout this presentation and in our Annual Report and Quarterly Report could cause our actual results to differ materially from those disclosed in any forward-looking statement. You are cautioned not to place undue reliance on any forward-looking statements. Forward-looking statements speak only as of the date on which they are made. We expressly disclaim any obligation to update or revise any forward-looking statement, whether as a result of new information, future events or otherwise, except as required by law. 2
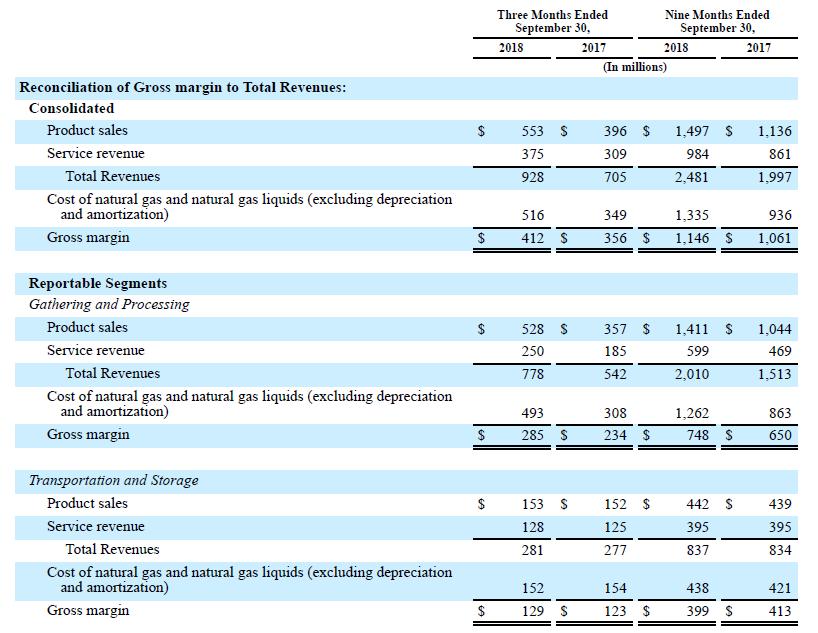
3 Non-GAAP Financial Measures Gross margin, Adjusted EBITDA, Adjusted interest expense, Distributable cash flow and Distribution coverage ratio are not financial measures presented in accordance with GAAP. Enable has included these non-gaap financial measures in this presentation based on information in its condensed consolidated financial statements. Gross margin, Adjusted EBITDA, Adjusted interest expense, Distributable cash flow and Distribution coverage ratio are supplemental financial measures that management and external users of Enable s financial statements, such as industry analysts, investors, lenders and rating agencies may use, to assess: Enable s operating performance as compared to those of other publicly traded partnerships in the midstream energy industry, without regard to capital structure or historical cost basis; The ability of Enable s assets to generate sufficient cash flow to make distributions to its partners; Enable s ability to incur and service debt and fund capital expenditures; and The viability of acquisitions and other capital expenditure projects and the returns on investment of various investment opportunities. This presentation includes a reconciliation of Gross margin to total revenues, Adjusted EBITDA and Distributable cash flow to net income attributable to limited partners, Adjusted EBITDA to net cash provided by operating activities and Adjusted interest expense to interest expense, the most directly comparable GAAP financial measures, as applicable, for each of the periods indicated. Distribution coverage ratio is a financial performance measure used by management to reflect the relationship between Enable's financial operating performance and cash distributions. Enable believes that the presentation of Gross margin, Adjusted EBITDA, Adjusted interest expense, Distributable cash flow and Distribution coverage ratio provides information useful to investors in assessing its financial condition and results of operations. Gross margin, Adjusted EBITDA, Adjusted interest expense, Distributable cash flow and Distribution coverage ratio should not be considered as alternatives to net income, operating income, revenue, cash flow from operating activities, interest expense or any other measure of financial performance or liquidity presented in accordance with GAAP. Gross margin, Adjusted EBITDA, Adjusted interest expense, Distributable cash flow and Distribution coverage ratio have important limitations as analytical tools because they exclude some but not all items that affect the most directly comparable GAAP measures. Additionally, because Gross margin, Adjusted EBITDA, Adjusted interest expense, Distributable cash flow and Distribution coverage ratio may be defined differently by other companies in Enable s industry and Enable s definitions of these measures may not be comparable to similarly titled measures of other companies, thereby diminishing their utility. 3
4 Contents 1. Enable Midstream Overview 2. Gathering and Processing Segment Overview 4. Transportation and Storage Segment Overview 5. Appendix 4
5 Enable Midstream Overview

6 Fully Integrated Midstream Platform Across Leading Basins Significant scale: 7,800 miles of interstate pipelines 1, 2,200 miles of intrastate pipelines, 13,500 miles of gathering systems, 15 major processing plants with 2.6 Bcf/d of processing capacity and 8 storage facilities comprising 86.0 Bcf of storage capacity Fully integrated midstream platform that is a critical link between growing production and downstream markets Assets in prominent natural gas and crude oil producing basins with a market-leading midstream position in the SCOOP and STACK plays Long-term relationships with large-cap producers and utilities, many of whom are investment grade Favorable contract structure with significant fee-based and demand-fee margin Investment grade credit metrics, significant liquidity, substantial distribution coverage and strong sponsorship 6 Note: Map as of Nov. 7, 2018; Completion of the announced Wildhorse plant has been deferred; pipeline miles are approximate 1. Includes SESH, in which Enable owns a 50% interest

7 Velocity Acquisition Integrated crude oil and condensate gathering and transportation business builds on Enable s market-leading Anadarko Basin midstream platform System Map 1 Uniquely positioned system with segregated and batched streams offers customers ability to secure premium pricing Access to Cushing via Plain s Basin Pipeline Access to substantial demand from a connected refinery Backed by large area dedications and long-term, fee-based agreements with over 2 million acres dedicated from shippers Expands relationships with key current customers, including Continental Resources and Marathon Oil, and offers significant opportunity from undedicated operators active near the system Positions Enable for a continued shift in activity to oil-directed SCOOP drilling 100 miles crude pipeline 51 miles condensate pipeline Total of ~2 million gross acres dedicated 1. Map as of Nov. 6, 2018; Dedicated Rigs are inclusive of all rigs dedicated to Enable; Completion of the announced Wildhorse plant has been deferred 7
8 Williston Basin System Expansion Crude oil and water gathering system expansion with XTO Energy in North Dakota s Dunn and McKenzie counties under long-term, fee-based agreements Enable plans to add up to 72,000 bpd of crude oil gathering design capacity, supported by over 90,000 gross acres of dedication, increasing total Williston Basin crude gathering capacity to up to approximately 130,000 bpd Enable expects to start gathering volumes associated with these system expansions in the first half of 2019, including volumes from drilled but uncompleted wells System Map 1 Williston Crude Gathered Volumes (MBbl/d) % miles crude gathering 160 miles water gathering Total of 0.3 million gross acres dedicated Q1-17 Q2-17 Q3-17 Q4-17 Q1-18 Q2-18 Q Map as of Nov. 6, 2018; Miles of pipe and dedicated acres as of Sept. 30, 2018
 export markets on the Gulf Coast System Map 1 Utilizes existing Enable Gas Transmission, LLC (EGT) transportation")
9 Gulf Run Pipeline Designed to move up to 2.75 Bcf/d of abundant U.S. natural gas supplies from two liquid hubs to growing liquefied natural gas (LNG) export markets on the Gulf Coast System Map 1 Utilizes existing Enable Gas Transmission, LLC (EGT) transportation infrastructure, including adding bi-directional capabilities to Line CP, to provide access to some of the most prolific natural gas producing regions in the U.S. Backed by a precedent agreement with a cornerstone shipper for 1.1 Bcf/d Received significant interest from prospective shippers during an open season that closed Oct. 26; currently in negotiations for binding commitments Project is expected to be placed into service in 2022 and is subject to a final investment decision by the cornerstone shipper for the LNG export facility to be served by this project and approval of the project by the FERC ~165 miles of largediameter pipeline 9 1. Map as of Nov. 6, 2018
10 Financial Results and Highlights In millions, except per-unit and ratio data Q3-18 Q3-17 YoY Growth Total Revenues $928 $705 32% Gross Margin 1 $412 $356 16% Net Income Attributable to Limited Partners $138 $113 22% Net income Attributable to Common and Subordinated Units 2 $129 $104 24% Net Cash provided by Operating Activities $233 $174 34% Adjusted EBITDA 1 $301 $250 20% Distributable Cash Flow 1 $220 $187 18% Distribution Coverage Ratio x 1.36x NA Cash Distribution per Common Unit $0.318 $ % Cash Distribution per Series A Preferred Unit Financial Results $0.625 $ % Financial Highlights Enable has delivered on its commitment to investment grade credit metrics and distribution coverage Total Debt to TTM Adjusted EBITDA of 3.66x as of Sept. 30, Significant liquidity under a $1.75 billion Revolving Credit Facility 5 Declared quarterly cash distributions of $0.318 per unit on all outstanding common units and $0.625 on all Series A Preferred Units For the 2018 outlook issued May 2, 2018, Enable anticipates performance at or above the upper end of the ranges for Adjusted EBITDA and DCF and at the upper end of the range for net income attributable to common units Gross margin, Adjusted EBITDA and distributable cash flow are non-gaap financial measures and are reconciled to the nearest GAAP financial measures in the appendix 2. All outstanding subordinated units were converted into common units on a one-for-one basis on Aug. 30, A non-gaap measure calculated as distributable cash flow divided by distributions related to common units 4. As of Sept. 30, 2018, total debt was $3.813 billion and Adj. EBITDA for the trailing twelve months (TTM) ended on Sept. 30, 2018, was $1,041 million; quarterly Adjusted EBITDA for this period is reconciled to the nearest GAAP financial measures in Enable s quarterly earnings press releases as furnished to the SEC 5. As of Sept. 30, 2018, there were no principal advances and $3 million in letters of credit outstanding under the Revolving Credit Facility; as of Sept. 30, 2018, there was $413 million in outstanding commercial paper which reduces borrowing capacity under the Revolving Credit Facility outlook performance update provided on Enable s Nov. 7, 2018, earnings call
11 2019 Outlook 2018 outlook provided Nov. 7, Operational Outlook 2019 Financial Outlook $ in millions Natural Gas Gathered Volumes (TBtu/d) Anadarko Arkoma Ark-La-Tex Natural Gas Processed Volumes (TBtu/d) Anadarko Arkoma Ark-La-Tex Crude Oil/Condensate Throughput Volumes (MBbl/d) Anadarko Williston Interstate Firm Contracted Capacity (Bcf/d) $ in millions 2019 Expansion Capital Outlook Gathering and Processing Segment $290 $370 Transportation and Storage Segment $35 $55 Total Expansion Capital $325 $425 Net Income Attributable to Common Units $435 $505 Interest Expense $190 $210 Adjusted EBITDA 3 $1,090 $1,180 Series A Preferred Unit Distributions 4 $36 Adjusted Interest Expense 3 $195 $215 Maintenance Capital $105 $125 Distributable Cash Flow 3 $740 $810 Distribution Coverage Ratio 1.30x 1.45x Total Debt / Adjusted EBITDA 3 +/- 4.0x 2019 Price Assumptions Natural Gas Henry Hub ($/MMBtu) $2.70 $3.00 NGLs Mont Belvieu, Texas ($/gal) 5 $0.70 $0.80 NGLs Conway, Kansas ($/gal) 5 $0.55 $0.65 Crude Oil WTI ($Bbl) $63.00 $ Includes volumes under third party processing arrangements 2. Crude Oil/Condensate throughput includes crude oil and condensate gathered and transported on Enable s crude oil and condensate gathering and transportation systems 3. Financial measures are non-gaap financial measures and are reconciled to the nearest GAAP financial measures in the appendix 4. In accordance with the Partnership Agreement, the Series A Preferred Unit distributions are deemed to have been paid out of available cash with respect to the quarter immediately preceding the quarter in which the distribution is made. 5. NGL composite based on assumed composition of 45%, 30%, 10%, 5% and 10% for ethane, propane, normal butane, isobutane and natural gasoline, respectively
12 Key Highlights Significant Scale & Diversity of Assets Fully integrated suite of assets with 7,800 miles of interstate pipelines 1, 2,200 miles of intrastate pipelines, 13,500 miles of gathering systems, 15 major processing plants with 2.6 Bcf/d of processing capacity and 8 storage facilities comprising 86.0 Bcf of storage capacity High degree of interconnectivity between assets and end markets and consumers Efficient Capital Deployment to Strategically Located Assets Prioritizing efficient capital deployment and cost discipline Assets are located in prominent natural gas and crude oil producing basins with a market-leading midstream position in the SCOOP and STACK plays Well-positioned to support the long-term supply/demand dynamics in the Mid-Continent, Gulf Coast and Southeast regions Long-term, Fee- Based Contracts with High Quality Customer Base Long-term relationships with large-cap producers and utilities, many of whom are investment grade Favorable contract structure with significant 84% 3 fee-based and demand-fee margin Strong Sponsorship, Financial Position and Liquidity Position CenterPoint and OGE have long, proven track records and share a common vision of long-term value creation Investment grade credit metrics with 3.66x Total Debt to Adjusted EBITDA 4 Significant available liquidity under $1.75 billion revolving credit facility Strong distribution coverage 5 of 1.60x for third quarter 2018 and 1.42 for the nine months ended Sept. 30, Note: Pipeline miles are approximate 1. Includes SESH, in which Enable owns a 50% interest 2. As of Sept. 30, 2018; available liquidity calculated as revolving credit facility borrowings of $1.75 billion less $3 million in letters of credit and $413 million of outstanding commercial paper 3. Contract structure for nine months ended Sept. 30, Calculated as Total Debt / TTM Adj. EBITDA; Enable s TTM Adj. EBITDA was $1,041 million for trailing twelve months (TTM) Sept. 30, Distribution coverage ratio is a non-gaap measure calculated as DCF divided by distributions related to common and subordinated units
13 Appendix Gathering and Processing Segment Overview

14 Gathering and Processing Segment Gathering and Processing Highlights Active Rigs on Enable s Footpoint 2 Strong rig activity continues across Enable s footprint During Q3-18, natural gas gathered volumes grew for the 11 th consecutive quarter Velocity acquisition adds crude oil and condensate gathering and transportation to Enable s market-leading Anadarko Basin midstream platform Substantial size and scale in prominent basins underpinned with favorable contract structures 15 major processing plants with ~2.6 Bcf/d of processing capacity located in the Anadarko, Arkoma and Ark-La-Tex Basins million gross acres dedicated under gathering agreements with a volume-weighted average remaining term of 5.5 years Gathering and Processing segment gross margin was 73% fee-based 1 Significant contracts with minimum volume commitment (MVC) features Enable Gathered and Processed Volumes Gathered Volumes (TBtu/d) Q1-17 Q2-17 Q3-17 Q4-17 Q1-18 Q2-18 Q3-18 Processed Volumes (TBtu/d) +40% +34% Q1-17 Q2-17 Q3-17 Q4-17 Q1-18 Q2-18 Q As of Dec. 31, Rigs per Drillinginfo as of Nov. 1, 2018; the STACK, SCOOP and Granite Wash Plays are geographical areas in the Anadarko Basin

15 Anadarko Basin Natural Gas G&P System Highlights Enable serves over 210 producers in the Anadarko Basin and has secured 5 million gross acres of dedication under long-term, fee-based contracts 1 The super-header system interconnects 10 of Enable s 11 natural gas processing plants in the basin and has ~1.75 Bcf/d of processing capacity 1 uniquely positioned to serve the prominent SCOOP and STACK plays, allowing Enable to: Optimize the economics of its natural gas processing Respond quickly to customer needs Efficiently phase in new production Project Wildcat, which was placed in service in June, provides an additional 400 MMcf/d 2 of third party processing capacity with access to the Texas intrastate natural gas markets Thirty-eight rigs are currently drilling wells that are dedicated to Enable in the Anadarko Basin 3 System Map 4 8,200 miles 758,000 horsepower of compression 11 processing plants Bcf/d processing capacity MBbl/d NGLs produced 5.0 mm gross acres of dedication Anadarko Gas Gathered Volumes (TBtu/d) +32% Q1-17 Q2-17 Q3-17 Q4-17 Q1-18 Q2-18 Q As of Dec. 31, As of Sept. 30, Per Drillinginfo as of Nov. 1, Map as of Oct. 22, 2018, and operational data as of Dec. 31, 2017; Completion of the announced Wildhorse plant has been deferred

16 Anadarko Basin Producer Activity Active Rigs Dedicated to Enable s Anadarko System 1 Anadarko Basin Map SCOOP STACK Granite Wash Highlights Rig activity shifting from the STACK to oiler parts of the SCOOP, which offers production profiles with higher percentages of crude Significant infrastructure positions Enable as one of the few midstream service providers able to capture this activity movement within the basin Rigs as reported in Enable s quarterly press releases 2. Map as of Nov. 6, 2018; Completion of the announced Wildhorse plant has been deferred
17 Ark-La-Tex Basin System Highlights Enable serves over 100 producers in the Ark- La-Tex Basin and provides gathering and processing services to both rich and lean gas production in the Haynesville, Cotton Valley and lower Bossier plays 1 Contracts are primarily fee-based contracts with significant support from minimum volume commitments (MVCs) 18% of G&P gross margin is attributable to Ark-La-Tex Basin natural gas gathering contracts with MVCs that have a volume commitment-weighted average remaining term of 2.1 years 1 Assets from the Align Midstream acquisition were connected to Enable s Waskom Plant Nov. 1, 2018, enabling further optimization of the basin s midstream platform Enable s Ark-La-Tex Basin assets are wellpositioned to provide supply for demand growth from LNG exports and electric utilities Six rigs are currently drilling wells that are dedicated to Enable in the Ark-La-Tex Basin 2 System Map 3 1,800 miles 160,200 horsepower of compression 3 processing plants Bcf/d processing capacity 14.5 MBbl/d fractionation capacity 8.95 MBbl/d NGLs produced 0.8 mm gross acres of dedication Ark-La-Tex Gathered Volumes (TBtu/d) % Q1-17 Q2-17 Q3-17 Q4-17 Q1-18 Q2-18 Q As of Dec. 31, Per Drillinginfo as of Nov. 1, Map as of Oct. 22, 2018, operational data as of Dec. 31, 2017
18 Arkoma Basin System Highlights Enable serves over 80 producers in the Arkoma Basin and provides gathering and processing services to both rich and lean gas production in the Woodford Shale play located in Oklahoma and the Fayetteville Shale play located in Arkansas 1 Contracts are primarily fee-based contracts with significant support from MVCs 7% of G&P gross margin is attributable to Arkoma Basin natural gas gathering contracts with MVCs that have a volume commitment-weighted average remaining term of 5.9 years 1 3,000 miles 133,500 horsepower of compression 1 processing plant Bcf/d processing capacity 4.79 MBbl/d NGLs produced 1.7 mm gross acres of dedication System Map As of Dec. 31, Map as of Oct. 22, 2018, operational data as of Dec. 31, 2017
19 Williston Basin System Highlights System Map 2 In Q3-18, achieved the highest quarterly crude oil gathered volumes since Enable s formation in May 2013 Fee-based contract structures, including some support from crude oil gathering contracts with minimum volume commitment features Recently announced crude oil and water gathering system expansion with XTO Energy under long-term, fee-based agreements will add up to 72,000 bpd of crude oil gathering design capacity, increasing total Williston Basin crude gathering capacity to up to approximately 130,000 bpd Williston Crude Gathered Volumes (MBbl/d) % miles crude gathering 160 miles water gathering Total of 0.3 million gross acres dedicated Q1-17 Q2-17 Q3-17 Q4-17 Q1-18 Q2-18 Q Expansion had first volume flows in the fourth quarter of Map as of Nov. 6, 2018; Miles of pipe and dedicated acres as of Sept. 30, 2018
20 Appendix Transportation and Storage Segment Overview
 Serves utilities, industrial end-users and producers, providing access to Mid-continent supply and other Northeastern, Mid-continent and Gulf")
21 Transportation and Storage Segment System Map and Highlights Transportation and Storage Gross Margin 1 EOIT 96% Derived from Fee-Based Contracts 88% Derived from Firm Contracts Fee-based 96% EGT 53% MRT 14% EOIT 21% EGT EGT (Enable Gas Transmission, LLC) Serves utilities, industrial end-users and producers, providing access to Mid-continent supply and other Northeastern, Mid-continent and Gulf Coast markets through interconnects MRT (Enable Mississippi River Transmission, LLC) EOIT (Enable Oklahoma Intrastate Transmission, LLC) Serves utilities and industrial end-users, providing access to Mid-continent supply and Northeastern supply through interconnects Serves utilities, industrial end-users and producers, including growing Anadarko Basin production 2 SESH (Southeast Supply Header, LLC) Primarily serves customers that generate electricity for the Florida power market and interconnects to pipelines serving major Southeast and Northeast markets 21 Note: Map as of Oct. 22, As of Dec. 31, 2017; excludes SESH which is reported as an equity method investment 2. 50/50 joint venture with Spectra Energy Partners, LLC
, gas producers and electric utilities ~70% of transportation capacity is under firm contracts with a volume-weighted average contract life of 3.")

22 Enable Gas Transmission (EGT) Pipeline Highlights 5,900-mile 1 interstate pipeline serving the Anadarko, Ark-La-Tex and Arkoma Basins EGT s primary customers include local distribution companies (LDCs), gas producers and electric utilities ~70% of transportation capacity is under firm contracts with a volume-weighted average contract life of 3.2 years 2 EGT is well-positioned to serve growing Oklahoma production and market demand The CaSE project, a 205,000 Dth/d natural gas transportation solution for growing Anadarko Basin production, was placed into full service on Oct. 1, 2018 EGT s interconnection at Enable s Perryville Hub provides the ability to move natural gas between 11 major interstate pipelines and supports the growing market demand in the Southeast and Gulf Coast regions 2 Pipeline Map 3 5,900 miles 6.5 Bcf/d capacity 30.5 Bcf storage capacity As of Sept. 30, As of Dec. 31, Map as of Oct. 22, 2018; operational data as of Dec. 31, 2017 except for miles of pipe which is as of Sept. 30, 2018

23 Mississippi River Transmission (MRT) Pipeline Highlights Pipeline Map 3 1,600-mile 1 interstate pipeline that offers shippers competitive rates and is interconnected to diverse supply points MRT s primary customers are utilities and industrial end users ~96% of transportation capacity is under firm contracts with a volume-weighted average contract life of 1.9 years 2 Contracted or extended over 510,000 Dth/d of capacity in Q2-18, including re-contracting with MRT s largest customer, Spire Inc., for one year at existing contract demand levels MRT continues to advance its rate case and participated in technical and settlement conferences with shippers in September Select Interconnects EGT Perryville Hub NGPL & Trunkline 1,600 miles 1.7 Bcf/d capacity 31.5 Bcf storage capacity Supply Basin/Region Anadarko, Fayetteville and Haynesville Barnett, Haynesville and Gulf Coast Marcellus/Utica, Mid-Con and Gulf Coast As of Sept. 30, As of Dec. 31, Map as of Oct. 22, 2018; operational data as of Dec. 31, 2017 except for miles of pipe which is as of Sept. 30, 2018
24 Enable Oklahoma Intrastate Transmission (EOIT) Pipeline Highlights Pipeline Map 2 Interconnects natural gas supply from the Anadarko and Arkoma Basins to Enable s EGT system and 12 thirdparty natural gas pipelines 1 Connected to 43 end-user customers, including 16 natural gas-fired electric generation facilities in Oklahoma 1 Major customers include Oklahoma Gas & Electric Company (OG&E), an affiliate of OGE Energy Corp., and Public Service Company of Oklahoma (PSO), an affiliate of American Electric Power Company, Inc. Project Muskogee, a 20-year, 228,000 Dth/d firm transportation service agreement with OG&E, expected to be in service by the end of 2018 Well-positioned to serve transportation needs for producers in the SCOOP, STACK, Mississippi Lime and Greater Granite Wash plays 2,200 miles 2.3 Bcf/d peak throughput 24.0 Bcf storage capacity As of Dec. 31, Map as of Oct. 22, 2018; operational data as of Dec. 31, 2017 except for miles of pipe which is as of Sept. 30, 2018
25 Southeast Supply Header (SESH) Pipeline Highlights Pipeline Map mile 1 interstate natural gas pipeline that runs from the Perryville Hub in northeastern Louisiana to southwestern Alabama 50% joint venture with Spectra Energy Partners, LP Well-positioned to serve the highgrowth demand markets of the Southeastern US, including electric utilities Twenty interconnects with third-party natural gas pipelines, providing a diversity of supply from Southeast and Northeast markets 2 ~99% of transportation capacity is under firm contracts with a volumeweighted average remaining contract life of 4.4 years 2 50% JV with Spectra Energy Partners, LP 290 miles 1.1 Bcf/d capacity As of Sept. 30, As of Dec. 31, Map as of Oct. 22, 2018; Operational data and miles of pipe as of Sept. 30, 2018
26 Appendix Appendix

27 Enable Ownership Structure 27 Note: Structure as of Sept. 30, 2018


 (Investment Grade) (Investment")
 (Investment Grade) 28 Note: Standard and")

28 Large, Diverse and High-Quality Customer Base Enable s revenues are strengthened by a diverse, high-quality customer base, including many investment-grade or affiliates of investment-grade companies Many of our customers rely on us for multiple midstream services across both G&P and T&S Loyal customer base through exemplary customer service and reliable project execution Top Customers (Investment Grade) (Investment Grade) (Investment Grade) (Investment Grade) (Investment Grade)* (Investment Grade) (Investment Grade)* (Investment Grade) (Investment Grade) (Investment Grade) (Investment Grade) 28 Note: Standard and Poor s, Moody s and Fitch credit ratings from Bloomberg as of Oct. 29, 2018 *Split rated
29 2018 Outlook 2018 outlook provided May 2, Operational Outlook 2018 Financial Outlook $ in millions Natural Gas Gathered Volumes (TBtu/d) Anadarko Arkoma Ark-La-Tex Natural Gas Processed Volumes (TBtu/d) Anadarko Arkoma Ark-La-Tex Crude Oil Gathered Volumes (MBbl/d) Interstate Firm Contracted Capacity (Bcf/d) Net Income Attributable to Common Units $375 $445 Interest Expense $145 $160 Adjusted EBITDA 1 $975 $1,050 Series A Preferred Unit Distributions 2 $36 Adjusted Interest Expense 1 $150 $165 Maintenance Capital $95 $125 Distributable Cash Flow 1 $675 $735 Distribution Coverage Ratio 1.20x 1.35x Total Debt / Adjusted EBITDA 1 +/- 4.0x $ in millions 2018 Expansion Capital Outlook Gathering and Processing $355 $465 Transportation and Storage $120 $160 Total Expansion Capital $475 $ Price Assumptions Natural Gas Henry Hub ($/MMBtu) $2.75 $3.05 NGLs Mont Belvieu, Texas ($/gal) 3 $0.58 $0.66 NGLs Conway, Kansas ($/gal) 3 $0.53 $0.61 Crude Oil WTI ($Bbl) $58.00 $ Financial measures are non-gaap financial measures and are reconciled to the nearest GAAP financial measures in this appendix 2. In accordance with the Partnership Agreement, the Series A Preferred Unit distributions are deemed to have been paid out of available cash with respect to the quarter immediately preceding the quarter in which the distribution is made. 3. NGL composite based on assumed composition of 45%, 30%, 10%, 5% and 10% for ethane, propane, normal butane, isobutane and natural gasoline, respectively
30 Derivative Activity and Price Sensitivities 2018 Derivative Activity Three Months Ended September 30 $ in millions Gain (Loss) on Derivative Activity ($24) ($7) Change in Fair Value of Derivatives ($16) ($6) Realized Gain (Loss) on Derivatives ($8) ($1) Price Sensitivities 1 Impact to Net Income (including impact of hedges) 2 % Change in Prices +10% and (10%) $ in millions Natural Gas and Ethane ($3) $3 $17 ($17) NGLs (excluding ethane) and Condensate ($9) $9 $12 ($13) Impact to Adjusted EBITDA (including impact of hedges) % Change in Prices +10% and (10%) $ in millions Natural Gas and Ethane $2 ($2) $13 ($13) NGLs (excluding ethane) and Condensate $1 ($1) $4 ($5) price sensitivities are for the three months ending Dec. 31, 2018; based on current prices and hedges as of Oct The impact of price sensitivities is the same for net income attributable to limited partners and net income attributable to common units
31 Gross Margin Profile and Hedging Summary 2019 Gross Margin Profile 1 Hedging Summary 2 ~91% feebased or hedged 6% 9% 43% Commodity Bal Natural Gas (NYMEX) Exposure Hedged (%) 78% 36% Average Hedge Price ($/MMBtu) $3.00 $ % Natural Gas Basis (PEPL / EGTE) Exposure Hedged (%) 77% 43% Demand Commodity-Based Hedged Volume Dependent Commodity-Based Unhedged Average Hedge Price ($/MMBtu) $(0.41) $(0.54) Crude 3 Exposure Hedged (%) 86% 74% Average Hedge Price ($/Bbl) $57.87 $59.45 Propane Exposure Hedged (%) 83% 62% Average Hedge Price ($/gal) $0.74 $0.75 Normal Butane Exposure Hedged (%) 64% 25% Average Hedge Price ($/gal) $0.89 $ Gross margin profile represents 2019 Forecast and is based on hedges as of Oct. 10, 2018, and Enable s Nov Expected Case prices 2. Table includes hedges and commodity exposures associated with equity volumes resulting from Enable's Gathering, Processing and Transportation businesses; percentage hedged includes hedges executed through Oct. 26, Enable hedges net condensate/natural gasoline exposure with crude; net exposure and the percentage hedged excludes the proportion of long condensate positions offset by short natural gasoline positions
32 Segment Results Gathering and Processing Q3-18 Q3-17 Anadarko Basin (TBtu/d) Gathered Volumes Processed Volumes Arkoma Basin (TBtu/d) Transportation and Storage Q3-18 Q3-17 Transported Volumes TBtu/d Interstate Firm Contracted Capacity Bcf/d Intrastate Average Deliveries TBtu/d Gathered Volumes Processed Volumes Ark-La-Tex Basin (TBtu/d) Gathered Volumes Processed Volumes Crude Oil Gathered Volumes (MBbl/d) Financial Results ($ in millions) Total Revenues 1 $778 $542 Gross Margin 2 $285 $234 Operation and Maintenance and General and Administrative Expenses $78 $70 Financial Results ($ in millions) Total Revenues 1 $281 $277 Gross Margin 2 $129 $123 Operation and Maintenance and General and Administrative Expenses $48 $45 Depreciation and Amortization $34 $34 Taxes other than Income Tax $6 $6 Operating Income $41 $38 Depreciation and Amortization $66 $56 Taxes other than Income Tax $9 $9 Operating Income $132 $ Excludes eliminations 2. Gross Margin is a non-gaap financial measure and is reconciled to the nearest GAAP financial measures in this Appendix

33 Condensed Consolidated Statements of Income All outstanding subordinated units converted into common units on a one-for-one basis on Aug. 30, 2017
34 Non-GAAP Reconciliations 34

35 Non-GAAP Reconciliations Continued 1. Other non-cash losses includes loss on sale of assets and write-downs of materials and supplies. 2. This amount represents the quarterly cash distributions on the Series A Preferred Units declared for the three and nine months ended Sept. 30, 2018 and In accordance with the Partnership Agreement, the Series A Preferred Unit distributions are deemed to have been paid out of available cash with respect to the quarter immediately preceding the quarter in which the distribution is made. 3. Distributions for phantom and performance units represent distribution equivalent rights paid in cash. Phantom unit distribution equivalent rights are paid during the vesting period and performance unit distribution equivalent rights are paid at vesting. 4. See below for a reconciliation of Adjusted interest expense to Interest expense. 5. Represents cash distributions declared for common and subordinated units outstanding as of each respective period. Amounts for 2018 reflect estimated cash distributions for common units outstanding for the quarter ended Sept. 30,


36 Non-GAAP Reconciliations Continued 1. Other non-cash items include amortization of debt expense, discount and premium on long-term debt and write-downs of materials and supplies. 36


37 Operating Data Includes volumes under third party processing arrangements 2. Excludes condensate 3. NGLs sold includes volumes of NGLs withdrawn from inventory or purchased for system balancing purposes
38 2018 Forward Looking Non-GAAP Reconciliation 2018 outlook provided May 2, Outlook (In millions) Reconciliation of Adjusted EBITDA and distributable cash flow to net income attributable to limited partners: Net income attributable to common units $375 - $445 Add: Series A Preferred Unit distributions 36 Net income attributable to limited partners $411 - $481 Add: Depreciation and amortization expense Interest expense, net of interest income Income tax expense (2) - 2 EBITDA $950 - $1,030 Add: Less: Distributions received from equity method affiliate in excess of equity earnings 5-15 Non-cash equity based compensation Change in fair value of derivatives 0-5 Adjusted EBITDA $975 - $1,050 Less: Series A Preferred Unit distributions (1) 36 Adjusted interest expense Maintenance capital expenditures Current income taxes 2-8 DCF $675 - $ In accordance with the Partnership Agreement, the Series A Preferred Unit distributions are deemed to have been paid out of available cash with respect to the quarter immediately preceding the quarter in which the distribution is made.
39 2018 Forward Looking Non-GAAP Reconciliation Continued 2018 outlook provided May 2, Outlook (In millions) Reconciliation of Adjusted interest expense to Interest expense: Interest expense, net of interest income $145 - $160 Amortization of premium on long-term debt 5-6 Capitalized interest on expansion capital 0-10 Amortization of debt expense and discount (0-10) Adjusted interest expense $150 - $165 *Enable is unable to present a quantitative reconciliation of forward looking Adjusted EBITDA to net cash provided by operating activities because certain information needed to make a reasonable forward-looking estimate of changes in working capital which may (provide) use cash during the calendar year 2018 cannot be reliably predicted and the estimate is often dependent on future events which may be uncertain or outside of Enable's control. This includes changes to accounts receivable, accounts payable and other changes in non-current assets and liabilities. 39

40 2019 Forward Looking Non-GAAP Reconciliation In accordance with the Partnership Agreement, the Series A Preferred Unit distributions are deemed to have been paid out of available cash with respect to the quarter immediately preceding the quarter in which the distribution is made.
 use cash during the calendar year 2019 cannot be reliably predicted")
41 2019 Forward Looking Non-GAAP Reconciliation Continued *Enable is unable to present a quantitative reconciliation of forward looking Adjusted EBITDA to net cash provided by operating activities because certain information needed to make a reasonable forward-looking estimate of changes in working capital which may (provide) use cash during the calendar year 2019 cannot be reliably predicted and the estimate is often dependent on future events which may be uncertain or outside of Enable's control. This includes changes to accounts receivable, accounts payable and other changes in non-current assets and liabilities. 41
Enable Midstream Partners, LP
 Enable Midstream Partners, LP Fourth Quarter 2016 Conference Call February 21, 2017 Forward-looking Statements This presentation and the oral statements made in connection herewith may contain forward-looking
Enable Midstream Partners, LP
 Enable Midstream Partners, LP First Quarter 2018 Conference Call May 2, 2018 Forward-looking Statements Some of the information in this presentation may contain forward-looking statements. Forward-looking
Enable Midstream Partners, LP
 Enable Midstream Partners, LP MLPA 2016 Investor Conference June 3, 2016 Forward-looking Statements This presentation and the oral statements made in connection herewith may contain forward-looking statements
Enable Midstream Partners, LP
 Enable Midstream Partners, LP MLPA 2017 Investor Conference Presentation Rod Sailor President & CEO June 1, 2017 Forward-Looking Statements This presentation and the oral statements made in connection
Enable Midstream Partners, LP
 Enable Midstream Partners, LP Second Quarter 2015 Conference Call August 5, 2015 Forward-looking Statements This presentation and the oral statements made in connection herewith may contain forward-looking
Enable Midstream Partners, LP
 Enable Midstream Partners, LP Second Quarter 2016 Conference Call August 3, 2016 Non-GAAP Financial Measures The Partnership has included the non-gaap financial measures gross margin, Adjusted EBITDA,
Enable Midstream Partners, LP
 Enable Midstream Partners, LP Fourth Quarter 2014 Conference Call February 18, 2015 Forward-looking Statements This presentation and the oral statements made in connection herewith may contain forward-looking
Enable Midstream Partners, LP
 Enable Midstream Partners, LP Third Quarter 2014 Conference Call November 4, 2014 Forward-looking Statements This presentation and the oral statements made in connection herewith may contain forward-looking
TULSA MLP CONFERENCE. Tulsa, OK November 15, 2016
 TULSA MLP CONFERENCE Tulsa, OK November 15, 2016 DEREK REINERS Senior Vice President, Chief Financial Officer and Treasurer Page 2 FORWARD-LOOKING STATEMENTS Statements contained in this presentation that
WELLS FARGO ENERGY SYMPOSIUM. New York Dec. 6, 2016
 WELLS FARGO ENERGY SYMPOSIUM New York Dec. 6, 2016 TERRY K. SPENCER President and Chief Executive Officer Page 2 FORWARD-LOOKING STATEMENTS Statements contained in this presentation that include company
FIXED INCOME INVESTOR UPDATE. July 2017
 FIXED INCOME INVESTOR UPDATE July 2017 FORWARD-LOOKING STATEMENTS Statements contained in this presentation that include company expectations or predictions should be considered forward-looking statements
Investing Today for Tomorrow s Energy Infrastructure
 Investing Today for Tomorrow s Energy Infrastructure Investor Introduction and Overview NYSE: CNP NYSE: OGE Forward Looking Statement This document does not constitute an offer to sell or a solicitation
Wells Fargo Securities 12 th Annual Energy Symposium
 Wells Fargo Securities 12 th Annual Energy Symposium December 2013 Forward-Looking Statements Under the Private Securities Litigation Act of 1995 This document may contain or incorporate by reference forward-looking
RBC Capital Markets MLP Conference
 RBC Capital Markets MLP Conference November 18, 2015 Strong. Innovative. Growing. 1 Forward-Looking Statements This presentation contains forward-looking statements within the meaning of the federal securities
UBS One-on-One MLP Conference
 UBS One-on-One MLP Conference January 13, 2015 Strong. Innovative. Growing. 1 Forward-Looking Statements This presentation contains forward-looking statements within the meaning of the federal securities
CITI MLP/MIDSTREAM INFRASTRUCTURE CONFERENCE. Las Vegas, NV Aug , 2016
 CITI MLP/MIDSTREAM INFRASTRUCTURE CONFERENCE Las Vegas, NV Aug. 17-18, 2016 FORWARD-LOOKING STATEMENTS Statements contained in this presentation that include company expectations or predictions should
W E L L S FA R G O E N E R G Y S Y M P O S I U M. N e w Y o r k D e c. 6-7
 W E L L S FA R G O E N E R G Y S Y M P O S I U M N e w Y o r k D e c. 6-7 T E R RY S P E N C E R P R E S I D E N T A N D C H I E F E X E C U T I V E O F F I C E R Mont Belvieu II fractionator Gulf Coast
Citi One-On-One MLP / Midstream Infrastructure Conference. August 20, 2014 Strong. Innovative. Growing.
 Citi One-On-One MLP / Midstream Infrastructure Conference August 20, 2014 Strong. Innovative. Growing. 1 Forward-Looking Statements This presentation contains forward-looking statements within the meaning
Investor Presentation. December 2016
 Investor Presentation December 2016 Forward-Looking Statements Under the Private Securities Litigation Act of 1995 This document may contain or incorporate by reference forward-looking statements as defined
Goldman Sachs Power, Utilities, MLP & Pipeline Conference. August 11, 2015 Strong. Innovative. Growing.
 Goldman Sachs Power, Utilities, MLP & Pipeline Conference August 11, 2015 Strong. Innovative. Growing. 1 Forward-Looking Statements This presentation contains forward-looking statements within the meaning
I N V E S TO R U P D AT E. N o v e m b e r 2017
 I N V E S TO R U P D AT E N o v e m b e r 2017 F O RWA R D - L O O K I N G S TAT E M E N T S Statements contained in this presentation that include company expectations or predictions should be considered
Investor Presentation. March 2-4, 2015 Strong. Innovative. Growing.
 Investor Presentation March 2-4, 2015 Strong. Innovative. Growing. 1 Forward-Looking Statements This presentation contains forward-looking statements within the meaning of the federal securities laws.
NAPTP Annual MLP Investor Conference NASDAQ: CPNO. May 12, 2010
 NAPTP Annual MLP Investor Conference NASDAQ: CPNO May 12, 2010 Disclaimer Statements made by representatives of Copano Energy, L.L.C. ( Copano ) during this presentation will include forward-looking statements,
Investor Relations Presentation
 Investor Relations Presentation EQT Midstream Partners-EQT GP Holdings June 2017 1 Cautionary Statements Disclosures in this presentation contain certain forward-looking statements. Statements that do
Investor Relations Presentation
 Investor Relations Presentation EQT Midstream Partners-EQT GP Holdings February 2018 1 Cautionary Statements Disclosures in this presentation contain certain forward-looking statements. Statements that
Morgan Keegan MLP Conference May 18 th, 2010
 Morgan Keegan MLP Conference May 18 th, 2010 1 Forward Looking Statements This presentation contains forward looking statements within the meaning of the federal securities laws. Forward looking statements
UBS MLP ONE-ON-ONE CONFERENCE. Park City, Utah Jan , 2016
 UBS MLP ONE-ON-ONE CONFERENCE Park City, Utah Jan. 12-13, 2016 FORWARD-LOOKING STATEMENTS Statements contained in this presentation that include company expectations or predictions should be considered
Credit Suisse MLP & Energy Logistics Conference
 Credit Suisse MLP & Energy Logistics Conference June 23, 2015 Strong. Innovative. Growing. 1 Forward-Looking Statements This presentation contains forward-looking statements within the meaning of the federal
UBS M I D S T R E A M AND M L P C O N F E R E N C E. P a r k C i t y, U t a h J a n. 9-10
 UBS M I D S T R E A M AND M L P C O N F E R E N C E P a r k C i t y, U t a h J a n. 9-10 F O RWA R D - L O O K I N G S TAT E M E N T S Statements contained in this presentation that include company expectations
West Coast Seminar. Max Myers Managing Director, Finance and Business Development December 10, West Coast Seminar 1
 Max Myers Managing Director, Finance and Business Development December 10, 2008 1 (A2, BBB+, AA-) Largest electric utility in Oklahoma Over 768,000 customers Rates 28% below the national average Partner
I N V E S T O R U P D AT E M A R C H
 I N V E S T O R U P D AT E M A R C H 2 0 1 8 F O RWA R D - L O O K I N G S TAT E M E N T S Statements contained in this presentation that include company expectations or predictions should be considered
Forward Looking Statements
 January 2010 1 Forward Looking Statements This presentation contains forward looking statements within the meaning of the federal securities laws. Forward looking statements are not guarantees of performance.
Investor Presentation. January 4, 2017
 Investor Presentation January 4, 2017 Forward-Looking Statements Cautionary Statement Regardng Forward-Looking Statements This presentation contains or incorporates by reference forward-looking statements
FOURTH-QUARTER AND FULL-YEAR 2015 EARNINGS. Feb. 22, 2016
 FOURTH-QUARTER AND FULL-YEAR 2015 EARNINGS Feb. 22, 2016 FORWARD-LOOKING STATEMENTS Statements contained in this presentation that include company expectations or predictions should be considered forward-looking
2012 Wells Fargo Securities Research & Economics 11 th Annual Pipeline, MLP and Energy. Symposium
 2012 Wells Fargo Securities Research & Economics 11 th Annual Pipeline, MLP and Energy Symposium December 4-5, 2012 Forward-Looking Statements Under the Private Securities Litigation Act of 1995 This document
Wachovia Securities Pipeline & MLP Symposium
 Wachovia Securities Pipeline & MLP Symposium New York City December 6, 2007 Page 1 John W. Gibson Chairman, President and Chief Executive Officer ONEOK Partners, L.P. Page 2 Forward-Looking Statementt
Second Quarter 2018 Update
 PEOPLE PROCESS TECHNOLOGY Second Quarter 2018 Update August 8, 2018 Earnings Call Forward-Looking Statements Under the Private Securities Litigation Act of 1995 This document may contain or incorporate
Targa Resources Corp. Fourth Quarter 2018 Earnings & 2019 Guidance Supplement February 20, 2019
 Targa Resources Corp. Fourth Quarter 2018 Earnings & 2019 Guidance Supplement February 20, 2019 Forward Looking Statements Certain statements in this presentation are "forward-looking statements" within
Wells Fargo 8th Annual Pipeline and MLP Symposium. December 8 th, 2009 Bill Davis, Chief Financial Officer
 Wells Fargo 8th Annual Pipeline and MLP Symposium December 8 th, 2009 Bill Davis, Chief Financial Officer 1 Forward Looking Statements This presentation contains forward looking statements within the meaning
RBC Capital Markets MLP Conference Dallas, TX
 RBC Capital Markets MLP Conference 2007 Dallas, TX November 15-17, 17, 2007 2 FORWARD-LOOKING STATEMENTS DISCLOSURE NYSE:BWP Statements made at this conference or in the materials distributed in conjunction
Third-Quarter 2017 Earnings Conference Call Presentation. October 26, 2017
 Third-Quarter 2017 Earnings Conference Call Presentation October 26, 2017 Forward Looking Statements This presentation contains forward-looking statements within the meaning of federal securities laws
Second-Quarter 2017 Earnings Conference Call Presentation. July 27, 2017
 Second-Quarter 2017 Earnings Conference Call Presentation July 27, 2017 Forward Looking Statements This presentation contains forward-looking statements within the meaning of federal securities laws regarding
Morgan Stanley MLP Bus Tour
 Morgan Stanley MLP Bus Tour January 26, 2016 Strong. Innovative. Growing. 1 Forward-Looking Statements This presentation contains forward-looking statements within the meaning of the federal securities
I N V E S T O R U P D AT E M A Y
 I N V E S T O R U P D AT E M A Y 2 0 1 8 F O RWA R D - L O O K I N G S TAT E M E N T S Statements contained in this presentation that include company expectations or predictions should be considered forward-looking
Investor Relations Presentation
 Investor Relations Presentation EQT Midstream Partners-EQT GP Holdings April 2018 1 Cautionary Statements Disclosures in this presentation contain certain forward-looking statements within the meaning
EQM & EQGP Investor Presentation
 EQM & EQGP Investor Presentation July 2015 Cautionary Statements Disclosures in this presentation contain certain forward-looking statements. Statements that do not relate strictly to historical or current
Investor Presentation December 2013
 Investor Presentation December 2013 CAUTIONARY STATEMENTS & NON-GAAP MEASURES This presentation includes forward-looking statements within the meaning of Section 27A of the Securities Act of 1933, as amended,
Spectra Energy Partners: Moving Ahead, Building Value. June 26-27, 2013 New York, New York
 Credit Suisse MLP and Energy Logistics Conference Spectra Energy Partners: Moving Ahead, Building Value June 26-27, 2013 New York, New York Safe Harbor Statement Some of the statements in this document
PTXP Update: Operations and Events
 Investor Presentation August 2016 Disclaimer Forward-Looking Statements This presentation includes forward-looking statements. Forward-looking statements give our current expectations, contain projections
EQM & EQGP Investor Presentation
 EQM & EQGP Investor Presentation October 2015 Cautionary Statements Disclosures in this presentation contain certain forward-looking statements. Statements that do not relate strictly to historical or
Targa Resources Corp. Announces Delaware Basin and Grand Prix Expansions March 2018
 Targa Resources Corp. Announces Delaware Basin and Grand Prix Expansions March 2018 Forward Looking Statements Certain statements in this presentation are "forward-looking statements" within the meaning
FIRST-QUARTER 2016 UPDATE. May 3, 2016
 FIRST-QUARTER 2016 UPDATE May 3, 2016 FORWARD-LOOKING STATEMENTS Statements contained in this presentation that include company expectations or predictions should be considered forward-looking statements
Gas/Electric Partnership Conference Gas Pipelines and Storage Investment Outlook January 31, 2018
 Gas/Electric Partnership Conference Gas Pipelines and Storage Investment Outlook January 31, 2018 Photo of Wilson Compressor Station, part of the Coastal Bend Header Project Gregg Philbrick Director, System
Focused on Energy Delivery, Positioned to Execute
 Focused on Energy Delivery, Positioned to Execute Introduction to CenterPoint Energy March 2018 For more information visit centerpointenergy.com Our 2016 Corporate Responsibility Report can be found at
2018 Update and 2019 Outlook
 PEOPLE PROCESS TECHNOLOGY 2018 Update and 2019 Outlook February 12, 2019 Earnings Call Forward-Looking Statements Under the Private Securities Litigation Reform Act of 1995 This document may contain or
I N V E S T O R U P D AT E. A u g u s t
 I N V E S T O R U P D AT E A u g u s t 2 0 1 8 F O RWA R D - L O O K I N G S TAT E M E N T S Statements contained in this presentation that include company expectations or predictions should be considered
Jefferies 2012 Global Energy Conference
 Jefferies 2012 Global Energy Conference November 29, 2012 NASDAQ: CPNO 1 Disclaimer Forward-Looking Statements This presentation includes forward-looking statements, as defined in the federal securities
Targa Resources Corp. Fourth Quarter 2017 Earnings & 2018 Guidance Supplement February 15, 2018
 Targa Resources Corp. Fourth Quarter 2017 Earnings & 2018 Guidance Supplement February 15, 2018 Forward Looking Statements Certain statements in this presentation are "forward-looking statements" within
Spectra Energy Partners
 Spectra Energy Partners First Quarter 2017 Supplemental Slides Investor Relations Roni Cappadonna 713-627-4778 Roni.Cappadonna@enbridge.com Legal Statements SAFE HARBOR STATEMENT / FORWARD-LOOKING INFORMATION
ENERGY TRANSFER EQUITY
 ENERGY TRANSFER EQUITY Credit Suisse MLP & Energy Logistics Conference June 10 th 2014 Jamie Welch Group CFO LEGAL DISCLAIMER This presentation relates to a meeting among members of management of Energy
Third Quarter 2018 Earnings Call
 PEOPLE PROCESS TECHNOLOGY Third Quarter 2018 Earnings Call November 6, 2018 Forward-Looking Statements Under the Private Securities Litigation Reform Act of 1995 This document may contain or incorporate
EQM & EQGP Investor Presentation
 EQM & EQGP Investor Presentation February 2016 Cautionary Statements Disclosures in this presentation contain certain forward-looking statements. Statements that do not relate strictly to historical or
U B S M I D S T R E A M A N D M L P C O N F E R E N C E J A N. 1 5,
 U B S M I D S T R E A M A N D M L P C O N F E R E N C E J A N. 1 5, 2 0 1 9 FORWARD-LOOKING STATEMENTS Statements contained in this presentation that include company expectations or predictions should
EPD NYSE 2ND QUARTER 2017 FACT SHEET DISTRIBUTION REINVESTMENT PLAN $ $1.68/Unit. Baa1/BBB+ ENTERPRISEPRODUCTS.COM
 FINANCIAL PERFORMANCE EPD UNIT PRICE 8/23/17 CURRENT ANNUALIZED DISTRIBUTION 26.02 1.68/Unit YIELD RANKING ON FORTUNE 500 6.5% 122 SENIOR UNSECURED DEBT RATINGS MOODY S/STANDARD & POOR S Baa1/BBB+ PARTNERSHIP
Regency Energy Partners LP NAPTP MLP Investor Conference May 22, 2013
 Regency Energy Partners LP NAPTP MLP Investor Conference May 22, 2013 Forward Looking Statements and Other Disclaimers This presentation includes forward looking statements. Forward looking statements
The Benefits of a Balanced Electric & Natural Gas Portfolio
 The Benefits of a Balanced Electric & Natural Gas Portfolio BMO Capital Markets 7th Annual Utilities & Pipelines Day New York City, NY November 29, 2011 NYSE: CNP www.centerpointenergy.com David M. McClanahan
EQM & EQGP Investor Presentation
 EQM & EQGP Investor Presentation January 2016 Cautionary Statements Disclosures in this presentation contain certain forward-looking statements. Statements that do not relate strictly to historical or
Chesapeake Midstream Partners Springridge Acquisition December 2010
 Chesapeake Midstream Partners Springridge Acquisition December 2010 NYSE: CHKM www.chkm.com Best in Class MLP Gets Better! Best in Class Midstream Business Model Differentiated Growth Platform Haynesville
W E L L S FA R G O E N E R G Y S Y M P O S I U M D E C E M B E R
 W E L L S FA R G O E N E R G Y S Y M P O S I U M D E C E M B E R 2 0 1 8 T E R RY S P E N C E R P R E S I D E N T A N D C H I E F E X E C U T I V E O F F I C E R FORWARD-LOOKING STATEMENTS Statements contained
Spectra Energy Partners
 Spectra Energy Partners Fourth Quarter 2017 Supplemental Slides Investor Relations Roni Cappadonna 713-627-4778 Roni.Cappadonna@enbridge.com Legal Statements SAFE HARBOR STATEMENT / FORWARD-LOOKING INFORMATION
Utica Midstream Summit MarkWest Update. April 4, 2018
 Utica Midstream Summit MarkWest Update April 4, 2018 Forward Looking Statements This presentation contains forward-looking statements within the meaning of federal securities laws regarding MPLX LP ( MPLX
ENERGY TRANSFER EQUITY, L.P.
 ENERGY TRANSFER EQUITY L.P. Credit Suisse Conference June 23 2015 Jamie Welch Group CFO DISCLAIMER This presentation relates to a presentation the management of Energy Transfer Equity L.P. (ETE) will give
Credit Suisse MLP and Energy Logistics Conference. June 26-27, 2013
 Credit Suisse MLP and Energy Logistics Conference June 26-27, 2013 Legal Disclaimer This presentation relates to meetings among members of management of Energy Transfer Partners, L.P. (ETP), Energy Transfer
INVESTOR UPDATE. May 2017
 INVESTOR UPDATE May 2017 FORWARD-LOOKING STATEMENTS This presentation contains certain "forward-looking statements" within the meaning of federal securities laws and covered by the safe harbor protections.
NAPTP 2013 MLP Investor Conference Stamford, Connecticut. May 22 May 23, 2013
 NAPTP 2013 MLP Investor Conference Stamford, Connecticut May 22 May 23, 2013 Legal Disclaimer This presentation relates to meetings among members of management of Energy Transfer Partners, L.P. (ETP),
Second Quarter 2016 Earnings Conference Call Presentation July 28, 2016
 Second Quarter 2016 Earnings Conference Call Presentation July 28, 2016 Forward Looking Statements This presentation contains forward-looking statements within the meaning of federal securities laws regarding
J E F F E R I E S G L O B A L E N E R G Y C O N F E R E N C E N O V E M B E R 2018
 J E F F E R I E S G L O B A L E N E R G Y C O N F E R E N C E N O V E M B E R 2018 FORWARD-LOOKING STATEMENTS Statements contained in this presentation that include company expectations or predictions
Spectra Energy Partners
 Spectra Energy Partners Second Quarter 2017 Supplemental Slides Investor Relations Roni Cappadonna 713-627-4778 Roni.Cappadonna@enbridge.com Legal Statements SAFE HARBOR STATEMENT / FORWARD-LOOKING INFORMATION
F O U R T H - Q U A R T E R A N D F U L L - YEAR R E S U LT S F E B. 2 5,
 F O U R T H - Q U A R T E R A N D F U L L - YEAR 2 0 1 8 R E S U LT S F E B. 2 5, 2 0 1 9 FORWARD-LOOKING STATEMENTS Statements contained in this presentation that include company expectations or predictions
IPAA Oil & Gas Investment Symposium Presentation April 13, :35 p.m.
 IPAA Oil & Gas Investment Symposium Presentation April 13, 2011 1:35 p.m. Overview of Operations Tulsa based company founded in 1963 with long history of operations in the Mid-Continent Ticker: UNT / NYSE
Investor Presentation. Third Quarter 2015
 Investor Presentation Third Quarter 2015 Forward-looking Information Certain matters contained in this presentation include "forward-looking statements" within the meaning of Section 27A of the Securities
C I T I M I D S T R E A M I N F R A S T R U C T U R E C O N F E R E N C E. L a s V e g a s A u g ,
 C I T I M I D S T R E A M I N F R A S T R U C T U R E C O N F E R E N C E L a s V e g a s A u g. 1 5-1 6, 2 0 1 8 F O RWA R D - L O O K I N G S TAT E M E N T S Statements contained in this presentation
Forward Looking Statements
 RBC Capital Markets MLP Conference November 16, 2006 Forward Looking Statements NASDAQ: RGNC This presentation may contain statements about future events and Regency Energy Partners LP s ( Regency, the
Investor Presentation. February 2019
 Investor Presentation February 2019 Cautionary Statement Disclosures in this presentation contain certain forward-looking statements within the meaning of Section 21E of the Securities Exchange Act of
ONEOK, Inc. (Exact name of registrant as specified in its charter)
") UNITED STATES SECURITIES AND EXCHANGE COMMISSION Washington, D.C. 20549 FORM 8-K CURRENT REPORT PURSUANT TO SECTION 13 OR 15(d) OF THE SECURITIES EXCHANGE ACT OF 1934 (Date of report) January 23, 2018
UNITED STATES SECURITIES AND EXCHANGE COMMISSION Washington, D.C. 20549 FORM 8-K CURRENT REPORT PURSUANT TO SECTION 13 OR 15(d) OF THE SECURITIES EXCHANGE ACT OF 1934 (Date of report) January 23, 2018
Wells Fargo Pipeline, MLP & Energy Symposium
 Wells Fargo Pipeline, MLP & Energy Symposium Barry E. Davis President & Chief Executive Officer December 11, 2013 RIGHT PLATFORM. RIGHT OPPORTUNITIES. RIGHT PEOPLE. 1 Forward-Looking Statements & Non-GAAP
Midcoast Energy Partners, L.P. Investment Community Presentation. March 2014
 Midcoast Energy Partners, L.P. Investment Community Presentation March 2014 Forward Looking Statement This presentation includes forward-looking statements, which are statements that frequently use words
Energy for You. 2 nd Quarter 2017 Earnings Call. August 3, 2017
 Energy for You 2 nd Quarter Earnings Call August 3, Cautionary Statement This presentation and the oral statements made in connection herewith contain statements concerning our expectations, beliefs, plans,
INVESTOR PRESENTATION MAY 2018
 INVESTOR PRESENTATION MAY 2018 Safe Harbor Disclosure Statement Statements made during the course of this presentation that are not historical facts are forward-looking statements within the meaning of
INVESTOR PRESENTATION JANUARY 2018
 INVESTOR PRESENTATION JANUARY 2018 Safe Harbor Disclosure Statement Statements made during the course of this presentation that are not historical facts are forward-looking statements within the meaning
Investor Presentation
 PEOPLE PROCESS TECHNOLOGY Investor Presentation December 2018 Forward-Looking Statements Under the Private Securities Litigation Reform Act of 1995 This document may contain or incorporate by reference
PTXP Investment Highlights
 Disclaimer Forward-Looking Statements This presentation includes forward-looking statements. Forward-looking statements give our current expectations, contain projections of results of operations or of
EQT REPORTS THIRD QUARTER 2014 EARNINGS Operational Results Continue to Improve GP Achieves Maximum Distribution Threshold
 EQT REPORTS THIRD QUARTER 2014 EARNINGS Operational Results Continue to Improve GP Achieves Maximum Distribution Threshold PITTSBURGH, PA (October 23, 2014) -- EQT Corporation (NYSE: EQT) today announced
F I R S T- Q U A R T E R R E S U LT S. M a y 1,
 F I R S T- Q U A R T E R 2 0 1 8 R E S U LT S M a y 1, 2 0 1 8 F O RWA R D - L O O K I N G S TAT E M E N T S Statements contained in this presentation that include company expectations or predictions should
Antero Resources Reports Fourth Quarter and Full Year 2016 Financial and Operational Results
 Antero Resources Reports Fourth Quarter and Full Year 2016 Financial and Operational Results Denver, Colorado, February 28, 2017 Antero Resources Corporation (NYSE: AR) ( Antero or the Company ) today
FOR IMMEDIATE RELEASE PLEASE CONTACT: Paul F. Blanchard Jr Website: Dec. 12, 2017
 FOR IMMEDIATE RELEASE PLEASE CONTACT: Paul F. Blanchard Jr. 405.948.1560 Website: www.panhandleoilandgas.com Dec. 12, 2017 PANHANDLE OIL AND GAS INC. REPORTS FOURTH QUARTER AND FISCAL 2017 RESULTS AND
Partnership Profile. June 2017
 Partnership Profile June 2017 Forward-Looking Information and Non-GAAP Measures This presentation may contain forward-looking statements within the meaning of securities laws. Forward-looking statements
CHESAPEAKE MIDSTREAM PARTNERS, L.P. REPORTS FINANCIAL RESULTS FOR THE 2012 FIRST QUARTER
 News Release FOR IMMEDIATE RELEASE MAY 8, 2012 REPORTS FINANCIAL RESULTS FOR THE 2012 FIRST QUARTER Partnership Reports 2012 First Quarter Net Income of $52 Million, Adjusted Ebitda of $118 Million and
Investor Presentation August 2015
 Investor Presentation August 2015 Disclaimer Forward-Looking Statements This presentation includes forward-looking statements. Forward-looking statements give our current expectations, contain projections
Fourth-Quarter 2017 Earnings Conference Call Presentation. February 1, 2018
 Fourth-Quarter 2017 Earnings Conference Call Presentation February 1, 2018 Forward Looking Statements This presentation contains forward-looking statements within the meaning of federal securities laws