INTERIM RESULTS FOR THE SIX MONTHS ENDED 31 AUGUST 2016
|
|
|
- Sabina Greer
- 5 years ago
- Views:
Transcription


1 INTERIM RESULTS FOR THE SIX MONTHS ENDED 31 AUGUST
2 AGENDA OVERVIEW AND HIGHLIGHTS FINANCIAL RESULTS STRATEGIC UPDATE + DEVELOPMENT AND TRADING PORTFOLIO + INVESTMENT PORTFOLIO + SPECIALIST PLATFORMS SUMMARY APPENDICES + APPENDIX 1: OVERVIEW + APPENDIX 2: FINANCIALS + APPENDIX 3: PORTFOLIO STATS + APPENDIX 4: ECONOMIC CHARTS 2
3 OVERVIEW AND HIGHLIGHTS 3
4 HY2017 HIGHLIGHTS ENCOURAGING PROGRESS MADE DESPITE CHALLENGING ENVIRONMENT Development and trading guidance reassessed m of development and trading gains in H1 (H1 guidance 8m) with 11m secured in H2; 22.5m in the year to date + EPRA NAV at 272p after payment of supplemental dividend; development and trading portfolio reported at cost (will mark to market from end of FY2017) + Investment portfolio value of 180.1m (initial yield maintained at c7%) disposals of 17.0m, valuation decline of 7.9m (including share of JVs) + Overheads: targeting a contribution of 2m in FY2018 through a reduction in recurring overhead and from net management fees from specialist platforms + Interim dividend maintained at 2.4p per share PROGRESS ON STRATEGIC INITIATIVES Major regeneration project wins in core regions + Focus on fewer, larger mixed-use regeneration projects: 8 Albert Embankment, Cockpit Yard, Westminster Industrial Estate (London City Region) and Mayfield (Manchester) + Good visibility on trading profits in next few months + Investment portfolio impacted by EU referendum; conditions improved in recent weeks despite ongoing economic and political uncertainty + Repositioning investment portfolio to align to Group s focus on regeneration + Creating specialist platforms for growth and efficiency 4
5 FINANCIAL RESULTS 5
6 HY2017 PERFORMANCE HY2017 HY 2016 FY2016 Development and trading gains 11.5m 12.5m 51.1m EPRA Net Asset Value (NAV) (2) 340.8m (1) 342.7m 363.5m Basic NAV 340.5m (1) 342.9m 363.3m EPRA NAV per share 272p (1) 274p 291p Basic NAV per share 272p (1) 274p 291p (Loss)/Profit before tax ( 11.7m) 1.4m 25.8m EPRA (loss)/earnings per share (1.8p) 0.4p 17.1p Basic (loss)/earnings per share (9.9p) 0.4p 17.1p Dividend per share (in respect of period reported) 2.4p 2.4p 5.9p Supplemental dividend per share declared p Net debt 128.0m 203.3m 161.4m Gearing 37.6% 59.2% 44.4% (1) After payment of supplemental dividend ( 10.0 million/8p per share) declared for FY2016 and paid in June (2) The development portfolio is reported at the lower of cost and net realisable value at the end of August; a full EPRA NAV will be reported at the end of the financial year to value the development and trading assets at fair value. 6
7 Pence per share MOVEMENT IN EPRA NAV THROUGH THE PERIOD NOTE: Development and trading assets not revalued, held at lower of book cost or net realisable value Valuation reduced by 4.6% on a like for like basis EPRA NAV Feb 2016 Final dividend FY2016 Supplemental dividend FY2016 Adjusted EPRA NAV Investment portfolio contribution Property Development revaluations & trading contribution Operating costs Net interest costs Taxation Other EPRA NAV Aug
8 ANTICIPATED GAINS TO FY2019 Full year guidance reassessed to a range (to allow for impact of uncertain market trading conditions) m m 3-5 year target + 50m plus pa + 12% post-tax total return* FY 2014 FY 2015 FY 2016 FY 2017 FY 2018 FY 2019 Realised gains (H1) Realised gains (H2) Expected gains Revised guidance (October 2016) Previous guidance (April 2016) *Total returns: the growth in our basic net asset value including dividends 8
9 OUTLOOK FOR FY2017: DEVELOPMENT AND TRADING GAINS Project name Previous (1) FY17 Forecast (2) FY17 Realised H1/17 12 Hammersmith Grove 10m Dublin: The Vertium Building 4-5m 4-5m Other 7m 5-6m 3m 2-3m Maidstone 4m 2-4m 2-4m Forecast (2) H2/17 Profit trigger Letting: 90% of office space, impacted by EU referendum (FY2018) Ashford (Powergen site) 3m 4m 4m Site disposal completed Entire building under offer (Oct-16) triggering profit payment entitlement Percy Place (sold); Beacon & Nutgrove (sold); Robswall (sell remaining units); Pembroke Road (sale of consented site) Exchange of contracts (Phase 1); secure planning and sell Phase 2 (BTR) The Old Vinyl Factory 3m Birmingham International Park 2m 8m 8m Norwich 2m Secure planning and sell consented residential site; funding and letting of Record Store building (FY2018) Planning secured, contracts exchanged, completion subject to JR only (Nov-16) Sale of consented site marketing commenced, impacted by EU referendum (FY2018) Woking 2m 2-6m 2m 0-4m Secure planning and sell Other (8 projects) 9m 8m 2.5m 5.5m Guidance 42m 35-40m 11.5m m (1) Previous guidance (April 2016) (2) Revised guidance (October 2016) 9
10 DEBT FINANCE HY2017 m FY2016 m Gross debt Cash (49.3) (51.8) Net debt Gearing 37.6% 44.4% Share of net debt in joint ventures Net debt including joint ventures Gearing including joint ventures 50.5% 56.4% Analysis of gross debt (excluding JVs) Fixed rate 41.7% 35.1% Capped / SWAP 37.8% 30.1% Floating rate 20.5% 34.8% Weighted average interest rate 5.0% 4.9% Weighted average maturity 4.8 years 4.5 years 10
11 m DEBT MATURITY PROFILE * Feb-17 Feb-18 Feb-19 Feb-20 Feb-21 Feb-22 Feb-23 Feb-24 Feb-25 Feb-26 Corporate Drawn - Investment Drawn - Development 10 0 *Terms of refinance agreed ** On Balance Sheet 11
12 IMPROVING BUSINESS EFFICIENCY Overhead Analysis Core recurring overhead (1) LTIP charge Close down historic tax structuring HY2017 m Efficiency Gains Reduction in recurring overhead (1) Platform management fees Offsetting costs Net management fees (2) FY2018 m 1.9 (0.9) (1) Targeting a 5% reduction in FY2018 (2) Across specialist platforms + Reduction in recurring overhead (from FY2018) + Additional revenue net management fees from specialist platforms and major schemes 12
13 FINANCIAL HIGHLIGHTS H1 gains ahead of expectation with good progress and clear visibility on H2 pipeline Anticipated gains from secured pipeline of m to FY2019; target over 50m of development and trading gains per annum, with a 12% post-tax annual return (within 3 5 years) Business efficiencies of 2m in FY2018 through overhead reduction and net management fees from specialist platforms Strong balance sheet and focus on capital efficiency 13
14 STRATEGIC UPDATE 14
15 ON TRACK WITH STRATEGIC INITIATIVES FEWER, LARGER PROJECTS To drive better returns + 4 major projects signed with a GDV of over 1.5bn potential to realise U+I profits in excess of 90m from FY Mayfield; 8 Albert Embankment, Cockpit Yard, Westminster Industrial Estate + Increasing profit per project over 5 year period REPOSITIONING INVESTMENT PORTFOLIO Align to core regeneration theme + Early progress to build a regeneration focussed portfolio targeting 10% net IRR + 17m of assets sold during the year plus a further c m of identified disposals in the short to medium-term SPECIALIST PLATFORMS To improve returns, efficiency and delivery options for our projects + Re-evaluating opportunities to create off-balance sheet Build to Rent platform + JV signed to secure income producing assets in London City Region + Options to leverage expertise in office in core markets 15
16 U+I BUSINESS MODEL PIPELINE PLANNING Main Value Driver CONSTRUCTION PRACTICAL COMPLETION TRADING RETAIL / LEISURE BUILD TO RENT RETAINED ASSETS PPP DEVELOPMENT BUILD TO SELL OFFICE WAREHOUSE STUDENT COMMUNITY ASSETS DISPOSED ASSETS LAND DISPOSAL 16
17 DEVELOPMENT AND TRADING PORTFOLIO 17
18 DEVELOPMENT PIPELINE: MAJOR PPP PROJECTS Scheme Region Acqn Date GDV Max U+I Equity Profit Range Timeframe Planning Application Scheme details Mayfield Quarter Manchester Sept m 20m 40-60m FY Mid 2017 PPP mixed-use regeneration project (24 acres); 1,300 residential units; 800k sqft offices; hotel & retail; U+I to act as DM, funding soft costs. 8 Albert Embankment London City Region August m 10m 25-35m FY Mid 2017 PPP mixed-use regeneration project (2.5 acres); 265 residential units, hotel, 70k sqft office, fire station & museum, retail. Profit shared with ultimate long-term funding partner. Cockpit Yard, Holborn London City Region October m 4m 10-12m FY2022 End 2017 PPP mixed-use regeneration project; 100 residential apartments; new library and arts facility in Holborn area. Morden Wharf, Greenwich Westminster Industrial Estate, Charlton* Preston Barracks, Brighton Circus Street, Brighton Lichfield Town Centre London City Region London City Region London City Region London City Region Midlands March 2012 October 2016 July 2014 April 2008 July m 13m 15-20m FY Mid 2018 Mixed-use regeneration project (19 acre); c1,200-1,500 residential units plus c300k sqft other uses; U+I has a Leasehold interest; Development Agreement with the Freeholder. 175m 8m 10-13m FY2021 End 2017 Mixed-use regeneration project (5.4 acre); Partnership with Royal London, JV with Galliard Homes; 400 residential apartments and associated creative floor space. 150m 8m 10-12m FY Mid 2017 Mixed-use regeneration project (5 acres); JV with University of Brighton; 400 residential units, 50k sqft offices, 500 student beds and ancillary retail. 120m 10m 8-10m FY Secured PPP mixed-use regeneration project (2.2 acres) in Brighton City centre; 142 residential units, 30,000 sqft of Office space, 450 student bed accommodation, 10,000sqft of ancillary retail space and community assets. 80m 7m 4-5m FY2019 Secured PPP mixed-use regeneration project (2.8 acres); local Authority partnership to provide a new town centre in Lichfield; retail, leisure, residential, car park. 2.5bn 80m m * This is a private-private partnership very similar to PPP due to the structure of the scheme 18
19 DEVELOPMENT PIPELINE: PRINCIPAL TRADING SCHEMES Scheme Region Acqn Date GDV Max U+I Equity Profit Range Timeframe Planning Application Scheme details 12 Hammersmith Grove London City Region Nov m m FY2018 Secured 170k sqft NIA offices with ancillary restaurant adjacent to Hammersmith tube; Forward funded with Aberdeen; profit share based on waterfall calculation with rent and yield variable; balancing payment trigger is PC+2yrs or 90% let on office NIA. Blackhorse Road London City Region Aug m 10m 7-10m FY March acre site with potential for 345 homes and commercial space; U+I act as DM; fixed land price post planning with added value shared 50/50. Victoria Way Ashford, Kent London City Region Nov m 1m 3-4m FY2018 July 2016 U+I exchanged contracts with HCA to acquire 2 sites opposite Ashford International Station; proposed development will consist of an 18,000 sqft Aldi, Curious Brew Brewery, 120 bed hotel, 216 apartments and ancillary retail/workshop uses; exit by land disposals. Maidstone, Kent London City Region Kensington Church Street London City Region Dec 2015 March m 6m 4m FY2017 October acres site comprising 2 phases; Phase 1 consent for 192 residential units; Phase 2 will comprise 310 units, including 220 PRS units; exit by land disposals. 300m 8m 5-10m FY March 2017 Planning targeted on appeal; 46 resi units, 40k sqft offices, 30k sqft retail. 569m 25m 27-40m 19
20 OUR VISION IS TO CREATE LONG-LASTING SOCIAL AND ECONOMIC CHANGE FOR THE COMMUNITIES IN WHICH WE BUILD AND SUSTAINABLE VALUE FOR OUR SHAREHOLDERS 20


21 DEVELOPMENT PIPELINE: MAJOR PPP PROJECTS MAYFIELD, MANCHESTER 8 ALBERT EMBANKMENT MORDEN WHARF CIRCUS STREET, BRIGHTON LICHFIELD WESTMINSTER INDUSTRIAL ESTATE COCKPIT YARD PRESTON BARRACKS, BRIGHTON 21
 + 850m urban regeneration with the")
 + Competitive")

 + Planning")
22 NEW PROJECTS: MAYFIELD MANCHESTER (appointed September 2016) + 850m urban regeneration with the Mayfield Partnership (Manchester City Council, Transport for Greater Manchester & LCR) + Competitive bid process; + 5m initial equity investment rising to 20m + Develop a mixed-use community on 24-acre site adjacent to Piccadilly Station (1,300 homes and hotel with office, leisure and retail space) + Planning submissions: Q


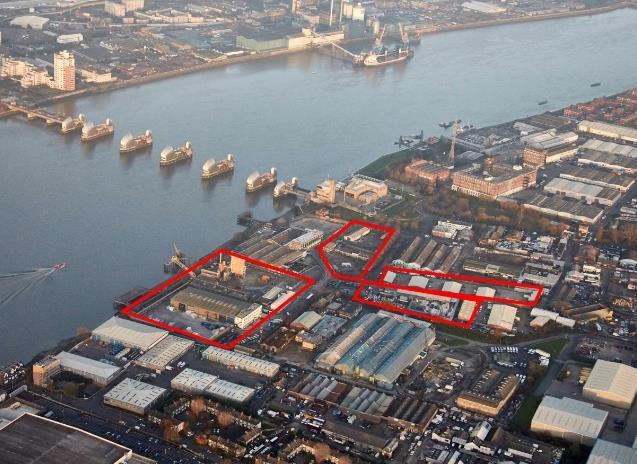
23 NEW PROJECTS: LONDON CITY REGION (appointed March - October 2016) 8 ALBERT EMBANKMENT WESTMINSTER INDUSTRIAL ESTATE, CHARLTON COCKPIT YARD, HOLBORN 23

24 TWO AND A HALF YEARS IN, WE HAVE SOME REAL MOMENTUM AND A PIPELINE OF OPPORTUNITY 24
25 INVESTMENT PORTFOLIO 25
26 INVESTMENT PORTFOLIO: OVERVIEW EXISTING PORTFOLIO 21 ASSETS 191m* OPTIMISE ASSETS: SWANLEY & KILLINGWORTH DISPOSE 14 ASSETS FUTURE PORTFOLIO Regeneration INITIAL ASSETS: CHARLTON RIVERSIDE, DEPTFORD, HARWELL, SIDCUP, WOOD GREEN 2-4 years to transition *Valuation as at 31 August 2016 (includes JV stakes) 26

 Retail centre anchored by Waitrose Key tenants: Argos; Café Nero; New Look;")
 Nailsea Key tenants: Boots; Costa Coffee; HSBC; JD Wetherspoon; Poundland; WHSmith Valuation: 25m - 35m Valuation change: Running yield: 6.")


27 INVESTMENT PORTFOLIO: TOP FIVE ASSETS Project name* Overview Key statistics* The Furlong Shopping Centre, Ringwood The Killingworth Centre, Newcastle Borough Parade, Chippenham Kingsland Shopping Centre, Thatcham 85,000 sqft retail centre anchored by Waitrose Key tenants: AGA; Crew Clothing; Fat Face; Gerry Weber; Holland & Barrett; Jaeger; Jones Bootmaker; Joules; Hobbs; Phase Eight; Paperchase; Waterstones Retail centre anchored by Morrisons (not owned) Key tenants: Matalan; 28 further retail units (including Wilkinsons, Poundworld, Card Factory, McDonalds, Specsavers, Betfred) Retail centre anchored by Waitrose Key tenants: Argos; Café Nero; New Look; Patisserie Valerie; Waterstones Retail centre anchored by Waitrose Key tenants: Costa Coffee; Lloyds Pharmacy Crown Glass Shopping Centre, Retail centre anchored by Waitrose (not owned) Nailsea Key tenants: Boots; Costa Coffee; HSBC; JD Wetherspoon; Poundland; WHSmith Valuation: 25m - 35m Valuation change: Running yield: 6.1% WAULT: 5.3 years ERV growth: 0.5% Top Zone A rent: 75 Valuation: 15m - 25m Valuation change: Running yield: 8.1% WAULT: 2.4 years ERV growth: 3.1% Top Zone A rent: 35 Valuation: 15m - 25m Valuation change: Running yield: 7.6% WAULT: 4.5 years ERV growth: 2.4% Top Zone A rent: 53 Valuation: 15m - 25m Valuation change: Running yield: 5.6% WAULT: 10.6 years ERV growth: 0% Top Zone A rent: 40 Valuation: 5m - 15m Valuation change: Running yield: 7.7% WAULT: 5.6 years ERV growth: 2.6% Top Zone A rent: 42 *Valuation change movement from end February to end August 2016 (includes capital expenditure): (over 2% increase/decrease) (under 2% increase/decrease) *ERV growth (August 2015/August 2016) 27


28 INVESTMENT PORTFOLIO: OPTIMISE KILLINGWORTH CENTRE + Potential to optimise retail space: by splitting the existing Matalan unit + Successfully agreed lease re-structures with tenants to improve rental tone + Secured planning consent to develop two new units in the car park; under construction SWANLEY SHOPPING CENTRE + Planning permission submitted to develop residential units with retail and restaurant space on excess car park area + Tenant mix enhanced with food and beverage offering improved + Residential areas refurbished with full occupancy maintained throughout 28


29 INVESTMENT PORTFOLIO: REGENERATION CHARLTON RIVERSIDE HARWELL CAMPUS THE DEPTFORD PROJECT WOOD GREEN SIDCUP 29
30 SPECIALIST PLATFORMS 30
31 U+I BUSINESS MODEL PIPELINE PLANNING Main Value Driver CONSTRUCTION PRACTICAL COMPLETION TRADING RETAIL / LEISURE BUILD TO RENT RETAINED ASSETS PPP DEVELOPMENT BUILD TO SELL OFFICE WAREHOUSE STUDENT COMMUNITY ASSETS DISPOSED ASSETS LAND DISPOSAL SECURED SPECIALIST PLATFORMS POTENTIAL SPECIALIST PLATFORMS 31
32 SUMMARY 32
33 SUMMARY U+I POSITIONED AS A LEADING REGENERATION DEVELOPER Regeneration expertise endorsed by selection as development partner at Cockpit Yard, 8 Albert Embankment and Mayfield (PPP) and Westminster Industrial Estate CONTINUED FOCUS ON STRATEGIC INITIATIVES Focus on fewer, larger mixed-use regeneration projects Repositioning investment portfolio to align to Group s focus on regeneration Creating specialist platforms for growth and efficiency DELIVER SUSTAINABLE SHAREHOLDER RETURNS New projects add over 1.5bn GDV to development and trading pipeline and 90m of potential profit beyond FY2020 (in line with stated equity metrics) to deliver target post-tax return of 12% over 3-5 years 33
34 APPENDICES 34
35 APPENDIX 1: BUSINESS STRATEGY 35
36 PRINCIPAL RISKS 36
37 DIVIDEND POLICY: GREATER VISIBILITY ON SHAREHOLDER RETURNS DEVELOPMENT + TRADING GAINS NET FINANCE COST OVERHEAD SHORTFALL CASH PROFIT ORDINARY DIVIDENDS CORPORATION TAX Ordinary dividend: Fixed + recurring NET FREE CASH FLOW Supplemental dividend: Paid from net free cash flow proportion intended to be broadly similar to the proportion paid in April 2015 (48%)/June 2016 (46%) REINVEST REDUCE DEBT RETURN CAPITAL Announced alongside FY results 37
38 A BALANCED APPROACH TO DEVELOPMENT AND TRADING MIXED-USE REGENERATION GAINS TRADING SHORT-TERM PROFIT FLOWS (1-3 YEARS) PLANNING GAIN IS OFTEN KEY ARBITRAGE/MISPRICING OPPORTUNITIES IRR OF >30% EQUITY MULTIPLE 1.5X PPP PROJECTS AND LARGER MIXED-USE PROJECTS (2-5 YEARS) MAX 20m EQUITY IN ANY ONE PROJECT BUT HIGH UPSIDE POTENTIAL IN ALL PLANNING GAIN IS KEY VALUE DRIVER PROJECTS DE-RISKED VIA FORWARD FUNDING OR PRE-SALES EQUITY MULTIPLE 2.0X 5.0X PROJECT DELIVERY TIME 05/13 FINANCIAL RESULTS 14/30 STRATEGIC UPDATE 32/33 SUMMARY 34/55 APPENDICES 38
39 APPENDIX 2: FINANCIALS 39
40 CONTRIBUTION TO NAV GROWTH m Net assets attributable to shareholders at 28 Feb Cash-related in the year m Non cash-related in the year m Contribution from investment property Property revaluations (includes share of JVs) (7.9) (7.9) Contribution from development and trading portfolio Operating costs (10.7) (10.7) Net interest costs (4.2) (4.2) Swap revaluations Foreign currency movements (0.5) (0.5) Other 0.4 (0.4) Taxation (0.6) (0.6) Dividends (14.4) (14.4) Sub-total (22.8) (15.1) (7.7) Net assets attributable to shareholders at 31 Aug
41 m NET DEBT, NET ASSETS AND GEARING % % % % % % 50 10% 0 Aug 12 Feb 13 Aug 13 Feb 14 Aug 14 Feb-15 Aug-15 Feb-16 Aug-16 Net assets (LHS) Net debt (LHS) Gearing excl JVs (RHS) 0% *on Balance Sheet 41
42 APPENDIX 3: PORTFOLIO STATS 42
43 DEVELOPMENT PIPELINE: MAJOR PPP PROJECTS Scheme Region Acqn Date GDV Resi rate (per sqft) Office rent (per sqft) Retail Rate (per sqft) Mayfield Quarter Manchester Sept m Albert Embankment London City Region August m Cockpit Yard Holborn London City Region October m 1500 N/A 50 Morden Wharf Greenwich Westminster Industrial Estate, Charlton* London City Region March m London City Region October m N/A Preston Barracks, Brighton London City Region July m Circus Street, Brighton London City Region April m Lichfield Town Centre Midlands July m 300 N/A bn * This is a private-private partnership very similar to PPP due to the structure of the scheme 43
44 DEVELOPMENT PIPELINE: PRINCIPAL TRADING SCHEMES Scheme Region Acqn Date GDV Resi rate (per sqft) Office rent (per sqft) Retail Rate (per sqft) 12 Hammersmith Grove London City Region Nov m N/A Blackhorse Road London City Region Aug m 600 N/A N/A Victoria Way Ashford, Kent London City Region Nov m 300 N/A N/A Maidstone, Kent London City Region Dec m 340 N/A N/A Kensington Church Street* London City Region March m 569m * Commercially sensitive due to planning process 44
45 INVESTMENT PORTFOLIO: ANALYSIS Type % of Portfolio (by value) Contracted Rent % of Portfolio Let ERV Vacant ERV WAULT Future Portfolio 14.6% 1.84m 12.4% 1.39m 0.54m 4.44 Optimise 17.4% 2.83m 19.07% 2.87m 0.15m 4.54 Disposal 68.0% 10.19m 68.58% 10.52m 0.29m % 14.86m 100% 14.77m 0.97m
46 APPENDIX 4: ECONOMIC CHARTS 46
47 AFFORDABILITY OF HOUSING IN LONDON Source: Capital Economics 47
48 AFFORDABILITY OF HOUSING IN LONDON Source: Capital Economics 48
49 AFFORDABILITY OF HOUSING IN LONDON Source: Capital Economics 49
50 DISCLAIMER This presentation has been prepared by U and I Group PLC (the Company ). No representation or warranty (express or implied) of any nature is given nor is any responsibility or liability of any kind accepted by the Company or any of its directors, officers, employees, advisers, representatives or other agents, with respect to the truthfulness, completeness or accuracy of any information, projection, representation or warranty (expressed or implied), omissions, errors or misstatements in this presentation, or any other written or oral statement provided. In particular, no responsibility or liability is or will be accepted and no representation or warranty is or is authorised to be given as to the accuracy, reliability or reasonableness of any forward-looking statement, including any future projections, management targets, estimates or assessments of future prospects contained in this presentation, or of any assumption or estimate on the basis of which they have been given (which may be subject to significant business, economic or competitive uncertainties and contingencies beyond the control of the management of the Company). Any such forward-looking statements have not been independently audited, examined or otherwise reviewed or verified. All views expressed in this presentation are based on financial, economic, market and other conditions prevailing as of the date of this presentation. The Company does not undertake to provide access to any additional information or to update any future projections, management targets, estimates or assessment of future prospects or any other forward-looking statements to reflect events that occur or circumstances that arise after the date of this presentation, or to correct any inaccuracies in this presentation which may become apparent. Past performance is not indicative of future results and forward-looking statements are not guarantees of future performance. This presentation is for information purposes only and does not constitute an offering document or an offer of transferable securities to the public in the UK. This presentation is not intended to provide the basis for any credit or other evaluation of any securities of the Company and should not be considered as a recommendation that any investor should subscribe for, dispose of or purchase any such securities or enter into any other transaction with the Company or any other person. The merits and suitability of any investment action in relation to securities should be considered carefully and involve, among other things, an assessment of the legal, tax, accounting, regulatory, financial, credit and other related aspects of such securities. This presentation is being communicated or distributed within the UK only to persons to whom it may lawfully be communicated, and has not been approved for the purposes of section 21 of the Financial Services and Markets Act It may not be reproduced (in whole or in part), distributed or transmitted to any other person without the prior written consent of the Company. In particular this presentation is not intended for distribution to, or use by, any person or entity in any jurisdiction or country where such distribution or use would be contrary to local law or regulation. Any recipients of this presentation outside the UK should inform themselves of and observe any applicable legal or regulatory requirements in their jurisdiction, and are treated as having represented that they are able to receive this presentation without contravention of any law or regulation in the jurisdiction in which they reside or conduct business. 50
18/10/17. For the period ended 31 August 2017
 18/10/17 For the period ended 31 August 2017 01 Overview and highlights 02 Financial results 03 Strategic update Development and trading portfolio Investment portfolio Specialist platforms 04 Summary 05
PRELIMINARY RESULTS FOR THE YEAR ENDED FOR THE YEAR ENDED
 PRELIMINARY RESULTS FOR THE YEAR ENDED 29.02.16 FOR THE YEAR ENDED 29.02.16 1 OVERVIEW AND HIGHLIGHTS 2 OUR VISION IS TO CREATE LONG-LASTING SOCIAL AND ECONOMIC CHANGE FOR THE COMMUNITIES IN WHICH WE BUILD
U and I Group PLC ( U+I or the Company or the Group ) INTERIM RESULTS FOR THE SIX MONTHS ENDED 31 AUGUST 2016
 INTERIM RESULTS FOR THE SIX MONTHS ENDED 31 AUGUST 2016") 19 October 2016 U and I Group PLC ( U+I or the Company or the Group ) INTERIM RESULTS FOR THE SIX MONTHS ENDED 31 AUGUST 2016 Encouraging progress despite challenging environment Financial performance
19 October 2016 U and I Group PLC ( U+I or the Company or the Group ) INTERIM RESULTS FOR THE SIX MONTHS ENDED 31 AUGUST 2016 Encouraging progress despite challenging environment Financial performance
IMAGE TO BE CHANGED. Development Securities PLC
 IMAGE TO BE CHANGED Development Securities PLC Interim results for six months ended 31st August 2014 Contents Slide number Overview and highlights 3 6 Financial results 7 15 Operating review - Overview
Development Securities PLC. Interim results for six months ended 31st August 2012 Further results of strategy secured
 Development Securities PLC Interim results for six months ended 31st August 2012 Further results of strategy secured Contents Slide number Overview and highlights 3-9 Interim results 10-14 Portfolio and
U and I Group PLC ( U+I or the Company or the Group ) Results for the year ended 28 February 2017
 Results for the year ended 28 February 2017") U and I Group PLC ( U+I or the Company or the Group ) Results for the year ended 28 February 2017 U+I reports full year development and trading gains in line with guidance with a strong outlook for the
U and I Group PLC ( U+I or the Company or the Group ) Results for the year ended 28 February 2017 U+I reports full year development and trading gains in line with guidance with a strong outlook for the
U and I Group PLC ( U+I or the Company or the Group ) PRELIMINARY RESULTS FOR THE YEAR ENDED 29th FEBRUARY 2016
 PRELIMINARY RESULTS FOR THE YEAR ENDED 29th FEBRUARY 2016") U and I Group PLC ( U+I or the Company or the Group ) PRELIMINARY RESULTS FOR THE YEAR ENDED 29th FEBRUARY U+I today reports a second consecutive year of record development and trading gains driving further
U and I Group PLC ( U+I or the Company or the Group ) PRELIMINARY RESULTS FOR THE YEAR ENDED 29th FEBRUARY U+I today reports a second consecutive year of record development and trading gains driving further
Empiric Student Property plc INTERIM REPORT AUGUST Stuart Beevor Acting Chairman
 plc INTERIM REPORT AUGUST 2018 Stuart Beevor Acting Chairman The Frontage, Nottingham 162 Beds Forward Funded Completed 2017 The Chapel, Manchester 87 Beds Forward Funded Completed 2017 Princess Road,
TOWN CENTRE SECURITIES PLC RESULTS PRESENTATION YEAR ENDED 30 JUNE 2014 EDWARD ZIFF CHAIRMAN AND CHIEF EXECUTIVE
 TOWN CENTRE SECURITIES PLC RESULTS PRESENTATION YEAR ENDED 30 JUNE 2014 EDWARD ZIFF CHAIRMAN AND CHIEF EXECUTIVE DUNCAN SYERS FINANCE DIRECTOR RICHARD LEWIS PROPERTY DIRECTOR 17 SEPTEMBER 2014 A STRONG
U and I Group PLC. Interim Results for the six months ended 31 August 2018
 The information contained within this announcement is deemed by the Company to constitute inside information as stipulated under the Market Abuse Regulations (EU) No. 596/2014 ("MAR"). Upon the publication
Development Securities PLC
 Development Securities PLC Preliminary results for year ended 28th February 2014 Contents Slide number Overview and highlights 3 9 Financial results 10 14 Outlook 15 18 Operating review - Overview - Legacy
10 Hammersmith Grove, West London. Investor day
 10 Hammersmith Grove, West London Investor day 4 July 2013 INTRODUCTION MICHAEL MARX Agenda Presentations and tour Breakfast Introduction Michael Marx 10 Hammersmith Grove tour Julian Barwick Timings 8.15
Results Presentation. Half Year Results ending 28 February 2013
 Results Presentation Half Year Results ending 28 February 2013 Contents Page Introduction 03 06 Financial Results 07 11 Operations 12 19 Asset Management 20 26 Looking Forward 27 28 Additional Information
Full year results to 31 December Morgan Sindall Group plc 22 February 2018
 Full year results to 31 December 2017 Morgan Sindall Group plc 22 February 2018 Agenda Introduction John Morgan FY 2017 Financial and Operational Review Steve Crummett Investments John Morgan 2 Summary
AUGUST HALF YEAR RESULTS to 30 June 2018
 AUGUST 2018 HALF YEAR RESULTS to 30 June 2018 Agenda Introduction John Morgan HY 2018 Financial & Operational Review Steve Crummett Strategy & Prospects John Morgan Highlights Strategic and operational
2017 Half Year Results Presentation 10 August 2017
 2017 Half Year Results Presentation 10 August 2017 Lawrence Hutchings Chief Executive 2 C&R a robust platform for growth Strong asset base and secure income Assets with dominant town-centre locations Focus
Chief Executive - Neil Sinclair Finance Director - Stephen Silvester Executive Director - Richard Starr INVESTOR PRESENTATION FEBRUARY 2017
 Chief Executive - Neil Sinclair Finance Director - Stephen Silvester Executive Director - Richard Starr INVESTOR PRESENTATION FEBRUARY 2017 CONTENTS Introduction & Highlights NEIL SINCLAIR, CHIEF EXECUTIVE
Half Year Results Presentation. 6 months ended 31 December 2015
 Half Year Results Presentation 6 months ended 31 December 2015 Agenda Introduction - Edward Ziff, Chairman and CEO Strategy overview Active first half Good financial performance Financial Performance &
Sigma Capital Group plc Half Yearly Report 2013
 Sigma Capital Group plc Half Yearly Report 2013 City Wharf, Aberdeen Edinburgh, head office Winchburgh Development Higher Broughton Regeneration Manchester office Liverpool Regeneration North Solihull
19 th September 2006 DEVELOPMENT SECURITIES PLC INTERIM RESULTS FOR THE SIX MONTHS ENDING JUNE 2006
 19 th September 2006 DEVELOPMENT SECURITIES PLC INTERIM RESULTS FOR THE SIX MONTHS ENDING JUNE 2006 Development Securities PLC, the leading property development and investment company, today announces
Full year results to 31 December Morgan Sindall Group plc Constructing & Regenerating
 Full year results to 3 December 203 Morgan Sindall Group plc Constructing & Regenerating 8 February 204 Disclaimer Certain statements included or incorporated by reference in this presentation are forward-looking
Final Results Presentation. Year ended 30 June 2016
 Final Results Presentation Year ended 30 June 2016 Overview of TCS 378m portfolio 56 years dividend track record 51% founder Ziff family shareholding 57% of debt is long term fixed interest 2007 converted
Half year results to 30 June Morgan Sindall Group plc 2 August 2016
 Half year results to 30 June 2016 Morgan Sindall Group plc 2 August 2016 Agenda Introduction John Morgan HY 2016 Financial and Operational Review Steve Crummett Outlook and Prospects 2017 & beyond John
Full year results to 30 June 2015 Greg Fitzgerald, Executive Chairman, and Graham Prothero, Finance Director
 Full year results to 30 June 2015 Greg Fitzgerald, Executive Chairman, and Graham Prothero, Finance Director FY15 Results Analyst Presentation, 16 September 2015 1 Agenda Overview Strategy to 2018 Financial
10 Hammersmith Grove, West London. Development Securities PLC
 10 Hammersmith Grove, West London Development Securities PLC Preliminary results for year ended 28th February 2013 Contents Slide number Overview and highlights 3 8 Financial results 9 13 Operating review
2015 INTERIM RESULTS
 2015 INTERIM RESULTS Welcome Robert Noel Chief Executive 2 London development improving portfolio and income quality 3 Retail transformation under themes of dominance, experience and convenience Trinity
PALACE CAPITAL PLC (PCA.L)
") COMPANY NOTE Acquisition 07 August 2017 CORPORATE Current price 370.0p Sector Code Listing SHARE PERFORMANCE (K) 300 250 200 150 100 50 Real Estate Investment 0 Jul-15 Oct-15 Jan-16 Apr-16 Jul-16 Oct-16
COMPANY NOTE Acquisition 07 August 2017 CORPORATE Current price 370.0p Sector Code Listing SHARE PERFORMANCE (K) 300 250 200 150 100 50 Real Estate Investment 0 Jul-15 Oct-15 Jan-16 Apr-16 Jul-16 Oct-16
GPE Trading Update strong operational performance and proposed return of 306 million to shareholders following profitable property sales
 Press Release 25 January 2018 GPE Trading Update strong operational performance and proposed return of 306 million to shareholders following profitable property sales Great Portland Estates plc ( GPE )
Regeneration. Driving Future Growth. Morgan Sindall Group plc 6 June 2017
 Regeneration Driving Future Growth Morgan Sindall Group plc 6 June 2017 Today s schedule 1245 Regeneration and the Morgan Sindall Group John Morgan 1300 Overview of Partnership Housing Jonathan Goring
2017 HALF YEAR 25 JULY 2017
 2017 HALF YEAR RESULTS 25 JULY 2017 Strong financial results and robust balance sheet Driving performance through operational excellence and disciplined capital allocation High quality pipeline of growth
Circle Property. Lifting estimates again. Revaluation gains and strong rent growth. Upside potential from refurbished assets
 Circle Property Lifting estimates again Review of trading update Real estate Circle will publish results for the year to 31 March 2018 in June but recent updates show further strong momentum. Ongoing asset
Interim results for the half year ended 31 March 2014
 Interim results for the half year ended 31 March 2014 16 May 2014 03.06.14.v3 Disclaimer This presentation contains certain forward-looking statements. Any statement in this presentation that is not a
Development Securities PLC ( Development Securities or the Company or the Group ) PRELIMINARY RESULTS FOR THE YEAR ENDED 28th FEBRUARY 2015
 PRELIMINARY RESULTS FOR THE YEAR ENDED 28th FEBRUARY 2015") Development Securities PLC ( Development Securities or the Company or the Group ) PRELIMINARY RESULTS FOR THE YEAR ENDED 28th FEBRUARY 2015 Development Securities today reports a step change in performance
Development Securities PLC ( Development Securities or the Company or the Group ) PRELIMINARY RESULTS FOR THE YEAR ENDED 28th FEBRUARY 2015 Development Securities today reports a step change in performance
Drum Income Plus REIT plc ("Drum" or the "Company") Company Up-date and Dividend Declaration
 Company Up-date and Dividend Declaration") NOT FOR RELEASE, PUBLICATION OR DISTRIBUTION, DIRECTLY OR INDIRECTLY, IN OR INTO THE UNITED STATES, CANADA, AUSTRALIA, JAPAN, SOUTH AFRICA OR ANY JURISDICTION IN WHICH THE SAME WOULD BE UNLAWFUL OR RESTRICTED
NOT FOR RELEASE, PUBLICATION OR DISTRIBUTION, DIRECTLY OR INDIRECTLY, IN OR INTO THE UNITED STATES, CANADA, AUSTRALIA, JAPAN, SOUTH AFRICA OR ANY JURISDICTION IN WHICH THE SAME WOULD BE UNLAWFUL OR RESTRICTED
ITEM 5(c) MKDP Quarterly Update June Executive Summary
 MKDP Quarterly Update June Executive Summary") ITEM 5(c) MKDP Quarterly Update June 2018 Executive Summary Milton Keynes Development Partnership (MKDP) is an independent legal entity wholly owned and accountable to Milton Keynes Council. The publication
ITEM 5(c) MKDP Quarterly Update June 2018 Executive Summary Milton Keynes Development Partnership (MKDP) is an independent legal entity wholly owned and accountable to Milton Keynes Council. The publication
FULL YEAR RESULTS TO 30 JUNE 2017
 FULL YEAR RESULTS TO 30 JUNE 2017 13 September 2017 Peter Truscott, Chief Executive Graham Prothero, Finance Director Longbridge Retirement Village, Birmingham Peter Truscott CHIEF EXECUTIVE AGENDA Highlights
Results presentation for the year ended 30 June 2011
 Full Year 2011 1 Results presentation for the year ended 30 June 2011 14 September 2011 Full Year 2011 2 Image to come Bob Lawson Chairman 14 September 2011 The Glade, Leeds Full Year 2011 3 Mark Clare
LondonMetric Property Investor Presentation September
 LondonMetric Property Investor Presentation September 2018 www.londonmetric.com Agenda Overview & Strategy Property Finance & Outlook Appendices 2 Overview Our sector calls and income focus are delivering
Interest Rates, Cap Rates, and the Real Estate Cycle
 Interest Rates, Cap Rates, and the Real Estate Cycle Stephen Hester, Chief Executive We are real estate investors and create value by actively managing, financing and developing prime commercial property
https://rnssubmit.com/cws/fckeditor/editor/fckeditor.html?instancename=ctl00_pag...
 Page 1 of 7 Real Estate Investors PLC ("REI" or the "Company" or the "Group") Half Year Results for the six months to 30 June 2013 Real Estate Investors PLC (AIM:RLE) the West Midlands based property group,
Registered office: Old Bank Chambers, La Grande Rue, St Martin s, Guernsey, GY4 6RT
 19 August 2016 ALPHA REAL TRUST LIMITED ( ART OR THE COMPANY ) TRADING UPDATE AND DIVIDEND ANNOUNCEMENT ART today publishes its trading update for the period ended 30 June 2016 and the period up until
12 Months to 31 March 2014
 Schroder UK Property Fund UK Property Market Review Performance Over the last year the recovery in the UK economy has gathered pace. Employment continues to strengthen, business surveys remain positive
MAKING PLACES. Annual Report 2015
 MAKING PLACES Annual Report 2015 IN THIS REPORT 2015 FINANCIAL HIGHLIGHTS Strategic Report 01 Who we are 02 Our year at a glance 04 How we make a place 12 Chairman s Statement 14 Market overview 16 Chief
MAS REAL ESTATE INC. Results presentation. New Waverley, Edinburgh, UK. Year ended 30 June 2016
 MAS REAL ESTATE INC Results presentation Year ended 30 June 2016 New Waverley, Edinburgh, UK 1 TABLE OF CONTENTS i. Company profile ii. iii. iv. Strategic update Recurring and potential EPS Highlights
Distribution Number 16
 Distribution Number 16 Legal & General UK Property Fund (a sub-fund of Legal & General Investment Funds ICVC) Interim Manager s Short Report for the period ended 28 May 2018 Investment Objective and Policy
Agenda. Timon Drakesmith, Finance Director. Rights Issue Financial Results & Valuation. Robert Noel, Property Director
 Unlocking potential Agenda Key Messages Market Opportunity Rights Issue Financial Results & Valuation Toby Courtauld Chief Executive Timon Drakesmith, Finance Director Investment Management Occupational
 Page 1 of 8 19 September 2012 Real Estate Investors PLC ("REI" or the "Company" or the "Group") Half Year Results for the six months to 30 June 2012 - Maiden Dividend Real Estate Investors PLC (AIM:RLE)
An introduction. May 2018
 An introduction May 2018 Our strategy To grow our specialist asset management activities 2 Invest selectively Grow assets under management Manage portfolios to maximise value Generate strong shareholder
Development Securities PLC ( Development Securities or the Company or the Group ) PRELIMINARY RESULTS FOR THE YEAR ENDED 28th FEBRUARY 2014
 PRELIMINARY RESULTS FOR THE YEAR ENDED 28th FEBRUARY 2014") Development Securities PLC ( Development Securities or the Company or the Group ) PRELIMINARY RESULTS FOR THE YEAR ENDED 28th FEBRUARY 2014 Development Securities PLC, today reports a strong increase in
Development Securities PLC ( Development Securities or the Company or the Group ) PRELIMINARY RESULTS FOR THE YEAR ENDED 28th FEBRUARY 2014 Development Securities PLC, today reports a strong increase in
Financial results presentation For six months ended 30 September 2018
 Financial results presentation For six months ended 30 September 2018 Transition Plan to 31 March 2020 Targets Progress Sales and Purchases MLI to comprise 65% of total portfolio Manage timings of acquisitions
Impact Healthcare REIT plc. Annual results for the period to 31 December 2017
 Impact Healthcare REIT plc Annual results for the period to 31 December 2017 Agenda and presentation team Agenda Company overview The portfolio Key financials Enhancing the portfolio Our market Opportunities
Safestay plc ( Safestay or the Company or the Group ) Interim Results For the Six Months to 30 June 2017
 Interim Results For the Six Months to 30 June 2017") The information contained within this announcement is deemed by the Group to constitute inside information as stipulated under the Market Abuse Regulations (EU) No. 596/2014 ("MAR") STRICTLY EMBARGOED
The information contained within this announcement is deemed by the Group to constitute inside information as stipulated under the Market Abuse Regulations (EU) No. 596/2014 ("MAR") STRICTLY EMBARGOED
2018 HALF YEAR 26 JULY 2018
 2018 HALF YEAR RESULTS 26 JULY 2018 H1 2018 Another period of delivery Strong financial results and capital structure Disciplined capital allocation improving portfolio scale and quality, reducing risk
Full year results presentation. 22 May 2018
 Full year results presentation 22 May 2018 Operational highlights Fundraising and capital deployment at record levels 2 Total AUM up 20% to 28.7bn, with 7.8bn of new money raised Fundraising driven by
Bank and Bondholder presentation
 Bank and Bondholder presentation 19 September 2013 0 Geopost, Enfield Agenda Welcome and strategic overview (David Sleath, CEO) Operational and financial performance (Justin Read, Group Finance Director)
Investor presentation. May 2009
 Investor presentation May 2009 1 Agenda Background Fundraising 3i s business and competitive strengths Key financials and valuations Pro forma balance sheet Summary 2 Background Analysis of 3i Strategically
Hansteen. Full Year Results to 31 December Tilburg, Netherlands
 Hansteen Full Year Results to 31 December 2016 Tilburg, Netherlands Contents Introduction Hansteen 2016 results Sale announcement Sale of German and Dutch Portfolio 2016 Annual Results 2016 Property Performance
Drum Income Plus REIT plc ("Drum" or the "Company") Unaudited Net Asset Value as at 31 December 2017
 Unaudited Net Asset Value as at 31 December 2017") 18 January 2018 Drum Income Plus REIT plc ("Drum" or the "Company") Unaudited Net Asset Value as at 31 December 2017 Drum Income Plus REIT plc (LSE: DRIP) announces its unaudited net asset value ("NAV")
18 January 2018 Drum Income Plus REIT plc ("Drum" or the "Company") Unaudited Net Asset Value as at 31 December 2017 Drum Income Plus REIT plc (LSE: DRIP) announces its unaudited net asset value ("NAV")
S IMMO Q3 results November 2018
 S IMMO Q3 results 2018 27 November 2018 We develop value Highlights Q3 2018 Gross profit exceeds previous year s level Earnings per share increased to EUR 1.20 Record FFO I (almost +30% compared to previous
2009 Half-Year Results. 3 August 2009
 2009 Half-Year Results 3 August 2009 John Nelson, Chairman 2 Agenda Introduction John Richards Financial Results Simon Melliss France Christophe Clamageran UK David Atkins Summary and Conclusion John Richards
LONDONMETRIC PROPERTY PLC ( LondonMetric or the Group or the Company ) THIRD QUARTER 2015 INTERIM MANAGEMENT STATEMENT
 THIRD QUARTER 2015 INTERIM MANAGEMENT STATEMENT") 26 January 2015 LONDONMETRIC PROPERTY PLC ( LondonMetric or the Group or the Company ) THIRD QUARTER 2015 INTERIM MANAGEMENT STATEMENT SIGNIFICANT ACTIVITY ENHANCES PORTFLIO METRICS FOR FUTURE INCOME AND
26 January 2015 LONDONMETRIC PROPERTY PLC ( LondonMetric or the Group or the Company ) THIRD QUARTER 2015 INTERIM MANAGEMENT STATEMENT SIGNIFICANT ACTIVITY ENHANCES PORTFLIO METRICS FOR FUTURE INCOME AND
Arena Office Fund FY14 annual results presentation. 3 September 2014
 Arena Office Fund FY14 annual results presentation 3 September 2014 www.arenainvest.com.au Presenters James Goodwin Andrew Nicol Rob de Vos Joint Managing Director Appointed to the Board in January 2012.
Countryside Properties PLC Full year results 2017
 Countryside Properties PLC Full year results 2017 0 FULL YEAR RESULTS NOVEMBER 2017 Differentiated strategy driving outstanding growth Mixed tenure model enabling sector leading growth Record completions,
Condensed Consolidated Statement of Comprehensive Income Six months ended 30 September 2014
 Condensed Consolidated Statement of Comprehensive Income Six months ended 30 September 2014 Six months Six months ended ended Year ended Note Revenue 2 39,918 35,866 72,196 Cost of sales (12,784) (12,237)
The UK s leading developer and manager of student accommodation Preliminary Results Year ended 31 December 2013
 The UK s leading developer and manager of student accommodation Preliminary Results Year ended 31 December 2013 HIGHLIGHTS Continued strong performance based on high levels of service - Adjusted EPS (pre
S IMMO Annual results for April 2018
 S IMMO Annual results for 2017 05 April 2018 We develop value Attractive properties & real values 1.2m m² space 6.1% Rental yield EUR 1,839,680,000 IFRS Property portfolio 94.8% 73% 27% Occupancy rate
THE UNITE GROUP PLC ("Unite Students", Unite, the "Group", or the "Company") MAINTAINING STRONG PERFORMANCE MOMENTUM
 MAINTAINING STRONG PERFORMANCE MOMENTUM") PRESS RELEASE 5 August 2015 THE UNITE GROUP PLC ("Unite Students", Unite, the "Group", or the "Company") MAINTAINING STRONG PERFORMANCE MOMENTUM The Unite Group plc, the UK's leading developer and manager
PRESS RELEASE 5 August 2015 THE UNITE GROUP PLC ("Unite Students", Unite, the "Group", or the "Company") MAINTAINING STRONG PERFORMANCE MOMENTUM The Unite Group plc, the UK's leading developer and manager
Grainger plc. Interim results for the six months ended 31 March 2018
 17 May Grainger plc Interim results for the six months ended 31 March Strong financial performance and growth trajectory, leading the market in private rental homes Helen Gordon, Chief Executive of Grainger,
COMPANY PRESENTATION MARCH 2018 (AS PER )
") COMPANY PRESENTATION MARCH 2018 (AS PER 31.12.2017) DIC ASSET AG KEY STRENGTHS INVESTMENT HIGHLIGHTS S-DAX listed player in the commercial real estate market in Germany, fully complying to highest market
COMPANY PRESENTATION MARCH 2018 (AS PER 31.12.2017) DIC ASSET AG KEY STRENGTHS INVESTMENT HIGHLIGHTS S-DAX listed player in the commercial real estate market in Germany, fully complying to highest market
Foxtons Interim results presentation For the period ended 30 June 2018
 Foxtons Interim results presentation For the period ended 30 June 2018 Important information This presentation includes statements that are, or may be deemed to be, forward-looking statements. These forward-looking
2014 INTERIM RESULTS
 2014 INTERIM RESULTS Welcome Robert Noel Chief Executive 2 Recycling capital 3 Agenda Martin Greenslade Scott Parsons Colette O Shea Q&A 20 Fenchurch Street, EC3 4 Financial results Martin Greenslade Chief
442/446 HOLLOWAY ROAD, LONDON N7 6LX
 442/446 HOLLOWAY ROAD, LONDON N7 6LX PRIME REVERSIONARY LONDON FOODSTORE RETAIL INVESTMENT INVESTMENT SUMMARY The North London suburb of Holloway is an established residential and commercial centre, located
SIGMA CAPITAL GROUP PLC ( Sigma or the Company ) The private rented sector and urban regeneration specialist
 The private rented sector and urban regeneration specialist") 2 July 2018 AIM: SGM SIGMA CAPITAL GROUP PLC ( Sigma or the Company ) The private rented sector and urban regeneration specialist Re: The PRS REIT plc Fourth Quarter Update Sigma, the private rented sector
2 July 2018 AIM: SGM SIGMA CAPITAL GROUP PLC ( Sigma or the Company ) The private rented sector and urban regeneration specialist Re: The PRS REIT plc Fourth Quarter Update Sigma, the private rented sector
Credit Suisse Annual Real Estate Conference. Thursday, 6 April 2006
 Credit Suisse Annual Real Estate Conference Thursday, 6 April 2006 Agenda British Land at a Glance UK REITS UK Market Fundamentals Strategy & Positioning Activity in 2005/6 Out of Town Retail & London
Standard Life Investments Property Income Trust
 Standard Life Investments Property Income Trust is a client of Kepler Trust Intelligence. Material produced by Kepler Trust Intelligence should be considered as factual information only and not an indication
JPMorgan Smaller Companies Investment Trust plc Annual General Meeting
 JPMorgan Smaller Companies Investment Trust plc Annual General Meeting 28 November 2017 Georgina Brittain, Portfolio Manager Katen Patel, Portfolio Manager Agenda Introduction Performance Review Current
Annual Results Presentation. 5 March 2014
 Annual Results Presentation 5 March 2014 Agenda Overview Financial Review Operations Outlook Questions & Answers 2 Overview 3 Overview Return to profit in year of strategic and operational progress Full
Kames Property Income Fund. February 2016 David Wise Investment Director
 Kames Property Income Fund February 2016 David Wise Investment Director Kames Property Income Fund Target distribution yield of 5.5% pa* Monthly income Balanced UK Commercial Property Fund Tax efficient
Agenda. Results Presentation 27 February Appendices 1 to
 Results Presentation 27 February 2018 51 Agenda Results Presentation 27 February 2018 Page Presented by Overview 1 Jeff Fairburn Review of operations 3 Jeff Fairburn Outlook 13 Jeff Fairburn Financial
HALF YEAR RESULTS TO 30 SEPTEMBER 2014
 HALF YEAR RESULTS TO 30 SEPTEMBER 2014 FRIDAY 28 NOVEMBER 2014 INTRODUCTION Introduction Helical is in a strong position developments on site and delivering value, strong valuation gains and growing rental
21 October Highlights during the quarter included:
 21 October 2015 Picton (LSE: PCTN), the income focused property investment company, announces its Net Asset Value for the quarter ended 30 September 2015 and Interim Dividend. Highlights during the quarter
Entrepreneurs Who Back Entrepreneurs. JV Partnerships Overview henleyinvestments.com
 Entrepreneurs Who Back Entrepreneurs JV Partnerships Overview 2016 henleyinvestments.com JV Partnerships Overview 2016 02-03 Who We Are and What We Do Founded in 2006, Henley is a full service Private
easyhotel plc Results for the year ended 30 September 2017
 Results for the year ended 30 September 2017 Introduction Guy Parsons Chief Executive Officer p2 Highlights Delivering Growth Revenue +39.7% Adjusted EBITDA +48.3% PBT before one-offs +43.0% Market Outperformance
Preliminary Results Presentation 2010!
 Preliminary Results Presentation 2010! Agenda! Introduction!Toby Courtauld!!Chief Executive! Financial Results!Timon Drakesmith, Finance Director! Market!Toby Courtauld, Chief Executive!! Valuation! Acquisitions
Offshore Investor Presentation April
 Offshore Investor Presentation April 2008 www.stockland.com.au Stockland s Position in the A-REIT Sector Stockland was formed in 1952 and pioneered the stapled security structure Stockland s current position*
PADDINGTON CENTRAL 5 JULY
 PADDINGTON CENTRAL 5 JULY 2013 www.britishland.com Disclaimer This presentation may contain certain forward-looking statements. By their nature, forward-looking statements involve risk and uncertainty
Countryside Properties plc Analyst Update
 Countryside Properties plc Analyst Update 1 ANALYST UPDATE JUNE 2016 Balanced business with two differentiated models H1 16 business split Housebuilding Division South-East focused place making Excellent
Distribution Number 12
 Distribution Number 12 Legal & General UK Property Feeder Fund Interim Manager s Short Report for the period ended 28 May 2017 Investment Objective and Policy The objective of the Fund is to achieve income
Property Acquisitions
 Property Acquisitions 7 november 2013 Overview Property Acquisitions I 7 November 2013 I page 1 Strategic acquisitions of quality assets in core locations with value add potential Mirvac has entered into
Sigma Capital Group. New funding structure to finance project growth. JV to deliver initial 200m portfolio of 2,000 homes.
 Sigma Capital Group New funding structure to finance project growth Joint venture with Gatehouse Bank Real estate Sigma has secured its first JV based on its new institutional funding model. This has been
PINEWOOD GROUP PRESENTATION OF Q3 2017/18 RESULTS
 PINEWOOD GROUP PRESENTATION OF Q3 2017/18 RESULTS Important notice This presentation has been prepared by Pinewood Finco plc (the Issuer) and Pinewood Group Limited (the Company and, collectively with
12 Months to 31 March 2012
 For professional investors only. Not suitable for retail clients. Schroder Exempt Property Unit Trust UK Property Market Review The past year has proven challenging for the high street, and this became
Foxtons Preliminary results presentation For the year ended December 2018
 Foxtons Preliminary results presentation For the year ended December 2018 Important information This presentation includes statements that are, or may be deemed to be, forward-looking statements. These
2017 Annual Results March 2018
 2017 Annual Results March 2018 This document accompanies the Annual Report & Accounts for the twelve months ended 31 December 2017 and contains a summary of information set out in that document. Reference
AVIVA INVESTORS REAL ESTATE FINANCE
 AVIVA INVESTORS REAL ESTATE FINANCE Introduction H2 2018 This document is for Professional Clients, institutional/qualified investors and Advisers only. It is not to be viewed by or used with retail clients
MAS REAL ESTATE INC RESULTS PRESENTATION YEAR ENDED 30 JUNE 2017
 MAS REAL ESTATE INC RESULTS PRESENTATION YEAR ENDED 30 JUNE 2017 CONTENTS Portfolio overview.... 3 Key metrics.... 4 Distribution targets.... 5 Acquisitions and disposals.... 7 New Waverley.... 8 Prime
Redcape Hotel Group. 1H19 Results Presentation 20 February 2019
 Redcape Hotel Group H9 Results Presentation 20 February 209 Agenda Overview of H9 Results 2 Financial Results 3 Portfolio Overview 4 Key Priorities and Outlook 5 Appendices 2 OVERVIEW OF H9 RESULTS 3 H9
The interim dividend of 5.3m will be paid on 28 June 2013 to holders registered on 31 May 2013.
 Mucklow (A & J) Group plc Half-Yearly Report 20 February 2013 Embargoed: 7.00am Rupert Mucklow, Chairman commented: I am pleased to report steady progress being made during the first six months of our
Annual General Meeting
 Annual General Meeting 18 July 2017 www.britishland.com @BritishLandPLC A successful year John Gildersleeve Chairman 2017 Highlights Underlying profits up 7% to 390m (+ 27m) Total sales of 1.5bn 9% ahead
FY 2016 RESULTS PRESENTATION
 MARKET TECH HOLDINGS LIMITED FY 2016 RESULTS PRESENTATION June 2016 INTRODUCTION FY 2016 Financial Review Property Portfolio Asset Management Coworking Digital Assets Looking Ahead Appendix 16 ACRES OF