ANNOUNCEMENT OF HALF-YEAR RESULTS
|
|
|
- Bathsheba Craig
- 5 years ago
- Views:
Transcription
1 ANNOUNCEMENT OF HALF-YEAR RESULTS HALF YEAR ENDED 30 SEPTEMBER NOVEMBER 2013
2 Agenda Overview and current trading Ian Mason Financial performance Simon Boddie Business and strategy update Ian Mason Global Sales Klaus Goeldenbot Q&A All 2
3 Key themes H1 FY14 sales growth of 1% was consistent with H2 FY13 Improvement in sales trends in both September and October to 4% growth ecommerce sales growth of 6% in H1, share up 3% pts to 57% H1 FY14 financial performance benefitted from stable gross margin and cost control Good strategic progress made in period and winning more customers Targeting higher structural growth through the cycle 3
4 Financial highlights 1% underlying sales growth International +3%, UK -3% Operating margin growth 0.5% point increase to 7.4% Headline PBT growth +14% to 44.6m Headline free cash flow growth +50% growth, 36.0m Strong balance sheet 1.1x net debt:ebitda Maintained interim dividend 5.0p Operating margin growth, strong balance sheet 4
5 Current trading Underlying sales growth (1) FY13 Q1 Q2 H1 October Continental Europe 3% 4% 3% 6% North America 3% 3% 3% 8% Asia Pacific (1)% 1% 0% 0% International 2% 3% 3% 5% UK (3)% (2)% (3)% (2) (1)% (2) Group 1% 1% 1% 4% 4% sales growth in both September and October (1) Adjusted for currency movements and trading days (2) UK sales growth excluding Raspberry Pi: 2% sales decline in H1 and flat sales growth in October 5
6 Agenda Overview and current trading Ian Mason Financial performance Simon Boddie Business and strategy update Ian Mason Global Sales Klaus Goeldenbot Q&A All 6
7 Basis of preparation Unless otherwise stated: Figures have been prepared using International Financial Reporting Standards (IFRS) All figures are restated for the changes in IAS19R Employee Benefits (see appendix) Changes in sales are adjusted for currency movements and for the number of trading days ( underlying sales growth/decline ) Changes in profit, cash flow, debt and share related measures such as earnings per share are, unless otherwise stated, at reported exchange rates Key performance measures such as return on sales use headline profit figures Sign conventions: % changes in sales and costs are disclosed as positive if improving profit and negative if reducing profit In H1 2012/13 net expenses of 2.5m were reported in the half year for items excluded from headline profit before tax 7
8 Profit and loss account m H1 2013/14 H1 Reported 2012/13 (1) Change Sales % (2) Gross margin 45.4% 45.5% (0.1)% points Headline operating costs (1.3)% (2) Headline operating profit % Interest (2.6) (2.8) 7% Headline profit before tax % Additional trading days and favourable currency movements increased headline PBT by c. 4m Excluding these factors headline profit before tax increased by around 4% Headline profit before tax up by 14% (1) Restated for the changes in IAS19R Employee benefits (2) Adjusted for currency movements; sales also adjusted for trading days 8
9 Group headline profit before tax movement Change (1) 10% 3% (7)% 1.4m (5.7)m m 9.5m 0.2m 44.6m 39.2m (2) H1 2012/13 International UK Processes Interest H1 2013/14 International driving contribution increase (1) Adjusted for currency movements (2) Restated for the changes in IAS19R Employee benefits 9
10 International contribution m H1 2013/14 H1 2012/13 (1) Change (2) Underlying Sales % Gross margin 43.5% 44.2% (0.7)% points Operating costs (125.4) (124.8) 2% Contribution % Contribution % 15.7% 14.5% 1.2% points International contribution up by 10% (2) (1) Restated for the changes in IAS19R Employee benefits (2) Adjusted for currency movements; sales also adjusted for trading days 10
11 International contribution components Change (1) 14% 2% 8% 0.8m 0.1m 8.6m m 61.0m 70.5m H1 2012/13 Continental Europe North America Asia Pacific H1 2013/14 Strong performance from Continental Europe (1) Adjusted for currency movements 11
12 UK contribution m H1 2013/14 H1 2012/13 (1) Change (2) Underlying Sales (2.5)% (3) Gross margin 49.9% 48.6% 1.3% points Operating costs (39.9) (39.2) (2)% Contribution % Contribution % 28.3% 27.5% 0.8% points Strong contribution margin above 28% (1) Restated for the changes in IAS19R Employee benefits (2) Sales also adjusted for trading days (3) Excluding sales of Raspberry Pi UK sales decline was 1.7% 12
13 Gross margin % Gross margin Change (0.1)% pt 0.0% pt (0.2)% pt 0.2% pt 45.5% 45.4% H1 2012/13 Geographic mix Product mix Currency movements Price & Discounts H1 2013/14 Stable Group gross margin 13
14 Operating costs Growth (1) 1.5% 0.5% (1)% (2)% (1)% m 238m (1) 241m H1 2012/13 Reorganisation efficiencies Lower stock provisions Additional depreciation Cost inflation Other H1 2013/14 H2 FY14 cost considerations: Cost inflation, additional depreciation, investment in strategy 1% constant currency cost growth (1) Restated for the changes in IAS19R Employee benefits; also adjusted for currency movements 14
15 Headline earnings per share m H1 2013/14 H1 2012/13 (1) Change Headline profit before tax % Reorganisation costs 0.0 (2.5) Reported profit before tax % Effective tax rate (29)% (30)% 1% point Per share amounts: Headline earnings 7.2p 6.2p 16% Interim dividend 5.0p 5.0p - Headline EPS growth of 16% (1) Restated for the changes in IAS19R Employee benefits 15
16 Net debt Movement in net debt H1 m 2013/14 Net debt as at 1 April 2013 (159.7) Free cash flow 35.4 Dividends paid (29.5) New shares issued 1.2 Own shares acquired (0.2) Translation differences 4.3 Net debt as at 30 September 2013 (148.5) Facilities & covenants H1 m 2013/14 Committed facilities Used facilities (147.9) Unused facilities H1 2013/14 Covenant Net debt / EBITDA 1.1x <3.25x EBITA net interest cover 22.2x >3x Pension deficit 33.6m (March m) - New census data re triennial valuation - Lower asset returns - Triennial valuation underway, to be completed by June 2014 Strong balance sheet 16
17 Cash flow H1 H1 m 2013/ /13 Profit before tax Depreciation & amortisation Employee share options / non-cash mvts Finance expense (net) Working capital 0.5 (4.5) Cash generated from operations Interest paid (net) (2.6) (2.8) Tax paid (13.0) (11.3) Net capital expenditure (11.3) (10.1) Reported free cash flow Add back: reorganisation cash flows Headline free cash flow Comments +22% Improved working capital management +50% FY14 cash considerations: Maintained guidance for stock turns 2.5x, net capex c. 40m (vs. 27m in FY13) Headline free cash flow up by 50% 17
18 Agenda Overview and current trading Ian Mason Financial performance Simon Boddie Business and strategy update Ian Mason Global Sales Klaus Goeldenbot Q&A All 18
19 Business portfolio H1 FY13/14 m Underlying sales growth % of Group sales Contribution margin Market position Continental Europe 3% 35% 21% No.1 North America 3% 23% 13% No. 3 Asia Pacific 0% 13% 6% No. 1 International 2% 71% 16% No. 1 UK (3)% 29% 28% No.1 Group 1% 100% 19% No. 1 Opportunity to improve International margin 19

20 Global strategy in place Focused on implementation 20

21 Continental Europe ecommerce with a human touch 3% sales growth (1), all markets in growth Europe ecommerce share 70% 65% Outperforming in our smaller markets 60% 55% 50% 7% ecommerce sales growth, 68% share eprocurement solutions driving expansion of corporate accounts portfolio 45% 40% 35% 30% H1 FY09 H2 FY09 H1 FY10 H2 FY10 H1 FY11 H2 FY11 H1 FY12 Enhanced search functionality Live Chat service H2 FY12 Increased investment in internal sales See rswww.com H1 FY13 H2 FY13 H1 FY14 ecommerce driving growth (1) Adjusted for currency and trading days 21

22 North America One global offer 3% sales growth (1) System giving new capabilities Famous For range (2) outperforming, driven by automation & control Allied Famous For sales growth of 5% Allied automation & control growth of >10% Majority of New Product Introduction is in Famous For categories 22% ecommerce sales growth, 37% share RS & Allied Globalise the Range Good growth from non-government sectors TE Connectivity pilot completed in H1 Will industrialise process in H2 and beyond Targeting 75% - 85% of range consistent globally Systems investment now enabling growth (1) Adjusted for currency and trading days (2) Our Famous For range comprises electronics and automation & control product categories 22
 APAC system roll-out China growing, Japan recovering, ANZ weak")


 Adjusted for currency and")
23 Asia Pacific World Class Systems & Business Insight Flat sales growth (1) APAC system roll-out China growing, Japan recovering, ANZ weak ANZ went live in H2 FY13 & is working well South East Asia has gone live in H1 China & Japan implementation over next year 3% ecommerce sales growth, 49% share Adding corporate accounts across the region Enhanced business insight SAP HANA just gone live Dramatically faster data processing capability Improving our product data analysis and insight Investing for future growth (1) Adjusted for currency and trading days 23


 Adjusted for")
24 UK Value for money 3% sales decline (1), 2% decline ex-raspberry Pi Improving customer s perception of our value Sales trends improved as H1 progressed 1% ecommerce sales decline, 62% share Corporate accounts outperforming Roll-out of price differentiation strategy Customer Investment Manager application driving better decision-making Increased gross margin driving 3% contribution growth (1) Adjusted for trading days 24

25 Downloads Growing our target customers Successful launch of DesignSpark Mechanical, our latest design tool for engineers Search engine marketing 120, ,000 Downloads of DesignSpark Applications 80,000 Global nursery programme 60,000 40,000 Design tools & software for engineers 20, Days following launch DesignSpark PCB DesignSpark Mechanical 5% increase in customer numbers in H1 25
26 Agenda Overview and current trading Ian Mason Financial performance Simon Boddie Business and strategy update Ian Mason Global Sales Klaus Goeldenbot Q&A All 26
 4% Group 2,500 2,500 people providing an effortless customer experience")
27 A large, locally-based sales resource Headcount by region: Europe 830 UK 600 Asia Pacific 670 North America 400 Headcount by activity: Field sales 23% Internal sales 40% Customer services 33% Trade counters (UK) 4% Group 2,500 2,500 people providing an effortless customer experience 27
28 Customer spend / potential Global Sales central to the strategy Sales & Marketing working together to deliver single global effort across customer lifecycle Single global effort across contact lifecycle Awareness Acquisition Nursery Development Brand awareness First purchase First 4 months Beyond 4 months Contacts know who we are Build the brand Acquire contacts in both new and existing customers Drive average purchases higher Spot the winners and nurture them Drive breadth of purchase and average order frequency Human Touch ecommerce machine Grow existing customers more profitably 28
29 What our customers want from Sales Expertise in procurement and logistics in order to save time and money Competence in offering relevant solutions Capability to provide technical support Speed in replying to customers needs Effortless Customer Experience Human Touch is a real differentiator 29


30 Working globally to improve effectiveness Global Sales Apps Store Adding Value Sales Effectiveness Local best practice becomes global standard 30
31 Case study: RS Spain H1 achievements Customer qualification process allows targeted resource deployment 10% more customers Human Touch focused on adding value via: eprocurement and other e-solutions Tailored services for certain market segments Working with our strategic suppliers in the local market Creating an effortless customer experience via: Proactive customer communications Dedicated customer service resource 50% reduction in customer complaints >50% sales growth from this group of customers 10% growth in sales ecommerce sales share now > 70% c.50% eprocurement sales growth >10% Famous For sales growth Winning share from small & medium size competitors 31
32 Case study: RS Japan H1 Achievements Price repositioning in semiconductors to improve value for money 3% sales growth Targeting large accounts with eprocurement solutions ecommerce sales share > 70% eprocurement sales growth doubled Raised awareness of and expansion of our Automation & Control range, targeting relevant customer groups Double-digit Famous For sales growth Strengthening our value proposition 32
33 Key themes H1 FY14 sales growth of 1% was consistent with H2 FY13 Improvement in sales trends in both September and October to 4% growth ecommerce sales growth of 6% in H1, share up 3% pts to 57% H1 FY14 financial performance benefitted from stable gross margin and cost control Good strategic progress made in period and winning more customers Targeting higher structural growth through the cycle 33
34 Agenda Overview and current trading Ian Mason Financial performance Simon Boddie Business and strategy update Ian Mason Global Sales Klaus Goeldenbot Q&A All 34
35 Q&A CONFERENCE CALL DIAL-IN DETAILS: United Kingdom United Kingdom (local) International Password Electrocomponents 35
36 ANNOUNCEMENT OF HALF-YEAR RESULTS HALF YEAR ENDED 30 SEPTEMBER NOVEMBER 2013
37 Financial appendices 37
38 Impact of foreign exchange Headline International contribution Reported *As restated H1 2013/14 H1 2012/13 Growth Growth reported Foreign exchange adjusted m m % % Continental Europe % 14% North America % 2% Asia Pacific % 8% International % 10% Headline UK contribution % 3% Headline Group contribution % 7% Headline Process costs (75.8) (70.1) (8)% (7)% Headline Operating profit % 7% * Restated for the changes in IAS19R Employee benefits 38
39 Impact of IAS19R Employee Benefits Reported IAS 19R Restated H1 2012/13 H1 2012/13 UK contribution 52.5 (1.4) 51.1 International contribution Process costs (69.2) (0.9) (70.1) Headline operating profit 44.3 (2.3) 42.0 Interest (2.8) - (2.8) Headline profit before tax 41.5 (2.3) 39.2 Reorganisation costs (2.5) - (2.5) Tax (11.8) 0.6 (11.2) Profit after tax 27.2 (1.7)
40 Medium-term performance framework KPIs 5 year target Historic performance (1) Group sales growth (2) 5% - 8% pa 4% pa Group return on sales (3), (4) 9% - 11% 7% - 10% (5) Return on capital employed (3), (6) 20% - 30% 15% - 25% Free cash flow as a % of sales (3) 4% - 6% 3% - 8% 1. Performance between 2006 and Underlying sales growth, adjusting for trading days and currency movements 3. Headline measures of profitability and cash flow are defined as the relevant reported profit/cash flow before reorganisation costs/cash flow 4. Headline operating profit expressed as a percentage of sales 5. Reported Group return on sales adjusted to reflect a 75:25 International:UK sales mix 6. Headline operating profit expressed as a percentage of net assets plus net debt 40


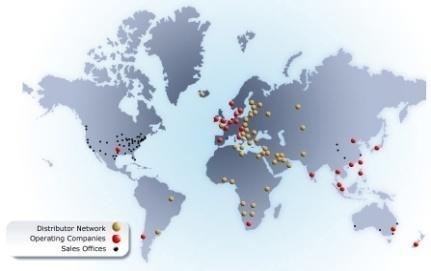


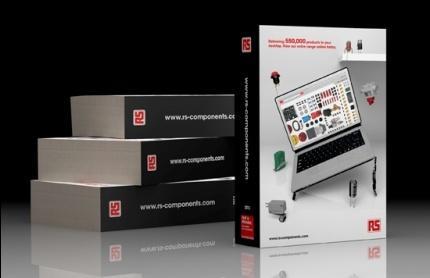
41 Electrocomponents: what we do Strong Brands 800K Catalogues 57% ecommerce 2,500 Major Suppliers 500,000 Products > 1m Customers 17 Distribution Centres 44,000 Parcels Daily 90+% of World GDP The world s distributor of choice 41
The global distributor for engineers
 The global distributor for engineers ELECTROCOMPONENTS PLC Announcement of Preliminary Results for Year Ended 31 March 2014 22 May 2014 www.electrocomponents.com AGENDA 2014 highlights and current trading
Electrocomponents plc ANNOUNCEMENT OF INTERIM RESULTS
 Electrocomponents plc ANNOUNCEMENT OF INTERIM RESULTS HALF YEAR ENDED 30 SEPTEMBER 2010 12 NOVEMBER 2010 DELIVERING FOR OUR CUSTOMERS Agenda Overview and current trading Ian Mason Financial performance
ANNOUNCEMENT OF PRELIMINARY RESULTS
 The leading high service distributor to engineers worldwide ANNOUNCEMENT OF PRELIMINARY RESULTS YEAR ENDED 31 MARCH 2009 29 May 2009 Agenda Overview and current trading Ian Mason Financial performance
Electrocomponents plc Annual Report and Accounts Developing a
 Electrocomponents plc Annual Report and Accounts Developing a WHO WE ARE CONTENTS Directors report: Business review Highlights 1 Group overview 2 Our business model 3 Chairman s report 10 Group Chief Executive
Electrocomponents 2017 half-year financial results. 18 November 2016
 Electrocomponents 2017 half-year financial results 18 November 2016 Agenda Overview of results Lindsley Ruth Financial results and performance update David Egan Performance Improvement Plan Lindsley Ruth
HALF-YEARLY FINANCIAL REPORT
 HALF-YEARLY FINANCIAL REPORT Electrocomponents plc, the leading high service distributor to engineers worldwide, today announces its results for the six months ended 30 September 2010. Strategic initiatives
The global distributor for engineers
 The global distributor for engineers www.electrocomponents.com Electrocomponents plc Annual Report and Accounts for the year ended 31 March Stock Code: ECM ELECTROCOMPONENTS PLC LSE Stock Code: ECM Welcome
Preliminary Results 2014/ March 2015
 Preliminary Results 2014/15 19 March 2015 Agenda Highlights Financial & business review Laurence Bain Mark Whiteling Strategy update & outlook Q&A Laurence Bain All 2 Transforming Premier Farnell 1. Strategic
ELECTROCOMPONENTS Full-year results for the year ended 31 March 2018
 ELECTROCOMPONENTS Full-year results for the year ended 31 March 2018 24 May 2018 SAFE HARBOUR This presentation contains certain statements, statistics and projections that are or may be forward-looking.
ELECTROCOMPONENTS PLC RESULTS FOR THE HALF YEAR ENDED 30 SEPTEMBER 2016
 ELECTROCOMPONENTS PLC RESULTS FOR THE HALF YEAR ENDED 30 SEPTEMBER 2016 PERFORMANCE IMPROVEMENT PLAN DRIVES 45% UNDERLYING H1 HEADLINE PBT GROWTH Highlights H1 2017 H1 2016 Change Underlying Change 1 Revenues
ELECTROCOMPONENTS 2019 half-year financial results
 ELECTROCOMPONENTS 2019 half-year financial results 20 November 2018 SAFE HARBOUR This presentation contains certain statements, statistics and projections that are or may be forward-looking. The accuracy
AEGIS GROUP PLC 2008 ANNUAL RESULTS. 19 March 2009
 AEGIS GROUP PLC 2008 ANNUAL RESULTS 19 March 2009 AGENDA OVERVIEW OF RESULTS John Napier FINANCIAL REVIEW Alicja Lesniak OUTLOOK John Napier Q&A Aegis Group plc Page 2 OVERVIEW OF RESULTS John Napier,
2013 Interim Results. 14 August 2013
 2013 Interim Results 14 August 2013 1 This presentation contains statements that are, or may be, forward-looking regarding the group's financial position and results, business strategy, plans and objectives.
SIGNIFICANT STEP FORWARD IN GROWTH AND PROFITABILITY IN H1
 ELECTROCOMPONENTS PLC RESULTS FOR THE HALF YEAR ENDED 30 SEPTEMBER 2017 SIGNIFICANT STEP FORWARD IN GROWTH AND PROFITABILITY IN H1 Change Highlights H1 2018 H1 2017 Reported Underlying 1 Revenue 823.8m
Results for the year ended 30 November 2014
 Results for the year ended 30 November 2014 Good progress but results impacted by weak Civil sales Good results in TCF and Yarns, more improvement expected After a good start, poor Civil sales in H2 impacted
INTRODUCTION STEVE RAWLINS, GROUP CHIEF FINANCIAL OFFICER ANDY BLUNDELL, CHIEF EXECUTIVE TOM PRESTWICH, DIRECTOR, GROUP CHANGE PROGRAMME FEBRUARY 2018
 INTRODUCTION ANDY BLUNDELL, CHIEF EXECUTIVE STEVE RAWLINS, GROUP CHIEF FINANCIAL OFFICER TOM PRESTWICH, DIRECTOR, GROUP CHANGE PROGRAMME FEBRUARY 2018 TRADING UPDATE 16/01/18 2 THE BOARD ANTICIPATES THAT
2017 Interim Results Presentation
 2017 Interim Results Presentation 28 th July 2017 www.morganadvancedmaterials.com Agenda Introduction and key highlights Pete Raby 2017 interim results Peter Turner Operational and strategic update Pete
ELECTROCOMPONENTS PLC RESULTS FOR THE HALF YEAR ENDED 30 SEPTEMBER Above market, sustainable growth and strong execution
 20 November 2018, 7.00 am ELECTROCOMPONENTS PLC RESULTS FOR THE HALF YEAR ENDED 30 SEPTEMBER 2018 Above market, sustainable growth and strong execution Highlights H1 2019 H1 2018 Change Like-for-like 1
Interim Results 2018/19
 Interim Results 2018/19 Martin Morgan, Executive Chairman Richard Amos, Chief Financial Officer London, 21 February 2019 Safe Harbour Statement This presentation and the subsequent question and answer
2017 Results Presentation
 2017 Results Presentation 27th February 2018 www.morganadvancedmaterials.com Agenda Introduction and key highlights Pete Raby 2017 results Peter Turner Operational and strategic update Pete Raby 2 Key
TELECONFERENCE Q FINANCIAL RESULTS. 10:00 CET, 10 November 2015
 TELECONFERENCE FINANCIAL RESULTS 10:00 CET, 10 November 2015 1 AGENDA AGENDA Business highlights: Key developments in Market development and sales-out Guidance 2015 Financial review for Recap and Q&A 2
ACAL plc. ACAL plc. Interim results for the six months ended 30 September 2017
 28 NOVEMBER 2017 ACAL plc Interim results for the six months 30 September 2017 Strong sales and earnings growth with record new project wins; Change of name to discoverie Group plc Acal plc (LSE: ACL,
ZEBRA TECHNOLOGIES FIRST QUARTER 2016 RESULTS May 10, 2016
 ZEBRA TECHNOLOGIES FIRST QUARTER 2016 RESULTS May 10, 2016 Anders Gustafsson Chief Executive Officer Mike Smiley Chief Financial Officer 2 Safe Harbor Statement Statements made in this presentation which
MARCH 2016 RESULTS FOR YEAR ENDED 31 DECEMBER 2015
 MARCH 2016 RESULTS FOR YEAR ENDED 31 DECEMBER 2015 DEVRO: THE COLLAGEN CASING COMPANY Global Leader One of the world s leading providers of collagen casings for the processed meats sector Provides technical
Results for the financial year ending 1 February FY 14/15 (52 weeks) 88.0 (4.9) 83.1
 88.0 (4.9) 83.1") Premier Farnell plc 19 March 2015 Key Financials except for per share Results for the financial year ending 1 February 2015 FY 14/15 (52 weeks) FY 13/14 (52 weeks) Change Underlying Growth (a) Total revenue
Premier Farnell plc 19 March 2015 Key Financials except for per share Results for the financial year ending 1 February 2015 FY 14/15 (52 weeks) FY 13/14 (52 weeks) Change Underlying Growth (a) Total revenue
6 MARCH 2017 FULL YEAR RESULTS
 6 MARCH 2017 FULL YEAR RESULTS FOR THE YEAR ENDED 31 DECEMBER 2016 01 THE COLLAGEN CASING COMPANY Global Leader One of the world s leading providers of collagen casings for the processed meats sector Provides
TELECONFERENCE FY 2014 FINANCIAL RESULTS
 TELECONFERENCE FY 2014 FINANCIAL RESULTS 10:00 CET, 17 February 2015 1 DISCLAIMER Certain statements in this presentation constitute forward-looking statements. Forward-looking statements are statements
ELECTROCOMPONENTS PLC RESULTS FOR THE YEAR ENDED 31 MARCH 2018 STRONG RESULTS AND NEW INITIATIVES TO DRIVE FUTURE GROWTH AND PROFITABILITY
 24 May 2018, 7.00 am ELECTROCOMPONENTS PLC RESULTS FOR THE YEAR ENDED 31 MARCH 2018 STRONG RESULTS AND NEW INITIATIVES TO DRIVE FUTURE GROWTH AND PROFITABILITY Highlights Change Like-for-like 1 change
TELECONFERENCE Q FINANCIAL RESULTS 10:00 CET, 10 MAY 2016
 TELECONFERENCE 2016 FINANCIAL RESULTS 10:00 CET, 10 MAY 2016 AGENDA FINANCIAL HIGHLIGHTS 2016 FINANCIAL EXPECTATIONS 2016 FINANCIAL REVIEW 2016 SUMMARY 2 DISCLAIMER Certain statements in this presentation
July 2013 DEVRO PLC INTERIM RESULTS FOR THE SIX MONTHS ENDED 30 JUNE 2013
 July 2013 DEVRO PLC INTERIM RESULTS FOR THE SIX MONTHS ENDED 30 JUNE 2013 Devro: The collagen casing company Global Leader One of the world s leading providers of collagen casings to the food industry
HALF YEAR RESULTS ENDING 2 FEBRUARY 2018
 HALF YEAR RESULTS ENDING 2 FEBRUARY 2018 Matt Armitage CEO Brad Gray CFO AGENDA 1 2 3 4 Overview 2018 Half Year Results Strategy Update Summary & Outlook New photo to be supplied by CKD 2 OVERVIEW Positive
2012 Full-Year Results
 2012 Full-Year Results February 20, 2013 Amsterdam Nancy McKinstry Chief Executive Officer and Chairman Boudewijn Beerkens Chief Financial Officer Forward-looking Statements This presentation contains
Aegis Group plc Half Year Results. 27 August 2010
 Aegis Group plc 2010 Half Year Results 27 August 2010 Agenda Introduction John Napier, Chairman Aegis Group overview Jerry Buhlmann, CEO Divisional review Aegis Media - Jerry Buhlmann, CEO Synovate Robert
Financial results & business update. Quarter ended 31 March April 2018
 Financial results & business update Quarter ended 31 March 2018 18 April 2018 Disclaimer 3 Any remarks that we may make about future expectations, plans and prospects for the company constitute forward-looking
Financial results & business update. Quarter ended 30 September October 2016
 Financial results & business update Quarter ended 30 September 2016 19 October 2016 Disclaimer 3 Any remarks that we may make about future expectations, plans and prospects for the company constitute forward-looking
Results presentation. Preliminary results for the 12 months ended 31 January 2018
 Results presentation Preliminary results for the 12 months ended 31 January 2018 1 Lance Batchelor Chief Executive Officer 2 Today s Agenda Lance Batchelor Chief Executive Officer Jonathan Hill Chief Financial
Croda International Plc 2014 Interim Results. 22 July 2014
 Croda International Plc 2014 Interim Results 22 July 2014 Introduction Steve Foots Group Chief Executive Underlying progress in a tough environment Constant currency turnover up 2.3% 5 out of 8 core markets
YEAR END RESULTS 31 MARCH Russell Down, Chief Executive Chris Morgan, Group Finance Director
 YEAR END RESULTS 31 MARCH 2018 Russell Down, Chief Executive Chris Morgan, Group Finance Director Customer service strategy improving performance Revenue (excluding disposals) 371.6m 6.4% FY17: 349.1m
2018 Interim Presentation
 2018 Interim Presentation 26th July 2018 www.morganadvancedmaterials.com Agenda Introduction and key highlights Pete Raby 2018 interim results Peter Turner Operational and strategic update Pete Raby 2
Interim results presentation. 26 August 2010
 Interim results presentation 26 August 2010 Martin Lamb Agenda Results Overview Martin Lamb Financial Review Douglas Hurt Business Review - Severe Service Ian Whiting - Fluid Power Roy Twite - Indoor Climate
TELECONFERENCE Q FINANCIAL RESULTS. 10:00 CET, 11 August 2015
 TELECONFERENCE FINANCIAL RESULTS 10:00 CET, 11 August 2015 1 AGENDA AGENDA Business highlights: Key developments in Market development and sales-out Performance of newly launched products Guidance 2015
Interim Results. 23 April 2014
 Interim Results 23 April 2014 The leading supply chain, trading and distribution partner in our chosen supply markets - delivering consistently strong returns to shareholders 2 Evolution of Smiths News
2017/18 Half Year Results De La Rue plc 21 November 2017
 2017/18 Half Year Results De La Rue plc 21 November 2017 Page 1 Agenda Overview Martin Sutherland Financial performance Jitesh Sodha Strategic update Martin Sutherland Operational review Martin Sutherland
Premier Farnell plc 13 September Results for the Second Quarter and First Half of the 53 week financial year ending 3 February 2013.
 Premier Farnell plc 13 September 2012 Results for the Second Quarter and First Half of the 53 week financial year ending 3 February 2013 Key Financials Continuing operations (unaudited) Q2 12/13 Q2 11/12
Foxtons Interim results presentation For the period ended 30 June 2018
 Foxtons Interim results presentation For the period ended 30 June 2018 Important information This presentation includes statements that are, or may be deemed to be, forward-looking statements. These forward-looking
Financial results & business update. Quarter and year ended 31 December February 2017
 Financial results & business update Quarter and year ended 31 December 2016 14 February 2017 Disclaimer 3 Any remarks that we may make about future expectations, plans and prospects for the company constitute
Annual Report and Accounts for the year ended 31 March 2017
 Electrocomponents plc Annual Report and Accounts for the year ended 31 March www.electrocomponents.com Stock Code: ECM Who we are Electrocomponents is a global high-service distributor supporting our customers
Enhancing Productivity. Spectris plc Interim Results. 30 July Spectris plc
 Enhancing Productivity Spectris plc 2015 Interim Results 30 July 2015 Agenda Highlights Financial Performance Business Update Summary and Outlook 2 Highlights Constant currency sales growth of 5%, with
Investor & Analyst Presentation Ful YearResults 30 June2016 For personal use only 25th August 2016 Rebekah O Flaherty - CEO I Jonathan Kenny - CFO
 Investor & Analyst Presentation Full YearResults 30 June2016 25th August 2016 Rebekah O Flaherty - CEO I Jonathan Kenny - CFO Agenda 1 Overview 2 Strategic Priorities 3 FY16 Financial Results 4 FY17 Outlook
Financial results & business update. Quarter and year ended 31 December February 2016
 Financial results & business update Quarter and year ended 31 December 2015 11 February 2016 Disclaimer 3 Any remarks that we may make about future expectations, plans and prospects for the company constitute
Preliminary Results 2012/13
 Preliminary Results 2012/13 David Tyler Chairman John Rogers Chief Financial Officer Group performance Highlights Underlying results 2012/13 m 2011/12 m Change % Sales (inc VAT) 25,632 24,511 4.6 Sales
H1 16 interim results. 22 September 2015
 H1 16 interim results 22 September 2015 Important notice 2 This presentation may include certain forward-looking statements, beliefs or opinions, including statements with respect to the Company s business,
BT Group plc Q3 2016/17 results 27 January 2017
 BT Group plc Q3 2016/17 results 27 January 2017 Forward-looking statements caution Certain statements in this presentation are forward-looking and are made in reliance on the safe harbour provisions of
SIG plc 2015 Half Year results. 11 August 2015
 SIG plc 2015 Half Year results 11 August 2015 Highlights Group sales +3.1% in constant currency; +0.6% on LFL basis Improving trend in Mainland Europe; LFLs turned positive Q2 2015 UK & Ireland LFL sales
DS Smith Plc. Full Year Results 2010/11 23 June 2011
 DS Smith Plc Full Year Results 2010/11 23 June 2011 Introduction Miles Roberts Group Chief Executive 2 Strong performance, more to go for Packaging volume up 8% EBITA up 39% to 136.1m, 20% excluding Otor
Delivered 60 million of validated cost savings to our customers
 2013 Preliminary Results For the year ended 31 December 2013 Continued progress in difficult markets Delivered 60 million of validated cost savings to our customers Agenda Overview Financial highlights
FY16 YEAR END RESULTS 5 APRIL 2016
 FY16 YEAR END RESULTS 5 APRIL 2016 DEFINITIONS AND IMPORTANT NOTICE The following definitions apply throughout Trading EBITDA (earnings before interest, tax, depreciation and amortisation): excludes exceptional
Cover-More Group. UBS Australasia Conference. November 2015
 Cover-More Group UBS Australasia Conference November 2015 Executive summary: FY15 overview Cover-More delivered another year of double digit earnings growth, with offshore business growing substantially.
Aegis Group plc. 17 March 2011
 Aegis Group plc 2010 Full Year Results 2010 Full Year Results 17 March 2011 Agenda Introduction John Napier, Chairman Aegis Group overview Jerry Buhlmann, CEO Divisional review Aegis Media - Jerry Buhlmann,
NORTHGATE plc Interim Results Six months ended 31 October 2011
 NORTHGATE plc Interim Results Six months ended 31 October 2011 6 December 2011 1 Agenda Group Summary Operational review UK Bob Contreras Spain Financial performance Outlook Chris Muir Bob Contreras 2
INTERIM RESULTS. Interim Results.
 INTERIM RESULTS. RESULTS. 2017 Interim Results. Results. 2017 1 Agenda Chairman s introduction Financial review Operational update Plumbing & Heating transformation Robert Walker Alan Williams John Carter
Brammer plc. The pan-european Distributor
 1 Brammer plc The pan-european Distributor 2 Agenda Financials About Brammer Growth Market Segmentation Key Accounts Insites Product Range Extension Strategy The Future Questions 3 Half Year Results 6m
DRAFT CREATED BY CMB (07/08/2014) Ricardo plc. Preliminary Results Presentation Year ended 30 June Ricardo plc 2014
 Ricardo plc. Preliminary Results Presentation Year ended 30 June Ricardo plc 2014") DRAFT CREATED BY CMB (07/08/2014) Ricardo plc 2014 1 Ricardo plc Preliminary Results Presentation 30 June 2014 2 HIGHLIGHTS for the year ended 30 June 2014 A record year end order book up 17% to 142m (Jun
DRAFT CREATED BY CMB (07/08/2014) Ricardo plc 2014 1 Ricardo plc Preliminary Results Presentation 30 June 2014 2 HIGHLIGHTS for the year ended 30 June 2014 A record year end order book up 17% to 142m (Jun
ZEBRA TECHNOLOGIES SECOND-QUARTER 2016 RESULTS. August 9, 2016
 ZEBRA TECHNOLOGIES SECOND-QUARTER 2016 RESULTS August 9, 2016 Anders Gustafsson Chief Executive Officer Mike Smiley Chief Financial Officer 2 Safe Harbor Statement Statements made in this presentation
A solid quarter with inspiring events and significant further improvement potential
 A solid quarter with inspiring events and significant further improvement potential Q2 report November 29, 2018 Agenda. 1. Q2 in short 2. Financials 3. Key take-aways 4. Q & A Richard Hausmann President
SABMiller plc. Full year results Twelve months ended 31 March Graham Mackay, Chief Executive Jamie Wilson, Chief Financial Officer.
 SABMiller plc Full year results Twelve months ended 31 March 2012 Graham Mackay, Chief Executive Jamie Wilson, Chief Financial Officer 24 May 2012 Forward looking statements This presentation includes
PRESS RELEASE. Sales came to million in 2009, down 0.5% compared with 2008, or down 0.3% at constant exchange rates.
 2009: A ROBUST PERFORMANCE IN A PARTICULARLY CHALLENGING ENVIRONMENT Current operating margin1 maintained at 25.7% of sales 2009 dividend: 3.80 euros per share Full-year sales virtually unchanged: -0.3%
2016/17 Half Year Results De La Rue plc 22 November 2016
 2016/17 Half Year Results De La Rue plc 22 November 2016 Page 1 Disclaimer This presentation has been prepared by De La Rue plc ( De La Rue ). This presentation includes statements that are, or may be
31 March 2018 Audited Preliminary Results. 6 June 2018
 31 March 2018 Audited Preliminary Results 6 June 2018 1 Presentation Team Euan Fraser Chief Executive Officer Stuart McNulty UK Chief Executive Officer John Paton Chief Financial Officer Has led Alpha
Early signs of operational progress are coming through in the UK, while Spain continues to perform strongly.
 5 December 2017 NORTHGATE PLC INTERIM RESULTS FOR THE SIX MONTHS ENDED 31 OCTOBER 2017 Strong growth in Spain and slowing decline in UK of vehicles on hire with good progress against strategic initiatives.
D ATA PA C K Full Year Results JUPITER FUND MANAGEMENT PLC
 D ATA PA C K 2015 Full Year Results 2015 FULL YEAR RESULTS 1 Contents Overview of Jupiter Page 2 Investment performance Page 3 AUM by investment strategy Page 5 AUM and flows Page 6 Summary P&L Page 9
Interim Results for the 26 weeks ended 28 September 2014 STRONG FIRST HALF RESULTS
 27 November 2014 Interim Results for the 26 weeks ended 28 September 2014 STRONG FIRST HALF RESULTS Financial Highlights Underlying Results for the 26 weeks ended 28 September 2014 Total sales +15.0% to
TELECONFERENCE Q FINANCIAL RESULTS 11:00 CET, 1 NOVEMBER 2016
 TELECONFERENCE FINANCIAL RESULTS 11:00 CET, 1 NOVEMBER AGENDA FINANCIAL HIGHLIGHTS FINANCIAL EXPECTATIONS FINANCIAL REVIEW SUMMARY 2 DISCLAIMER Certain statements in this presentation constitute forward-looking
THIRD QUARTER OCTOBER 2018
 THIRD QUARTER 2018 18 OCTOBER 2018 DISCLAIMER Certain information contained in this document, other than historical information, may constitute forward-looking statements or unaudited financial forecasts.
2013 Full-Year Results
 2013 Full-Year Results February 19, 2014 Amsterdam Nancy McKinstry Chief Executive Officer and Chairman Kevin Entricken Chief Financial Officer Forward-looking Statements This presentation contains forward-looking
Preliminary Results for year ended 30 November 2015
 Preliminary Results for year ended 30 November 2015 Good progress against a challenging market backdrop 5 year planning process completed, underpins 2016 expectations Clear long term strategy being implemented
Financial Overview. Leslie Varon
 Financial Overview Leslie Varon Xerox Investment Proposition Global Market Leader Attractive Market Opportunities Disciplined Operator Strong Annuity- Driven Cash Flow Sustainable Shareholder Returns Strong
TELECONFERENCE Q FINANCIAL RESULTS
 TELECONFERENCE FINANCIAL RESULTS 10:00 CET, 11 November 2014 1 12 AUGUST 2014 AGENDA AGENDA Business highlights: Key developments in Market development and sales-out Performance of newly launched products
Half-yearly results for six months ended 30 September November 2015
 Half-yearly results for six months ended 30 September 2015 10 November 2015 2015 Experian plc. All rights reserved. Experian and the marks used herein are service marks or registered trademarks of Experian
Chief Executive Officer : John Croll Chief Financial Officer : James Orlando
 23 AUGUST 2017 FY17 RESULTS Chief Executive Officer : John Croll Chief Financial Officer : James Orlando isentia.com AGENDA Overview of FY17 Results Strategic Focus FY17 Financial Performance Q&A John
TELECONFERENCE Q FINANCIAL RESULTS
 TELECONFERENCE FINANCIAL RESULTS 10:00 CET, 12 August 2014 1 AGENDA AGENDA Business highlights: Key developments in Market development and sales-out Performance of newly launched products Guidance 2014
Wolters Kluwer 2018 Full-Year Results
 Wolters Kluwer 2018 Full-Year Results Nancy McKinstry CEO Kevin Entricken CFO February 20, 2019 2018 Full-Year Results 1 Forward-looking Statements This presentation contains forward-looking statements.
Rebalanced ITV delivers continued good growth Interim Results 2016
 Rebalanced ITV delivers continued good growth Interim Results 2016 27 July 2016 Agenda Key Messages and H1 Highlights Adam Crozier Half Year Financial Results Ian Griffiths Strategic Outlook Adam Crozier
UDG Healthcare plc Interim Results Presentation FY17. London Stock Exchange, 23 rd May 2017
 UDG Healthcare plc Interim Results Presentation FY17 London Stock Exchange, 23 rd May 2017 Forward looking statements This Presentation has been prepared by UDG Healthcare plc and contains certain forward-looking
Interim Results for the 26 weeks ended 29 June 2014
 Interim Results for the 26 weeks ended 29 June 2014 1 The Team David Wild Chief Executive Officer Sean Wilkins Chief Financial Officer 2 Highlights of H1 2014 11.3% UK LFL UK on-line accounting for 69.7%
Driving shareholder value
 KONE CMD 2017 Driving shareholder value ILKKA HARA, CFO SEPTEMBER 29, 2017 AGENDA FINANCIAL OVERVIEW BUILDING ON THE STRONG BUSINESS MODEL INVESTING FOR THE FUTURE LOOKING AHEAD Financial overview 3 Sales
Full-year results. 20 August 2014
 Full-year results 20 August 2014 Overview & Results Highlights Tom Gorman, CEO 2 Key messages Strategy on track and positive outlook for FY15 Sales revenue growth and Underlying Profit delivered in line
23 October Offering. 2 Gunnebo Group. Q Safe Storage, 36% Cash Management, 21% Entrance Control, 21% Integrated Security, 22%
 Gunnebo Group Q3 2018 23 October 2018 The Group in Brief 4,900 MSEK Turnover 2017 4,400 No of Employees 25 Sales Companies Offering Safe Storage, 36% Cash Management, 21% Entrance Control, 21% Integrated
RESULTS FOR THE YEAR ENDED. 31 March 2018
 RESULTS FOR THE YEAR ENDED 31 March 2018 SHARPEN ACCELERATE SIMPLIFY 2 Nick Hampton, Chief Executive Chris McLeish, Group VP Finance and Control AGENDA Financial Review Outlook Accelerating Business Performance
Profit recovery continues.
 Financial review Profit recovery continues. This was a strong performance for Tesco where we delivered results ahead of expectations. Alan Stewart Chief Financial Officer Visit www.tescoplc.com/ar2017
For personal use only
 20 th February 2018 ASX RELEASE Corporate Travel Management Reports Half Year Results On Track to Achieve Top End of FY18 Guidance 1H18 Results Highlights: Total Transaction Value (TTV) (unaudited) $2,258.5m
For personal use only. Lovisa Holdings Limited 2019 HALF YEAR
 Lovisa Holdings Limited 2019 HALF YEAR SHANE FALLSCHEER CHRIS LAUDER MANAGING DIRECTOR CHIEF FINANCIAL OFFICER Some of the information contained in this presentation contains forward - looking statements
Half year results 30 September 2017
 Half year results 30 September November Russell Down, Chief Executive Chris Morgan, Group Finance Director Strong first half performance Revenue (excluding disposals) 183.2m 6.9% HY17: 171.4m EBITDA* 33.8m
INTERIM RESULTS Half Year Ended 30 June 2016
 INTERIM RESULTS Half Year Ended 30 June 2016 4 August 2016 Disclaimer Certain statements included or incorporated by reference within this presentation may constitute "forward looking statements" in respect
Year End Results. PZ Cussons Plc 31 May 2018
 Year End Results PZ Cussons Plc 31 May 2018 Group Highlights Revenue Profits Initiatives Net debt Dividend Reported revenue 5.8% lower than prior year and 2.3% lower on a constant currency basis. Adjusted
Final results for 52 weeks to 27 December Ralph Topping, Chief Executive Neil Cooper, Group Finance Director
 Final results for 52 weeks to 27 December 2011 Ralph Topping, Chief Executive Neil Cooper, Group Finance Director 1 Agenda Overview Ralph Topping, Chief Executive Financial highlights Neil Cooper, Group
FINAL RESULTS FOR THE YEAR ENDED 29 FEBRUARY April 2016
 FINAL RESULTS FOR THE YEAR ENDED 29 FEBRUARY 2016 26 April 2016 FY16 HIGHLIGHTS Sales up 40% year on year (42% CER) UK up 38%, rest of Europe 25% (35% CER), rest of world up 56% (63% CER) Adjusted EBITDA
2014 Full-Year Results
 2014 Full-Year Results February 18, 2015 Amsterdam Nancy McKinstry Chief Executive Officer and Chairman Kevin Entricken Chief Financial Officer Forward-looking Statements This presentation contains forward-looking
SABMiller plc. Full year results Twelve months ended 31 March Jamie Wilson, Chief Financial Officer Gary Leibowitz, SVP, Investor Relations
 SABMiller plc Full year results Twelve months ended 31 March 2012 Jamie Wilson, Chief Financial Officer Gary Leibowitz, SVP, Investor Relations 24 May 2012 Forward looking statements This presentation
CONFERENCE CALL First nine months 2018 results. IMCD N.V. 7 November 2018
 CONFERENCE CALL First nine months 2018 results IMCD N.V. 7 November 2018 Page 2 Disclaimer This presentation may contain forward looking statements. These statements are based on current expectations,