Portfolio Optimization with Industry Return Prediction Models
|
|
|
- Frederick Fleming
- 5 years ago
- Views:
Transcription
1 Portfolio Optimization with Industry Return Prediction Models Wolfgang Bessler Center for Finance and Banking Justus-Liebig-University Giessen, Germany Dominik Wolff Deka Investment GmbH, Frankfurt, Germany *Corresponding Author: Wolfgang Bessler, Center for Finance and Banking, Justus-Liebig- University Giessen, Licher Strasse 74, Giessen, Germany, Phone: ,
2 Portfolio Optimization with Industry Return Prediction Models Abstract. We postulate that utilizing return prediction models with fundamental, macroeconomic, and technical indicators instead of using historical averages should result in superior asset allocation decisions. We investigate the predictive power of individual variables for forecasting industry returns in-sample and out-of-sample and then analyze multivariate predictive regression models including OLS, a regularization technique, principal components, a targetrelevant latent factor approach, and forecast combinations. The gains from using industry return predictions are evaluated in an out-of-sample Black-Litterman portfolio optimization framework. We provide empirical evidence that portfolio optimization utilizing industry return prediction models significantly outperform portfolios using historical averages and those being passively managed. Keywords: Portfolio Optimization, Return forecasts, Predictive Regression, Three-Pass Regression Filter, Black-Litterman Model. JEL classification: G17, G11, C53
3 1 1. Introduction It has always been the objective of active investment management to persistently outperform an appropriate benchmark. Most of the earlier academic literature on return prediction and mutual fund performance, however, concludes that stock returns are hardly predictable and that active asset managers seldom achieve persistently higher risk-adjusted returns relative to a passive benchmark due to equilibrium processes in financial markets (Berk and Green, 004, Bessler et al., 016). Consequently, investors should, on average, not expect a superior performance after fees when implementing portfolio optimization approaches, even when return forecast from prediction models are utilized. However, there are two recent findings reported in the literature when combined my alter out conclusions: First, there exists some empirical evidence indicating that employing sophisticated asset allocation models in an outof-sample setting generates superior risk-adjusted returns (Bessler et al. 014, 015). Second, some recent studies suggest some out-of-sample predictability for the overall U.S. stock market (S&P 500), possibly offering economic value for asset-allocation decisions (Rapach et al., 010, Neely et al., 014, Hull and Qiao, 015). The objective of our study is to combine these two recent insights by first predicting industry returns, second using these returns for out-of-sample portfolio optimization, and finally evaluating the risk-adjusted returns over various periods. Overall, this study provides significant empirical evidence on the predictability of industry stock returns and on the outperformance of various asset allocation models for the entire period and various sub-periods. Our analysis is separated into two major parts. In the first part, we analyze the predictability of industry returns using macroeconomic indicators, fundamental data, and technical variables in a broad set of state-of-the-art prediction models. In the second part, we employ various asset allocation models based on these industry return forecasts and evaluate the performance of out-of-sample optimized portfolios. We start with
4 the ideas that markets are efficient and persistent outperformance is unattainable, and consequently none of the models should neither provide significant return predictability nor achieve higher risk-adjusted returns than a passive benchmark portfolio. To avoid spurious regressions we analyze out-of-sample predictability and out-of-sample asset allocations. Our study contributes to the literature in four major aspects. First, we analyze the predictability of industry returns, while earlier studies mainly focus on the overall U.S. stock market (S&P500). Our hypothesis is that industry portfolios are different asset classes and we expect returns of different industries to be partly driven by different risk-factors and consequently to diverge substantially during the economic cycle. From an asset management perspective, asset allocation should improve when investing not only in the overall stock market but when diversifying into various asset-classes and shifting the portfolio between industries over time (Grinold and Kahn, 000). Second, we expand the commonly used dataset of predictive variables (Goyal and Welch, 007) by including additional macroeconomic and technical variables. Third, we analyze the predictive power of bivariate and multivariate prediction models including established approaches such as principal components, forecast combination models, and selection via the LASSO. We add to the literature by also testing a relatively new target-relevant latent factor approach and propose and test our own variable selection model. The latter approach determines individual predictive variables based on their capacity to forecast future returns, i.e. ahead of the evaluation period. Fourth, we investigate the portfolio benefits of return forecast models in asset allocation decisions by comparing the risk-adjusted performance to the value-weighted market index and a passive equally weighted (1/N) portfolio that is known to be a very stringent benchmark (DeMiguel et al., 009). Additionally, we evaluate and compare the performance of monthly optimized industry portfolios which either are based on a return forecast model or on the historical average.
5 3 Overall, our empirical results suggest that for most industries our return forecast models predict future returns significantly better than when using historical averages. Moreover, we find that asset allocations based on return predictions not only significantly outperform the value-weighted market index and the equally weighted (1/N) buy-and-hold portfolio but most importantly also asset allocations based on historical averages. Although our results suggest that by using industry return predictions the investor attains superior asset allocations resulting in persistently higher risk-adjusted returns even over longer horizons than passive investments, this does not imply that outperformance can be easily achieved by asset managers. The main detriments are equilibrium mechanisms in capital markets (Berk and Green, 004) such as fund flows and manager changes (Bessler at al., 016) as well as fund size and fund family coordination problems (Bessler et al., 016) that all drive all initially successful strategies to an average performance. The remainder of this study is organized as follows. In the first part we discuss in Section the literature on forecasting stock returns and portfolio optimization. Section 3 presents the data and the predictive variables. Section 4 analyzes the out-of-sample predictive power of individual variables and of different multivariate forecast models. In Section 5 we analyze the performance of industry-level return forecasts when applied in portfolio optimization models. Section 6 concludes.. Literature Review.1 STOCK RETURN PREDICTABILITY Stock-return predictability is a controversially discussed issue in the asset management literature. Several studies identify fundamental and macroeconomic variables as well as technical
6 4 indicators that provide predictive power in forecasting the U.S. equity risk premium. 1 Among the most prominent predictive variables are the dividend yield, the book-to-market ratio, the term spread, the default yield spread, the price-earnings ratio, the inflation rate, and the stock variance. While earlier studies mainly build on in-sample predictive regressions to identify forecast-ability, Goyal and Welch (008) revisit the predictive power of 14 fundamental and interest rate related variables for forecasting the U.S. equity premium out-of-sample for the 197 to 005 period. Obviously, out-of-sample predictability is more relevant for investors than in-sample analyses because significant in-sample predictability does not imply that return forecasts can be used to generate a superior portfolio performance. 3 Nevertheless, Goyal and Welch (008) suggest that none of the fundamental variables proposed in the literature has superior out-of-sample forecast capabilities compared to the simple historical average return in bivariate regressions and in several multivariate models. Their results suggest that the market is information efficient and stock returns cannot be predicted. However, several subsequent studies using the same dataset implement more elaborated multivariate return forecast models and report superior out-of-sample forecasts compared to the historical average, thus providing economic benefits to investors (Rapach et al., 010; Cenesizoglu and Timmermann, 01). Among these models are forecast combination models 1 Rapach and Zhou (013) provide a literature overview on forecasting stock returns. Dividend yield (Dow, 190; Fama and French, 1988; Ang and Bekaert, 007), the book-to-market ratio (Kothari and Shanken, 1997; Pontiff and Schall, 1998), the term spread (Campbell, 1987), the default yield spread (Keim and Stambaugh, 1986; Fama and French, 1989) the price-earnings ratio (Fama and French, 1989; Zorn and Lawrenz, 015), the inflation rate (Nelson, 1976; Fama, 1981), the stock variance (Guo, 006), the world s capital to output ratio (Cooper and Priestley, 013), and the difference between the dividend yield and the 10- year treasury bond yield (Maio, 013), inventory productivity (Alan, 014). 3 For instance it is possible that the encountered relation between a predictive variable and future returns is not stable over time and therefore cannot be utilized to improve performance. Moreover, transaction costs might hinder investors to exploit predictability.
7 5 (Rapach et al., 010) which combine forecasts of bivariate regressions, 4 economically motivated model restrictions 5 (Campell and Thompson, 008; Pettenuzzo et al., 014), and predictive regressions based on principal components (Ludvigson and Ng, 007, Neely et al., 014, Hammerschmidt and Lohre, 014). 6 In addition, Neely et al. (014) suggest that adding technical indicators to the fundamental predictive regression models improves equity return forecasts for the U.S. stock market for the 1951 to 011 period even further. Hammerschmidt and Lohre (014) report improved predictability for the same dataset by including macroeconomic regime indicators, reflecting the current state of the economy (regime). When judging these results, it is essential to be aware of the fact that even a low level of return predictability enables investors to improve their asset allocation decisions (Campbell and Thompson, 008). However, the vast majority of studies analyzes return predictions only for the overall U.S. stock market (S&P500) and investigates performance gains only for a two-asset-portfolio consisting of the U.S. stock market (S&P500) and the risk-free rate (Goyal and Welch, 008; Rapach et al., 010; Cenesizoglu and Timmermann, 01; Neely et al. 014; Hammerschmidt and Lohre, 014). In our study, we focus on industry return forecasts, because we expect industry returns to deviate substantially during the economic cycle, offering benefits from shifting funds between different industries over time based on current market conditions. So far, only very few studies forecast industry returns. Ferson and Harvey (1991) and Ferson and Korajczyk (1995) analyze in-sample predictability of industry returns for a small set of lagged 4 Combinations are either simple averages of forecasts or weighted averages based on the forecast performance during a holdout period. Both approaches were shown to have significant out-of-sample predictive power for forecasting the S&P500 during the 1951 to 011 period (Rapach et al., 010). 5 For instance in a sense that coefficients in predictive regressions are set to zero if they do not match the theoretically expected sign, thereby reducing estimation error and improving out-of-sample forecast performance. 6 The basic idea of using principal components for return prediction is to extract a smaller set of uncorrelated factors of a usually large set of correlated predictors thereby filtering out noise.
8 6 predictive variables. Rapach et al. (015) analyze industry interdependencies based on lagged returns of all other industries. We expect to provide superior industry level forecasts and consequently enhanced portfolio benefits for investors when using fundamental and macroeconomic variables as well as technical indicators simultaneously.. PORTFOLIO OPTIMIZATION MODELS Most important for investors is whether return forecast models result in higher riskadjusted returns when used to guide asset allocation decisions. Most studies analyzing the economic value of equity market forecasts are based on the Markowitz (195) mean-variance (MV) framework to compute the optimal portfolio weights for a two asset-portfolio consisting of the U.S. stock market (S&P500) and the risk-free rate. However, the traditional Markowitz (195) optimization framework usually performs poorly in portfolios with more than two assets due to estimation error maximization (Michaud, 1989), corner solutions (Broadie, 1993), and extreme portfolio reallocations (Best and Grauer, 1991). In the literature, several variations and extensions of MV are proposed which range from imposing portfolio constraints (Frost and Savarino, 1988; Jagannathan and Ma, 003; Behr et al., 013) to Bayesian methods for estimating the MV input parameters (Jorion 1985, 1986; Pastor, 000; Pastor and Stambaugh, 000). DeMiguel et al., (009) find that for historical average return forecasts no optimization model outperforms a naïve diversified 1/N benchmark. In contrast, Bessler et al., (015) provide evidence that the BL-model significantly outperforms MV and 1/N for multiasset portfolios because it accounts for uncertainty in return forecast. Consequently, we primarily rely on the BL-model to compute optimal asset allocations based on return forecasts. As robustness check, we also compute traditional Markowitz (195) and Bayes-Stein (Jorion, 1985, 1986) portfolios and compare them to the BL model. While Markowitz mean-variance optimization implicitly assumes perfect forecasts with no estimation error, the BL model accounts for estimation error in return forecasts and
9 7 allows for including the reliability of each forecast, which we measure as the historical mean squared forecast error (MSFE). The BL model employs a reference portfolio (benchmark) in which the model invests if forecast errors for all assets are (infinitely) large. With increasing forecast precision, the BL optimal portfolio weights deviate more strongly from the benchmark. For perfect forecasts, the BL optimal weights converge to the Markowitz portfolio weights. The BL model combines return forecasts ( views ) with implied returns. Implied returns are computed from the portfolio weights of the reference portfolio using a reverse optimization technique (Black and Litterman, 199). The combined return estimate is a matrixweighted average of implied returns and forecasts incorporating the reliability of each forecast. It is computed as: ˆ P' P P' Q, ( 6) BL in which П is the vector of implied asset returns, Σ is the covariance matrix, and Q is the vector of the return estimates. Ω is a diagonal matrix and contains the reliability of each forecast. P is a binary matrix which contains the information for which asset a return forecast is employed. 7 The parameter τ controls the level of deviation from the reference portfolio. The posterior covariance matrix is derived as (Satchell and Scowcroft, 000): BL 1 1 P' P 1. (7) After computing combined return estimates and the posterior covariance matrix a traditional risk-return optimization is conducted, maximizing the investor s utility as presented 7 The BL model also allows to stay neutral for some assets and not to provide forecasts for these assets. In our analysis we compute forecasts for all assets.
10 8 in equation (8). max U ' BL ', (8) where μ BL is the BL combined return forecast, ϖ is the vector of portfolio weights, δ is the risk aversion coefficient and Σ is the covariance matrix of asset returns. 3. Data In this Section we present the industry data (3.1.) and describe the predictive variables (3..) that we employ to compute industry return forecasts. 3.1 INDUSTRY DATA We use the following six different industry indices based on data from Thomson Reuters Datastream that begins in 1973: 8 Oil and Gas, Manufacturing, Consumer Goods & Services, Health Care, Technology & Telecommunication, and Financials. To compute technical indicators one year of data is required so that our evaluation period for the in-sample analysis ranges from January 1974 to December 013 (480 monthly observations). Table I Panel A presents summary statistics of monthly industry returns for the full sample. Health Care displays the highest average monthly returns (0.99%) followed by Oil & Gas (0.98%), while Consumer Goods & Services and Financials provide the lowest average returns with 0.88% and 0.90%, respectively. All industry-return time series exhibit a negative skewness and a substantial level of excess kurtosis so that all null-hypotheses of normally distributed 8 Thomson Reuters Datastream computes ten industry indices. We aggregate related industries in order to reduce complexity. More precisely, our Manufacturing index comprises the Datastream indices Basic Materials, Industrials and Utilities. Our Consumer Goods & Services index comprises the Datastream indices Consumer Goods and Consumer Services. Our Technology & Telecommunication index comprises the Datastream indices Technology and Telecommunication. We aggregate indices computing market-value weighted returns and market-value weighted fundamental data.
11 9 stock returns are rejected. The correlation matrix in Table I Panel B indicates significantly positive correlations among all industry index returns with inter-industry correlation coefficients ranging from 0.44 to 0.85, thus, offering only moderate diversification opportunities. Table I Panel C provides the market value weights of the industry indices in per cent of the overall market as of the 31 st of December of 013. [Table I about here] 3. PREDICTIVE VARIABLES To forecast industry and overall stock market returns we include 19 predictive variables. Table II contains a description of the variables along with their abbreviations and data source. The predictive variables are grouped into fundamental and interest rate related variables (Panel A), macroeconomic variables (Panel B), and technical indicators (Panel C). The group of fundamental and interest rate related variables are widely tested in the literature (Goyal and Welch, 008). 9 Based on previous empirical evidence we employ the industry dividend-yield and the industry earnings-price ratios as fundamental variables, reflecting the sector profitability and providing some predictive power for the overall stock market (Dow, 190; Fama and French, 1988, 1989; Ang and Bekaert, 007). We include the variance of daily industry returns as volatility has some predictive power for the U.S. stock market (Guo, 006). The employed interest-rate related variables are the returns of long-term U.S. government bonds, the term-spread, and the default return spread. The term structure of 9 The extended Goyal and Welch (008) dataset is available at: hec.unil.ch/agoyal/. We cannot use the full Goyal and Welch (008) dataset as it contains mostly market wide factors rather than industry specific variables. The excluded fundamental variables due to data restrictions include the corporate equity activity, the book-to-market ratio as well as the dividend payout ratio. Moreover, we do not include bond yields (long-term yield and default yield), as we expect the information of these variables to be already captured in the employed bond returns (long term return and default return spread).
12 10 interest rates contains implied forecasts of future interest rates and the term spread effectively predicts stock returns (Campbell, 1987). The default yield spread also offers predictive power (Keim and Stambaugh, 1986; Fama and French, 1989) because it usually widens during economic recessions and narrows during expansions due to changes in (perceived) default risk. The group of macroeconomic variables includes the inflation rate, the unemployment claims, the industrial production, the Chicago Fed National Activity index, building permits, the trade weighted dollar index, and the oil price. All macroeconomic variables are indicators for the overall state of the economy. 10 There is evidence that common stock returns and inflation are negatively correlated (Nelson, 1976; Fama, 1981). The unemployment claims is an early indicator for the job market. It usually increases during economic recessions and therefore should be negatively related to future stock returns. The industrial production index measures real output for all facilities located in the United States, including manufacturing, mining, electric, and gas utilities (Board of Governors of the Federal Reserve System, 013). It is an indicator for industrial growth and therefore positively related to industry stock returns. The Chicago Fed National Activity index (CFNAI) is designed to gauge overall economic activity by weighting 85 monthly national economic activity indicators. A positive (negative) index indicates growth above (below) trend (Chicago Fed, 015). 11 Because the housing market is generally the first economic sector to rise or fall when economic conditions improve or deteriorate, building permits are supposed to be a valuable indicator for the overall stock market and sector returns. The trade weighted dollar index reflects the strength of the dollar relative to major foreign currencies, with changes affecting the export and import activ- 10 The macroeconomic data is from the St. Louis Fed s FRED database The CFNAI is constructed to have an average value of zero and a standard deviation of one.
13 11 ity of U.S. companies and subsequently revenues and stock prices. Oil is an important production and cost factor and a declining oil price usually increases company earnings and stock prices. Inflation, the industrial production index, and building permits are available on a monthly basis for the previous month. We include two lags to avoid any forward-looking bias. The Chicago Fed National Activity Index is published for the previous or antepenultimate month. We include three lags for the CFNAI to make sure that forecasts are computed only based on data available at each point in time. The initial claims of unemployment and the trade weighted U.S. dollar index are published on a weekly basis by the St. Louis Fed s FRED and are lagged by one month in line with the fundamental and technical variables. The third group of predictive variables includes technical indicators using information on investor behavior. Neely et al. (014) suggest that adding technical indicators improves return forecasts for the overall U.S. stock market (S&P 500). As technical trend-following indicators we employ moving-averages, momentum, and volume-based signals for forecasting industry returns (Neely et al., 014; Sullivan et al., 1999) as well as the relative strength and the relative strength index (Wilder, 1978). [Table II about here] Table III Panel A provides summary statistics for the monthly predictive variables for the period from December 1973 to December 013. Note that fundamental and technical variables are distinct for each industry. For brevity, we only present summary statistics for the fundamental and technical variables for the Oil & Gas industry as these are quite similar for other industries. Since we use the log difference for virtually all fundamental and macroeconomic variables, autocorrelation is not a concern for most variables and no autocorrelation coefficient exceeds Table III Panel B presents the correlation matrix of predictive varia-
14 1 bles. All correlation coefficients have an absolute value below 0.85, indicating that the predictive variables capture different information. [Table III about here] 4. Empirical Results on Industry Return Predictions To analyze the individual predictive power of different variables in forecasting monthly industry returns, we start by computing bivariate predictive regressions. We analyze the predictive power of individual variables in-sample and out-of-sample. For brevity we only present the results of the out-of-sample analysis since out-of-sample predictability is more relevant for investors (Neely et al. 014). 1 The results for the in-sample analyses are very similar. 4.1 OUT-OF-SAMPLE PREDICTIVE POWER OF INDIVIDUAL VARIABLES To compute out-of-sample forecasts, we divide the full sample into an initial estimation sample and an out-of-sample evaluation sample. For each of the predictive variables described in Section 3, we run the following bivariate predictive regression individually. 13 r (1) t X t 1 t The initial estimation sample ranges over 10 months (10 years). Additionally, we employ a 60 months holdout period to evaluate different forecast models on an ex ante basis. Therefore, our out-of-sample evaluation period ranges from January 1989 to December In-sample predictability does not imply that investors can exploit return predictions to generate a superior portfolio performance. For instance, the relation between a predictive variable and future returns may not be stable over time and therefore cannot be used to improve performance 13 One monthly observation is lost due to the distinct time-index on both sides of the predictive regression equation (1).
15 13 We compute 1-months-ahead out-of-sample forecasts recursively by re-estimating the forecast models for each month of the out-of-sample evaluation period using an expanding estimation window. To avoid any forward-looking bias, we only use data available until month (t) to compute forecasts for the subsequent month (t+1). The out-of-sample predictability test builds on the mean squared forecast error (MSFE) of a prediction model (i) compared to the MSFE of the historical cumulative average (HA) forecast (Campell and Thompson, 008). The historical average (HA) forecast is a very stringent out-of-sample benchmark and most forecasts based on bivariate predictive regressions typically fail to outperform the historical average (Goyal and Welch, 003, 008). The Campell and Thompson (008) outof-sample R (R OS ) measures the proportional reduction in MSFE of the predictive regression forecast relative to the historical average. We compute R OS according to equation 3: R OS MSFE(rˆ t ) 1 1 MSFE(r ) t T (r t T 1 t 1 T (r t T 1 t 1 rˆ ) t t r ), (3) where r t is the actual return, r t is the forecast of the prediction model, and r t is the historical cumulative mean return. A positive R OS indicates that the predictive regression forecast exhibits a lower MSFE than the historical average. Monthly R OS are generally small due to the large unpredictable component in stock returns. However, a monthly R OS of 0.5% is economically significant adding value to investors (Campell and Thompson, 008). To test the statistical significance of R OS, we compute the Clark and West (007) MSFE-adjusted statistics which allows to test
16 14 significant differences in prediction error between the historical average forecast and a prediction model. It accounts for the usually higher level of noise in return forecasts compared to the historical cumulative average. 14 Table IV presents the results for the out-of-sample analysis. [Table IV about here] As Goyal and Welch (008), we find negative R OS statistics for the majority of fundamental and interest related variables, indicating that the bivariate predictive regression forecasts fail to outperform the historical average in terms of MSFE. For some predictive varia- bles (e.g. SVAR for Oil & Gas) the R OS statistic is negative while at the same time the MSFEadjusted t-statistic is positive. This is a well-known phenomenon and stems from the fact that the MSFE-adjusted statistic accounts for the higher volatility in predictive regression forecasts compared to the historical average (Clark and West, 007; Neely et al., 014). The most promising predictive variables are the initial claims of unemployment, the trade weighted dollar index, and the Chicago Fed National Activity Index. In addition, for some industries the production index, the oil price, the stock variance and technical indicators significantly outperform the historical averages. Overall, the forecast power of individual predictive variables seems rather limited. We find only little predictive power for fundamental ratios and technical indicators, which - at a first glance - seems contradicting the results of Neely et al. (014). However, a possible explanation is that we analyze a shorter period starting only in 1973, 14 More precisely, we test the null hypothesis that the historic average MSFE is less or equal to the MSFE of the prediction model against the one-sided alternative hypothesis that the historic average MSFE is greater than the MSFE of the prediction model. The Clark and West (007) MSFE-adjusted statistic allows testing statistical significant differences in forecasts from nested models. It is computed as the sample average of f t+1 and its statistical significance can be computed using a one-sided upper-tail t-test: f t (rt rt ) (rt rˆ t ) (rt rˆ t )
17 15 while Neely et al. (014) begin in Most likely, financial markets have become more efficient over the last 60 years, limiting the predictive power of technical and fundamental indicators. Moreover, since our sample size is substantially smaller, the statistical power of detecting predictability based on predictive regressions is lower. However, we find statistically significant and economically relevant (R exceeding 0.5%) predictive power for at least one technical indicator for each industry. Therefore, combining several different predictive variables in multivariate models and including technical indicators might enhance the forecast performance. Multivariate models are discussed in the next Section. 4. MULTIVARIATE PREDICTION MODELS We now explore the predictive power of various competing multivariate prediction models. We expect that the predictive power of a forecast model is enhanced when employing several predictive variables jointly in a multivariate model. However, employing all 19 variables simultaneously in an OLS model likely generates poor out-of-sample forecasts for three reasons: First, including all variables probably results in a relatively high level of estimation error due to the large number of coefficients that have to be estimated. Second, different predictive variables might partly capture the same underlying information and the potential correlations between individual predictive variables might lead to unstable and biased coefficient estimates. Third, not all predictive variables might be relevant for all industries. While it is possible to draw inferences based on economic theory which predictive variables should be most relevant for a specific industry, some relations might be less obvious. Simply picking the best variables for each industry based on the forecast-ability for the overall sample clearly incorporates a look-ahead bias and therefore is not adequate for our out-of-sample (ex ante) approach. Consequently, we allow all variables to be included in the forecast model for each industry. To circumvent the potential problems when using OLS we employ alternative multivariate approaches and compare their performance. All multivariate prediction models are
18 16 computed recursively based on data available until the month (t) to compute forecasts for the subsequent month (t+1) for each month of the out-of-sample evaluation period using an expanding estimation window. As robustness check, we also compute forecasts based on a 10 months rolling estimation window and obtain very similar results. We include OLS with all predictors as a benchmark model. The remainder of this section presents the employed multivariate prediction models Model Selection based on Information Criteria The first approach for selecting the best model from a large set of potential predictive variables builds on information criteria. As in Pesaran, Timmermann (1995), Bossaerts and Hillion (1999) and Rapach and Zhou (013), we let the Schwarz information criterion (SIC) decide on the best model in that we allow up to three predictors of any combination in the model. At each point in time, we calculate the Schwarz's Bayesian Information Criterion (SIC) for each of the alternative models and select the model with the smallest information criterion for forecasting the next period. This approach simulates the investor's search for a forecasting model by applying standard statistical criteria for model selection. Different variables might be selected for different industries and the variables included in the forecast model might vary over time, due to re-selecting the optimal combination of variables based on the SIC in each month. 4.. Predictive Regression via the LASSO Tibshirani (1996) develops a least absolute shrinkage and selection operator (LASSO) which is designed for estimating models with numerous regressors. LASSO is a regularization technique which performs linear regression with a penalty term that constrains the size of the estimated coefficients. It generally shrinks OLS regression coefficients towards zero and some coefficients are shrunk to exactly zero (Tibshirani, 1996). Therefore, LASSO performs variable selection, alleviates the problem of coefficient inflation due to multicollinearity and
19 17 produces shrinkage estimates with potentially higher predictive power than ordinary least squares. The LASSO estimates are defined by T K ( ˆ, ˆ) arg min rt X t 1 ' k (5) t 1 k 1 Where λ is the regularization parameter, T is the number of observations, X t-1 contains the predictive variables and r t is the return in the subsequent period (the prediction target). To compute industry return forecasts, we run a predictive regression based on the LASSO coefficients for each industry and in each month Predictive Regressions based on Principal Components The third approach is a prediction based on principal components. The basic idea is to reduce the large set of potential predictive variables and to extract a set of uncorrelated latent factors (principal components) that capture the common information (co-movements) of the predictors. Thereby model complexity is reduced and noise in the predictive variables is filtered out, reducing the risk of sample overfitting (Ludvigson and Ng, 007; Neely et al. 014, Hammerschmidt and Lohre, 014). The principal component forecast is computed based on a predictive regression on these first principal components: K r t F 1 k 1 k k,t, (5) where F k,t is the vector containing the k th principal component. For the U.S. stock market, Neely et al. (014) report that the principal components forecast based on fundamental or technical variables significantly outperforms the historical average forecast. We compute the first principal components based on standardized predictor variables. A critical issue is the selection of the optimal number of principal components to include in predictive regressions. We let the Schwarz information criterion (SIC) decide on the optimal number of principal components at each point in time and for each industry.
20 Target Relevant Factors Principal components identify latent factors with the objective to explain the maximum variability within predictors. A potential drawback of this approach is that it ignores the relationship between the predictive variables and the forecast target. Partial least squares regression (PLS) pioneered by Wold (1975) aims to identify latent factors that explain the maximum variation in the target variable. Kelly and Pruitt (013, 014) extend PLS to what they call a three-pass regression filter (3PRF) for estimating target-relevant latent factors. In a simulation study and two empirical applications Kelly and Pruitt (014) show that the 3PRF achieves a high forecast performance outperforming competing approaches such as principal components. We employ the 3PRF to extract one target relevant factor from the set of 19 predictive variables for each industry in each month. Therefore, the target relevant factor may include different predictive variables over time and for each industry. To compute industry return forecasts, we run a predictive regression on the target relevant factor for each industry in each month Forecast Combinations Bates and Granger (1969) report that combining forecasts across different prediction models often generate forecasts superior to all individual forecasts. If individual forecasts are not perfectly correlated, i.e. different predictive variables capture different information on the overall economy or industry conditions, the combined forecasts are less volatile and usually have lower forecast errors (Hendry and Clements, 006; Timmerman, 006). An intuitive way of using the predictive power of several predictive variables is combining the forecasts of the individual bivariate predictive regressions. The simplest form to merge individual forecasts is simple averaging, which means that each forecasts obtains a weight of ω=1/k, where K is the number of forecasts. Bates and Granger (1969) propose to choose forecast weights that minimize the histor-
21 19 ical mean squared forecast error (optimal combination). However, a number of empirical applications suggest that this optimal combination approach usually does not achieve a better forecast compared to the simple average of individual forecasts (Clemen, 1989; Stock and Watson, 004). 15 Stock and Watson (004) and Rapach et al., (010) employ mean squared forecast error (MSFE) weighted combination forecasts, which weighs individual forecasts based on their forecasting performance during a holdout out-of-sample period. 16 Rapach et al., (010) find that simple and MSFE-based weighted combination forecast outperform the historical average in forecasting the U.S. equity market risk premium. We employ MSFEweighted combination of bivariate predictive regressions to forecast industry returns. Additionally, we employ a variable selection process ensuring that the combination forecasts contain only relevant variables. The variable selection process is based on the ability of a predictive variable to significantly predict returns. Variables are selected on an ex ante basis. That is, for the decision whether a specific variable is included in forecasting the return for the subsequent period (t+1), we rely on the bivariate predictive regression including returns until the current period [0, t]. A variable is only included in the combination forecast if its regression coefficient estimate is significant at the 10%-level, using robust (Newey-West) standard errors. All significant variables are then used to compute forecasts based on bivariate predictive regressions, which are subsequently pooled to obtain a MSFE-weighted combination. Forecasts are not only expected to improve when combining forecasts of bivariate re This stylized fact is termed the forecast combining puzzle because in theory it should be possible to improve upon simple combination forecasts. MSFE-based weighted combination forecasts are equivalent to optimal combination forecasts when correlations between different forecasts are neglected.
22 0 gressions based on different predictive variables but also when combining forecasts of different forecast models. In this spirit, we compute a consensus forecast that simply combines all aforementioned forecast models by taking the simple average of all forecasts. 4.3 OUT-OF-SAMPLE PREDICTIVE POWER OF MULTIVARIATE MODELS Combining the predictive power of fundamental, macroeconomic, and technical variables should result in superior forecasts. Table V presents the findings for the multivariate forecast models in which all variables are included. The employed forecast model is displayed in the first column of table V. Comparing the forecast performance for different industries, it is evident that the returns of some industries (e.g., Oil & Gas) are better predictable than the returns of others (e.g. Healthcare). For the Oil & Gas (Consumer Goods & Services) industry, seven (six) out of eight prediction models significantly outperform the historical average in forecasting future returns. For the Manufacturing, the Technology & Telecommunication, and the Financial Industries, the target relevant factor (3PRF) approach and the MSFE-weighted forecast combination model (FC-MSFE-w.avrg) outperform the historical average significantly. For the Healthcare industry, no prediction model outperforms the historical average at significant levels (for the reasons mentioned above). However, the vast majority of multivariate prediction models achieve positive MSFE-adjusted t-statistics, indicating an outperformance compared to the historical average after controlling for noise in forecasts. [Table V about here] Comparing the forecast accuracy of different prediction models, we find that the best forecast models are the target-relevant factor approach (3PRF) and the MSFE-weighted forecast combination model (FC-MSFE-w.avrg). For the overall stock market and for five out of six industries, they generate statistically significant superior forecasts compared to the cumu- lative historical average. The forecasts are also economically valuable, indicated by the R OS statistics above the 0.5% benchmark. Pre-selecting relevant variables before computing a
23 1 forecast combination does not seem to add value relative to the forecast combination model that simply includes all variables. For all industries, the variable selection model (FC-VS- MSFE-w.avrg) provides lower adjusted MSFE-statistics than the forecast combination model with all variables (FC-MSFE-w.avrg). The regularization technique (LASSO), which shrinks coefficients towards zero to alleviate coefficient inflation and to perform variable selection, generates positive and econom- ically significant R OS statistics (above the 0.5% benchmark) for three out of six industries. The MSFE-adjusted t-statistic is positive for all industries and the market indicating that the LASSO forecast outperforms the historical average for all industries. However, this effect is only statistically significant for the Oil & Gas industry. The results of the principal components (PC) forecast are similar to those of the LASSO. Positive adjusted MSFE-statistics indicate that the PC-forecasts outperform the historical average (after controlling for noise) for four of six industries and the market. However, only for two industries the outperformance is statistically significant (Oil & Gas and Consumer Goods & Services). The consensus forecast, which is a simple average of all multivariate models, is also very promising. It generates economically significant forecasts for the market index and all industries except for the Healthcare sector. For the Oil & Gas, the Consumer Goods & Services, and the Technology & Telecommunication industry the consensus forecast outperforms the historical average at statistically significant levels. The simple multivariate OLS model and the model selection based on the Schwarz in- formation criteria (SIC) generate the noisiest estimates with negative R OS statistics for most industries as well as for the overall stock market index. However, the MSFE-adjusted t- statistic, which controls for higher noise in the return prediction, is positive for most industries, indicating that the forecasts are superior to the historical average forecast in most cases and may add economic value when included in asset allocation decisions. OLS outperforms
24 the historical average at statistical significant levels for two of the six industries. 5. Asset Allocation Strategies with Return Forecasts Our analyses of the forecast performance based on MSFE in the previous section provide promising insights that, in contrast to most literature and our own hypothesis, using well specified prediction models may add value. The most important and essential question for investors, however, is whether using these return forecast models in asset allocation decisions results in higher risk-adjusted returns. Interestingly, Cenesizoglu and Timmermann (01) suggest that although return prediction models may produce higher out-of-sample mean squared forecast errors, they may still add economic value when used to guide portfolio decisions. Therefore, we analyze the benefits of multivariate forecast models to investors when used in asset allocation models. 5.1 PORTFOLIO OPTIMIZATION PROCEDURE We primarily rely on the BL-model to compute optimal asset allocations based on return forecasts and compute traditional Markowitz (195) and Bayes-Stein (Jorion, 1985, 1986) portfolios as robustness check. Our approach is as follows: We use the monthly industry-level return forecasts resulting from multivariate regression models to compute monthly BLoptimized portfolios. Then, we evaluate the portfolio performance of each forecast model compared to the historical average forecast and relative to the market portfolio and relative to a passive equally-weighted (1/N) portfolio for the full sample and for sub periods. DeMiguel et al. (009) reports that the 1/N portfolio is a stringent benchmark and many asset allocation models fail to outperform this naïve benchmark. One might argue that the long term character of our asset allocation exercise requires a dynamic portfolio strategy derived from optimizing a long-term objective function. However, Diris et al. (015) show that the much simpler single-period portfolio optimization problem performs almost equally for moderate levels of risk aversion. Therefore, we limit our analysis to single-period portfolio optimization strategies
25 3 which are updated on a monthly basis when new information becomes available. Following Campbell and Thompson (008) and Neely et al. (014), we estimate the covariance matrix based on a rolling estimation window of 60 months and use a risk aversion coefficient of While several methods were proposed to estimate asset variances and covariances more elaborately, in this study we focus on return forecast and employ a standard sample estimate for the covariance matrix. This approach is also supported by Lan (014) who shows that for improving the portfolio performance it is more important to include a timevarying risk premium than time-varying volatility. The reliability of each forecast Ω is measured as the mean squared forecast error (MSFE) of each forecast using a 60 months rolling estimation window. Since we use the 1/N portfolio as benchmark to evaluate performance, the 1/N-portfolio is also the reference portfolio used to compute implied returns for the BL model. The parameter τ, which controls for the level of deviation from the benchmark, is set to PERFORMANCE EVALUATION To evaluate the performance of industry-level forecasts in an asset allocation framework several performance measures are employed. We compute the portfolio s average outof-sample return and volatility as well as the Sharpe ratio as the average excess-return (average return less risk-free rate) divided by the volatility of out-of-sample returns. We test if the For alternative risk aversion coefficients of and 10 we obtain similar results. This is in line with Bessler et al. (015). Earlier studies use similar values ranging from 0.05 to 0.3 (Black and Litterman, 199; Idzorek, 005).
26 4 difference in Sharpe ratios of two portfolios is statistically significant based on the significance test for Sharpe ratios proposed by Opdyke (007). 19 Following Campbell and Thompson (008), Ferreira and Santa-Clara (011), and Neely et al. (014), among others, we measure the economic value of return forecasts based on the certainty equivalent return (CER). The CER for a portfolio is computed according to equation (8). The CER gain is the difference between the CER for an investor who uses a predictive regression forecast for industry returns and the CER for the market portfolio. To compute CER we employ annualized portfolio returns and annualized return volatilities, so that the CER gain can be interpreted as the annual percentage portfolio management fee that an investor would be willing to pay to have access to the predictive regression forecast instead of investing passively in the market portfolio. A drawback of the Sharpe ratio and the CER gain is that both measures only use portfolio returns and volatility ignoring any higher moments. As an alternative, we calculate the Omega measure that is calculated as the ratio of average gains to average losses (Keating and Shadwick, 00), where gains (losses) are returns above (below) the risk-free rate. To measure the trading volume necessary to implement an asset allocation strategy i based on a return forecast model, we compute the portfolio turnover PT i for each strategy as the average absolute change of the portfolio weights ω over the T rebalancing points in time and across the N assets (DeMiguel et al., 009): 19 This test is applicable under very general conditions stationary and ergodic returns. Most importantly for our analysis, the test permits auto-correlation and non-normal distribution of returns and allows for correlation between the portfolio returns.
27 5 T N i,j,t 1 i,j,t 1 PT i, (9) T t 1 j 1 in which ω i,j,t is the weight of asset j at time t in strategy i; ω i,j,t+ is the portfolio weight before rebalancing at t+1; and ω i,j,t+1 is the desired portfolio weight at t+1. ω i,j,t is usually different from ω i,j,t+ due to changes in asset prices between t and t+1. The economic profitability of an active asset allocation strategy critically depends on transaction costs required to implement the strategy. Assuming a realistic level of transaction costs might be challenging because transaction costs typically differ for different investor types (e.g. private and institutional investors). Therefore, we follow Han (006) and Kalotychou et al. (014) and compute break-even transaction costs (BTC). We define BTC as the level of variable transaction costs for which the active investment strategy based on a return forecast model achieves the same certainty equivalent return (CER) as the market portfolio. Hence, the BTC is the level of variable transaction costs that must not be exceeded so that the active investments strategy based on a return forecast model is still superior over a passive investment in the market portfolio. Finally, we evaluate the risk-adjusted performance of the optimized industry portfolios using the Carhart four-factor model (Fama and French, 1993; Carhart, 1997) PERFORMANCE OF INDUSTRY RETURN PREDICTIONS IN PORTFOLIO OP- TIMIZATION We use the monthly industry-level return forecasts resulting from multivariate regression models to compute monthly BL-optimized portfolios. The portfolios consist of the six 0 We use the data from Kenneth French s website, which is available on html#research.
28 6 industry indices and the risk-free rate. To evaluate the contribution of return forecasts we employ four benchmark portfolios: The market portfolio, a passive 1/N buy-and-hold portfolio, which equally weighs all six industry indices and two BL-optimized portfolios, which use either the cumulative return average or a rolling return average for each industry as return forecasts. Table VI provides the performance measures for the four benchmark-portfolios (row 1 to 4) and the asset allocations based on multivariate return forecast models (rows 5 to 1). The underlying return forecast model is displayed in the first column of VIII. We find that all asset allocations based on multivariate return forecast models outperform all benchmark portfolios, which is reflected in higher Sharpe ratios, Omega measures, and certainty-equivalent-ratios. All forecast models yield a significantly larger Sharpe ratios then the market index and all forecast models except for the simple OLS forecast significantly outperform the passive 1/N portfolio. This result is not obvious given our previous analysis of R OS statistics which were not compelling for all forecast models. A weak relation between the statistical out-of-sample forecast evaluation based on MSFE (depicted in table V), and the economic value of a forecast model was already reported by Cenesizoglu and Timmermann (01). Compared to the market and the 1/N portfolio all allocations based on return forecast models enhance the portfolio return. Except for the OLS and the SIC forecast, asset allocations based on forecast models also reduce portfolio risk (volatility) compared to the passive benchmark portfolios,. In line with the analysis based on the MSFE in table V, we find that the best return forecast model is the target-relevant factor approach (3PRF), followed by the consensus and the LASSO forecast, yielding the highest out-of-sample performance and outperforming the market and the passive 1/N portfolio at highly significant levels. Investors would be willing to pay a management fee of 846 (559) basis points per year to invest actively based on the 3PRF (LASSO) forecast model, rather than investing passively in the market portfolio. In line with
29 7 Neely et al. (014) and Hammerschmidt and Lohre (014), we also find a significant outperformance for the principal component forecast model. Investors would be willing to pay a fee of 566 basis points per year to invest actively based on the principal components forecast, rather than investing passively in the market portfolio. The outperformance for the MSFE weighted average forecasts is lower. Investors would be willing to pay a performance fee of 459 basis points per year for the combination forecast including all variables and 515 basis points for the combination forecast which conducts variable selection before computing a MSFE-weighted combination forecast. The required turnovers for the different portfolio models (reported in column 7) vary substantially depending on the forecast models. This is due to the different levels of noise included in the forecast models. The portfolio turnover is highest for the OLS followed by the SIC and the 3PRF forecast, indicating that these models deliver the noisiest return predictions. The MSFE-weighted combination forecast results in the lowest turnover due to the more stable return forecasts over time. The optimal choice of a forecasting model depends also on the level of the transaction costs which are necessary to implement the respective predictionbased asset allocation model. To circumvent problems associated with identifying an adequate level of transaction costs, we compute break-even transaction costs (BTC) that represent the highest level of variable transaction costs for which the performance of the active asset allocation strategy based on the respective forecast model is equal to the performance of the market portfolio. Thus, actual variable transaction costs have to be below the BTC so that investors prefer the active investment strategy based on the respective prediction model to the market portfolio. The last column of table VI presents the BTC for each forecast model. We observe for the MSFE-weighted average forecast that the variable transaction costs must not exceed 09 basis points so that the model performs still better compared to the market portfolio. For the
30 8 principal components (the 3PRF) model, the asset allocation based on forecast models is preferable to the market portfolio as long as the variable transaction costs are lower than 153 (119) basis points. Kalotychou et al. (014) approximate total trading costs to be 7 basis points for institutional investors trading US industry ETFs. This is the sum of average bid-ask spreads for US sector ETFs (5 bp) and market impact costs ( bp). At this realistic level of transaction costs all forecast models are beneficial to investors and the performance ranking of the different return forecast models is the same as shown in table VI. Angel et al. (015) estimate that transaction costs for individual US large-cap stocks are about 40 basis points. This underpins the benefits of using ETFs for the asset allocation. However, the BTC suggest that all predictions models except for the simple OLS forecast would be beneficial compared to the market index even if transaction costs were 40 basis points. [Table VI about here] Finally, we compute Carhart four factor regressions to analyze the risk exposures of the optimized industry-portfolios. The results are presented in table VII. As expected, all industry allocations have a significant risk exposure to the US-stock market and the coefficients for the size ( SMB ) factor are negative, which is due to the fact that the employed industry indices are market-value weighted and therefore overweigh large cap stocks relative to small cap stocks. The value coefficient ( HML ) is slightly positive but insignificant for most prediction models, indicating that the prediction based asset allocations do not follow a growth or value strategy. In contrast, the benchmark strategies 1/N and the BL-optimized portfolios based on the historical cumulative return average have significant exposures to the value-factor. The momentum factor is slightly positive for all strategies indicating a minor overweighting of winner stocks. However, this finding is not significant for all forecast models. Most importantly for our analysis, we observe that all asset allocations based on return forecasts have significant positive four-factor alphas. Hence, they generate abnormal returns and this outper-
31 9 formance cannot be explained by the common risk factors market, size, value and momentum. In support of the previously reported traditional performance measures, the targetrelevant factor approach (3PRF) offers the highest outperformance (0.5% per month), followed by the principal component forecast (0.4% per month), and the consensus forecast (0.4% per month). [Table VII about here] 5.4 PERFORMANCE DURING DIFFERENT MARKET-ENVIRONMENTS As a robustness check, we divide the full evaluation period from January 1989 to December 013 in expansionary and recessionary sub-periods and analyze the industry-level performance in different market-environments. Sub-periods are NBER dated expansions (Exp) and recessions (Rec). Table VIII presents the results. The SIC, the 3PRF, the principal components, the forecast combinations and the consensus forecast outperform the market and the passive 1/N portfolio in all sub-periods, with the 3PRF yielding the highest performance in four of the seven sub-periods. Overall, the sub-period analysis confirms our results for the full period. Particularly, the outperformance of the forecast models seems to hold in expansionary and recessionary market environments. [Table VIII about here] 5.5 ALTERNATIVE OPTIMIZATION MODELS As another robustness check, we implement the return predictions in alternative asset allocation models to analyze whether our results depend on the BL model. Table IX presents the Sharpe ratios for the unconstrained and the short-sale constraint Markowitz (MV) (195), Bayes-Stein (BS) (Jorion, 1985, 1986) and BL model. The asset allocation model is displayed in the header. In the case with short-selling, the BS and MV strategies result in a lower performance for most forecast models due to extreme portfolio allocations with large short positions. For the optimization with short-sale constraint, BS and MV outperform the market port-
32 30 folio and the passive 1/N strategy for most forecast models. The BL model works well with and without short-selling and performs better than BS and MV for almost all prediction models. When short-sales are disallowed, the target-relevant factor forecast provides the highest performance for all asset allocation models. Overall, the results support our major finding that industry-level return forecasts improve portfolio performance over historical averages and passive investments in the market index and equally weighted portfolios (1/N). [Table IX about here] 6. Conclusion This study provides new evidence on the predictability of stock returns by focusing on industry returns. Based on the idea of information efficient capital markets and the previous empirical evidence of mutual fund performance, we start with the idea that industry returns are not predictable and that asset allocations based on return prediction models should not be able to outperform a passive benchmark portfolio. In the first part we investigate in-sample and outof-sample return predictability of industry stock returns with univariate and multivariate prediction models. In the second part we concentrate on optimal asset allocation models based on industry-level return forecasts. We extend the commonly used dataset (Goyal and Welch, 008) by including additional macroeconomic variables such as the initial claims of unemployment, new building permits, the trade weighted dollar index, and the Chicago Fed National Activity Index. Moreover, we employ popular technical indicators such as momentum and moving average (Neely et al., 014) as well as the relative strength and the relative strength index (Wilder, 1978). Based on bivariate prediction models, we observe that the stock variance, the trade weighted dollar index, the initial claims of unemployment, and the Chicago Fed National Activity Index have the strongest individual predictive power for industry return forecasts. In addition, we test competing multivariate prediction models such as OLS, selection via the
33 31 LASSO, principal components, a target-relevant factor approach, and forecast combinations, and then propose a variable selection approach that chooses variables based on their ability to best forecast returns ahead of the evaluation period. Our empirical results suggest that the LASSO and the target-relevant factor approach are the most powerful prediction models. The target-relevant factor (3PRF) approach generates significantly superior forecasts relative to the historical average for five out of six industries. Among the predictive variables the group of macroeconomic variables has the highest predictive power whereas technical and fundamental variables contain only low predictive power. In the second part we evaluate the benefits of the multivariate forecast models to investors when applied in an asset allocation framework. We compare the results to the market portfolio, a passive 1/N portfolio, which equally weighs industry-indices and two dynamic portfolio allocations, which use the expanding (rolling) historical return average of each industry as return forecasts. While earlier studies build on the Markowitz (195) optimization framework to analyze the benefits of forecast models, we rely on the Black-Litterman (BL) asset allocation approach. The Markowitz (195) framework usually performs poorly in portfolios with more than two assets due to estimation error maximization (Michaud, 1989), corner solutions (Broadie, 1993), and extreme portfolio reallocations (Best and Grauer, 1991). In contrast, the Black-Litterman model accounts for uncertainty in return estimates and generates more stable portfolios with a better out-of-sample performance (Bessler et al., 015). The main findings of our analysis are that using industry-level return forecasts in asset allocation decisions results in a superior performance compared to using historical average returns, and it also outperforms the market and a 1/N buy-and-hold portfolio. The outperformance is statistically significant for all tested forecast models. The target-relevant factor (3PRF) and the consensus forecasts achieve the highest portfolio performance. Our results are robust for expansionary and recessionary sub-periods.
34 3 Despite the initial assumption of information efficient capital markets and the previous empirical evidence that mutual fund managers are hardly able to persistently outperform appropriate benchmarks, we provide significant evidence for our sample period, the selected asset classes, and employed asset allocation models that higher risk-adjusted returns can be achieved for the entire sample period as well as for different sub-periods. Our empirical evidence suggests that first, return prediction models for industries generate superior return forecasts, and second, that including these return predictions in portfolio optimization models such as Black-Litterman results in superior asset allocation decisions and consequently in higher risk-adjusted returns for investors. Whether the employed methodologies and approaches will persistently outperform an appropriate benchmark in the future as well as for other asset classes and time periods needs to be further explored. Until then the main hypothesis that performance persistence is difficult to achieve prevails. Asset managers, therefore, need to be cautious when implementing our approach without further analyses. So far we limit our study to US industry indices. Including different asset classes such as world-wide stock and bond indices as well as various commodity groups in asset allocation decisions and using return prediction models for all asset classes may result in even higher risk-adjusted returns. Analyzing return-predictability and portfolio optimization for these asset classes is left for future research.
35 33 References Alan, Y., Gao, G.P., Gaur, V. (014) Does Inventory Productivity Predict Future Stock Returns? A Retailing Industry Perspective, Management Science 60 (10), Ang, A., Bekaert, G. (007) Stock return predictability: is it there? Review of Financial Studies 0 (3), Angel, J.J., Harris, L.E., Spatt, C.S. (011) Equity Trading in the 1st Century, Quarterly Journal of Finance 01 (01), Bates J. M., Granger C.W.J. (1969) Averaging and the optimal combination of forecasts, Operational Research Quarterly 0, Bessler, W., Kryzanowski, L., Kurmann, P, Lückoff, P. (016) Capacity Effects and Winner Fund Performance: The Relevance and Interactions of Fund Size and Family Characteristics, European Journal of Finance,, 1-7. Bessler, W., Blake, D., Lückoff, P., Tonks, I. (014) Why is Persistent Mutual Fund Performance so Difficult to Achieve? The Impact of Fund Flows and Manager Turnover, Working Paper. Bessler, W., Opfer H., Wolff, D. (015) Multi-asset portfolio optimization and out-of-sample performance: an evaluation of Black-Litterman, mean variance and naïve diversification approaches, European Journal of Finance (forthcoming). Bessler, W., Wolff, D. (015) Do Commodities add Value in Multi-Asset-Portfolios? An Outof-Sample Analysis for different Investment Strategies, Journal of Banking and Finance, 60, 1-0 Best, M.J., Grauer, R.R. (1991) On the sensitivity of mean-variance-efficient portfolios to changes in asset means: some analytical and computational results, Review of Financial Studies, Berk J.B., Green R.C. (004) Mutual fund flows and performance in rational markets, Journal of Political Economy, Black, F., Litterman, R.B. (199) Global portfolio optimization, Financial analysts' journal : FAJ 48 (5), Bossaerts, P., Hillion, P. (1999) Implementing statistical criteria to select return forecasting models: what do we learn? Review of Financial Studies 1 (), Broadie, M. (1993) Computing efficient frontiers using estimated parameters, Annals of Operations Research 45 (1-4), Campbell, J.Y., Thompson, S.B. (008) Predicting excess stock returns out of sample: can anything beat the historical average? Review of Financial Studies 1 (4), Campbell, J.Y. (1987) Stock returns and the term structure, Journal of Financial Economics 18 (),
36 34 Carhart, M. M. (1997) On Persistence in Mutual Fund Performance, The Journal of Finance, 5, Cenesizoglu, T., Timmermann, A. (01) Do return prediction models add economic value? Journal of Banking & Finance 36 (11), Clark, T.E., West, K.D. (007) Approximately normal tests for equal predictive accuracy in nested models, 50th Anniversary Econometric Institute 138 (1), Clemen, R.T. (1989) Combining forecasts: a review and annotated bibliography, International Journal of Forecasting 5 (4), Cooper, I., Priestley, R. (013) The world business cycle and expected returns, Review of Finance 17 (3), DeMiguel, V., Garlappi, L., Uppal, R. (009) Optimal versus naive diversification: how inefficient is the 1/N portfolio strategy? Review of Financial Studies (5), Driesprong, G., Jacobsen, B., Maat, B. (008) Striking oil: Another puzzle? Journal of Financial Economics 89() Diris, B., Palm, F., Schotman, P. (014) Long-Term Strategic Asset Allocation: An Out-of- Sample Evaluation, Management Science 61 (9), Dow, C.H. (190) Scientific stock speculation, The Magazine of Wall Street. Fama, E.F. (1981) Stock returns, real activity, inflation, and money, The American Economic Review, 71 (4), Fama, E.F., French, K.R. (1988) Dividend yields and expected stock returns, Journal of Financial Economics (1), 3 5. Fama, E.F., French, K.R. (1989) Business conditions and expected returns on stocks and bonds, Journal of Financial Economics 5 (1), Fama, E.F., French, K.R. (1993) Common risk factors in the returns on stocks and bonds, Journal of Financial Economics 33 (1), Ferreira, M.A., Santa-Clara, P. (011) Forecasting stock market returns: the sum of the parts is more than the whole, Journal of Financial Economics 100 (3), Ferson, W., Sarkissian, S., Simin, T. (003). Is stock return predictability spurious, Journal of Investment Management 1 (3), Ferson, W.E., Harvey, C.R. (1991) The variation of economic risk Premiums, Journal of Political Economy 99 (), Ferson, W. E., Korajczyk, R.A. (1995) Do arbitrage pricing models explain the predictability of stock returns? The Journal of Business 68 (3), Frost, P. A., Savarino J. E. (1988) For better performance: constrain portfolio weights, Journal of Portfolio Management 15 (1), 9 34.
37 35 Giot, P. (005) Relationships between implied volatility indexes and stock index returns, Journal of Portfolio Management, 31, 3, Goyal, A., Welch, I. (008) A comprehensive look at the empirical performance of equity premium prediction, Review of Financial Studies 1 (4), Grinold, R. C., Kahn, R. N. (000) Active portfolio management, McGraw-Hill, New York, second edition. Guo, H. (006) On the out of sample predictability of stock market returns, The Journal of Business 79 (), Hammerschmidt, R., Lohre H. (015) Regime shifts and stock return predictability, Unpublished working paper, University of Zurich. Han, Y. (006) Asset allocation with a high dimensional latent factor stochastic volatility model, Review of Financial Studies 19 (1), Hull, B., Qiao X. (015) A Practitioner's Defense of Return Predictability, Working Paper. Hendry, D.F., Clements, M.P. (004) Pooling of forecasts, Econometrics Journal 7 (1), Idzorek, T.M. (005) A step-by-step guide through the Black-Litterman model, incorporating user specified confidence levels, Chicago: Ibbotson Associates, 1 3. Jagannathan, R., Ma, T. (003) Risk reduction in large portfolios: why imposing the wrong constraint helps, Journal of Finance 58 (4), Jorion, P. (1985) International portfolio diversification with estimation risk, The Journal of Business, 58 (3), Jorion, P. (1986) Bayes-Stein estimation for portfolio analysis, The Journal of Financial and Quantitative Analysis 1 (3), Kalotychou, E., Staikouras, S.K., Zhao, G. (014) The role of correlation dynamics in sector allocation, Journal of Banking & Finance 48, 1 1. Kandel, S., Stambaugh, R.F. (1996) On the predictability of stock returns: an asset allocation perspective, The Journal of Finance 51 (), Keating, C., Shadwick, W.F. (00) A universal performance measure, Journal of Performance Measurement 6 (3), Keim, D.B., Stambaugh, R.F. (1986) Predicting returns in the stock and bond markets, Journal of Financial Economics 17 (), Kelly, B., Pruitt, S. (013) Market expectations in the cross-section of present values, The Journal of Finance 68 (5), Kelly, B., Pruitt, S. (015) The three-pass regression filter: a new approach to forecasting using many predictors, Journal of Econometrics, 186 (), Kothari, S.P., Shanken, J. (1997) Book-to-market, dividend yield, and expected market returns: a time-series analysis, Journal of Financial Economics 44 (),
38 36 Lan, C. (014) An out-of-sample evaluation of dynamic portfolio strategies, Review of Finance. Ludvigson, S.C., Ng, S. (007) The empirical risk return relation: A factor analysis approach, Journal of Financial Economics 83 (1), 171. Maio, P. (013) The fed model and the predictability of stock returns, Review of Finance 17 (4), Markowitz, H. (195) Portfolio selection, The Journal of Finance 7 (1), Michaud, R.O. (1989) The Markowitz optimization enigma: is optimized optimal? 45 (1), Neely, C.J., Rapach, D.E., Tu, J., Zhou, G. (014) Forecasting the equity risk premium: the role of technical indicators, Management Science 60 (7), Nelson, C.R. (1976) Inflation and rates of return on common stocks, The Journal of Finance 31 (), Opdyke, J.D. (007) Comparing sharpe ratios: so where are the p-values? Journal of Asset Management 8 (5), Pastor, L. (000) Portfolio selection and asset pricing models, Journal of Finance 50, (1), Pastor, L., Stambaugh R. F. (000) Comparing asset pricing models: an investment perspective, Journal of Financial Economics 56 (3), Pesaran, M.H., Timmermann, A. (1995) Predictability of stock returns: robustness and economic significance, The Journal of Finance 50 (4), Pettenuzzo, D., Timmermann, A., Valkanov, R. (014) Forecasting stock returns under economic constraints, Journal of Financial Economics 114 (3), Pontiff, J., Schall, L.D. (1998) Book-to-market ratios as predictors of market returns, Journal of Financial Economics 49 (), Rapach, D.E., Strauss, J.K., Zhou, G. (010) Out-of-sample equity premium prediction: combination forecasts and links to the real economy, Review of Financial Studies 3 (), Rapach, D., Zhou, G. (013) Forecasting stock returns, Handbook of Economic Forecasting, First Edition, Rapach, D., Strauss, J., Tu, J., Zhou, G. (015) Industry interdependencies and cross-industry return predictability, Working Paper, 1 6. Satchell, S., Scowcroft, A. (000) A demystification of the Black Litterman model: managing quantitative and traditional portfolio construction, Journal of Asset Management 1 (),
39 37 Shiller, R.J. (1981) Do stock prices move too much to be justified by subsequent changes in dividends? American Economic Review (71), Stock, J.H., Watson, M.W. (004) Combination forecasts of output growth in a seven-country data set, Journal of Forecasting 3 (6), Sullivan, R., Timmermann, A., White, H. (1999) Data snooping, technical trading rule performance, and the bootstrap, The Journal of Finance 54 (5), Tibshirani, R. (1996) Regression shrinkage and selection via the Lasso, Journal of the Royal Statistical Society. Series B (Methodological) 58 (1), Wilder, J.W. (1978) New concepts in technical trading systems, Trend Research. Wold, H. (1975) Estimation of principal components and related models by iterative least squares, in: P.R. Krishnaiaah, Ed., Multivariate Analysis, Yu, J. (011) Disagreement and return predictability of stock portfolios, Journal of Financial Economics 99 (1), Zorn, J., Lawrenz, J. (015) Predicting International Stock Returns with Conditional Price- Earnings Ratios, Working Paper.
40 36 Table I: Descriptive statistics for industry indices Panel A: Summary statistics Market Oil & Gas Manufact Con.Gds&Sv Health Care Tech & Tele Financials Mean 0,89% 0,98% 0,96% 0,88% 0,99% 0,91% 0,90% Median 1,4% 1,09% 1,05% 1,10% 1,3% 1,0% 1,33% Max 16,17% 19,4% 15,08% 18,38% 4,37% 1,37% 4,11% Min -3,6% -1,0% -1,5% -31,67% -19,57% -6,98% -4,06% Std. Dev. 4,53% 5,54% 4,66% 5,16% 4,59% 5,83% 5,77% Skewness -0,711-0,17-0,558-0,736-0,83-0,67-0,600 Kurtosis 5,585 4,59 5,704 6,737 5,730 5,347 5,730 Jarque-Bera 174.4*** 35.55*** *** 33.36*** *** *** 178.3*** Obs Panel B: Correlation matrix Market 1 Oil & Gas 0.66*** 1 Manufact 0.93*** 0.67*** 1 Con.Gds&Sv 0.91*** 0.49*** 0.85*** 1 Health Care 0.80*** 0.44*** 0.71*** 0.7*** 1 Tech & Tele 0.86*** 0.46*** 0.74*** 0.76*** 0.56*** 1 Financials 0.86*** 0.51*** 0.83*** 0.80*** 0.74*** 0.63*** 1 Panel C: Relative market value of industry indices compared to market value of market index Index weight 100,00% 10,81% 18,% 4,69% 11,17% 17,11% 18,00% Notes. Panel A provides summary statistics of the industry index returns during the period from January 1974 to December 013 covering 480 months. Panel B provides the correlation matrix for the industry index returns during the period from January 1974 to December 013. *, **, *** indicate values significantly different from 0 at the 10%, 5% and 1%-level, respectively. Panel C provides the relative market value of the industry indices compared to the market value of the overall market index.
41 37 Table II: Predictive variables Panel A: Fundamental and interest related variables Variable Abb. Source Description Dividend yield DY Thomson Reuters Datastream Log change of the industry dividend yield. The industry dividend yield is the market-value weighted average of companies dividend yields in the industry index. Earningsprice ratio Stock variance Long-term return EP SVAR LTR Thomson Reuters Datastream Own calculation based on Datastream data Goyal and Welch (008) ext. dataset Log change of the reciprocal of the industry price-earnings ratio (PE) The industry PE-ratio is the market-weighted average of companies price-earnings-ratios in the industry index. Sum of squared daily returns of the industry indices. Daily industry price data is from Thomson Reuters Datastream. Return of long-term U.S. government bonds. Term spread TMS Goyal and Welch (008) ext. dataset Difference between the long-term U.S. government bond yield and the U.S. T-bill-rate. Default return spread DFR Goyal and Welch (008) ext. dataset Return of long-term AAA and BAA-rated corporate bonds minus the long-term government bond return. Panel B: Macroeconomic variables Variable Abb. Source Description Inflation INFL St. Louis Fed s Continuous growth rate of the Consumer Price Index (CPI) for FRED database urban consumers. Unemployment Claims CLAIMS St. Louis Fed s FRED database Log change of the continuous growth rate of the seasonally adjusted number of initial claims of unemployment. Industrial production INDP St. Louis Fed s FRED database Continuous growth rate of the U.S. industrial production index. Chicago Fed National Activity Index CFNAI St. Louis Fed s FRED database Monthly indicator of the overall economic activity. It is compiled by the Chicago Fed based on 85 existing monthly indicators of economic activity. It has a target average value of zero and a target standard deviation of 1. A positive (negative) CFNAI value indicates growth above (below) the trend growth in the economy. Building Permits PERMITS St. Louis Fed s FRED database Continuous growth rate of new private housing units in the U.S. that have received building permits (seasonally adjusted). Trade Weighted U.S. Dollar Index FEX St. Louis Fed s FRED database Oil price OIL Thomson Reuters Datastream Continuous growth rate of the dollar index, which is a tradeweighted average of the foreign exchange value of the U.S. dollar against a subset of the broad index currencies including the Euro Area, Canada, Japan, United Kingdom, Switzerland, Australia, and Sweden. Continuous growth rate of the crude oil price (BRENT).
42 38 Panel C: Technical indicators Variable Abb. Source Description Movingaverage MA Own calculation based on Datastream data Indicator that compares the actual industry index prices with a 1-months moving average of the previous industry index prices. It generates a buy (1) signal if the actual industry index is above or equal to the long-term moving average and a sell (0) signal if the actual industry index is below the long-term moving average. Momentum MOM Own calculation based on Datastream data Indicator generating a buy signal (1) if the actual industry index trades above or is equal to the level the index traded 1 months ago and a sell (0) signal if the index currently trades below the level it traded 1 months ago Volumebased signal VOL Own calculation based on Datastream data Signal that builds on the recent trading volume of one industry index and the direction of price change of the index. More specifically, it uses the on-balance volume (OBV) which is the multiple of trading volume during a month and the direction of price change during the same month. The volume based signal generates a buy signal (1) if the actual OBV is above or equal to the 1-months moving average of the OBV and a sell signal (0) otherwise. Relative strength RS Own calculation based on Datastream data Is computed as the return of an industry index during the last six months minus the return of the market index during the last six months. Relative strength index RSI Own calculation based on Datastream data Builds on daily price data of an index during the last month. It is the sum of price changes on days with positive returns divided by the total sum of absolute price changes. Lagged stock market return MARKET Own calculation based on Datastream data Continuous stock market return in the last month.
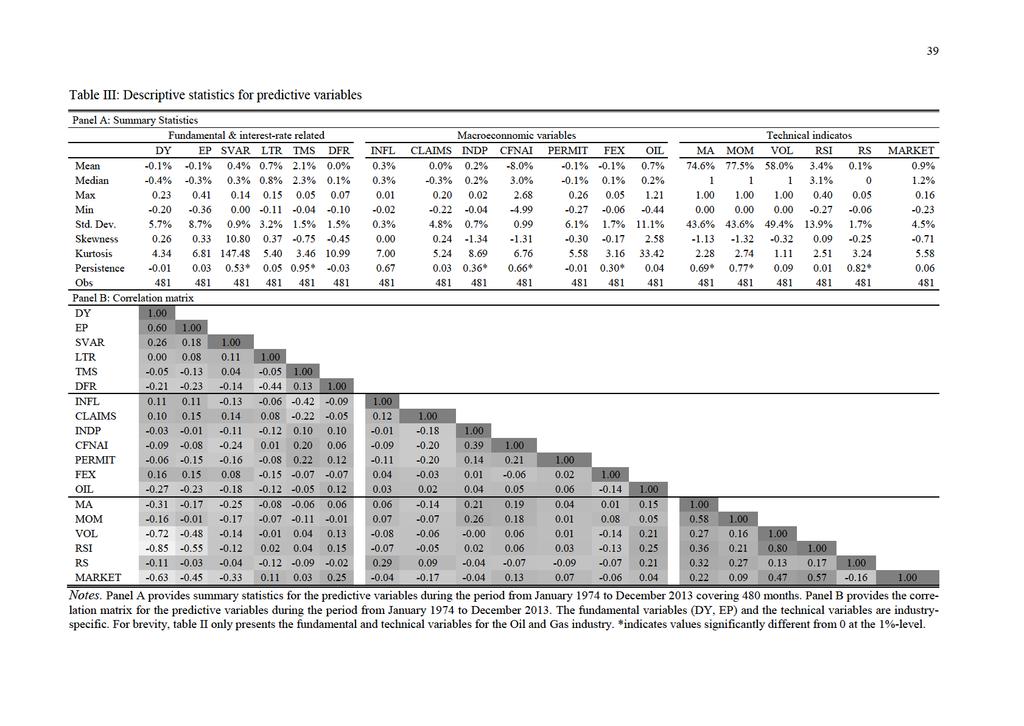
43
44 40 Table IV: Out-of-Sample Analysis of univariate predictive power (monthly univariate predictive regressions) R OS Market Oil and Gas Manufacturing Con.Gds&Srvcs Health Care Tech and Tele Financials t-stat R OS Fundamental and interest rate related variables t-stat R OS t-stat R OS t-stat R OS t-stat R OS t-stat R OS DY -0.07% % % % 1.41* -0.19% % % 1.04 EP 0.03% % % % % % % 1.03 SVAR 1.69% % 1.58* 0.44% % % % % 0.87 LTR -0.43% % % % % % % 0.46 TMS -1.06% % % % % % % -0.0 DFR -1.61% % % % % % % Macroeconomic variables INFL -0.59% % % % % % % 0.16 CLAIMS 1.17%.6*** -0.1% %.77***.17% 3.11*** -0.44% %.60*** 0.04% 0.4 INDP 0.61% % 1.80** 1.09% % % % % -0.6 CFNAI 3.06%.09** 1.8% 1.90**.87% 1.85** 1.89% 1.93** 0.01% %.38*** 3.%.06** PERMIT -0.43% % % % % % % 0.88 FEX 1.88% 1.95**.8%.41.05% 1.97** -0.4% % 1.77** 1.31% 1.91** 0.15% 0.55 OIL 0.39% % % % 1.79** -0.73% % 1.33* -0.37% 0.33 Technical indicators MA 0.55% % % % % % % MOM 0.8% % % % % 1.44* -0.06% % 0.01 VOL -0.36% % % % 1.76** -0.3% % % 1.49* RSI -0.0% % 1.75** -0.19% % % % % RS % % % % % % 1.31* MARKET 0.08% % % % 1.4* -0.38% % % 1.07 Notes. This table provides the evaluation of the forecast errors of bivariate predictive regression forecasts for 19 variables during the evaluation period from January 1989 to December 013. The R OS measures the percent reduction in MSFE for the forecast based on the predictive variable given in the first column relative to the historical average forecast. MSFE-adjusted refers to the Clark and West (007) MSFE-adjusted statistic for testing the null hypothesis that the MSFE of the historical average is less or equal to the MSFE of the predictive regression. *, **, *** indicates statistical significant better forecast compared to the historical average at the 10%, 5% and 1%-level, respectively. t-stat
45 41 Table V: Multivariate predictive regressions: All predictive variables Market Oil and Gas Manufacturing Con.Gds & Srvcs Health Care Tech and Tele Financials Model R OS t-stat R OS t-stat R OS t-stat R OS t-stat R OS t-stat R OS t-stat R OS OLS -4.07% % 1.88** -3.6% % 1.77** -8.33% % % 0.69 SIC % % % % % % % 0.56 LASSO 0.48% % 1.64* 1.5% % % % % 0.69 Principal Components 0.37% % 1.30* 0.43% % 1.94** -0.05% % % PRF1 3.70% 1.90** 3.3%.5** 3.38% 1.79** 0.94%.4** -5.54% % 1.71** 1.64% 1.43* FC MSFE w.avrg. 0.85% 1.70** 0.8%.04** 0.80% 1.55* 1.00%.19** 0.1% % 1.58* 0.88% 1.8* FC VS-MSFE w.avrg. 0.56% %.00** 0.18% % 1.47* -0.91% % % 1.0 Consensus (avrg) 1.93% 1.9* 3.79% 1.85**.04% % 1.73** -0.9% % 1.37* 1.00% 0.90 Notes. This table provides the evaluation of the forecast error of multivariate forecast models including all 19 predictive variables. The evaluation period is from January 1989 to December 013. The R OS measures the percent reduction in MSFE for the multivariate forecast model given in the first column relative to the historical average forecast. MSFEadjusted refers to the Clark and West (007) MSFE-adjusted statistic for testing the null hypothesis that the MSFE of the historical average is less or equal to the MSFE of the predictive regression. *, **, *** indicates statistically significant better forecasts compared to the historical average at the 10%, 5% and 1%-level, respectively. t-stat
46 44 Table VI: Analysis of industry forecasts in asset allocation: BL-portfolios (unconstrained) Performance measure Return Vola Sharpe Omega CER CER-Gain Turnover BTC Market 10.39% 15.14% % /N 11.1% 14.47% % 0.00 Cumulative average 1.3% 1.41% 0.7** % % Moving average (60m) 13.79% 13.54% 0.77** % % OLS 16.68% 16.79% 0.79* %.48 0.% SIC % 14.49% 0.79* % % LASSO 1.90% 10.30% 0.93** % % Principal Components 13.56% 11.39% 0.90** % % 3PRF 16.9% 1.33% 1.10** % % FC MSFE w.avrg. 1.80% 11.93% 0.79** %.0.09% FC VS MSFE w.avrg % 11.48% 0.85** % % Consensus (avrg) 14.45% 11.4% 0.97** % % Notes. This table reports the portfolio performance measures for an investor who monthly allocates between the six analyzed US-industries based on the forecast model given in the first column. The asset allocation builds on the unconstrained Black-Litterman (199) model. The investment universe includes the six industry indices. The first row shows the performance of the overall US-stock market index and the second row the performance of a passive equally weighted (1/N) industry portfolio as benchmark strategies. The evaluation period is from January 1989 to December 013. Return is the annualized time-series mean of monthly returns, Vola denotes the associated annualized standard deviation. Sharpe shows the annualized Sharpe ratio and Omega the Omega measures for each portfolio. CER is the certainty equivalent return. CER-Gain is the gain in CER for an investor who actively invests based on the indicated forecast model compared to an investor who passively invests in the 1/N portfolio. BTC are the break-even transaction costs, which are the level of variable transaction costs per trade for which the active investment strategy based on the forecast model shown in the first column yields the same certainty equivalent return (CER) as the passive market portfolio. *,** (, ) [+,++] indicates a statistically significant higher Sharpe ratio compared to the market (the buy-and-hold 1/N portfolio) [the BL-optimized portfolio based on the cumulative historical average as return forecast] at the 5% and 1%-level, respectively.
47 45 Table VII: Analysis of optimized portfolio returns: Carhart four factor regressions. Performance measure Alpha Mkt-RF SMB HML MOM 1/N ** ** 0.047** 0.0* Cumulative average 0.00** 0.8** ** 0.078** Moving average (60m) 0.003** 0.81** -0.0** ** OLS 0.003** 0.637** * ** SIC ** 0.695** ** * LASSO 0.003** 0.596** ** * Principal Components-SIC 0.004** 0.71** ** PRF 0.005** 0.648** -0.11** ** FC MSFE w.avrg ** 0.789** ** 0.053** FC VS MSFE w.avrg ** 0.754** ** Consensus (avrg) 0.004** 0.68** -0.13** * Notes. This table reports Carhart regressions for the excess-returns of the optimized industry portfolios. The portfolios consist of the six US-industry indices. Monthly portfolio weights are computed based on the unconstrained Black-Litterman (199) model. The employed return forecast model for industry indices is given in the first column. The first row depicts the performance of an equally weighted (1/N) portfolio as benchmark strategy. The evaluation period is from January 1989 to December 013. Mkt-RF is the market risk premium, SMB is the size factor, HML is the value factor, and MOM is the momentum factor. Alpha is the monthly percentage excess-return above the return, which one would expect based on the Carhart four-factor model. *, ** indicates a statistical significance at the 5% and 1%-level, respectively.
48 46 Table VIII: Analysis Sub-Periods: Portfolio performance (Sharpe Ratios) of BL-portfolios with forecasts Period Jan 89- Aug 90 Sep 90 - Apr 91 May 91- Apr 01 May 01- Dec 01 Jan 0- Jan 08 Feb 08- Jul 09 Aug 09 - Dec 13 Economic state (NBER) Exp Rec Exp Rec Exp Rec Exp Length of sub-period (months) Market /N Cumulative average Moving average (60m) OLS SIC LASSO Principal Components PRF FC MSFE w.avrg FC VS MSFE w.avrg Consensus (avrg) Notes. This table reports the performance (Sharpe ratios) of active asset allocations during sub-periods. The forecast model is given in the first column. Sub-periods are NBER dated expansions (Exp) and Recessions (Rec) during the evaluation period from January 1989 to December 013. The asset allocations build on the unconstrained Black-Litterman (199) model. The investment universe includes the six industry indices. The first row shows the Sharpe ratio of the overall US-stock market index and the second row depicts the Sharpe ratio of a passive equally weighted (1/N) industry portfolio as benchmark strategies.
49 47 Table IX: Portfolio performance (Sharpe Ratios) for industry-level forecasts in alternative asset allocation models Asset Allocation model BL BS MV BL BS MV unconstrained no short-sales Market /N Cumulative average 0.7** ** Moving average (60m) 0.77** ** OLS 0.79* ** * SIC * ** 0.77* 0.85* LASSO 0.93** ** Principal Components 0.90** ** 0.73* 0.77* 3PRF 1.10** ** * 0.9** FC MSFE w.avrg. 0.79** 0.87* ** 0.77* 0.77* FC VS MSFE w.avrg. 0.85** ** 0.77* 0.86** Consensus (avrg) 0.97** ** 0.77* 0.89* Notes. This table reports the portfolio performance measures for an investor who monthly allocates between the six analyzed US-industries based on the forecast model given in the first column. The employed asset allocation model is displayed in the header and is either the Black-Litterman (BL) model, the Bayes-Stein (BS) model or the traditional Markowitz (195) (MV) model. Each of the three asset allocation models is either employed with or without short-sale constraint. The investment universe includes the six industry indices. The first row depicts the overall US-stock market index and the second row the performance of a passive equally weighted (1/N) industry portfolio as benchmark portfolios. The evaluation period is from January 1989 to December 013. *,** (, ) [+,++] indicates a statistically significant higher Sharpe ratio compared to the market (the buy-and-hold 1/N portfolio) [the BL-optimized portfolio based on the cumulative historical average as return forecast] at the 5% and 1%-level, respectively.
50 44 Appendix: A1: In-sample analysis of univariate predictive power (full sample univariate predictive regression) Amihud and Hurvich (004): Reduced bias estimation method. Market Oil and Gas Manufacturing Con.Gds & Srvcs Health Care Tech and Tele Financials Coeff R Coeff R Coeff R Coeff R Coeff R Coeff R Coeff R Fundamental variables and interest rate related variables DY % % * 0.64% -0.1*** 1.85% % % ** 1.18% EP % % * 0.60% *** 1.63% % % *** 1.39% SVAR -1.87*** 1.93% *** 1.35% ** 0.9% ** 0.91% % ***.71% -1.05***.73% LTR % % 0.11* 0.57% 0.141* 0.74% 0.15* 0.73% % 0.177** 0.93% TMS % % % 0.84* 0.66% % 0.3* 0.59% % DFR 0.347** 1.7% 0.437** 1.35% 0.371** 1.37% 0.403** 1.31% 0.348** 1.5% % 0.33* 0.71% Macroeconomic variables INFL % % % % % % % CLAIMS ** 0.84% % ** 1.19% -0.16** 1.33% % -0.1** 0.99% % INDP 0.556** 0.8% 1.193***.53% 0.686** 1.18% % % % % CFNAI 0.007***.11% 0.006** 1.8% 0.007***.15% 0.006** 1.1% % 0.009***.0% 0.009***.38% PERMIT % % 0.061* 0.63% 0.07* 0.71% % % 0.079* 0.69% FEX *** 1.89% -0.54***.60% ***.13% % *** 1.38% *** 1.50% -0.67* 0.6% OIL -0.03* 0.60% % % ** 1.17% % ** 1.14% % Technical indicators MA 0.009* 0.66% % 0.011** 0.88% % % % % MOM 0.01* 0.7% % % % 0.008* 0.54% % % VOL % % % 0.01** 1.5% % % 0.014** 1.31% RSI % % % 0.033** 0.78% % % 0.033* 0.63% RS ** 1.01% % % % 0.648*** 1.77% % MARKET % % % 0.15** 1.16% % % 0.19** 0.98% Notes: This table provides the regression coefficients and R-squared statistics of in-sample bivariate predictive regressions over the full period from January 1974 to December 013 for the six industries and the market. We analyze 19 predictive variables including fundamental variables and interest rate related variables, macroeconomic variables and technical indicators. *, **, *** indicate values significantly different from 0 at the 10%, 5% and 1%-level, respectively.
51 45 A: Figure 1: Distribution of Returns Notes. This figure shows the distribution of BL-optimized portfolio returns during the full period from January 1989 to December 013 using the indicated return forecast models.


52 46 A: Figure : Allocations over time Notes. This figure shows the portfolio allocation of BL-optimized portfolios over the full period from January 1989 to December 013 using the indicated return forecast models.
Portfolio Optimization with Return Prediction Models. Evidence for Industry Portfolios
 Portfolio Optimization with Return Prediction Models Evidence for Industry Portfolios Abstract. Several studies suggest that using prediction models instead of historical averages results in more efficient
Equity premium prediction: Are economic and technical indicators instable?
 Equity premium prediction: Are economic and technical indicators instable? by Fabian Bätje and Lukas Menkhoff Fabian Bätje, Department of Economics, Leibniz University Hannover, Königsworther Platz 1,
Market Timing Does Work: Evidence from the NYSE 1
 Market Timing Does Work: Evidence from the NYSE 1 Devraj Basu Alexander Stremme Warwick Business School, University of Warwick November 2005 address for correspondence: Alexander Stremme Warwick Business
Lecture 2: Forecasting stock returns
 Lecture 2: Forecasting stock returns Prof. Massimo Guidolin Advanced Financial Econometrics III Winter/Spring 2018 Overview The objective of the predictability exercise on stock index returns Predictability
Lecture 2: Forecasting stock returns
 Lecture 2: Forecasting stock returns Prof. Massimo Guidolin Advanced Financial Econometrics III Winter/Spring 2016 Overview The objective of the predictability exercise on stock index returns Predictability
On the economic significance of stock return predictability: Evidence from macroeconomic state variables
 On the economic significance of stock return predictability: Evidence from macroeconomic state variables Huacheng Zhang * University of Arizona This draft: 8/31/2012 First draft: 2/28/2012 Abstract We
Combining State-Dependent Forecasts of Equity Risk Premium
 Combining State-Dependent Forecasts of Equity Risk Premium Daniel de Almeida, Ana-Maria Fuertes and Luiz Koodi Hotta Universidad Carlos III de Madrid September 15, 216 Almeida, Fuertes and Hotta (UC3M)
Does Naive Not Mean Optimal? The Case for the 1/N Strategy in Brazilian Equities
 Does Naive Not Mean Optimal? GV INVEST 05 The Case for the 1/N Strategy in Brazilian Equities December, 2016 Vinicius Esposito i The development of optimal approaches to portfolio construction has rendered
Online Appendix to Bond Return Predictability: Economic Value and Links to the Macroeconomy. Pairwise Tests of Equality of Forecasting Performance
 Online Appendix to Bond Return Predictability: Economic Value and Links to the Macroeconomy This online appendix is divided into four sections. In section A we perform pairwise tests aiming at disentangling
GDP, Share Prices, and Share Returns: Australian and New Zealand Evidence
 Journal of Money, Investment and Banking ISSN 1450-288X Issue 5 (2008) EuroJournals Publishing, Inc. 2008 http://www.eurojournals.com/finance.htm GDP, Share Prices, and Share Returns: Australian and New
September 12, 2006, version 1. 1 Data
 September 12, 2006, version 1 1 Data The dependent variable is always the equity premium, i.e., the total rate of return on the stock market minus the prevailing short-term interest rate. Stock Prices:
Optimal Portfolio Inputs: Various Methods
 Optimal Portfolio Inputs: Various Methods Prepared by Kevin Pei for The Fund @ Sprott Abstract: In this document, I will model and back test our portfolio with various proposed models. It goes without
Should you optimize your portfolio? On portfolio optimization: The optimized strategy versus the naïve and market strategy on the Swedish stock market
 Uppsala University Fall 2013 Department of Business Studies On portfolio optimization: The optimized strategy versus the naïve and market strategy on the Swedish stock market Alan Ramilton* Abstract In
Out-of-sample stock return predictability in Australia
 University of Wollongong Research Online Faculty of Business - Papers Faculty of Business 1 Out-of-sample stock return predictability in Australia Yiwen Dou Macquarie University David R. Gallagher Macquarie
Online Appendix for Overpriced Winners
 Online Appendix for Overpriced Winners A Model: Who Gains and Who Loses When Divergence-of-Opinion is Resolved? In the baseline model, the pessimist s gain or loss is equal to her shorting demand times
Optimal Portfolio Choice under Decision-Based Model Combinations
 Optimal Portfolio Choice under Decision-Based Model Combinations Davide Pettenuzzo Brandeis University Francesco Ravazzolo Norges Bank BI Norwegian Business School November 13, 2014 Pettenuzzo Ravazzolo
A Note on Predicting Returns with Financial Ratios
 A Note on Predicting Returns with Financial Ratios Amit Goyal Goizueta Business School Emory University Ivo Welch Yale School of Management Yale Economics Department NBER December 16, 2003 Abstract This
Solving dynamic portfolio choice problems by recursing on optimized portfolio weights or on the value function?
 DOI 0.007/s064-006-9073-z ORIGINAL PAPER Solving dynamic portfolio choice problems by recursing on optimized portfolio weights or on the value function? Jules H. van Binsbergen Michael W. Brandt Received:
Financial Econometrics Series SWP 2015/13. Stock Return Forecasting: Some New Evidence. D. H. B. Phan, S. S. Sharma, P.K. Narayan
 Faculty of Business and Law School of Accounting, Economics and Finance Financial Econometrics Series SWP 015/13 Stock Return Forecasting: Some New Evidence D. H. B. Phan, S. S. Sharma, P.K. Narayan The
Liquidity skewness premium
 Liquidity skewness premium Giho Jeong, Jangkoo Kang, and Kyung Yoon Kwon * Abstract Risk-averse investors may dislike decrease of liquidity rather than increase of liquidity, and thus there can be asymmetric
Parameter Estimation Techniques, Optimization Frequency, and Equity Portfolio Return Enhancement*
 Parameter Estimation Techniques, Optimization Frequency, and Equity Portfolio Return Enhancement* By Glen A. Larsen, Jr. Kelley School of Business, Indiana University, Indianapolis, IN 46202, USA, Glarsen@iupui.edu
Applied Macro Finance
 Master in Money and Finance Goethe University Frankfurt Week 8: An Investment Process for Stock Selection Fall 2011/2012 Please note the disclaimer on the last page Announcements December, 20 th, 17h-20h:
Applied Macro Finance
 Master in Money and Finance Goethe University Frankfurt Week 8: From factor models to asset pricing Fall 2012/2013 Please note the disclaimer on the last page Announcements Solution to exercise 1 of problem
APPLYING MULTIVARIATE
 Swiss Society for Financial Market Research (pp. 201 211) MOMTCHIL POJARLIEV AND WOLFGANG POLASEK APPLYING MULTIVARIATE TIME SERIES FORECASTS FOR ACTIVE PORTFOLIO MANAGEMENT Momtchil Pojarliev, INVESCO
International Diversification Revisited
 International Diversification Revisited by Robert J. Hodrick and Xiaoyan Zhang 1 ABSTRACT Using country index returns from 8 developed countries and 8 emerging market countries, we re-explore the benefits
Deviations from Optimal Corporate Cash Holdings and the Valuation from a Shareholder s Perspective
 Deviations from Optimal Corporate Cash Holdings and the Valuation from a Shareholder s Perspective Zhenxu Tong * University of Exeter Abstract The tradeoff theory of corporate cash holdings predicts that
Amath 546/Econ 589 Univariate GARCH Models: Advanced Topics
 Amath 546/Econ 589 Univariate GARCH Models: Advanced Topics Eric Zivot April 29, 2013 Lecture Outline The Leverage Effect Asymmetric GARCH Models Forecasts from Asymmetric GARCH Models GARCH Models with
On Portfolio Optimization: Imposing the Right Constraints
 On Portfolio Optimization: Imposing the Right Constraints Patrick Behr Andre Güttler Felix Miebs June 1, 2010 Abstract We develop a shrinkage theory based framework for determining optimal portfolio weight
Long-run Consumption Risks in Assets Returns: Evidence from Economic Divisions
 Long-run Consumption Risks in Assets Returns: Evidence from Economic Divisions Abdulrahman Alharbi 1 Abdullah Noman 2 Abstract: Bansal et al (2009) paper focus on measuring risk in consumption especially
FE670 Algorithmic Trading Strategies. Stevens Institute of Technology
 FE670 Algorithmic Trading Strategies Lecture 4. Cross-Sectional Models and Trading Strategies Steve Yang Stevens Institute of Technology 09/26/2013 Outline 1 Cross-Sectional Methods for Evaluation of Factor
Lecture 5. Predictability. Traditional Views of Market Efficiency ( )
") Lecture 5 Predictability Traditional Views of Market Efficiency (1960-1970) CAPM is a good measure of risk Returns are close to unpredictable (a) Stock, bond and foreign exchange changes are not predictable
Lecture 5 Predictability Traditional Views of Market Efficiency (1960-1970) CAPM is a good measure of risk Returns are close to unpredictable (a) Stock, bond and foreign exchange changes are not predictable
Forecasting Volatility movements using Markov Switching Regimes. This paper uses Markov switching models to capture volatility dynamics in exchange
 Forecasting Volatility movements using Markov Switching Regimes George S. Parikakis a1, Theodore Syriopoulos b a Piraeus Bank, Corporate Division, 4 Amerikis Street, 10564 Athens Greece bdepartment of
Risk-Adjusted Futures and Intermeeting Moves
 issn 1936-5330 Risk-Adjusted Futures and Intermeeting Moves Brent Bundick Federal Reserve Bank of Kansas City First Version: October 2007 This Version: June 2008 RWP 07-08 Abstract Piazzesi and Swanson
Quantitative Risk Management
 Quantitative Risk Management Asset Allocation and Risk Management Martin B. Haugh Department of Industrial Engineering and Operations Research Columbia University Outline Review of Mean-Variance Analysis
EXPLORING THE BENEFITS OF USING STOCK CHARACTERISTICS IN OPTIMAL PORTFOLIO STRATEGIES. Jonathan Fletcher. University of Strathclyde
 EXPLORING THE BENEFITS OF USING STOCK CHARACTERISTICS IN OPTIMAL PORTFOLIO STRATEGIES Jonathan Fletcher University of Strathclyde Key words: Characteristics, Modelling Portfolio Weights, Mean-Variance
Forecasting and model averaging with structural breaks
 Graduate Theses and Dissertations Graduate College 2015 Forecasting and model averaging with structural breaks Anwen Yin Iowa State University Follow this and additional works at: http://lib.dr.iastate.edu/etd
Forecasting Singapore economic growth with mixed-frequency data
 Edith Cowan University Research Online ECU Publications 2013 2013 Forecasting Singapore economic growth with mixed-frequency data A. Tsui C.Y. Xu Zhaoyong Zhang Edith Cowan University, zhaoyong.zhang@ecu.edu.au
Asset Selection Model Based on the VaR Adjusted High-Frequency Sharp Index
 Management Science and Engineering Vol. 11, No. 1, 2017, pp. 67-75 DOI:10.3968/9412 ISSN 1913-0341 [Print] ISSN 1913-035X [Online] www.cscanada.net www.cscanada.org Asset Selection Model Based on the VaR
Capital allocation in Indian business groups
 Capital allocation in Indian business groups Remco van der Molen Department of Finance University of Groningen The Netherlands This version: June 2004 Abstract The within-group reallocation of capital
Demographics Trends and Stock Market Returns
 Demographics Trends and Stock Market Returns Carlo Favero July 2012 Favero, Xiamen University () Demographics & Stock Market July 2012 1 / 37 Outline Return Predictability and the dynamic dividend growth
Predicting the equity premium via its components
 Predicting the equity premium via its components Fabian Baetje and Lukas Menkhoff Abstract We propose a refined way of forecasting the equity premium. Our approach rests on the sum-ofparts approach which
Regularizing Bayesian Predictive Regressions. Guanhao Feng
 Regularizing Bayesian Predictive Regressions Guanhao Feng Booth School of Business, University of Chicago R/Finance 2017 (Joint work with Nicholas Polson) What do we study? A Bayesian predictive regression
Performance of Statistical Arbitrage in Future Markets
 Utah State University DigitalCommons@USU All Graduate Plan B and other Reports Graduate Studies 12-2017 Performance of Statistical Arbitrage in Future Markets Shijie Sheng Follow this and additional works
The out-of-sample performance of robust portfolio optimization
 The out-of-sample performance of robust portfolio optimization André Alves Portela Santos May 28 Abstract Robust optimization has been receiving increased attention in the recent few years due to the possibility
Does Calendar Time Portfolio Approach Really Lack Power?
 International Journal of Business and Management; Vol. 9, No. 9; 2014 ISSN 1833-3850 E-ISSN 1833-8119 Published by Canadian Center of Science and Education Does Calendar Time Portfolio Approach Really
Chapter 5 Univariate time-series analysis. () Chapter 5 Univariate time-series analysis 1 / 29
 Chapter 5 Univariate time-series analysis 1 / 29") Chapter 5 Univariate time-series analysis () Chapter 5 Univariate time-series analysis 1 / 29 Time-Series Time-series is a sequence fx 1, x 2,..., x T g or fx t g, t = 1,..., T, where t is an index denoting
Chapter 5 Univariate time-series analysis () Chapter 5 Univariate time-series analysis 1 / 29 Time-Series Time-series is a sequence fx 1, x 2,..., x T g or fx t g, t = 1,..., T, where t is an index denoting
Bayesian Dynamic Linear Models for Strategic Asset Allocation
 Bayesian Dynamic Linear Models for Strategic Asset Allocation Jared Fisher Carlos Carvalho, The University of Texas Davide Pettenuzzo, Brandeis University April 18, 2016 Fisher (UT) Bayesian Risk Prediction
Spurious Regression and Data Mining in Conditional Asset Pricing Models*
 Spurious Regression and Data Mining in Conditional Asset Pricing Models* for the Handbook of Quantitative Finance, C.F. Lee, Editor, Springer Publishing by: Wayne Ferson, University of Southern California
Assicurazioni Generali: An Option Pricing Case with NAGARCH
 Assicurazioni Generali: An Option Pricing Case with NAGARCH Assicurazioni Generali: Business Snapshot Find our latest analyses and trade ideas on bsic.it Assicurazioni Generali SpA is an Italy-based insurance
Minimizing Timing Luck with Portfolio Tranching The Difference Between Hired and Fired
 Minimizing Timing Luck with Portfolio Tranching The Difference Between Hired and Fired February 2015 Newfound Research LLC 425 Boylston Street 3 rd Floor Boston, MA 02116 www.thinknewfound.com info@thinknewfound.com
Dynamic Smart Beta Investing Relative Risk Control and Tactical Bets, Making the Most of Smart Betas
 Dynamic Smart Beta Investing Relative Risk Control and Tactical Bets, Making the Most of Smart Betas Koris International June 2014 Emilien Audeguil Research & Development ORIAS n 13000579 (www.orias.fr).
Estimation Risk Modeling in Optimal Portfolio Selection:
 Estimation Risk Modeling in Optimal Portfolio Selection: An Study from Emerging Markets By Sarayut Nathaphan Pornchai Chunhachinda 1 Agenda 2 Traditional efficient portfolio and its extension incorporating
1 Volatility Definition and Estimation
 1 Volatility Definition and Estimation 1.1 WHAT IS VOLATILITY? It is useful to start with an explanation of what volatility is, at least for the purpose of clarifying the scope of this book. Volatility
The Predictability of Alternative UCITS Fund Returns
 The Predictability of Alternative UCITS Fund Returns Michael Busack, a Wolfgang Drobetz, b and Jan Tille c, * This version: May 2017 Abstract We study the out-of-sample predictability of the returns of
Research Division Federal Reserve Bank of St. Louis Working Paper Series
 Research Division Federal Reserve Bank of St. Louis Working Paper Series Understanding Stock Return Predictability Hui Guo and Robert Savickas Working Paper 2006-019B http://research.stlouisfed.org/wp/2006/2006-019.pdf
Bayes-Stein Estimators and International Real Estate Asset Allocation
 Bayes-Stein Estimators and International Real Estate Asset Allocation Authors Simon Stevenson Abstract This article is the winner of the International Real Estate Investment/ Management manuscript prize
The Sharpe ratio of estimated efficient portfolios
 The Sharpe ratio of estimated efficient portfolios Apostolos Kourtis First version: June 6 2014 This version: January 23 2016 Abstract Investors often adopt mean-variance efficient portfolios for achieving
Common Macro Factors and Their Effects on U.S Stock Returns
 2011 Common Macro Factors and Their Effects on U.S Stock Returns IBRAHIM CAN HALLAC 6/22/2011 Title: Common Macro Factors and Their Effects on U.S Stock Returns Name : Ibrahim Can Hallac ANR: 374842 Date
Yafu Zhao Department of Economics East Carolina University M.S. Research Paper. Abstract
 This version: July 16, 2 A Moving Window Analysis of the Granger Causal Relationship Between Money and Stock Returns Yafu Zhao Department of Economics East Carolina University M.S. Research Paper Abstract
A Bayesian Implementation of the Standard Optimal Hedging Model: Parameter Estimation Risk and Subjective Views
 A Bayesian Implementation of the Standard Optimal Hedging Model: Parameter Estimation Risk and Subjective Views by Wei Shi and Scott H. Irwin May 23, 2005 Selected Paper prepared for presentation at the
Financial Economics Field Exam August 2011
 Financial Economics Field Exam August 2011 There are two questions on the exam, representing Macroeconomic Finance (234A) and Corporate Finance (234C). Please answer both questions to the best of your
What Drives the Earnings Announcement Premium?
 What Drives the Earnings Announcement Premium? Hae mi Choi Loyola University Chicago This study investigates what drives the earnings announcement premium. Prior studies have offered various explanations
Optimal Portfolio Allocation with Option-Implied Moments: A Forward-Looking Approach
 Optimal Portfolio Allocation with Option-Implied Moments: A Forward-Looking Approach Tzu-Ying Chen National Taiwan University, Taipei, Taiwan Tel: (+886) 2-3366-1100 Email: d99723002@ntu.edu.tw San-Lin
Economic Valuation of Liquidity Timing
 Economic Valuation of Liquidity Timing Dennis Karstanje 1,2 Elvira Sojli 1,3 Wing Wah Tham 1 Michel van der Wel 1,2,4 1 Erasmus University Rotterdam 2 Tinbergen Institute 3 Duisenberg School of Finance
Return predictability
 UNIVERSITEIT GENT FACULTEIT ECONOMIE EN BEDRIJFSKUNDE ACADEMIEJAAR 015 016 Return predictability Can you outperform the historical average? Gilles Bekaert & Thibaut Van Weehaeghe onder leiding van Prof.
in-depth Invesco Actively Managed Low Volatility Strategies The Case for
 Invesco in-depth The Case for Actively Managed Low Volatility Strategies We believe that active LVPs offer the best opportunity to achieve a higher risk-adjusted return over the long term. Donna C. Wilson
Practical Portfolio Optimization
 Practical Portfolio Optimization Victor DeMiguel Professor of Management Science and Operations London Business School Based on joint research with Lorenzo Garlappi Alberto Martin-Utrera Xiaoling Mei U
Risk-Based Investing & Asset Management Final Examination
 Risk-Based Investing & Asset Management Final Examination Thierry Roncalli February 6 th 2015 Contents 1 Risk-based portfolios 2 2 Regularizing portfolio optimization 3 3 Smart beta 5 4 Factor investing
Financial Econometrics Notes. Kevin Sheppard University of Oxford
 Financial Econometrics Notes Kevin Sheppard University of Oxford Monday 15 th January, 2018 2 This version: 22:52, Monday 15 th January, 2018 2018 Kevin Sheppard ii Contents 1 Probability, Random Variables
Journal of Economics and Financial Analysis, Vol:1, No:1 (2017) 1-13
 1-13") Journal of Economics and Financial Analysis, Vol:1, No:1 (2017) 1-13 Journal of Economics and Financial Analysis Type: Double Blind Peer Reviewed Scientific Journal Printed ISSN: 2521-6627 Online ISSN:
Journal of Economics and Financial Analysis, Vol:1, No:1 (2017) 1-13 Journal of Economics and Financial Analysis Type: Double Blind Peer Reviewed Scientific Journal Printed ISSN: 2521-6627 Online ISSN:
An Online Appendix of Technical Trading: A Trend Factor
 An Online Appendix of Technical Trading: A Trend Factor In this online appendix, we provide a comparative static analysis of the theoretical model as well as further robustness checks on the trend factor.
Forecasting the CNH-CNY pricing differential: the role of investor attention
 Forecasting the CNH-CNY pricing differential: the role of investor attention Liyan Han 1, Yang Xu 1, Libo Yin,* ( 1 School of Economics and Management, Beihang University, Beijing, China) ( School of Finance,
The Effect of Financial Constraints, Investment Policy and Product Market Competition on the Value of Cash Holdings
 The Effect of Financial Constraints, Investment Policy and Product Market Competition on the Value of Cash Holdings Abstract This paper empirically investigates the value shareholders place on excess cash
Pension fund investment: Impact of the liability structure on equity allocation
 Pension fund investment: Impact of the liability structure on equity allocation Author: Tim Bücker University of Twente P.O. Box 217, 7500AE Enschede The Netherlands t.bucker@student.utwente.nl In this
Active allocation among a large set of stocks: How effective is the parametric rule? Abstract
 Active allocation among a large set of stocks: How effective is the parametric rule? Huacheng Zhang * University of Arizona This draft: 8/31/2012 First draft: 10/12/ 2011 Abstract In this study we measure
Global connectedness across bond markets
 Global connectedness across bond markets Stig V. Møller Jesper Rangvid June 2018 Abstract We provide first tests of gradual diffusion of information across bond markets. We show that excess returns on
University of Pretoria Department of Economics Working Paper Series
 University of Pretoria Department of Economics Working Paper Series The Role of Current Account Balance in Forecasting the US Equity Premium: Evidence from a Quantile Predictive Regression Approach Rangan
JACOBS LEVY CONCEPTS FOR PROFITABLE EQUITY INVESTING
 JACOBS LEVY CONCEPTS FOR PROFITABLE EQUITY INVESTING Our investment philosophy is built upon over 30 years of groundbreaking equity research. Many of the concepts derived from that research have now become
Macro Variables and International Stock Return Predictability
 Macro Variables and International Stock Return Predictability (International Journal of Forecasting, forthcoming) David E. Rapach Department of Economics Saint Louis University 3674 Lindell Boulevard Saint
Tuomo Lampinen Silicon Cloud Technologies LLC
 Tuomo Lampinen Silicon Cloud Technologies LLC www.portfoliovisualizer.com Background and Motivation Portfolio Visualizer Tools for Investors Overview of tools and related theoretical background Investment
An analysis of momentum and contrarian strategies using an optimal orthogonal portfolio approach
 An analysis of momentum and contrarian strategies using an optimal orthogonal portfolio approach Hossein Asgharian and Björn Hansson Department of Economics, Lund University Box 7082 S-22007 Lund, Sweden
PORTFOLIO OPTIMIZATION: ANALYTICAL TECHNIQUES
 PORTFOLIO OPTIMIZATION: ANALYTICAL TECHNIQUES Keith Brown, Ph.D., CFA November 22 nd, 2007 Overview of the Portfolio Optimization Process The preceding analysis demonstrates that it is possible for investors
Do core inflation measures help forecast inflation? Out-of-sample evidence from French data
 Economics Letters 69 (2000) 261 266 www.elsevier.com/ locate/ econbase Do core inflation measures help forecast inflation? Out-of-sample evidence from French data Herve Le Bihan *, Franck Sedillot Banque
Exploiting Long Term Price Dependencies for Trading Strategies
 Exploiting Long Term Price Dependencies for Trading Strategies Alexander Galenko The University of Texas at Austin Elmira Popova The University of Texas at Austin Ivilina Popova Texas State University
Is minimum-variance investing really worth the while? An analysis with robust performance inference
 Is minimum-variance investing really worth the while? An analysis with robust performance inference Patrick Behr André Güttler Felix Miebs. October 31, 2008 Department of Finance, Goethe-University Frankfurt,
Money Growth and Aggregate Stock Returns
 Money Growth and Aggregate Stock Returns Tobias Böing Georg Stadtmann European University Viadrina Frankfurt (Oder) Department of Business Administration and Economics Discussion Paper No. 390 December
On the Out-of-Sample Predictability of Stock Market Returns*
 Hui Guo Federal Reserve Bank of St. Louis On the Out-of-Sample Predictability of Stock Market Returns* There is an ongoing debate about stock return predictability in time-series data. Campbell (1987)
The cross section of expected stock returns
 The cross section of expected stock returns Jonathan Lewellen Dartmouth College and NBER This version: March 2013 First draft: October 2010 Tel: 603-646-8650; email: jon.lewellen@dartmouth.edu. I am grateful
Turnover Minimization: A Versatile Shrinkage Portfolio Estimator
 Turnover Minimization: A Versatile Shrinkage Portfolio Estimator Chulwoo Han Abstract We develop a shrinkage model for portfolio choice. It places a layer on a conventional portfolio problem where the
NBER WORKING PAPER SERIES SPURIOUS REGRESSIONS IN FINANCIAL ECONOMICS? Wayne E. Ferson Sergei Sarkissian Timothy Simin
 NBER WORKING PAPER SERIES SPURIOUS REGRESSIONS IN FINANCIAL ECONOMICS? Wayne E. Ferson Sergei Sarkissian Timothy Simin Working Paper 9143 http://www.nber.org/papers/w9143 NATIONAL BUREAU OF ECONOMIC RESEARCH
Applied Macro Finance
 Master in Money and Finance Goethe University Frankfurt Week 2: Factor models and the cross-section of stock returns Fall 2012/2013 Please note the disclaimer on the last page Announcements Next week (30
The Fundamental Law of Mismanagement
 The Fundamental Law of Mismanagement Richard Michaud, Robert Michaud, David Esch New Frontier Advisors Boston, MA 02110 Presented to: INSIGHTS 2016 fi360 National Conference April 6-8, 2016 San Diego,
The Long-Run Equity Risk Premium
 The Long-Run Equity Risk Premium John R. Graham, Fuqua School of Business, Duke University, Durham, NC 27708, USA Campbell R. Harvey * Fuqua School of Business, Duke University, Durham, NC 27708, USA National
The Risk-Return Relation in International Stock Markets
 The Financial Review 41 (2006) 565--587 The Risk-Return Relation in International Stock Markets Hui Guo Federal Reserve Bank of St. Louis Abstract We investigate the risk-return relation in international
Testing Out-of-Sample Portfolio Performance
 Testing Out-of-Sample Portfolio Performance Ekaterina Kazak 1 Winfried Pohlmeier 2 1 University of Konstanz, GSDS 2 University of Konstanz, CoFE, RCEA Econometric Research in Finance Workshop 2017 SGH
Portfolio Selection with Mental Accounts and Estimation Risk
 Portfolio Selection with Mental Accounts and Estimation Risk Gordon J. Alexander Alexandre M. Baptista Shu Yan University of Minnesota The George Washington University Oklahoma State University April 23,
Dividend Dynamics, Learning, and Expected Stock Index Returns
 Dividend Dynamics, Learning, and Expected Stock Index Returns Ravi Jagannathan Northwestern University and NBER Binying Liu Northwestern University September 30, 2015 Abstract We develop a model for dividend
Miguel Ferreira Universidade Nova de Lisboa Pedro Santa-Clara Universidade Nova de Lisboa and NBER Q Group Scottsdale, October 2010
 Forecasting stock m arket re tu rn s: The sum of th e parts is m ore than th e w hole Miguel Ferreira Universidade Nova de Lisboa Pedro Santa-Clara Universidade Nova de Lisboa and NBER Q Group Scottsdale,
University of California Berkeley
 University of California Berkeley A Comment on The Cross-Section of Volatility and Expected Returns : The Statistical Significance of FVIX is Driven by a Single Outlier Robert M. Anderson Stephen W. Bianchi
Spurious Regressions in Financial Economics?
 Spurious Regressions in Financial Economics? WAYNE E. FERSON, SERGEI SARKISSIAN, AND TIMOTHY T. SIMIN * ABSTRACT Even though stock returns are not highly autocorrelated, there is a spurious regression