Business Fluctuations: Aggregate Demand and Supply
|
|
|
- Evangeline Wilkins
- 5 years ago
- Views:
Transcription


1 DYNAMIC POWERPOINT SLIDES BY SOLINA LINDAHL CHAPTER 30 Business Fluctuations: Aggregate Demand and Supply

2 CHAPTER OUTLINE The Dynamic Aggregate Demand Curve The Solow Growth Curve Real Shocks Aggregate Demand Shocks and the Short-Run Aggregate Supply Curve Shocks to the Components of Aggregate Demand Understanding the Great Depression: Aggregate Demand Shocks and Real Shocks For applications, click here To Try it! questions To Video


3 Food for Thought. Some good blogs and other sites to get the juices flowing:

4 Introduction Economic Growth is Not a Smooth Process Real GDP grew at an average rate of 3% over the past 50 years. Growth wasn t smooth. A business fluctuation is a fluctuation in the growth rate of real GDP around its trend growth rate.
5 Introduction Economic Growth is Not a Smooth Process What causes the deviations from the average: booms and recessions A recession is a significant, widespread decline in real income and employment. (Shaded blue areas)
6 The Model To understand booms and recessions, we use the dynamic aggregate demand framework. Ultimately the model will have 3 curves: 1. Dynamic aggregate demand curve 2. Solow growth curve 3. Short-run aggregate supply curve
7 The Dynamic Aggregate Demand Curve Aggregate Demand Curve: A curve showing all the combinations of inflation and real growth that are consistent with a specified rate of spending growth. Deriving the Dynamic Aggregate Demand Curve from the quantity theory in dynamic form: Where represents total spending growth.

8 The Dynamic Aggregate Demand Curve The rate of spending growth = so that: Spending growth = Inflation + Real Growth Important: For a given level of spending growth the AD curve shows the combinations of inflation and real growth that add up to that spending growth.


9 The Dynamic Aggregate Demand Curve Plotting inflation against real growth gives a dynamic AD curve for each level of spending growth.
 0% 3% 5% 7% Real GDP growth rate")
10 The Dynamic Aggregate Demand Curve Inflation Rate (p) AD curve when spending growth = 5% Note: The sum of inflation and real growth will always equal spending growth, which equals money growth plus the growth of velocity. e.g. 7% 5% 2% 0% -2% 5% + 0% = 5% 2% + 3% = 5% AD (spending growth = 5%) 0% 3% 5% 7% Real GDP growth rate

11 The Dynamic Aggregate Demand Curve Inflation Rate (p) AD curve when spending growth = 7% Conclusion: Increases in spending growth, 7% shifts the AD curve to the right. 2.Decreases in spending growth, 5% shifts the AD curve to the left. AD (spending growth = 7%) 2% 0% -2% AD (spending growth = 5%) 0% 3% 5% 7% Real GDP growth rate
12 Building the Model Moving on to the next piece of the model: 1. Dynamic aggregate demand curve 2. Solow growth curve 3. Short-run aggregate supply curve
13 The Solow Growth Curve Solow growth rate: is an economy s potential growth rate, the rate of economic growth that would occur given flexible prices and existing real factors of production. Important point: If markets are working well and prices are perfectly flexible, the economy will grow at the potential growth rate.
14 The Solow Growth Curve The Solow Growth Curve Inflation Rate (p) Solow growth curve Why is the Solow Growth Curve vertical? Potential growth does not depend on the inflation rate. 3% Real GDP growthback rate TO
15 What causes the Solow Growth Curve to Shift? Inflation Rate (p) Solow growth curve Real shocks ( Productivity Shocks ) which increase or decrease the potential growth rate. Positive productivity shocks Negative shock Positive shock increase the ability of the economy to produce. Negative productivity shocks decrease the ability of the economy to produce. -1% 3% 7% Real GDP growth rate
16 Try it! An increase in inflation will cause the Solow growth curve to: a)shift inward. b)shift outward. c)not shift at all. d)shift randomly. To next Try it!
17 Try it! Solow growth rates fluctuate over time because of: a)real shocks. b)monetary shocks. c)changes in the rate of inflation. d)all of the answers are correct. To next Try it!
18 Try it! Which of the following choices can explain the shift of the Solow growth curve from A to B in the figure above? a)development of new technology b)negative supply shock c)war To next Try it! d)oil crisis
19 The Solow Growth Curve and AD Putting the AD and the Solow growth curve together. Inflation Rate (p) Solow growth curve Equilibrium 7% AD 3% Real GDP growth rate
 Negative shock Positive shock 11% 7% Conclusions: A positive shock results in a higher real growth rate, 7%, and lower inflation, 3%. 2.")
20 The Solow Growth Curve and AD Putting the AD and the Solow growth curve together. Solow growth curve Inflation Rate (p) Negative shock Positive shock 11% 7% Conclusions: A positive shock results in a higher real growth rate, 7%, and lower inflation, 3%. 2. A negative shock results in a lower real growth rate, -1%, and higher inflation, 11%. 3% AD -1% 3% 7% Real GDP growth rate


21 Take a look.. Besides co-authoring this text, Tyler Cowen writes the most popular Economics blog, he has written a book called The Great Stagnation. Here is clip of Paul Solman s (PBS Newshour) interview which focuses on the question, Why Hasn't Recent Technology Created More Jobs? (8:56 minutes)
22 Real Shocks If there are rapid changes in economic conditions that affect the productivity of capital and labor then the economy s growth rate will change. Rainfall Shocks in India Correlate Well with Agricultural Output and GDP Source: Reserve Bank of India and Indian Institute of Tropical Meteorology
23 Real Shocks: The Price of Oil and U.S. Recessions Note: Real price of oil per barrel in $2000.
24 Real Shocks: The Price of Oil and U.S. Recessions Real Output Growth Response to a 10 Percent Increase in Oil Price Source: Stylized graph based on results in Sill, Keith The Macroeconomics of Oil Shocks. Federal Reserve Bank of Philadelphia, Business Review Q1: Oil shocks create disruptions, bottlenecks and recessions- and impact growth for two years.

25 Real Shocks: Examples & Analysis
26 Building the Model Moving on to the next piece of the model: 1. Dynamic aggregate demand curve 2. Solow growth curve 3. Short-run aggregate supply curve
27 Aggregate Demand Shocks and the Short-Run Aggregate Supply Curve To understand why aggregate demand (AD) shocks matter, we need to look at the behavior of prices and short-run aggregate supply (SRAS). An aggregate demand shock is a rapid and unexpected shift in the AD curve (spending).
, deficiencies in aggregate demand could cause recessions Key to the model: when prices are sticky, the economy can grow faster or")
28 SEE THE INVISIBLE HAND John Maynard Keynes ( ) The General Theory of Employment, Interest, and Money, Wrote in the context of the Great Depression. Explained that when prices are not perfectly flexible (sticky), deficiencies in aggregate demand could cause recessions Key to the model: when prices are sticky, the economy can grow faster or slower than the Solow growth rate.
29 Aggregate Demand Shocks and the Short-Run Aggregate Supply Curve The Short-Run Aggregate Supply Curve If wages are not as flexible as prices Inflation will result in higher profits. Result: higher profits lead to increased output, or, real GDP growth. Two reasons why there can be a positive relationship between the inflation rate and the growth rate of real GDP in the short-run: 1.Sticky wages 2.Sticky prices
30 Aggregate Demand Shocks and the Short-Run Aggregate Supply Curve 1.Sticky Wages Expected inflation is built into labor contracts. What happens if inflation is higher or lower than expected? Inflation higher that expected Result: Inflation lower that expected Prices increase faster than wages Prices An increase upward slower than wages Profits increase sloping SRAS Profits decrease Firms increase Output and real GDP growth increases Firms decrease curve. Output and real GDP growth decreases
31 Try it! If prices are perfectly flexible, the economy will always be growing: a)at its potential rate. b)below its potential rate. c)above its potential rate. d)near its potential rate. To next Try it!
32 Aggregate Demand Shocks and the Short-Run Aggregate Supply Curve The short-run aggregate supply curve (SRAS) shows the positive relationship between the inflation rate and real growth during the period when prices and wages are sticky.
33 Aggregate Demand Shocks and the Short-Run Aggregate Supply Curve Inflation Rate (p) Solow growth curve Short Run aggregate supply (SRAS)(E(p) = 2%) Conclusions: Sticky wages result in an upward sloping SRAS. 2.There is a different SRAS for every level of expected inflation, E(p). 2% AD 3% Real GDP growth rate
34 Try it! If the growth rate of money is 3%, and the growth rate of velocity is 1%, the growth rate of nominal GDP is: a)4%. b)1%. c)0%. d)2%. To next Try it!
35 Aggregate Demand Shocks and the Short-Run Aggregate Supply Curve Inflation Rate (p) Solow growth curve d 6% 4% 2% (SRAS2) (E(p) = 4%) c (SRAS1) (E(p) = 2%) b If p = 2% and E(p) = 2%, economy stays at point a. If p = 4% and E(p) = 2%, economy moves to b. and real growth to 7% If p = 4% and E(p) = 4%, SRAS shifts up and economy stays at point c. a If p = 4% and E(p) = 6%, economy moves to d. and real growth to 7% 3% 7% Real GDP growth rate
36 Try it! If p > p e : a)firms' profits will increase. b)money growth will cause the short-run aggregate supply curve to shift. c) firms' profits will decrease. d) there will be no change in real GDP growth because it is determined by real factors. To next Try it!
37 Why is the SRAS Upward-Sloping? (Why Do Spending Increases Temporarily Increase Growth?) Nominal Wage Confusion Menu Costs Uncertainty Nominal wage confusion: when workers respond to their nominal wage instead of to their real wage, when workers respond to the wage number on their paychecks rather than to what their wage can buy in goods and services (the wage after correcting for inflation).
38 Why is the SRAS Upward-Sloping? (Why Do Spending Increases Temporarily Increase Growth?) Menu costs: the costs of changing prices. Printing costs and the desire not to upset consumers with rapid price changes keep firms from changing prices frequently.
39 Why is the SRAS Upward-Sloping? (Why Do Spending Increases Temporarily Increase Growth?) Uncertainty causes firms to hold off changing prices. They can be unsure about whether: A shock is permanent or temporary. Increases in demand are nominal, caused by inflation, or real. Sticky prices cause upward sloping SRAS
 = 7%) (SRAS1) (E(p) = 2%) b Short-run: a b Real growth to 6% p to 4% Long-run: b c Real growth to 3% p to 7% AD2 2% a AD1 3% 6% Real GDP growth")
40 In the Long Run, Real Growth Eventually Returns to the Solow Rate An Unexpected increase in Inflation Rate (p) Solow growth curve 7% c 4% (SRAS2) (E(p) = 7%) (SRAS1) (E(p) = 2%) b Short-run: a b Real growth to 6% p to 4% Long-run: b c Real growth to 3% p to 7% AD2 2% a AD1 3% 6% Real GDP growth rate
41 A Fall in Aggregate Demand Could Induce a Lengthy Recession Sometimes the adjustment (and pain) takes a while. Inflation Rate (p) Solow growth curve (SRAS1) (E(p) = 7%) 7% Short-run: a b Real growth to -1% p to 6% Long-run: b c Real growth to 3% as prices become unstuck a b 6% AD1 c AD2-1% 0% 3% Real GDP growth rate


42 Shocks to the Components of Aggregate Demand Other Factors that Shift the AD Curve 1. Fear and confidence also affect growth of investment spending,, as well as. Fear about the future will cause business people to put off large investments in capital. Confidence about the future will result in greater investment spending by businesses. 2. Wealth shocks can also increase or decrease AD. Negative wealth shock Positive wealth shock
 shift the AD to the right (left). 5. Changes in the growth of net exports, NX. Other countries spending on our goods AD.")
43 Shocks to the Components of Aggregate Demand 3. Taxes also shift and. ( ) in taxes can ( ). Taxes targeted at investment (i.e. investment tax credit) will have a similar effect on. 4. Changes in government spending,, shift AD. ( ) shift the AD to the right (left). 5. Changes in the growth of net exports, NX. Other countries spending on our goods AD. We our spending on foreign goods AD.

44 Shocks to the Components of Aggregate Demand Changes in the rate of growth of velocity. It is easier to think of changes in working through. Example: A reduction in working through a reduction in. Workers may become fearful of losing their jobs and reduce consumption.
 working through a reduction in Solow growth")

45 A Temporary Shock to the Aggregate Demand and the Adjustment A temporary reduction in Inflation Rate (p) working through a reduction in Solow growth curve (SRAS1) (E(p) = 7%) 7% Short-run: a b Real growth to -1% p to 6% Long-run: b a Real growth to 3% p to 7% a 6% b AD1 AD2-1% 0% 3% Real GDP growth rate

46 Shocks to the Components of Aggregate Demand What did we learn from this example? A negative spending shock reduces the real growth rate and inflation in the short-run only. Why?: Changes in spending growth are temporary. Shares of GDP devoted to C, I, G, and NX have been stable over time. This implies that their growth rates must also be stable. Changes in the growth rates of spending do not change the long-run rate of inflation.

47 Shocks to the Components of Aggregate Demand A final important point: We know now that changes in spending growth,, shift the AD curve. A fundamental difference between and is that can be set at any permanent rate Changes in are temporary. Conclusion: Sustained inflation requires continuing increases in the money supply.

48 Shocks to the Components of Aggregate Demand
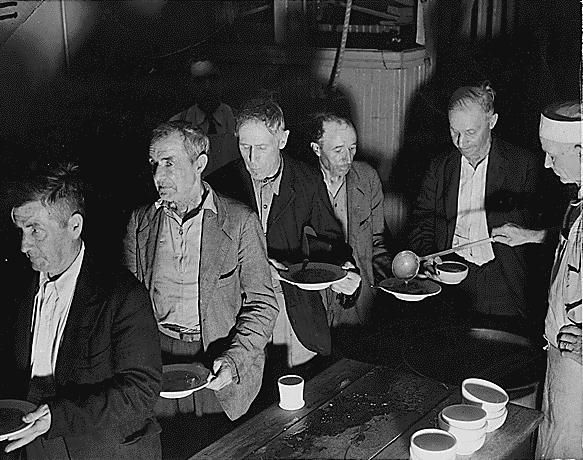
49 Understanding the Great Depression The Great Depression ( ) Most catastrophic economic event in the history of the United States. GDP plummeted by 30 percent. Unemployment rates exceeded 20 percent. Stock market fell by more than two thirds. It was a worldwide event. Germany: Led to a totalitarian regime. The Great Depression became Great because policy makers allowed aggregate demand to collapse.
50
51 Understanding the Great Depression Shocks to AD and the Great Depression October 1929: the stock market crashed. Caused in part by tight monetary policy aimed at limiting a stock market bubble. Created a wealth shock. Along with the tight monetary policy AD curve shifted to the left. 1930: Depositors lost confidence in their banks and they withdrew their deposits : Four waves of bank panics. By 1933, 40% of all American banks failed.

52 Crowd at New York's American Union Bank during a bank run early in the Great Depression. The Bank opened in 1917 and went out of business on June 30, 1931.
53 Understanding the Great Depression Shocks to Aggregate Demand and the Great Depression Between 1929 and 1933 investment spending fell by nearly 75%. Spending on new capital was not enough to replace depreciated capital. By 1940 the U.S. capital stock was lower than it was in The Fed allowed the money supply to fall by 1/3. This is the largest negative shock in U.S. history.
54 Understanding the Great Depression Shocks to Aggregate Demand and the Great Depression What should the Fed have done? Increase the money supply To drive up AD and output. Increase reserves of banks to stop panics : The Fed caused another monetary contraction. Contracted the economy and unemployment increased. Prolonged the Great Depression.


55 Understanding the Great Depression The Great Depression and the Great Fall in AD Solow growth curve Inflation Rate (p) SRAS % % AD AD -13% 4% Real GDP growth rate
56 Understanding the Great Depression Real Shocks and the Great Depression Real shocks played a role in the failure of the economy to recover more quickly. We will look at three: 1. Bank failures reduced the efficiency of financial intermediation. The bridge between savers and investors collapsed. Small businesses were especially harmed because they couldn t get credit.
57 Understanding the Great Depression 2. Smoot-Hawley Tariff of 1930 Intent: increase demand for domestic goods. What really happened: Other countries retaliated with tariffs and exports fell. This reduced AD. A tariff is a negative productivity shock (shifts LRAS to the left). Pushes capital and labor into lower productivity sectors.
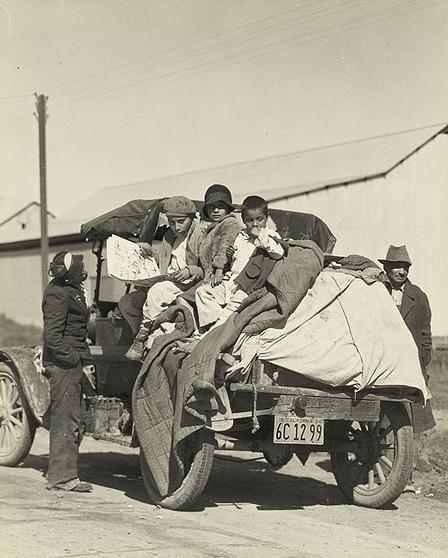
58 Understanding the Great Depression 3. The Dust Bowl: natural disasters are negative real shocks Severe drought turned millions of acres of farmland to dust. The Dust Bowl: a real shock
59 Try it! Discuss the 2008 Financial Crisis and identify what type of shock hit the economy: a real shock or a demand-side shock? If you like, look at and for a look at inflation and GDP for evidence.
Business Fluctuations: Aggregate Demand and Supply
 Chapter 13 MODERN PRINCIPLES OF ECONOMICS Third Edition Business Fluctuations: Aggregate Demand and Supply Outline The Aggregate Demand Curve The Long-Run Aggregate Supply Curve Real Shocks Aggregate Demand
DYNAMIC POWERPOINT SLIDES BY SOLINA LINDAHL CHAPTER. Fiscal Policy
 DYNAMIC POWERPOINT SLIDES BY SOLINA LINDAHL CHAPTER 35 Fiscal Policy CHAPTER OUTLINE Fiscal Policy: The Best Case The Limits to Fiscal Policy When Fiscal Policy Might Make Matters Worse So When is Fiscal
Lecture 12: Economic Fluctuations. Rob Godby University of Wyoming
 Lecture 12: Economic Fluctuations Rob Godby University of Wyoming Short-Run Economic Fluctuations Economic activity fluctuates from year to year. In some years, the production of goods and services rises.
Aggregate Demand and Aggregate Supply
 C H A P T E R 33 Aggregate Demand and Aggregate Supply Economics P R I N C I P L E S O F N. Gregory Mankiw Premium PowerPoint Slides by Ron Cronovich 2009 South-Western, a part of Cengage Learning, all
Dynamic Change, Economic Fluctuations, and the AD-AS Model
 Dynamic Change, Economic Fluctuations, and the AD-AS Model Full Length Text Part: Macro Only Text Part: 3 Chapter: 10 3 Chapter: 10 To Accompany Economics: Private and Public Choice 13th ed. James Gwartney,
Lecture 22. Aggregate demand and aggregate supply
 Lecture 22 Aggregate demand and aggregate supply By the end of this lecture, you should understand: three key facts about short-run economic fluctuations how the economy in the short run differs from the
Introduction. Over the long run, real GDP grows about 3% per year on average.
 Introduction Over the long run, real GDP grows about 3% per year on average. In the short run, GDP fluctuates around its trend. Recessions: periods of falling real incomes and rising unemployment Depressions:
Macroeconomics. Aggregate Demand and Aggregate Supply. Introduction. In this chapter, look for the answers to these questions: N.
 C H A T E R 15 Aggregate Demand and Aggregate Supply B R I E F R I N C I L E S O F Macroeconomics N. Gregory Mankiw remium oweroint Slides by Ron Cronovich 2010 South-Western, a part of Cengage Learning,
Chapter 13: Aggregate Demand and Aggregate Supply Analysis
 Chapter 13: Aggregate Demand and Aggregate Supply Analysis Yulei Luo SEF of HKU March 20, 2016 Learning Objectives 1. Identify the determinants of aggregate demand and distinguish between a movement along
Macroeconomics. Introduction to Economic Fluctuations. Zoltán Bartha, PhD Associate Professor. Andrea S. Gubik, PhD Associate Professor
 Institute of Economic Theories - University of Miskolc Macroeconomics Introduction to Economic Fluctuations Zoltán Bartha, PhD Associate Professor Andrea S. Gubik, PhD Associate Professor Business cycle:
Aggregate Demand and Aggregate Supply
 Aggregate Demand and Aggregate Supply Aggregate Demand and Aggregate Supply The Learning Objectives in this presentation are covered in Chapter 20: Aggregate Demand and Aggregate Supply LEARNING OBJECTIVES
10. Oferta y demanda agregada
 10. Oferta y demanda agregada In this chapter, look for the answers to these questions: What are economic fluctuations? What are their characteristics? How does the model of aggregate demand and aggregate
Chapter 9 Chapter 10
 Assignment 4 Last Name First Name Chapter 9 Chapter 10 1 a b c d 1 a b c d 2 a b c d 2 a b c d 3 a b c d 3 a b c d 4 a b c d 4 a b c d 5 a b c d 5 a b c d 6 a b c d 6 a b c d 7 a b c d 7 a b c d 8 a b
Aggregate Demand and Aggregate Supply
 Aggregate Demand and Aggregate Supply Chapter 19 Copyright 2001 by Harcourt, Inc. All rights reserved. Requests for permission to make copies of any part of the work should be mailed to: Permissions Department,
Introduction. Aggregate Demand and Aggregate Supply. In this chapter, look for the answers to these questions:
 33 Aggregate Demand and Aggregate Supply R I N C I L E S O F ECONOMICS FOURTH EDITION N. GREGOR MANKIW remium oweroint Slides by Ron Cronovich 2008 update 2008 South-Western, a part of Cengage Learning,
6. The Aggregate Demand and Supply Model
 6. The Aggregate Demand and Supply Model 1 Aggregate Demand and Supply Curves The Aggregate Demand Curve It shows the relationship between the inflation rate and the level of aggregate output when the
The aggregate supply curve shows the relationship between the aggregate price level and the quantity of aggregate output in the economy.
 Chapter 32 The aggregate supply curve shows the relationship between the aggregate price level and the quantity of aggregate output in the economy. GDP Deflator can be used as a measure of the price level
VII. Short-Run Economic Fluctuations
 Macroeconomic Theory Lecture Notes VII. Short-Run Economic Fluctuations University of Miami December 1, 2017 1 Outline Business Cycle Facts IS-LM Model AD-AS Model 2 Outline Business Cycle Facts IS-LM
Lecture 4. Short run economic fluctuations.
 MACROECONOMICS 2 Lecture 4. Short run economic fluctuations. The AD/AS model a short reminder. Joanna Siwińska - Gorzelak Time horizons in macroeconomics Time horizons in macroeconomics Long run: Prices
Aggregate Supply and Aggregate Demand
 Aggregate Supply and Aggregate Demand ECO 301: Money and Banking 1 1.1 Goals Goals Specific Goals Be able to explain GDP fluctuations when the price level is also flexible. Explain how real GDP and the
Economic Fluctuations
 Sherif Khalifa Sherif Khalifa () Economic Fluctuations 1 / 43 Definition The business cycle is the fluctuations in the production output of goods and services in an economy. Definition The business cycle
Mankiw Chapter 10. Introduction to Economic Fluctuations. Introduction to Economic Fluctuations CHAPTER 10
 Mankiw Chapter 10 0 IN THIS CHAPTER, WE WILL COVER: facts about the business cycle how the short run differs from the long run an introduction to aggregate demand an introduction to aggregate supply in
MACROECONOMICS. Aggregate Demand I: Building the IS-LM Model. N. Gregory Mankiw. PowerPoint Slides by Ron Cronovich
 11 : Building the IS-LM Model MACROECONOMICS N. Gregory Mankiw PowerPoint Slides by Ron Cronovich 2013 Worth Publishers, all rights reserved IN THIS CHAPTER, YOU WILL LEARN: the IS curve and its relation
Chapter 9 Introduction to Economic Fluctuations
 Chapter 9 Introduction to Economic Fluctuations facts about the business cycle how the short run differs from the long run an introduction to aggregate demand an introduction to aggregate supply in the
Lecture 4. Short run economic fluctuations.
 MACROECONOMICS 2 Lecture 4. Short run economic fluctuations. The AD/AS model a short reminder. Joanna Siwińska - Gorzelak Time horizons in macroeconomics Time horizons in macroeconomics Long run: Prices
Introduction to Economic Fluctuations. Instructor: Dmytro Hryshko
 Introduction to Economic Fluctuations Instructor: Dmytro Hryshko 1 / 32 Outline facts about the business cycle how the short run differs from the long run an introduction to aggregate demand an introduction
Economic Fluctuations
 Sherif Khalifa Sherif Khalifa () Economic Fluctuations 1 / 39 Economy s output experiences short run fluctuations around the long run upward trend. Fluctuations in the economy s output are closely associated
ECONOMIC GROWTH 1. THE ACCUMULATION OF CAPITAL
 ECON 3560/5040 ECONOMIC GROWTH - Understand what causes differences in income over time and across countries - Sources of economy s output: factors of production (K, L) and production technology differences
EC202 Macroeconomics
 EC202 Macroeconomics Koç University, Summer 2014 by Arhan Ertan Study Questions - 3 1. Suppose a government is able to permanently reduce its budget deficit. Use the Solow growth model of Chapter 9 to
Economics 1012A: Introduction to Macroeconomics FALL 2007 Dr. R. E. Mueller Third Midterm Examination November 15, 2007
 Economics 1012A: Introduction to Macroeconomics FALL 2007 Dr. R. E. Mueller Third Midterm Examination November 15, 2007 Answer all of the following questions by selecting the most appropriate answer on
THE SHORT-RUN TRADEOFF BETWEEN INFLATION AND UNEMPLOYMENT
 22 THE SHORT-RUN TRADEOFF BETWEEN INFLATION AND UNEMPLOYMENT LEARNING OBJECTIVES: By the end of this chapter, students should understand: why policymakers face a short-run tradeoff between inflation and
Lesson 11 Aggregate demand and Aggregate Supply
 Lesson 11 Aggregate demand and Aggregate Supply Henan University of Technology Sino-British College Transfer Abroad Undergraduate Programme 0 In this lesson, look for the answers to these questions: What
Objectives AGGREGATE DEMAND AND AGGREGATE SUPPLY
 AGGREGATE DEMAND 7 AND CHAPTER AGGREGATE SUPPLY Objectives After studying this chapter, you will able to Explain what determines aggregate supply Explain what determines aggregate demand Explain macroeconomic
Economic Fluctuations
 Sherif Khalifa Sherif Khalifa () Economic Fluctuations 1 / 30 Short-run economic fluctuations are often called business cycles. During periods of economic expansion, firms find that customers are plentiful
PART XII: SHORT-RUN ECONOMIC FLUCTUATIONS AGGREGATE DEMAND AND AGGREGATE SUPPLY. Chapter 33
 1 PART XII: SHORT-RUN ECONOMIC FLUCTUATIONS AGGREGATE DEMAND AND AGGREGATE SUPPLY Chapter 33 What did we learn so far? Macroeconomics studies the economy as a whole It aims to explain economic events that
ECON 3010 Intermediate Macroeconomics Final Exam
 ECON 3010 Intermediate Macroeconomics Final Exam Multiple Choice Questions. (60 points; 3 pts each) 1. The returns to scale in the production function YY = KK 0.5 LL 0.5 are: A) decreasing. B) constant.
Econ / Summer 2005
 Econ 3560.001 / 5040.001 Summer 2005 INTERMEDIATE MACROECONOMIC THEORY / MACROECONOMIC ANALYSIS FINAL EXAM Name (Last) (First) Signature Instructions The exam consists of 30 multiple-choice questions (Part
A decrease in the price level makes consumers feel more wealthy, which in turn encourages them to spend more.
 The aggregate-demand curve: Why the aggregate-demand curve is downward slopping: The price level and consumption: The wealth effect The price level and investment: The interest-rate effect The price level
Cost Shocks in the AD/ AS Model
 Cost Shocks in the AD/ AS Model 13 CHAPTER OUTLINE Fiscal Policy Effects Fiscal Policy Effects in the Long Run Monetary Policy Effects The Fed s Response to the Z Factors Shape of the AD Curve When the
Causes of the Great Depression
 The Great Depression What caused the most severe economic crisis in American history? What impact did the Great Depression have on Americans? How did the federal government respond to the economic collapse
Tradeoff Between Inflation and Unemployment
 CHAPTER 13 Aggregate Supply and the Short-Run Tradeoff Between Inflation and Unemployment Questions for Review 1. In this chapter we looked at two models of the short-run aggregate supply curve. Both models
MODERN PRINCIPLES: MACROECONOMICS. Tyler Cowen George Mason University. Alex Tabarrok George Mason University. Worth Publishers
 MODERN PRINCIPLES: MACROECONOMICS Tyler Cowen George Mason University Alex Tabarrok George Mason University Worth Publishers CONTENTS Preface xv CHAPTER 1 The Big Ideas 1 Big Idea One: Incentives Matter
Macroeconomics 1 Lecture 11: ASAD model
 Macroeconomics 1 Lecture 11: ASAD model Dr Gabriela Grotkowska Lecture objectives difference between short run & long run aggregate demand aggregate supply in the short run & long run see how model of
ECON 3010 Intermediate Macroeconomics Final Exam
 ECON 3010 Intermediate Macroeconomics Final Exam Multiple Choice Questions. (60 points; 2 pts each) #1. Which of the following is a stock variable? a) wealth b) consumption c) investment d) income #2.
Notes 6: Examples in Action - The 1990 Recession, the 1974 Recession and the Expansion of the Late 1990s
 Notes 6: Examples in Action - The 1990 Recession, the 1974 Recession and the Expansion of the Late 1990s Example 1: The 1990 Recession As we saw in class consumer confidence is a good predictor of household
Macroeonomics. 20 this chapter, Aggregate Demand and Aggregate Supply. look for the answers to these questions: Introduction. N.
 C H A T E R In 20 this chapter, look for the answers to these questions: Aggregate Demand and Aggregate Supply R I N C I L E S O F Macroeonomics N. Gregory Mankiw remium oweroint Slides by Ron Cronovich
Chapter 11 Aggregate Demand I: Building the IS -LM Model
 Chapter 11 Aggregate Demand I: Building the IS -LM Model Modified by Yun Wang Eco 3203 Intermediate Macroeconomics Florida International University Summer 2017 2016 Worth Publishers, all rights reserved
Archimedean Upper Conservatory Economics, October 2016
 Multiple Choice Identify the choice that best completes the statement or answers the question. 1. The marginal propensity to consume is equal to: A. the proportion of consumer spending as a function of
EC 205 Macroeconomics I. Lecture 19
 EC 205 Macroeconomics I Lecture 19 Macroeconomics I Chapter 12: Aggregate Demand II: Applying the IS-LM Model Equilibrium in the IS-LM model The IS curve represents equilibrium in the goods market. r LM
Econ 102 Discussion Section 8 (Chapter 12, 13) March 20, 2015
 March 20, 2015") Econ 102 Discussion Section 8 (Chapter 12, 13) March 20, 2015 The Multiplier and Shifting the Aggregate Expenditures Function The multiplier effect describes how changes in autonomous expenditures lead
Econ 102 Discussion Section 8 (Chapter 12, 13) March 20, 2015 The Multiplier and Shifting the Aggregate Expenditures Function The multiplier effect describes how changes in autonomous expenditures lead
Introduction to Macroeconomics. Introduction to Macroeconomics
 C H A P T E R 17 Introduction to Macroeconomics Prepared by: Fernando Quijano and Yvonn Quijano Introduction to Macroeconomics Microeconomics examines the behavior of individual decision-making units business
AP Econ Practice Test Unit 5
 DO NOT WRITE ON THIS TEST! AP Econ Practice Test Unit 5 Multiple Choice Identify the choice that best completes the statement or answers the question. 1. The marginal propensity to consume is equal to:
III. 9. IS LM: the basic framework to understand macro policy continued Text, ch 11
 Objectives: To apply IS-LM analysis to understand the causes of short-run fluctuations in real GDP and the short-run impact of monetary and fiscal policies on the economy. To use the IS-LM model to analyse
ECON 3010 Intermediate Macroeconomics Chapter 10
 ECON 3010 Intermediate Macroeconomics Chapter 10 Introduction to Economic Fluctuations Facts about the business cycle GDP growth averages 3 3.5 percent per year C (consumption) and I (Investment) fluctuate
ECON Intermediate Macroeconomic Theory
 ECON 3510 - Intermediate Macroeconomic Theory Fall 2015 Mankiw, Macroeconomics, 8th ed., Chapter 12 Chapter 12: Aggregate Demand 2: Applying the IS-LM Model Key points: Policy in the IS LM model: Monetary
Consumption expenditure The five most important variables that determine the level of consumption are:
 The aggregate expenditure model: A macroeconomic model that focuses on the relationship between total spending and real GDP, assuming the price level is constant. Macroeconomic equilibrium: AE = GDP Consumption
MACROECONOMICS - CLUTCH CH INTRODUCING ECONOMIC CONCEPTS.
 !! www.clutchprep.com CONCEPT: INTRODUCING MACROECONOMIC CONCEPTS BUSINESS CYCLE Business Cycles describe the increases and decreases in economic activity that occur over periods of several years Employment
Mankiw Chapter 14 Aggregate Supply and the Short-Run Tradeoff Between Inflation and Unemployment CHAPTER 14
 Mankiw Chapter 14 and the Short-Run Tradeoff Between Inflation and Unemployment 0 IN THIS CHAPTER, WE WILL COVER: two models of aggregate supply in which output depends positively on the price level in
Chapter 9. Introduction to Economic Fluctuations (Continued) CHAPTER 9 Introduction to Economic Fluctuations. slide 0
 CHAPTER 9 Introduction to Economic Fluctuations. slide 0") Chapter 9 Introduction to Economic Fluctuations (Continued) slide 0 Stabilization Policies Economic fluctuations (or business cycles) refer to deviations of real GDP growth from its long run average growth
Chapter 9 Introduction to Economic Fluctuations (Continued) slide 0 Stabilization Policies Economic fluctuations (or business cycles) refer to deviations of real GDP growth from its long run average growth
Real GDP Growth in the United States Introduction to Economic Fluctuations slide 2.
 Real GD Growth in the United States 10 ercent change from 4 quarters 8 earlier Average growth rate = 3.5% 6 4 2 0-2 -4 1960 1965 1970 1975 1980 1985 1990 1995 2000 Introduction to Economic Fluctuations
ECON 3020: ACCELERATED MACROECONOMICS
 ECON 3020: ACCELERATED MACROECONOMICS SOLUTIONS TO RELIMINARY EXAM 04/09/2015 Instructor: Karel Mertens Question 1: AD-AS (30 points) Consider the following closed economy: C d = 200 + 0.5(Y T ) 200r I
ECON 3150: Exam 2 study guide
 ECON 3150: Exam 2 study guide July 26, 2015 Unemployment 1. Define the unemployment rate 2. Define the labor force participation rate 3. Know historic LF participation rate trends in the US 4. Why has
ECON 3010 Intermediate Macroeconomics Solutions to the Final Exam
 ECON 3010 Intermediate Macroeconomics Solutions to the Final Exam Multiple Choice Questions. (60 points; 2 pts each) #1. Which of the following is a stock variable? a) wealth b) consumption c) investment
Introduction. Learning Objectives. Chapter 11. Classical and Keynesian Macro Analyses
 Chapter 11 Classical and Keynesian Macro Analyses Introduction The same basic pattern has repeated four times in recent U.S. history: 1973-1974, 1979-1980, 1990, and 2001. First, world oil prices jump.
Chapter 13 Short Run Aggregate Supply Curve
 Chapter 13 Short Run Aggregate Supply Curve two models of aggregate supply in which output depends positively on the price level in the short run about the short-run tradeoff between inflation and unemployment
Introduction to Economic Fluctuations
 Chapter 9 Introduction to Economic Fluctuations slide 0 In this chapter, you will learn facts about the business cycle how the short run differs from the long run an introduction to aggregate demand an
Sticky Wages and Prices: Aggregate Expenditure and the Multiplier. 5Topic
 Sticky Wages and Prices: Aggregate Expenditure and the Multiplier 5Topic Questioning the Classical Position and the Self-Regulating Economy John Maynard Keynes, an English economist, changed how many economists
Objectives of Macroeconomics ECO403
 Objectives of Macroeconomics ECO403 http//vustudents.ning.com Actual budget The amount spent by the Federal government (to purchase goods and services and for transfer payments) less the amount of tax
Session 9. The Interactions Between Cyclical and Long-term Dynamics: The Role of Inflation
 Session 9. The Interactions Between Cyclical and Long-term Dynamics: The Role of Inflation Potential Output and Inflation Inflation as a Mechanism of Adjustment The Role of Expectations and the Phillips
The Influence of Monetary and Fiscal Policy on Aggregate Demand. Premium PowerPoint Slides by Ron Cronovich
 C H A P T E R 34 The Influence of Monetary and Fiscal Policy on Aggregate Demand Economics P R I N C I P L E S O F N. Gregory Mankiw Premium PowerPoint Slides by Ron Cronovich 2009 South-Western, a part
economic fluctuations. Part 1.
 Dynamic approach to short run economic fluctuations. Part 1. The Phillips Curve & Dynamic Aggregate Supply Motivation The static AD/SAS model fails to take into account inflation The dynamic model, which
Dynamic Change, Economic Fluctuations, and the AD AS Model
 C H A P T E R 10 Dynamic Change, Economic Fluctuations, and the AD AS Model C H A P T E R F O C U S What factors change aggregate demand? What factors change aggregate supply? How will an economy adjust
Macroeconomics, Cdn. 4e (Williamson) Chapter 1 Introduction
 Chapter 1 Introduction") Macroeconomics, Cdn. 4e (Williamson) Chapter 1 Introduction 1) Which of the following topics is a primary concern of macro economists? A) standards of living of individuals B) choices of individual consumers
Macroeconomics, Cdn. 4e (Williamson) Chapter 1 Introduction 1) Which of the following topics is a primary concern of macro economists? A) standards of living of individuals B) choices of individual consumers
Chapter 13. Aggregate Demand and Aggregate Supply
 Chapter 13 Aggregate Demand and Aggregate Supply 1 Output and Price Level Figure 1 Two-Way Relationship Between Output and Price Level Aggregate Demand Curve Price Level Real GDP Aggregate Supply Curve
AGGREGATE SUPPLY, AGGREGATE DEMAND, AND INFLATION: PUTTING IT ALL TOGETHER Macroeconomics in Context (Goodwin, et al.)
") Chapter 13 AGGREGATE SUPPLY, AGGREGATE DEMAND, AND INFLATION: PUTTING IT ALL TOGETHER Macroeconomics in Context (Goodwin, et al.) Chapter Overview This chapter introduces you to the "Aggregate Supply /Aggregate
Chapter 13 AGGREGATE SUPPLY, AGGREGATE DEMAND, AND INFLATION: PUTTING IT ALL TOGETHER Macroeconomics in Context (Goodwin, et al.) Chapter Overview This chapter introduces you to the "Aggregate Supply /Aggregate
Introduction to Economic Fluctuations
 CHAPTER 10 Introduction to Economic Fluctuations Modified for ECON 2204 by Bob Murphy 2016 Worth Publishers, all rights reserved IN THIS CHAPTER, OU WILL LEARN: facts about the business cycle how the short
Economic Fluctuations
 Sherif Khalifa Sherif Khalifa () Economic Fluctuations 1 / 29 Definition The business cycle describes the fluctuations in the production output of goods and services in an economy. The business cycle is
SV151, Principles of Economics K. Christ February 2012
 SV151, Principles of Economics K. Christ 13 17 February 2012 SV151, Principles of Economics K. Christ 14 February 2012 Key terms / chapter 23: Aggregate demand Wealth effects Interest rate effects Exchange
LECTURE 18. AS/AD in demand-deficient Ireland: Unemployment and Deflation
 LECTURE 18 AS/AD in demand-deficient Ireland: Unemployment and Deflation THE AGGREGATE SUPPLY CURVE Aggregate supply curve Each possible price level Quantity of goods & services All nation s businesses
Assumptions of the Classical Model
 Meridian Notes By Tim Qi, Amy Young, Willy Zhang Economics AP Unit 4: Keynes, the Multiplier, and Fiscal Policy Covers Ch 11-13 Classical and Keynesian Macro Analysis The Classic Model the old economic
Chapter 11 The Determination of Aggregate Output, the Price Level, and the Interest Rate
 Principles of Macroeconomics Twelfth Edition Chapter 11 The Determination of Aggregate Output, the Price Level, and the Interest Rate Copyright 2017 Pearson Education, Inc. 11-1 Copyright 11-2 Chapter
Notes From Macroeconomics; Gregory Mankiw. Part 4 - BUSINESS CYCLES: THE ECONOMY IN THE SHORT RUN
 Part 4 - BUSINESS CYCLES: THE ECONOMY IN THE SHORT RUN Business Cycles are the uctuations in the main macroeconomic variables of a country (GDP, consumption, employment rate,...) that may have period of
Part III. Cycles and Growth:
 Part III. Cycles and Growth: UMSL Max Gillman Max Gillman () AS-AD 1 / 56 AS-AD, Relative Prices & Business Cycles Facts: Nominal Prices are Not Real Prices Price of goods in nominal terms: eg. Consumer
Aggregate Demand and Aggregate Supply with Policies. Premium PowerPoint Slides by Ron Cronovich, Updated by Vance Ginn
 C H A P T E R 33 & 34 Aggregate Demand and Aggregate Supply with Policies Economics P R I N C I P L E S O F N. Gregory Mankiw Premium PowerPoint Slides by Ron Cronovich, Updated by Vance Ginn 2009 South-Western,
The Influence of Monetary and Fiscal Policy on Aggregate Demand
 Chapter 32 The Influence of Monetary and Fiscal Policy on Aggregate Demand Test B 1. Of the effects that help explain why the U.S. aggregate demand curve slopes downward the a. wealth effect is most important
Econ 102 Final Exam Name ID Section Number
 Econ 102 Final Exam Name ID Section Number 1. Which of the following is not an accurate statement of core capital goods? A) proxy for business investments B) does not include transportation equipment C)
AQA Economics AS-level
 AQA Economics AS-level Macroeconomics Topic 2: How the Macroeconomy Works 2.2 Aggregate demand and aggregate supply analysis Notes Aggregate demand is the total demand in the economy. It measures spending
CH 20 Introduction to Macroeconomics. Asst. Prof. Dr. Serdar AYAN
 CH 20 Introduction to Macroeconomics Asst. Prof. Dr. Serdar AYAN Introduction to Macroeconomics Microeconomics examines the behavior of individual decision-making units business firms and households. Macroeconomics
Chapter 10/9. Introduction to Economic Fluctuations 10/8/2017. The chapter covers: Facts about the business cycle
 Chapter 1/9 Introduction to Economic Fluctuations The chapter covers: facts about the business cycle and Okun s Law an introduction to aggregate demand an introduction to aggregate supply in the short
Chapter 9: The IS-LM/AD-AS Model: A General Framework for Macroeconomic Analysis
 Chapter 9: The IS-LM/AD-AS Model: A General Framework for Macroeconomic Analysis Cheng Chen SEF of HKU November 2, 2017 Chen, C. (SEF of HKU) ECON2102/2220: Intermediate Macroeconomics November 2, 2017
Module 19 Equilibrium in the Aggregate Demand Aggregate Supply Model
 What you will learn in this Module: The difference between short-run and long-run macroeconomic equilibrium The causes and effects of demand shocks and supply shocks How to determine if an economy is experiencing
Macroeconomic Analysis Econ 6022
 1 / 36 Macroeconomic Analysis Econ 6022 Lecture 10 Fall, 2011 2 / 36 Overview The essence of the Keynesian Theory - Real-Wage Rigidity - Price Stickiness Justification of these two key assumptions Monetary
Macroeconomics: Principles, Applications, and Tools
 Macroeconomics: Principles, Applications, and Tools NINTH EDITION Chapter 11 The Income- Expenditure Model Learning Objectives 11.1 Discuss the income-expenditure model. 11.2 Identify the two key components
EC and MIDTERM EXAM I. March 26, 2015
 EC102.03 and 102.05 Spring 2015 Instructions: MIDTERM EXAM I March 26, 2015 NAME: ID #: You have 80 minutes to complete the exam. There will be no extensions. The exam consists of 40 multiple choice questions.
MULTIPLE CHOICE. Choose the one alternative that best completes the statement or answers the question.
 Exam - Version A Name 1) Full-employment output is: A) the level of output that is produced when there is no voluntary unemployment. B) the level of output that is produced when the unemployment rate is
Analysis of Business Cycles II : The Supply Side of the Economy
 Analysis of Business Cycles II : The Supply Side of the Economy 1 Introduction 2 3 4 I Introduction Aggregate supply behaves differently in the short-run than in the long-run. In the long-run, prices are
Chapter 23. The Keynesian Framework. Learning Objectives. Learning Objectives (Cont.)
") Chapter 23 The Keynesian Framework Learning Objectives See the differences among saving, investment, desired saving, and desired investment and explain how these differences can generate short run fluctuations
Chapter 23 The Keynesian Framework Learning Objectives See the differences among saving, investment, desired saving, and desired investment and explain how these differences can generate short run fluctuations
To sum up: What is an Equilibrium?
 Classical vs Keynesian Theory To sum up: What is an Equilibrium? SHORT RUN EQUILIBRIUM: AD = SRAS and IS = LM The Labor Market need not be in equilibrium We need not be at the potential level of GDP Y*
A. Regular attendance is crucial to success in this class. Poor attendance will harm your participation grade. Grade categories are as follows:
 AP Macroeconomics JOHNSON Spring 11 AP Macroeconomics is a one-semester, college-level course. Each student is expected to take the AP Macroeconomics Exam that is administered in May. Successful achievement
Synthesis for Macroeconomics Summary of Aggregate Demand and Aggregate Supply Relevance of Fiscal and Monetary Policy. Fernando Nandy T. Aldaba, Ph.
 Synthesis for Macroeconomics Summary of Aggregate Demand and Aggregate Supply Relevance of Fiscal and Monetary Policy Fernando Nandy T. Aldaba, Ph.D Senior Executives Class Batc 3 Sinagtala APPLIED PUBLIC