|
|
|
- Lesley Parsons
- 5 years ago
- Views:
Transcription

1
2
3
4
5
6
7

8
9
10
11
12 Investment Companies Pool funds of individual investors and invest in a wide range of securities or other assets. pooling of assets Mutual Funds and Other Investment Companies Provide several functions to investors: Administration & record keeping Status reports, keep track of dividend, gains etc.. Diversification & divisibility can Act as large investors even if any individual can not Professional management can hire professional analysts, fund managers. Reduced transaction costs substantial brokerage and commissions. NAV : Net asset value Investment companies need to divide claims to the pooled assets among investors Investor buy shares in investment companies, the value of each share are expressed as net asset value. NAV : Net asset value Example : Assets $ Liabilities $270.3 #Shares The net asset value (NAV) of the portfolio : = ( ) / = $27.97 per share
13 Types of Investment Companies Unit Investment Trusts (Unit Trust) Fixed portfolio : brokerage buys a portfolio of securities and sell to investors. Unmanaged : fixed portfolio composition Sponsors profits generated from buy low sell high Lost market share to mutual fund : Total assets have declined from $105 billion in 1990 to $29 billion in 2009 Types of Investment Companies Managed Investment Companies Open-End (commonly known as mutual funds) issues new shares when investors buy in and redeems shares when investors cash out Priced at Net Asset Value (NAV) mutual fund do not traded on organized exchanges Types of Investment Companies Managed Investment Companies Closed-End no change in numbers of shares outstanding; old investors cash out by selling to new investors Priced at premium or discount to NAV common stock Types of Investment Companies Other investment organizations Commingled funds (pooled fund) economies of scale REITs Invest in real estate or loan backed by real estate Equity trust : invest directly in real estate Mortgage trust : invest in mortgage loan Hedge Funds usually have lock ups initial investment can not withdrawn for the first years
14 Mutual Funds: Open-End Investment Companies Many fund types Money Market Sector Bond Balanced Asset Allocation and Flexible (high risk) Index International How Funds Are Sold -marketed funds - Mail, Newspaper or Internet Revenue sharing on sales force distributed Potential conflicts of interest : brokerage tend to recommend funds that pay them Costs of Investing in Mutual Funds Apart from past performance and fund policy, investors should take a look at costs. Fee Structure: Four types 1. Operating expenses % of assets usually 1-2% 2. Front-end load sales charge for broker 3. Back-end load exit fee 4. 12b-1 charges deductable from net assets if <= 1% Fees must be disclosed in the prospectus Mutual Fund Returns Mutual Fund Returns are measures as the changes on NAV plus income distributions, expressed as a fraction of NAV at the beginning of investment period Example : Mutual fund returns
15 Mutual Fund Returns : Example Class A : front-end load 4% Class B : 12b-1 0.5% annually & back-end load start at 5% and reduce by 1% each year (until fifth year) Assume 10% rate of returns net of operating expense annually. What will be the value of investment in class A and Class B shares after 1) 4 years 2) 10 years? Which asset class provide higher net proceeds at the end of each horizon? Sol. 4 year : Class A : front end load 4%, Class B: x% 12b-1 fee + 1% back end load : Class A : 10% annual return, Class B : = 9.5% net Mutual Fund Returns : Solutions 4 years : Class A : front end load 4%, Class B: x% 12b-1 fee + 1% back end load : Class A : 10% annual return, Class B : = 9.5% net Hence ; Net Proceed A : = (0.96*10000)*(1+0.1) 4 = 14, Net Proceed B : = 10000*(1-0.01)*( ) 4 = 14, years : Class A : front end load 4%, Class B: 12b-1 fee 0% back end load : Class A : 10% annual return, Class B : = 9.5% net Hence ; Net Proceed A : = (0.96*10000)*(1+0.1) 10 = 24, Net Proceed B : = 10000*( ) 10 = 24, Hence ; Net Proceed A : = (0.96*10000)*(1+0.1) 4 = 14, Net Proceed B : = 10000*0.99*( ) 4 = 14, Exchange Traded Funds (ETF) Textbook Examples: spiders S&P Depository Receipt, diamonds DowJoans industry ticker DIA and cubes NASDAQ 100 ticker QQQ Thai Market Examples : TDEX (SET50 ETF), GLD (Gold track ETF), TH100 (SET100 ETF) Trade continuously like stocks Can be sold short or purchased on margin Lower costs Tax efficient Hedge Funds Prices can depart by small amounts from NAV Must be purchased from a broker


16 Similarities : Mutual Funds and Hedge Funds Similarities Both are pooled investments Both represent investor s stake in the portfolio as NAV But Many differences..
 The fund buys shares in India Investment Fund, a closed-end fund that is selling at a discount to NAV, and sells the MSCI India index swap 2) The fund buys shares")
17 Hedge Fund Styles Hedge fund Strategies: Example Hedge fund Strategies: Solutions Clarify each of the following strategies as directional or non-directional Clarify each of the following strategies as directional or non-directional 1) The fund buys shares in India Investment Fund, a closed-end fund that is selling at a discount to NAV, and sells the MSCI India index swap 2) The fund buys shares in Petrie stores and sell toy r us, which is a 3) The fund buys shares in Generic Pharmaceuticals, betting that it will 1) Non-directional, long in India investment, short in India index constitute a hedged position. 2) Non-directional, both positions are driven by the performance of Toy R us. Hence, long petries stores and short Toy R us constitute a hedged position. 3) Directional. The trading strategy is an outright bet that the price of generic pharmaceuticals will receive favorable effect from the takeover bid by Pfizer.

18
19

 Used cars - Direct search (internet or")
, Brokered markets a) Rare")
20 Many assets trade in more than one type of market Ex. What types of markets do the following trade in? a) Used cars - Direct search (internet or sale banner), Dealer markets b) Land - Direct search (internet), Brokered markets a) Rare Books - Dealer markets, Auction markets
21
 What is the initial margin set by the broker?")
 How far can the price fall before the investor get a margin call? Sol.")
22 Buying on margin : Example Suppose an investor initially pays $6,000 toward the $10,000 worth of stock (100 shares) the rest were borrowed from the broker. The broker set maintenance margin at 40% a) What is the initial margin set by the broker? b) How the investor s initial balance sheet will look like? c) How far can the price fall before the investor get a margin call? Sol. Initial share price = 10,000/ 100 = $100 per share Initial Margin = 6000/10000 = 60% Borrowed amount = = 4,000
23 Illustration of buying on margin In summary, investors can borrow from broker and increase their returns. But..Buying on margin magnifies both returns and downside risk! Suppose an investor buy 200 shares on margin at the current price of $100 per share, the broker set an initial margin of 50%. Broker s interest rate on margin loan = 9% per year. Ignoring any dividends. What happen if share price change in either direction by 30% after one year? Illustration of buying on margin : solutions Initial stock value = 200*100 = $20,000 50% initial margin > Investor initial investments = $10,000 paid by cash another $10,000 were borrow from broker at the end of the period, investor have to pay interest 9% of the borrowed amount (9% of $10,000) = $900 plus the principle of 10,000 Scenario 1: price rise 30% Stock value after 1 year = 1.3*200*100 = 26,000 Total liabilities = 10, = 10,900 Paying off principal (10000) & Int.(900) leaves = $15,100 for investor Investor s rate of returns = (15,100 10,000) / 10,000 = 51% Illustration of buying on margin : solutions Scenario 2: price drops 30% Stock value after 1 year = 0.7*200*100 = 14,000 Total liabilities = 10, = 10,900 Thus, leaving the investor = 3100 after paying off debt + int. Investor s rate of returns = / 10,000 = -69% -69% is an disastrous rate of returns, magnified by buying on margin! Scenario 3: price remain unchanged Stock value after 1 year = 200*100 = 20,000 Total liabilities = 10, = 10,900 Thus, leaving the investor = 9100 after paying off debt + int. Investor s rate of returns = / 10,000 = -9% If share price unchanged, the rate of return = - interest rate on debt
24
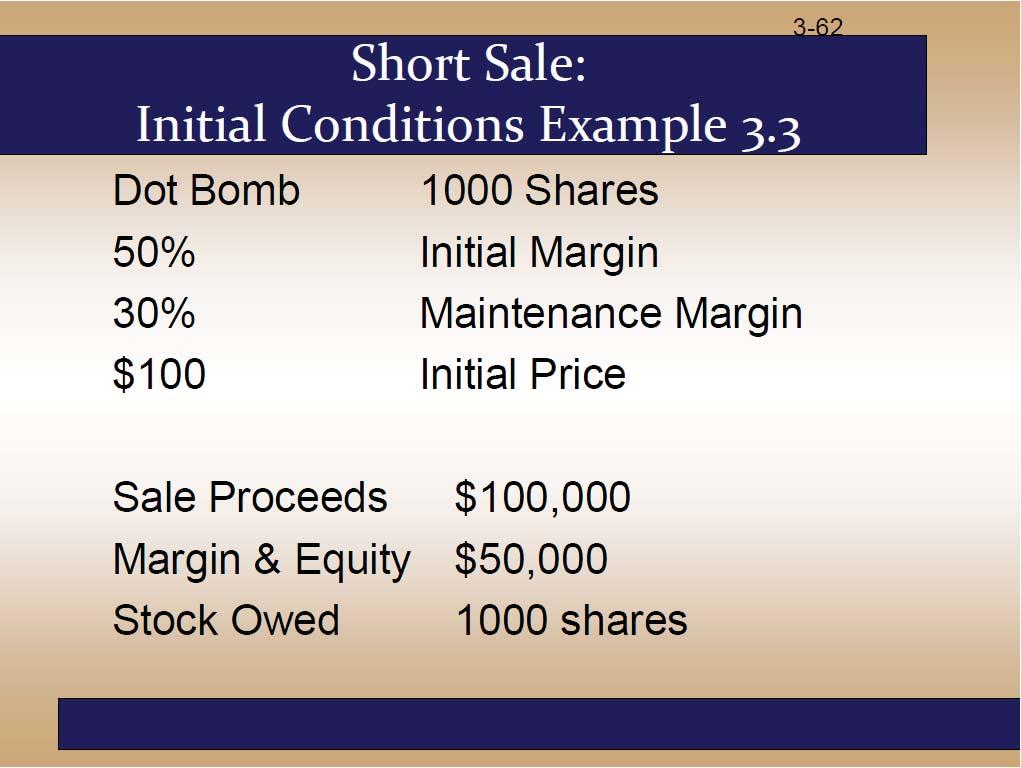
25 Example: Short Sale margin call Suppose the broker has a maintenance margin of 30%, how much can the share price of Dot Bomb rise before you get a margin call? Sol. Let P be the price of Dot Bomb Hence, value of shares you must pay back is 1000P Total Equity in your account is 150, P Margin = Equity / Value of shares owed Example: Short Sale margin call From the previous example, if the stock price increase to $120, how much more does the investor have to pay in order to maintain 30% maintenance margin? Sol. The balance sheet will look like this Assets Liabilities $100,000 (sale proceeds) $120,000 $50,000 (initial margin) Equity $30,000 Sol: 30% = Required Equity/value of share owned 0.3 = Required Equity/120,000 => Required Equity = $36,000 The investor currently has only $30,000 in equity account Thus, the investor have to pay additional $6000 in order to meet the maintenance margin requirement
26
27 Rates of return Investors pay attention to the rate at which their fund have grown during the period Introduction to Risk, Return and the Historical Record The holding period returns (HDR) measure the percentage change in the price of the share over the investment period HPR assumes dividend paid at the end of holding period Example : HPR single period Ex. You invested in a FTSE500 index fund, the price of a share in the fund is currently $100, and your time horizon is a year. You expect cash dividend during the year to be $4 (so dividend yield = 4%), what is your holding-period return? Sol. Ending Price = 110 Beginning Price = 100 Dividend = 4 Rates of return over multiple periods HPR measure return over a single period But often you will be interested in average returns over a longer periods. Hence, one can calculate arithmetic average and geometric average over the investment period. Calculate Holding Period Return (HPR) HPR = ( ) / 100 = 14%
28 Geometric Average Return Example : Geometric Average Return Ex. You invested in a FTSE500 index fund, the holding period return of the fund was 10%, 25%, -20% and 20% over the past 4 quarters. What is the average geometric return over the year? By solving eq. (1+g) n = TV n, we will get ; Sol. (1+0.10)*(1+0.25)*(1-0.20)*(1+0.20) = (1+g) 4 Calculate average geometric return g = [(1+0.10)*(1+0.25)*(1-0.20)*(1+0.20)] 1/4-1 = 7.19% Annual Percentage Rates : APR In the same example, fund may choose to annualize its return using annual percentage rate (APR) Returns on assets with regular cash flows (ex. mortgages (monthly payments) & bonds (semi annual coupons)), are usually quoted as annual percentage rate (APR) APR : annualizing per-period rate using simple interest, ignoring the compound interest during the period. Hence, APR does not equal the rate at which your investment actually grow. This is called the effective annual rate (EAR) EAR : actual percentage increase in funds invested over a year horizon Example : APR and EAR Ex. You buy UK treasury certificates with 100,000 face value maturing in 1 month for 99,000. On the maturity date, you reinvest the amount in the treasury certificates. What is your EAR and APR? Sol. HPR = (100,000-99,000) / 99,000 = 1000 / 99,000 = % per month The APR is *12 = 12.12% per year But the effective annual rate is higher due to compounding rate (1+EAR) = = ; hence EAR = 12.82% per year
29 Scenario Analysis : Expected Return Example : Expected Return As we attempt to quantify risk, we could begin with a question : What HPRs are possible and how likely are they? The answer to the question require scenario analysis : expected returns? And likely hood? In a scenario, we can compute the expected returns as Scenario analysis : Variance and Standard Deviation Example : Scenario VAR & SD So we can calculate the expected returns, but how about risks? Risk (uncertainties) can be quantified as Variance or SD -> Weight VAR with prob. p(s)
 What are the standard deviation of returns on stock X and Y? 3) Assume that of your $10,000 portfolio, you invest $8000 in stock X and $2000 in stock Y.")
30 Example2 : Scenario VAR & SD Bear Market Normal Market Bull Market Prob Stock X -20% 18% 50% Stock Y -15% 20% 40% 1) What are the expected returns for stock X and Y? 2) What are the standard deviation of returns on stock X and Y? 3) Assume that of your $10,000 portfolio, you invest $8000 in stock X and $2000 in stock Y. What is the expected return of your portfolio? Sol. 1) E(R x ) = 0.2* * *0.50 = 20% E(R y ) = 0.2* * *0.40 = 19% 2) Var x = 0.2*(-.2-.2) ( ) (.5-.2) 2 = Var y = 0.2*( ) ( ) (.4-.19) 2 = x y 3) E(r p ) = 0.8*20% + 0.2*19% = 19.8% The normal distribution So far, we talked about quantifying portfolio risk by Var and SD of returns. But why Var and SD as measurement for risks? The distribution of returns over a short period are approximately normal. The distribution of returns over longer period (ex. a year), if expressed as compounded return, are also close to normal. Two important properties of normal distribution 1. The returns on portfolio comprising two or more assets whose returns are normally distributed also will be normally distributed 2. The normal distribution can be entirely described by mean and variance. No other statistic needed to learn about the distribution Will lead to an important conclusion The SD is an appropriate measure of risk for a portfolio of assets with normally distributed returns. No other statistic can improve the risk assessment conveyed by the SD of a portfolio. The normal distribution Figure : The normal distribution Investment management is easier when returns are normally distributed. Standard deviation is a good measure of risk when returns are normally distributed If security s returns are normally distributed, portfolio returns will be, too. Future scenarios can be estimated using only the mean and standard deviation

31 Normality and Risk Measures Skewness and Kurtosis What if excess returns are not normally distributed? Standard deviation is no longer a complete measure of risk Sharpe ratio is not a complete measure of portfolio performance Need to consider skewness and kurtosis Skewness Kurtosis The "minus 3" at the end of this formula is often explained as a correction to make the kurtosis of the normal distribution equal to zero Skewness Normal and Skewed Distributions skewness is a measure of the asymmetry of the probability distribution of a random variable about its mean. skewness does not determine the relationship of mean and median. Negative skew : The left tail is longer. The distribution is said to be left-skewed, left-tailed or skew to the left. Positive skew : The right tail is longer. The distribution is said to be right-skewed, right-tailed or skew to the right.

32 Kurtosis kurtosis is any measure of the "peakedness" of the probability distribution of a random variable. Negative excess kurtosis distribution are called platykurtic distributions. Positive excess kurtosis distribution are called leptokurtic distributions. Normal and fat-tailed Distributions Kurt = 0.35 Inflation and real rate of returns Real and Nominal Rates of Interest A 10% annual rate of returns mean that your investment worth 10% at the end of the year. However, this does not necessary mean that you could have bought 10% more goods with that. The reason is the effect of Inflation rate. Inflation rate measured by consumer price index (CPI) -typical consumption basket of an urban family of four Nominal interest rate: Growth rate of your money Real interest rate : Growth rate of your purchasing power (PP) Let R = nominal rate r = real rate I = inflation rate Then :
33 Example : Real interest rate A 10% annual rate of returns mean that your investment worth 10% at the end of the year. However, your research reveal that, over the same period, CPI increased by 6% Sol. Nominal rate = 10%, Inflation = 6%, r =? the real interest rate (r) = ( ) / (1+0.06) = 0.04 / 1.06 = 3.77% In this case, you purchasing power increased by 3.77% while nominal rate was 10% Equilibrium Nominal Rate of interest As the inflation rate increases, investors will demand higher nominal rates of returns If E(i) denotes current expectation of of inflation, then we get the Fisher Equation : Fisher equation stated a one-on-one relationship between nominal rate and inflation rate Nominal rate = real rate + inflation forecast Ideally, the correlation between nominal rate and expected inflation should be 1. In contrast, correlations between real rate and inflation should be zero. Example2 : Arithmetic and Geometric Average Return Ex. A portfolio of nondividend-paying stocks earned a geometric mean return of 5% between 1 Jan 2005 and 31 Dec The arithmetic mean return for the same period was 6%. If the market value of the portfolio on 1 Jan 2005 was $100,000, what was the market value of the portfolio at 31 Dec 2011? Sol > 2011 = 6 years 100,000*(1+0.05) 6 = $134,009.5 Why don t you care about the other estimate?
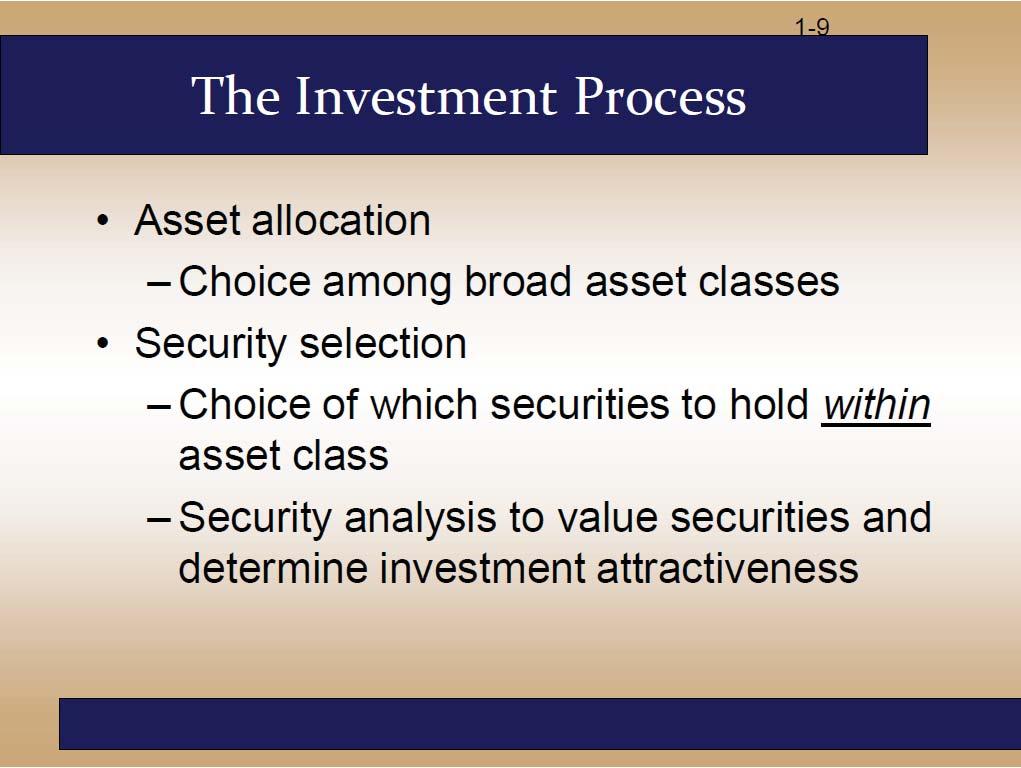
34 Allocation to Risky Assets Assumption : Investors are rational -Investors will avoid risk unless there is a reward Risk Aversion and Capital Allocation to Risky Assets In another word, investor will try to maximize their return, given a level of risk Different investor have different risk aversion. The optimal allocation between a risky portfolio and a risk-free asset varies according to investor s risk aversion. Risk Aversion Investors are willing to consider: risk-free assets risky assets with positive risk premiums Each investor has different risk aversion therefore the risk preference are different Portfolio attractiveness increases with expected return and decreases with risk. Hence the need for portfolio management : An important aspect of portfolio management is Asset allocation Asset Allocation The process to choose asset classes How much should you own in stock? How much should you own in bond? How much cash reserve? Asset Allocation provide the mean to control for risk.
35 The Risk-Free Asset The closest market instrument to risk-free is Gov. Bonds Only the government can issue default-free bonds. - Being default-free is not enough to make them riskfree in real terms Because. 1) inflation 2) the mismatch between maturity and investor s desired holding period A Portfolios of One Risky Asset and a Risk-Free Asset It s possible to create a complete portfolio by splitting investment funds between safe and risky assets. Let y = portion allocated to the risky portfolio, P (1-y) = portion to be invested in risk-free asset, F. Even though, T-bills usually viewed as the risk free asset Many money market instruments also considered risk-free in practice. Example y = the fraction of portfolio allocated in risky portfolio (P) Example (ctd.) The risk premium of the complete portfolio, C, equals the risk premium of the risky asset times the fraction of the portfolio invested in risky asset (y) Thus, the portfolio risk premium = 15%-7% = 8%
36 Example (ctd.) The standard deviation of the complete portfolio equals the standard deviation of the risky asset times the fraction of the portfolio invested in risky asset (y) Example (ctd.) and Risk premium 8%, r f =7%, SD p = 22% Since the portfolio of risky asset has the SD of 22% Measuring portfolio performance The reward-to-volatility ratio (Sharpe Ratio) Capital Allocation Line Sharpe ratio : measure the risk premium per level of per unit of standard deviation in an investment asset or a trading strategy Ex. A portfolio with SD = 20%, have portfolio return of 12%. Given the risk-free return = 4%, Sharpe ratio =? = (12%-4%) / 20% = 0.4 What is sharp ratio of a risk-free asset?
37 Ex. Capital Allocation Line Consider two portfolio P (y=1) and Portfolio C (y=0.5) Expected Return Risk Premium Standard Sharp Ratio Port P (y=1) 15% 8% 22% 8/22 = 0.36 Port C (y=0.5) 7%+0.5*8% = 11% 0.5*8% = 4% 0.5*22% = 11% 4/11 = 0.36 CAL : Borrowing To summarize : the risk premium and the standard deviation of the complete portfolio increase in proportion to the investment in the risky portfolio (y) All the points in CAL have the same slope = The sharp ratio = 8/22 = 0.36 To archive higher return than the return from 100% risky portfolio P (15%), the investor could leverage his/her position by borrowing to increase E(r) c > 15% This mean y > 1 and borrowing portion = y-1 Example : Leveraged CAL Suppose the investment budget is $300,000, and you borrows $120,000 more. You invest $420,000 in risky asset. What is your portfolio s return? Sol. In this case y = 420,000 / 300,000 = 1.4 Thus, E(r c ) = 7% (8%) = 18.2% Example : Leveraged CAL Another way to find the portfolio returns is : You expect to earn 15% of 420,000 63,000 But you need to pay 7% of 120,000 8,400 Thus, the net income ,600 You initial investment was 300,000 Thus, return 54,600 / 300, % Your portfolio still exhibit the same sharp ratio (all points in CAL) c = 1.4* 22 = 30.8% S = (E(r c )-r f ) / c = 0.36
38 Risk Aversion and Capital Allocation The optimal allocation of an investor will depend on his/her risk aversion Coefficient of Risk Aversion Investor s degree of Risk Aversion (A) : measure the risk premium per level of per unit of variance. Aka : price of risk The more risk-averse investors will choose to invest less in risky asset and more of the risk-free asset. To find the optimal allocation, we need to know the investor s risk-aversion This can be measured by the degree of risk aversion (A) Ex. An investor who hold a portfolio with annual risk premium of 10%, variance (SD 16%), we would infer the investor s degree of risk aversion = 0.10 / = 3.91 Risk Aversion and Capital Allocation We can find the investor's optimum allocation, y, by dividing the risky portfolio s price of risk by the investor s required price of risk Risk Aversion and Capital Allocation Risky Portfolio s risk premium to variance ratio = ( )/(0.2*0.2) = 2 Ex. What is the optimum allocation for an investor A=3.91, who considering investing in an index fund which give annual return of 12%, r f =4%, and SD of 20%. What is the expected return of the optimum portfolio? y = 2/3.91 = 0.51 Thus, optimum allocation is 51% in risky portfolio and the other 49% in the risk-free asset E(r) = 0.51*12%+0.49*4% = 8.08%
39 Passive strategies & CML The capital allocation line provided by one-month T-bills and a broad index of common stocks are called Capital Market Line (CML) Passive strategies based on the assumption that securities are always fairly priced Thus, there is no need to undertake security analysis. Investor can just choose a portfolio of all stocks in a broad market index such as the S&P500. This strategies called indexing Passive strategies Main benefit of passive strategies is to avoid search cost (cost of acquiring information about securities) Flip side of passive strategies is active strategies No doubt a really good fund manager can beat the market but Can you find him/her?, Even if you do, what about his/her fees? (Active -> cost of finding a good fund managers that consistently beat the market)
40 Recap : CAL CAL : a straight line that explain the investment opportunity of risky portfolio and a risk-free asset Optimal risky Portfolios The weight put in risk-free assets and risky portfolio Depend on Investor's risk aversion How to determine this risky portfolio then? Any investor will choose the same optimum portfolio (more on this later today) The Investment Decision Diversification and Portfolio Risk We can categorize risks of a firm into two groups Market Risks or Systematic risks (Non-diversifiable) from market-wide factors such as economic environment Firm s specific risk (diversifiable) - From firm s specific condition such as the success of the firm R&D project
 The more the better but the difference over 20 is marginal.")
 + Stock (E) measure of the way returns of two assets vary The efficiency of diversification depend on Covariance between")
41 Portfolio Risk vs Number of firms Portfolio Risk vs Number of firms The SD of equal-weighted portfolio selected at random from NYSE vs. Number of firms in portfolio. Diversification can not eliminate all risks (Market risk remains) The more the better but the difference over 20 is marginal. Covariance and Correlation Portfolio risk depends on the correlation between the returns of the assets in the portfolio Two security portfolio return Example a portfolio consist of Bond (D) + Stock (E) measure of the way returns of two assets vary The efficiency of diversification depend on Covariance between individual assets in question
42 Two security: portfolio risk Two security: portfolio risk Let rho ( DE ) be the Correlation Coefficient of returns Portfolio variance is; Since Thus, another way to express the equation (defined as a function of covariance) is; Covariance Definition Covariance Possible Values Sum of Probability-weighted product between D & E
43 Covariance Possible Values Covariance and Diversification If, and only if, DE = 1 there is no diversification at all When DE = -1, a perfect diversification is possible Three assets portfolio Three assets portfolio


44 Portfolio SD vs Weight Portfolio Expected return vs SD Region in the bottom are too much weight in Bond (low return but taking some risk) For a given level of risk, there are 2 possible weight that yield different return Minimum Variance Portfolio Correlation Effects


 Investor will maximize return, given a level of risk => All investors,")
45 Capital Allocation Line : Recap The opportunity set of the debt and Equity funds and two feasible CALs But why stop at A & B? Recap : Investor will maximize return, given a level of risk That is; maximize slope > The Sharpe ratio Recap: Slope of CAL = The Sharpe Ratio The tangency portfolio is the optimal risky portfolio Because the tangency will yield portfolio with highest slope (Sharpe Ratio) Investor will maximize return, given a level of risk => All investors, regardless of risk aversion, will pick the same risky portfolio.

 Determination of risk")
46 Determination of the optimal complete portfolio High risk-averse investor prefers more weight in riskfree asset, and vice versa All investors will pick the same risky portfolio but different capital allocation along CAL. Indifference curve represent substitution, given riskreturn. The location along x- axis depend on investor s risk aversion. Markowitz portfolio selection model Security Selection The first step is to determine the risk-return opportunities available. All portfolios that lie on the minimum-variance frontier from the global minimum-variance portfolio and upward provide the best risk-return combinations (Efficient frontier) Determination of risk returns opportunities Markowitz portfolio selection model Step 2: Find the CAL that give highest return given a level of risk We now search for the CAL with the highest rewardto-variability ratio (Maximize the Sharpe Ratio)

 2.")
47 Markowitz portfolio selection model Markowitz portfolio selection model Markowitz portfolio selection model risk aversion. But.. More risk-averse investors put more in the risk-free asset. Less risk averse investors put more in risky portfolio, P Summarize : Separation Property choice problem may be separated into two independent tasks 1. Determination of the optimal risky portfolio is purely technical. (find all feasible investment opportunities and optimal portfolio, P) 2. Allocation of the complete portfolio to T-bills versus the risky portfolio depends on personal preference.
48 Recap : Optimum Risky Portfolio The tangency between CAL & Efficient Frontier is the optimum risky portfolio, P Capital Asset Pricing Model The determination of the optimum portfolio, P, is purely technical. The weight put in risk-free assets and risky portfolio Depend on Investor's risk aversion Diversification can diversify firm-specific risk Capital Asset Pricing Model is the equilibrium model that underlies all modern financial theory greatly simplified assumptions Lintner and Mossin are researchers credited with its development in 60 s and equilibrium expected returns Assumptions of the Market Market are perfectly efficient and equally profitable for all investors. Cost of Information for security analysis = 0 All risky assets are tradable Transaction Cost = 0 No single investor is wealthy enough to affect market prices. Unlimited lending/borrowing at risk-free rate identical returns from securities
 & they all well informed, investors")
49 Assumptions of Investors Investors are identical to each other in everyway except initial wealth and risk aversion. Thus, they choose portfolio in the same manner Investors are rational, mean- Investors are 100% efficient at valuation of securities (recall market assumption) & they all well informed, investors will have Homogenous Expectations Resulting Equilibrium Conditions investors will choose market portfolio(m) as their risky portfolio which includes all assets in security universe. M will be on the efficient frontier and it will also be optimal risky portfolio. Thus, capital market line (CML) is the best attainable CAL Resulting Equilibrium Conditions Resulting Equilibrium Conditions The risk premium on the market is proportional to the variance of the market portfolio and average degree of risk aversion across all investors Risk premium on an individual security is a function of its covariance with the market (beta coefficient)
50 Why would investors hold the market portfolio? Market Risk Premium All overpriced stocks will adjust its price downward until investors buy them Thus, all stocks will earn its place in investor s portfolio will choose the market portfolio as their risky portfolio. Example : Market Risk Premium -free rate is 5% and average investor s risk aversion coefficient is 2. And the standard deviation of market portfolio is 20%. What is the expected market return? 2 = Risk Premium / 0.2*0.2 => Risk Premium = 8% E(r m ) = R f + Risk Premium = = 13% If investors are more risk-averse, they will required higher compensation. Thus, the expected market return increase with average investors risk aversion. The contribution of a single security (s) to the risk of a large diversified portfolio(the market portfolio minus the security in question) only on the systematic risk of the security as measured by beta. yield the same risk premium to systematic risk ratio. Thus, equating the ratio >
 times the risk premium of the (benchmark), market portfolio. The security Market Line (CML) If we plot the mean-beta relationship.")

51 CAPM: return-beta relationship Rearranging results in the CAPM expected return-beta relationship In words, an asset s risk premium equals the asset's systematic risks measures (beta) times the risk premium of the (benchmark), market portfolio. The security Market Line (CML) If we plot the mean-beta relationship. Let E(r) be the y-axis and beta be the x-axis. We will get the security market line. The CML express the returns as a function of systematic risk All fair value securities are plotted on the CML Underpriced and Overpriced stock, will be plotted above and below CML, respectively. The deviation from CML is stock alpha. The security Market Line (CML)
52 CAPM : Implications If all assumptions holds, CAPM is the best model to explain returns on risky assets security analysis. CAPM : Practical Considerations Real world vs. Utopia world - -tradable - the theoretical market portfolio includes all assets (real-estate, foreign stocks etc.) - - future returns. CAPM : Homework 1) 1.5 The expected return on the market is 11% and R f = 5% What is the alpha of each stock? Which one is better buy? each on the graph. 2) If r f =8% and the expected return on market portfolio 16%. A firm consider a project with an estimated beta of 1.3. What is the required rate of return on the project? If the IRR=19% should the firm proceed with the project?
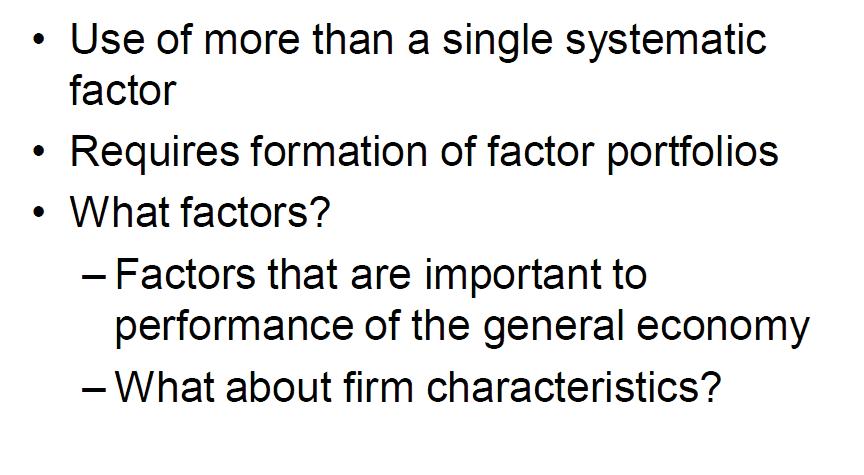
53 Recap : CAPM Is a form of single factor model (one market risk premium) Arbitrage Pricing Theory and Multifactor Models of Risk and Return Based on a set of assumptions. Many of which are unrealistic One factor to proxy for risk premium In CAPM, alpha assumed to be zero. But real-world test reject this. The search for better model continues.. Single Factor Model Single Factor Model : Equation Returns on a security come from two sources: 1) Common macro-economic factor (market risk) 2) Firm specific events (specific risk) -economic factors. (more than 1) Gross Domestic Product Growth Interest Rates Inflation Etc

54 Multifactor Models Multifactor Models Equation Multifactor SML Models Multifactor Model Interpretation
55 Multifactor Model Example Suppose Eazyjet has a theoretical market beta of 1.2 and T-bond beta of 0.7. The European market risk premium is 6% while T-bond portfolio (comprise of a basket of European Gov. bonds) is 3%. What is the expected return of Eazyjet? Sol. E(r) = 4%+1.2*6%+0.7*3% = 13.3% Arbitrage Pricing Theory Arbitrage is the act of exploiting mispricing of two of more securities to achieve risk-free returns. Arbitrage occurs if there is a zero investment portfolio with a sure profit. Ross (1976) derived APT based on an assumption that well-functioning market preclude arbitrage opportunities Arbitrage Pricing Theory Arbitrage Pricing Theory Since the return from arbitrage opportunity is risk free and to earn such profit require zero net investment (Example : short high price long low price of the same security) Since no investment is required, investors can create large positions to obtain sure profits. Violation of APT pricing relationships will cause extremely high pressure to correct price.
 = p + p R M +e p APT & Well-Diversified Portfolios W M = - p Benchmark W M R M = - p R M W")
 p +e p Returns as Function of Systematic Factor An arbitrage")
56 Port Weight APT & Well-Diversified Portfolios In Asset Contribution to Excess Returns W p = 1 Portfolio P W p ( p + p R M +e p ) = p + p R M +e p APT & Well-Diversified Portfolios W M = - p Benchmark W M R M = - p R M W f = p -1 Risk-free asset = 0 Portfolio A (Will be Arbitrage Portfolio if it is well diversified e p =0) W f *0 = 0 (excess returns measured over r f ) p +e p Returns as Function of Systematic Factor An arbitrage opportunity

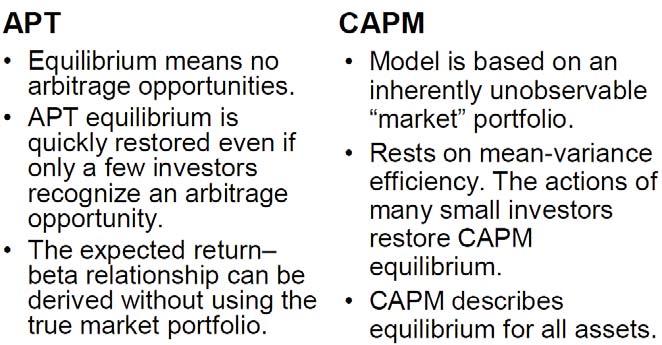
57 APT Model APT & CAPM Multifactor APT Two Factor model
58 Factor Portfolios What factors in Multifactor model? Need important systematic risk factors Chen, Roll, and Ross used industrial production, expected inflation, unanticipated inflation, excess return on corporate bonds, and excess return on government bonds. (Macroeconomic Factors) Fama and French used firm characteristics that proxy for systematic risk factors. (HML, SMB) Fama-French 3 factor model Fama-French 3 factor model Motivated by the observation that average returns on small stocks (SMB) & value stocks (HML) SMB : Small (mkt. cap) minus big Small stocks maybe more sensitive to changes in business conditions HML : High (book-to-market) minus low Firms in financial distress tend to have market value close to its book value
59 APT : Homework The market price of security is $30. Its expected rate of return is 10%. R f =4% and risk premium is 8%. The stock is expected to pay a constant dividend in perpetuity. What will be the market price of the securities be if the beta double (all other variable remains unchanged) $18.75
60 The Efficient Market Hypothesis Recap : APT & Multifactor Model APT - derive from no-arbitrage opportunity in equilibrium - relies on well-diversified portfolio but doesn t need a market portfolio to explain equilibrium -Agrees with CAPM on two things - source of risks from market risks & specific risks - risk-return trade off Multi Factor model - Factors that are important to general economies inflation, interest rates, FX..etc. -Firm characteristics to proxy for risks HML, SMB Efficient Market Hypothesis (EMH) Maurice Kendall (1953) found no predictable pattern in stock prices. particular day. changes? Efficient Market Hypothesis (EMH) EMH says stock prices already reflect all available information to favorable current performance, as market participants rush to trade on new information. Result: Prices change until expected returns are exactly commensurate with risk.
 information also must move unpredictably.")

61 Efficient Market Hypothesis (EMH) New information is unpredictable; if it could be predicted, then the prediction would be part of today s information. Cumulative Abnormal Returns Before Takeover Attempts: Target Companies (unpredictable) information also must move unpredictably. Stock Price Reaction to CNBC Reports EMH & Competition Information: Is the most precious commodity on Wall Street Strong competition assures prices reflect information. Information-gathering is motivated by desire for higher investment returns. But the marginal return on research activity may be so small that only managers of the largest portfolios will find them worth pursuing.
62 Strong form Semi Strong form Weak form Three Versions of EMH Types of Stock Analysis Technical Analysis - using historical prices and volume information to predict future prices Success depends on a sluggish response of stock prices to fundamental supply-and-demand factors. Weak form efficiency Relative strength Resistance levels Types of Stock Analysis Fundamental Analysis - using economic and accounting information to predict stock prices Try to find firms that are better than everyone else s estimate. Try to find poorly run firms that are not as bad as the market thinks. Semi strong form efficiency and fundamental analysis Active or Passive Portfolio Management Active Management An expensive strategy Suitable only for very large portfolios Passive Management: No attempt to outsmart the market Accept EMH Index Funds and ETFs Very low costs
63 Market Efficiency & Portfolio Management Even if the market is efficient a role exists for portfolio management: Market Efficiency & Firm Resource Allocation If markets were inefficient, resources would be systematically misallocated. Firm with overvalued securities can raise capital too cheaply. Firm with undervalued securities may have to pass up profitable opportunities because cost of capital is too high. Event Studies How tests are Structured Empirical financial research enables us to assess the impact of a particular event on a firm s stock price. difference between the stock s actual return and a proxy for the stock s return in the absence of the event.
64 Magnitude Issue Are Markets Efficient? Only managers of large portfolios can earn enough trading profits to make the exploitation of minor mispricing worth the effort. Selection Bias Issue Weak-Form Tests Returns over the Short Horizon Momentum: Good or bad recent performance continues over short to intermediate time horizons Episodes of overshooting followed by correction Only unsuccessful investment schemes are made public; good schemes remain private. Predictors of Broad Market Returns Fama and French Aggregate returns are higher with higher dividend ratios Shiller Earnings yield can predict market returns Semi-strong tests : Anomolies P/E Effect -to-market Ratios - Keim and Stambaugh Bond spreads can predict market returns


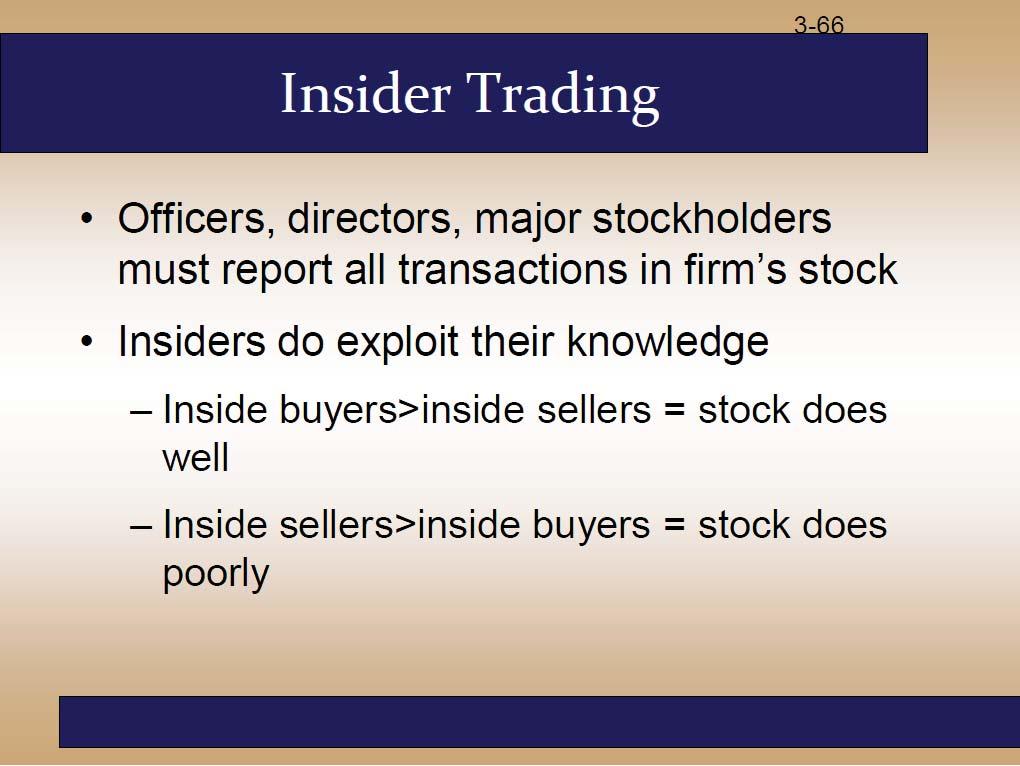
65 Average Annual Return for 10 Size-Based Portfolios, Average Return as a Function of Book-To- Market Ratio, Cumulative Abnormal Returns in Response to Earnings Announcements Strong Form Tests : Insider s Information The ability of insiders to trade profitability in their own stock has been documented in studies by Seyhun, Givoly, and Palmon activity

66 Interpreting the Anomalies The most puzzling anomalies are price-earnings, small-firm, market-to-book, momentum, and long-term reversal. Returns to Style Portfolio as a Predictor of Fama and French argue that these effects can be explained by risk premiums. Lakonishok, Shleifer, and Vishney argue that these effects are evidence of inefficient markets. Interpreting the Evidence Anomalies or data mining? Some anomalies have disappeared. Book-to-market, size, and momentum may be real anomalies. Interpreting the Evidence Bubbles and market efficiency Prices appear to differ from intrinsic values. Rapid run up followed by crash Bubbles are difficult to predict and exploit.
67 Stock Market Analyst Some analysts may add value, but: from changes in investor demand Findings may lead to investing strategies that are too expensive to exploit
Arbitrage Pricing Theory and Multifactor Models of Risk and Return
 Arbitrage Pricing Theory and Multifactor Models of Risk and Return Recap : CAPM Is a form of single factor model (one market risk premium) Based on a set of assumptions. Many of which are unrealistic One
The Efficient Market Hypothesis
 Efficient Market Hypothesis (EMH) 11-2 The Efficient Market Hypothesis Maurice Kendall (1953) found no predictable pattern in stock prices. Prices are as likely to go up as to go down on any particular
CHAPTER 11. The Efficient Market Hypothesis INVESTMENTS BODIE, KANE, MARCUS. Copyright 2011 by The McGraw-Hill Companies, Inc. All rights reserved.
 CHAPTER 11 The Efficient Market Hypothesis McGraw-Hill/Irwin Copyright 2011 by The McGraw-Hill Companies, Inc. All rights reserved. 11-2 Efficient Market Hypothesis (EMH) Maurice Kendall (1953) found no
Senior Finance Seminar (FIN 4385) Market Efficiency
 Market Efficiency") Senior Finance Seminar (FIN 4385) Market Efficiency Why do we care about Market Efficiency? Market Efficiency is the extent to which prices reflect. If markets are efficient, then what should we conclude
Senior Finance Seminar (FIN 4385) Market Efficiency Why do we care about Market Efficiency? Market Efficiency is the extent to which prices reflect. If markets are efficient, then what should we conclude
Chapter 1 - Investments: Background and Issues
 Chapter 1 - Investments: Background and Issues Investment vs. investments Real assets vs. financial assets Financial markets and the economy Investment process Competitive markets Players in investment
Session 6-8. Efficient Market Hypothesis (EMH) Efficient Market Hypothesis (EMH) Efficient Market Hypothesis (EMH)
 Efficient Market Hypothesis (EMH) Efficient Market Hypothesis (EMH)") 2 Efficient Market Hypothesis (EMH) Maurice Kendall (1953) found no predictable pattern in stock prices. Prices are as likely to go up as to go down on any particular day. How do we explain random stock
2 Efficient Market Hypothesis (EMH) Maurice Kendall (1953) found no predictable pattern in stock prices. Prices are as likely to go up as to go down on any particular day. How do we explain random stock
OPTIMAL RISKY PORTFOLIOS- ASSET ALLOCATIONS. BKM Ch 7
 OPTIMAL RISKY PORTFOLIOS- ASSET ALLOCATIONS BKM Ch 7 ASSET ALLOCATION Idea from bank account to diversified portfolio Discussion principles are the same for any number of stocks A. bonds and stocks B.
Risk and Return: Past and Prologue
 Chapter 5 Risk and Return: Past and Prologue Bodie, Kane, and Marcus Essentials of Investments Tenth Edition 5.1 Rates of Return Holding-Period Return (HPR) Rate of return over given investment period
FIN 6160 Investment Theory. Lecture 7-10
 FIN 6160 Investment Theory Lecture 7-10 Optimal Asset Allocation Minimum Variance Portfolio is the portfolio with lowest possible variance. To find the optimal asset allocation for the efficient frontier
CHAPTER 5. Introduction to Risk, Return, and the Historical Record INVESTMENTS BODIE, KANE, MARCUS. McGraw-Hill/Irwin
 CHAPTER 5 Introduction to Risk, Return, and the Historical Record McGraw-Hill/Irwin Copyright 2011 by The McGraw-Hill Companies, Inc. All rights reserved. 5-2 Interest Rate Determinants Supply Households
EQUITY RESEARCH AND PORTFOLIO MANAGEMENT
 EQUITY RESEARCH AND PORTFOLIO MANAGEMENT By P K AGARWAL IIFT, NEW DELHI 1 MARKOWITZ APPROACH Requires huge number of estimates to fill the covariance matrix (N(N+3))/2 Eg: For a 2 security case: Require
CHAPTER 10. Arbitrage Pricing Theory and Multifactor Models of Risk and Return INVESTMENTS BODIE, KANE, MARCUS
 CHAPTER 10 Arbitrage Pricing Theory and Multifactor Models of Risk and Return McGraw-Hill/Irwin Copyright 2011 by The McGraw-Hill Companies, Inc. All rights reserved. 10-2 Single Factor Model Returns on
CHAPTER 5. Introduction to Risk, Return, and the Historical Record INVESTMENTS BODIE, KANE, MARCUS. McGraw-Hill/Irwin
 CHAPTER 5 Introduction to Risk, Return, and the Historical Record McGraw-Hill/Irwin Copyright 2011 by The McGraw-Hill Companies, Inc. All rights reserved. 5-2 Interest Rate Determinants Supply Households
CHAPTER 9: THE CAPITAL ASSET PRICING MODEL
 CHAPTER 9: THE CAPITAL ASSET PRICING MODEL 1. E(r P ) = r f + β P [E(r M ) r f ] 18 = 6 + β P(14 6) β P = 12/8 = 1.5 2. If the security s correlation coefficient with the market portfolio doubles (with
PRINCIPLES of INVESTMENTS
 PRINCIPLES of INVESTMENTS Boston University MICHAItL L D\if.\N Griffith University AN UP BASU Queensland University of Technology ALEX KANT; University of California, San Diego ALAN J. AAARCU5 Boston College
Archana Khetan 05/09/ MAFA (CA Final) - Portfolio Management
 - Portfolio Management") Archana Khetan 05/09/2010 +91-9930812722 Archana090@hotmail.com MAFA (CA Final) - Portfolio Management 1 Portfolio Management Portfolio is a collection of assets. By investing in a portfolio or combination
Archana Khetan 05/09/2010 +91-9930812722 Archana090@hotmail.com MAFA (CA Final) - Portfolio Management 1 Portfolio Management Portfolio is a collection of assets. By investing in a portfolio or combination
Financial Mathematics III Theory summary
 Financial Mathematics III Theory summary Table of Contents Lecture 1... 7 1. State the objective of modern portfolio theory... 7 2. Define the return of an asset... 7 3. How is expected return defined?...
CHAPTER 10. Arbitrage Pricing Theory and Multifactor Models of Risk and Return INVESTMENTS BODIE, KANE, MARCUS
 CHAPTER 10 Arbitrage Pricing Theory and Multifactor Models of Risk and Return INVESTMENTS BODIE, KANE, MARCUS McGraw-Hill/Irwin Copyright 2011 by The McGraw-Hill Companies, Inc. All rights reserved. INVESTMENTS
Risk and Return: Past and Prologue
 Chapter 5 Risk and Return: Past and Prologue Bodie, Kane, and Marcus Essentials of Investments Tenth Edition What is in Chapter 5 5.1 Rates of Return HPR, arithmetic, geometric, dollar-weighted, APR, EAR
EQUITIES & INVESTMENT ANALYSIS MAF307 EXAM SUMMARY
 EQUITIES & INVESTMENT ANALYSIS MAF307 EXAM SUMMARY TOPIC 1 INVESTMENT ENVIRONMENT & FINANCIAL INSTRUMENTS 4 FINANCIAL ASSETS - INTANGIBLE 4 BENEFITS OF INVESTING IN FINANCIAL ASSETS 4 REAL ASSETS 4 CLIENTS
Overview of Concepts and Notation
 Overview of Concepts and Notation (BUSFIN 4221: Investments) - Fall 2016 1 Main Concepts This section provides a list of questions you should be able to answer. The main concepts you need to know are embedded
QR43, Introduction to Investments Class Notes, Fall 2003 IV. Portfolio Choice
 QR43, Introduction to Investments Class Notes, Fall 2003 IV. Portfolio Choice A. Mean-Variance Analysis 1. Thevarianceofaportfolio. Consider the choice between two risky assets with returns R 1 and R 2.
Microéconomie de la finance
 Microéconomie de la finance 7 e édition Christophe Boucher christophe.boucher@univ-lorraine.fr 1 Chapitre 6 7 e édition Les modèles d évaluation d actifs 2 Introduction The Single-Index Model - Simplifying
Risk and Return. CA Final Paper 2 Strategic Financial Management Chapter 7. Dr. Amit Bagga Phd.,FCA,AICWA,Mcom.
 Risk and Return CA Final Paper 2 Strategic Financial Management Chapter 7 Dr. Amit Bagga Phd.,FCA,AICWA,Mcom. Learning Objectives Discuss the objectives of portfolio Management -Risk and Return Phases
CHAPTER 5. Introduction to Risk, Return, and the Historical Record INVESTMENTS BODIE, KANE, MARCUS
 CHAPTER 5 Introduction to Risk, Return, and the Historical Record INVESTMENTS BODIE, KANE, MARCUS McGraw-Hill/Irwin Copyright 2011 by The McGraw-Hill Companies, Inc. All rights reserved. 5-2 Supply Interest
CHAPTER 9: THE CAPITAL ASSET PRICING MODEL
 CHAPTER 9: THE CAPITAL ASSET PRICING MODEL 1. E(r P ) = r f + β P [E(r M ) r f ] 18 = 6 + β P(14 6) β P = 12/8 = 1.5 2. If the security s correlation coefficient with the market portfolio doubles (with
Answers to Concepts in Review
 Answers to Concepts in Review 1. A portfolio is simply a collection of investment vehicles assembled to meet a common investment goal. An efficient portfolio is a portfolio offering the highest expected
Return and Risk: The Capital-Asset Pricing Model (CAPM)
") Return and Risk: The Capital-Asset Pricing Model (CAPM) Expected Returns (Single assets & Portfolios), Variance, Diversification, Efficient Set, Market Portfolio, and CAPM Expected Returns and Variances
Return and Risk: The Capital-Asset Pricing Model (CAPM) Expected Returns (Single assets & Portfolios), Variance, Diversification, Efficient Set, Market Portfolio, and CAPM Expected Returns and Variances
For each of the questions 1-6, check one of the response alternatives A, B, C, D, E with a cross in the table below:
 November 2016 Page 1 of (6) Multiple Choice Questions (3 points per question) For each of the questions 1-6, check one of the response alternatives A, B, C, D, E with a cross in the table below: Question
COMM 324 INVESTMENTS AND PORTFOLIO MANAGEMENT ASSIGNMENT 2 Due: October 20
 COMM 34 INVESTMENTS ND PORTFOLIO MNGEMENT SSIGNMENT Due: October 0 1. In 1998 the rate of return on short term government securities (perceived to be risk-free) was about 4.5%. Suppose the expected rate
Ch. 8 Risk and Rates of Return. Return, Risk and Capital Market. Investment returns
 Ch. 8 Risk and Rates of Return Topics Measuring Return Measuring Risk Risk & Diversification CAPM Return, Risk and Capital Market Managers must estimate current and future opportunity rates of return for
Index Models and APT
 Index Models and APT (Text reference: Chapter 8) Index models Parameter estimation Multifactor models Arbitrage Single factor APT Multifactor APT Index models predate CAPM, originally proposed as a simplification
Principles of Finance Risk and Return. Instructor: Xiaomeng Lu
 Principles of Finance Risk and Return Instructor: Xiaomeng Lu 1 Course Outline Course Introduction Time Value of Money DCF Valuation Security Analysis: Bond, Stock Capital Budgeting (Fundamentals) Portfolio
The Effect of Kurtosis on the Cross-Section of Stock Returns
 Utah State University DigitalCommons@USU All Graduate Plan B and other Reports Graduate Studies 5-2012 The Effect of Kurtosis on the Cross-Section of Stock Returns Abdullah Al Masud Utah State University
CIS March 2012 Diet. Examination Paper 2.3: Derivatives Valuation Analysis Portfolio Management Commodity Trading and Futures.
 CIS March 2012 Diet Examination Paper 2.3: Derivatives Valuation Analysis Portfolio Management Commodity Trading and Futures Level 2 Derivative Valuation and Analysis (1 12) 1. A CIS student was making
Behavioral Finance 1-1. Chapter 2 Asset Pricing, Market Efficiency and Agency Relationships
 Behavioral Finance 1-1 Chapter 2 Asset Pricing, Market Efficiency and Agency Relationships 1 The Pricing of Risk 1-2 The expected utility theory : maximizing the expected utility across possible states
University 18 Lessons Financial Management. Unit 12: Return, Risk and Shareholder Value
 University 18 Lessons Financial Management Unit 12: Return, Risk and Shareholder Value Risk and Return Risk and Return Security analysis is built around the idea that investors are concerned with two principal
Chapter 1 - Investments: Background and Issues
 Chapter 1 - Investments: Background and Issues Investment vs. investments Real assets vs. financial assets Financial markets and the economy Investment process Competitive markets Players in investment
Module 3: Factor Models
 Module 3: Factor Models (BUSFIN 4221 - Investments) Andrei S. Gonçalves 1 1 Finance Department The Ohio State University Fall 2016 1 Module 1 - The Demand for Capital 2 Module 1 - The Supply of Capital
Note on Cost of Capital
 DUKE UNIVERSITY, FUQUA SCHOOL OF BUSINESS ACCOUNTG 512F: FUNDAMENTALS OF FINANCIAL ANALYSIS Note on Cost of Capital For the course, you should concentrate on the CAPM and the weighted average cost of capital.
P1.T1. Foundations of Risk Management Zvi Bodie, Alex Kane, and Alan J. Marcus, Investments, 10th Edition Bionic Turtle FRM Study Notes
 P1.T1. Foundations of Risk Management Zvi Bodie, Alex Kane, and Alan J. Marcus, Investments, 10th Edition Bionic Turtle FRM Study Notes By David Harper, CFA FRM CIPM www.bionicturtle.com BODIE, CHAPTER
Efficient Frontier and Asset Allocation
 Topic 4 Efficient Frontier and Asset Allocation LEARNING OUTCOMES By the end of this topic, you should be able to: 1. Explain the concept of efficient frontier and Markowitz portfolio theory; 2. Discuss
E(r) The Capital Market Line (CML)
 The Capital Market Line (CML)") The Capital Asset Pricing Model (CAPM) B. Espen Eckbo 2011 We have so far studied the relevant portfolio opportunity set (mean- variance efficient portfolios) We now study more specifically portfolio demand,
The Capital Asset Pricing Model (CAPM) B. Espen Eckbo 2011 We have so far studied the relevant portfolio opportunity set (mean- variance efficient portfolios) We now study more specifically portfolio demand,
CHAPTER 12: MARKET EFFICIENCY AND BEHAVIORAL FINANCE
 CHAPTER 12: MARKET EFFICIENCY AND BEHAVIORAL FINANCE 1. The correlation coefficient between stock returns for two non-overlapping periods should be zero. If not, one could use returns from one period to
Unit01. Introduction, Creation of Financial Assets, and Security Markets
 FCS 5510 Concept Review Notes: Unit01. Introduction, Creation of Financial Assets, and Security Markets Chapter 01. Definition of investment Portfolio Primary and secondary markets Value and valuation
Risk and Return and Portfolio Theory
 Risk and Return and Portfolio Theory Intro: Last week we learned how to calculate cash flows, now we want to learn how to discount these cash flows. This will take the next several weeks. We know discount
15 Week 5b Mutual Funds
 15 Week 5b Mutual Funds 15.1 Background 1. It would be natural, and completely sensible, (and good marketing for MBA programs) if funds outperform darts! Pros outperform in any other field. 2. Except for...
The Capital Assets Pricing Model & Arbitrage Pricing Theory: Properties and Applications in Jordan
 Modern Applied Science; Vol. 12, No. 11; 2018 ISSN 1913-1844E-ISSN 1913-1852 Published by Canadian Center of Science and Education The Capital Assets Pricing Model & Arbitrage Pricing Theory: Properties
Manager Comparison Report June 28, Report Created on: July 25, 2013
 Manager Comparison Report June 28, 213 Report Created on: July 25, 213 Page 1 of 14 Performance Evaluation Manager Performance Growth of $1 Cumulative Performance & Monthly s 3748 3578 348 3238 368 2898
Analysis INTRODUCTION OBJECTIVES
 Chapter5 Risk Analysis OBJECTIVES At the end of this chapter, you should be able to: 1. determine the meaning of risk and return; 2. explain the term and usage of statistics in determining risk and return;
ECON FINANCIAL ECONOMICS
 ECON 337901 FINANCIAL ECONOMICS Peter Ireland Boston College Fall 2017 These lecture notes by Peter Ireland are licensed under a Creative Commons Attribution-NonCommerical-ShareAlike 4.0 International
Chapter 13 Portfolio Theory questions
 Chapter 13 Portfolio Theory 15-20 questions 175 176 2. Portfolio Considerations Key factors Risk Liquidity Growth Strategies Stock selection - Fundamental analysis Use of fundamental data on the company,
ECON FINANCIAL ECONOMICS
 ECON 337901 FINANCIAL ECONOMICS Peter Ireland Boston College Spring 2018 These lecture notes by Peter Ireland are licensed under a Creative Commons Attribution-NonCommerical-ShareAlike 4.0 International
Chapter 5: Answers to Concepts in Review
 Chapter 5: Answers to Concepts in Review 1. A portfolio is simply a collection of investment vehicles assembled to meet a common investment goal. An efficient portfolio is a portfolio offering the highest
FNCE 5610, Personal Finance H Guy Williams, 2009
 CH 12: Introduction to Investment Concepts Introduction to Investing Investing is based on the concept that forgoing immediate consumption results in greater future consumption (through compound interest
Risk and Return. Nicole Höhling, Introduction. Definitions. Types of risk and beta
 Risk and Return Nicole Höhling, 2009-09-07 Introduction Every decision regarding investments is based on the relationship between risk and return. Generally the return on an investment should be as high
Module 6 Portfolio risk and return
 Module 6 Portfolio risk and return Prepared by Pamela Peterson Drake, Ph.D., CFA 1. Overview Security analysts and portfolio managers are concerned about an investment s return, its risk, and whether it
Washington University Fall Economics 487
 Washington University Fall 2009 Department of Economics James Morley Economics 487 Project Proposal due Tuesday 11/10 Final Project due Wednesday 12/9 (by 5:00pm) (20% penalty per day if the project is
Copyright 2009 Pearson Education Canada
 Operating Cash Flows: Sales $682,500 $771,750 $868,219 $972,405 $957,211 less expenses $477,750 $540,225 $607,753 $680,684 $670,048 Difference $204,750 $231,525 $260,466 $291,722 $287,163 After-tax (1
Models of Asset Pricing
 appendix1 to chapter 5 Models of Asset Pricing In Chapter 4, we saw that the return on an asset (such as a bond) measures how much we gain from holding that asset. When we make a decision to buy an asset,
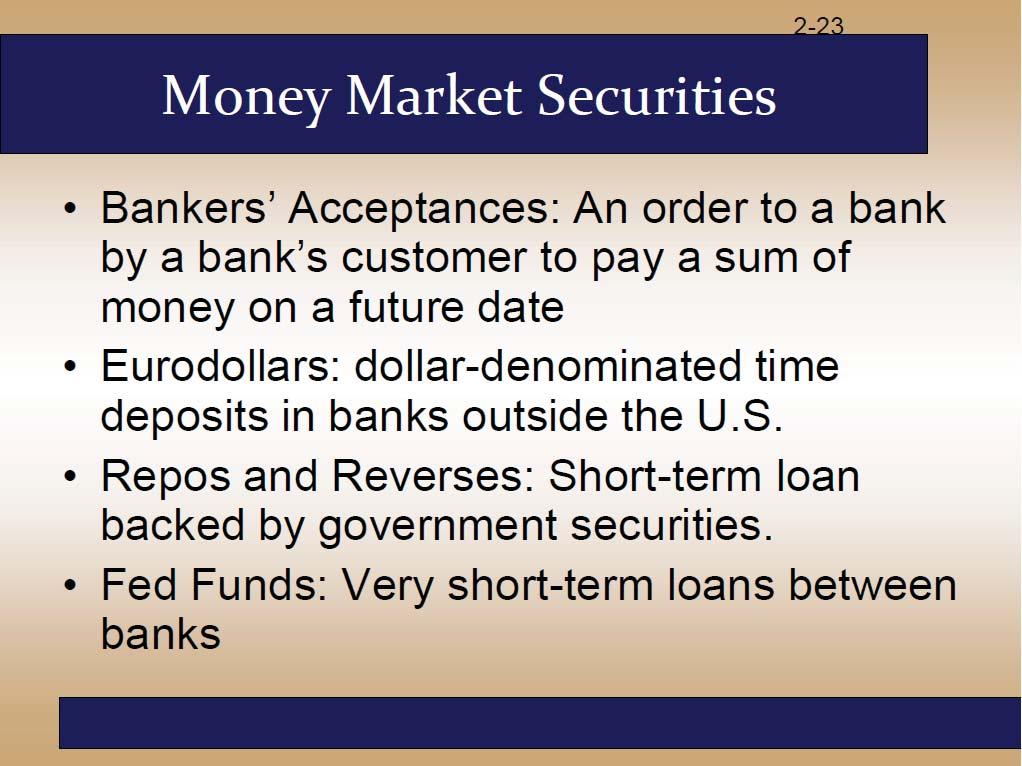
2: ASSET CLASSES AND FINANCIAL INSTRUMENTS MONEY MARKET SECURITIES
 2: ASSET CLASSES AND FINANCIAL INSTRUMENTS MONEY MARKET SECURITIES Characteristics. Short-term IOUs. Highly Liquid (Like Cash). Nearly free of default-risk. Denomination. Issuers Types Treasury Bills Negotiable
Certification Examination Detailed Content Outline
 Certification Examination Detailed Content Outline Certification Examination Detailed Content Outline Percentage of Exam I. FUNDAMENTALS 15% A. Statistics and Methods 5% 1. Basic statistical measures (e.g.,
Module IV (Exam 3) - Investment Planning (IP)
 - Investment Planning (IP)") Marks Category Module IV (Exam 3) - Investment Planning (IP) Exam 3 Topic List to the extent of 80% of Total Marks (150) i.e. 120 marks (30 marks reserved for the Module I Introduction to Financial Planning)
Marks Category Module IV (Exam 3) - Investment Planning (IP) Exam 3 Topic List to the extent of 80% of Total Marks (150) i.e. 120 marks (30 marks reserved for the Module I Introduction to Financial Planning)
Paper 4. Fund Investment Consultant Examination. Thailand Securities Institute November 2014
 Fund Investment Consultant Examination Paper 4 Thailand Securities Institute November 2014 Copyright 2014, All right reserve Thailand Securities Institute (TSI) The Stock Exchange of Thailand Page 1 Paper
BUSM 411: Derivatives and Fixed Income
 BUSM 411: Derivatives and Fixed Income 3. Uncertainty and Risk Uncertainty and risk lie at the core of everything we do in finance. In order to make intelligent investment and hedging decisions, we need
Portfolio Management Philip Morris has issued bonds that pay coupons annually with the following characteristics:
 Portfolio Management 010-011 1. a. Critically discuss the mean-variance approach of portfolio theory b. According to Markowitz portfolio theory, can we find a single risky optimal portfolio which is suitable
An investment s return is your reward for investing. An investment s risk is the uncertainty of what will happen with your investment dollar.
 Chapter 7 An investment s return is your reward for investing. An investment s risk is the uncertainty of what will happen with your investment dollar. The relationship between risk and return is a tradeoff.
Chapters 10&11 - Debt Securities
 Chapters 10&11 - Debt Securities Bond characteristics Interest rate risk Bond rating Bond pricing Term structure theories Bond price behavior to interest rate changes Duration and immunization Bond investment
LECTURE NOTES 3 ARIEL M. VIALE
 LECTURE NOTES 3 ARIEL M VIALE I Markowitz-Tobin Mean-Variance Portfolio Analysis Assumption Mean-Variance preferences Markowitz 95 Quadratic utility function E [ w b w ] { = E [ w] b V ar w + E [ w] }
Derivation of zero-beta CAPM: Efficient portfolios
 Derivation of zero-beta CAPM: Efficient portfolios AssumptionsasCAPM,exceptR f does not exist. Argument which leads to Capital Market Line is invalid. (No straight line through R f, tilted up as far as
BENEFITS OF ALLOCATION OF TRADITIONAL PORTFOLIOS TO HEDGE FUNDS. Lodovico Gandini (*)
") BENEFITS OF ALLOCATION OF TRADITIONAL PORTFOLIOS TO HEDGE FUNDS Lodovico Gandini (*) Spring 2004 ABSTRACT In this paper we show that allocation of traditional portfolios to hedge funds is beneficial in
BENEFITS OF ALLOCATION OF TRADITIONAL PORTFOLIOS TO HEDGE FUNDS Lodovico Gandini (*) Spring 2004 ABSTRACT In this paper we show that allocation of traditional portfolios to hedge funds is beneficial in
The Case for TD Low Volatility Equities
 The Case for TD Low Volatility Equities By: Jean Masson, Ph.D., Managing Director April 05 Most investors like generating returns but dislike taking risks, which leads to a natural assumption that competition
Answer FOUR questions out of the following FIVE. Each question carries 25 Marks.
 UNIVERSITY OF EAST ANGLIA School of Economics Main Series PGT Examination 2017-18 FINANCIAL MARKETS ECO-7012A Time allowed: 2 hours Answer FOUR questions out of the following FIVE. Each question carries
A Sensitivity Analysis between Common Risk Factors and Exchange Traded Funds
 A Sensitivity Analysis between Common Risk Factors and Exchange Traded Funds Tahura Pervin Dept. of Humanities and Social Sciences, Dhaka University of Engineering & Technology (DUET), Gazipur, Bangladesh
15.414: COURSE REVIEW. Main Ideas of the Course. Approach: Discounted Cashflows (i.e. PV, NPV): CF 1 CF 2 P V = (1 + r 1 ) (1 + r 2 ) 2
: CF 1 CF 2 P V = (1 + r 1 ) (1 + r 2 ) 2") 15.414: COURSE REVIEW JIRO E. KONDO Valuation: Main Ideas of the Course. Approach: Discounted Cashflows (i.e. PV, NPV): and CF 1 CF 2 P V = + +... (1 + r 1 ) (1 + r 2 ) 2 CF 1 CF 2 NP V = CF 0 + + +...
15.414: COURSE REVIEW JIRO E. KONDO Valuation: Main Ideas of the Course. Approach: Discounted Cashflows (i.e. PV, NPV): and CF 1 CF 2 P V = + +... (1 + r 1 ) (1 + r 2 ) 2 CF 1 CF 2 NP V = CF 0 + + +...
CHAPTER 5: ANSWERS TO CONCEPTS IN REVIEW
 CHAPTER 5: ANSWERS TO CONCEPTS IN REVIEW 5.1 A portfolio is simply a collection of investment vehicles assembled to meet a common investment goal. An efficient portfolio is a portfolio offering the highest
COMM 324 INVESTMENTS AND PORTFOLIO MANAGEMENT ASSIGNMENT 1 Due: October 3
 COMM 324 INVESTMENTS AND PORTFOLIO MANAGEMENT ASSIGNMENT 1 Due: October 3 1. The following information is provided for GAP, Incorporated, which is traded on NYSE: Fiscal Yr Ending January 31 Close Price
PowerPoint. to accompany. Chapter 11. Systematic Risk and the Equity Risk Premium
 PowerPoint to accompany Chapter 11 Systematic Risk and the Equity Risk Premium 11.1 The Expected Return of a Portfolio While for large portfolios investors should expect to experience higher returns for
ECMC49S Midterm. Instructor: Travis NG Date: Feb 27, 2007 Duration: From 3:05pm to 5:00pm Total Marks: 100
 ECMC49S Midterm Instructor: Travis NG Date: Feb 27, 2007 Duration: From 3:05pm to 5:00pm Total Marks: 100 [1] [25 marks] Decision-making under certainty (a) [10 marks] (i) State the Fisher Separation Theorem
INVESTMENTS Lecture 2: Measuring Performance
 Philip H. Dybvig Washington University in Saint Louis portfolio returns unitization INVESTMENTS Lecture 2: Measuring Performance statistical measures of performance the use of benchmark portfolios Copyright
Chapter 5. Asset Allocation - 1. Modern Portfolio Concepts
 Asset Allocation - 1 Asset Allocation: Portfolio choice among broad investment classes. Chapter 5 Modern Portfolio Concepts Asset Allocation between risky and risk-free assets Asset Allocation with Two
INV2601 DISCUSSION CLASS SEMESTER 2 INVESTMENTS: AN INTRODUCTION INV2601 DEPARTMENT OF FINANCE, RISK MANAGEMENT AND BANKING
 INV2601 DISCUSSION CLASS SEMESTER 2 INVESTMENTS: AN INTRODUCTION INV2601 DEPARTMENT OF FINANCE, RISK MANAGEMENT AND BANKING Examination Duration of exam 2 hours. 40 multiple choice questions. Total marks
Applied Macro Finance
 Master in Money and Finance Goethe University Frankfurt Week 2: Factor models and the cross-section of stock returns Fall 2012/2013 Please note the disclaimer on the last page Announcements Next week (30
Global Journal of Finance and Banking Issues Vol. 5. No Manu Sharma & Rajnish Aggarwal PERFORMANCE ANALYSIS OF HEDGE FUND INDICES
 PERFORMANCE ANALYSIS OF HEDGE FUND INDICES Dr. Manu Sharma 1 Panjab University, India E-mail: manumba2000@yahoo.com Rajnish Aggarwal 2 Panjab University, India Email: aggarwalrajnish@gmail.com Abstract
Finance Concepts I: Present Discounted Value, Risk/Return Tradeoff
 Finance Concepts I: Present Discounted Value, Risk/Return Tradeoff Federal Reserve Bank of New York Central Banking Seminar Preparatory Workshop in Financial Markets, Instruments and Institutions Anthony
Empirical Evidence. r Mt r ft e i. now do second-pass regression (cross-sectional with N 100): r i r f γ 0 γ 1 b i u i
: r i r f γ 0 γ 1 b i u i") Empirical Evidence (Text reference: Chapter 10) Tests of single factor CAPM/APT Roll s critique Tests of multifactor CAPM/APT The debate over anomalies Time varying volatility The equity premium puzzle
Empirical Evidence (Text reference: Chapter 10) Tests of single factor CAPM/APT Roll s critique Tests of multifactor CAPM/APT The debate over anomalies Time varying volatility The equity premium puzzle
Calculating EAR and continuous compounding: Find the EAR in each of the cases below.
 Problem Set 1: Time Value of Money and Equity Markets. I-III can be started after Lecture 1. IV-VI can be started after Lecture 2. VII can be started after Lecture 3. VIII and IX can be started after Lecture
Solutions to questions in Chapter 8 except those in PS4. The minimum-variance portfolio is found by applying the formula:
 Solutions to questions in Chapter 8 except those in PS4 1. The parameters of the opportunity set are: E(r S ) = 20%, E(r B ) = 12%, σ S = 30%, σ B = 15%, ρ =.10 From the standard deviations and the correlation
KHAWAR-SIDDIQUE # 1 FINALTERM EXAMINATION 2010 FIN630-
 KHAWAR-SIDDIQUE Paper # 1 FINALTERM EXAMINATION Spring 2010 FIN630- Investment Analysis & Portfolio Management (Session - 4) Question No: 1 ( Marks: 1 ) - Please choose one A procedure for valuing the
Factor Investing. Fundamentals for Investors. Not FDIC Insured May Lose Value No Bank Guarantee
 Factor Investing Fundamentals for Investors Not FDIC Insured May Lose Value No Bank Guarantee As an investor, you have likely heard a lot about factors in recent years. But factor investing is not new.
General Notation. Return and Risk: The Capital Asset Pricing Model
 Return and Risk: The Capital Asset Pricing Model (Text reference: Chapter 10) Topics general notation single security statistics covariance and correlation return and risk for a portfolio diversification
Corporate Finance - Final Exam QUESTIONS 78 terms by trunganhhung
 Corporate Finance - Final Exam QUESTIONS 78 terms by trunganhhung Like this study set? Create a free account to save it. Create a free account Which one of the following best defines the variance of an
23.1. Assumptions of Capital Market Theory
 NPTEL Course Course Title: Security Analysis and Portfolio anagement Course Coordinator: Dr. Jitendra ahakud odule-12 Session-23 Capital arket Theory-I Capital market theory extends portfolio theory and
CAPITAL ASSET PRICING AND ARBITRAGE PRICING THEORY
 II. Portfolio 7 CAPITAL ASSET PRICING AND ARBITRAGE PRICING THEORY AFTER STUDYING THIS CHAPTER YOU SHOULD BE ABLE TO: Use the implications of capital market theory to compute security risk premiums. Construct
Uniwersytet Ekonomiczny. George Matysiak. Presentation outline. Motivation for Performance Analysis
 Uniwersytet Ekonomiczny George Matysiak Performance measurement 30 th November, 2015 Presentation outline Risk adjusted performance measures Assessing investment performance Risk considerations and ranking
MBA 203 Executive Summary
 MBA 203 Executive Summary Professor Fedyk and Sraer Class 1. Present and Future Value Class 2. Putting Present Value to Work Class 3. Decision Rules Class 4. Capital Budgeting Class 6. Stock Valuation
CHAPTER III RISK MANAGEMENT
 CHAPTER III RISK MANAGEMENT Concept of Risk Risk is the quantified amount which arises due to the likelihood of the occurrence of a future outcome which one does not expect to happen. If one is participating
Expected Return Methodologies in Morningstar Direct Asset Allocation
 Expected Return Methodologies in Morningstar Direct Asset Allocation I. Introduction to expected return II. The short version III. Detailed methodologies 1. Building Blocks methodology i. Methodology ii.
Lecture 10-12: CAPM.
 Lecture 10-12: CAPM. I. Reading II. Market Portfolio. III. CAPM World: Assumptions. IV. Portfolio Choice in a CAPM World. V. Minimum Variance Mathematics. VI. Individual Assets in a CAPM World. VII. Intuition