FY2017 Results. Investor Presentation. 31 May /31/2017 9:36 AM. FY2017 Results Investor Presentation 5/31/2017 9:36 AM
|
|
|
- Alyson Wade
- 5 years ago
- Views:
Transcription


1 FY2017 Results Investor Presentation 31 May /31/2017 9:36 AM 5/31/2017 9:36 AM


2 Table of Contents Financial Overview FY2017 Financial Overview Business Update Financial Performance FY Strategy Supplementary Information Key Performance Indicators Top 4 Aspirations Key Milestones Wholesale Banking Heartbeat Retail Banking Heartbeat General Insurance Heartbeat Performance Highlights Guidance & Expectations Business Strategy Group Performance Divisional Performance Economic and Banking Data
3 GCEO Presentation 3
4 FY2017 Key Performance Indicators Financial Overview Return on Equity (ROE) PBP PATMI 13.8% 8.8% 8.5% 8.5% to 9.0% 2, ,521.5 YOY : +5.5% 1, ,918.6 YOY : +1.7% 1, ,324.6 ~5% Growth p.a. FY15 FY16 FY17 FY17 Guidance FY15 FY16 FY17 FY15 FY16 FY17 FY17 Guidance Cost-to-income (CTI) Ratio Dividend Payout CET % 58.8% 57.4% 57% 43% 40% ~40% 10.5% 11.3% 11.6% 36% 10.0% +/-1% FY15 FY16 FY17 FY17 Guidance FY15 FY16 FY17 FY17 Guidance FY15 FY16 FY17 FY17 Guidance 1. Based on Aggregated Banking Entities net of proposed dividend 4


5 Top 4 Aspirations: FY FY2020 Strategy To be Top 4 in each of our 4 growth segments To be Top 4 in each of our 4 focus products To sustain Top 4 in each of our current engines To be Top 4 Mass Affluent Affluent SME Mid Corp Cards & Merchants Transaction Banking Markets Wealth Management Corporate Loans Debt Capital Markets Funds Management Best employer in Malaysia 5
 New distributor for AHB Fund Launched Johor Affordable Homes Financing Scheme Appointment")


 175 SME ready branches Refreshed branch model and Priority Banking Centre New PR1MA")

 1.")
6 FY2017 Key Milestones Strategy Portfolio Guarantee Scheme with Credit Guarantee Corporation (CGC) New distributor for AHB Fund Launched Johor Affordable Homes Financing Scheme Appointment of MD Retail Banking Embarked on initiatives to improve retail processes Established Group Transformation Office Top 3 in Malaysian corporate bonds and Sukuk league table Appointment of GCOO, MD Business Banking and MD Wholesale Banking & CEO of AmInvestment Bank AmAssurance On Tour campaign AmBank BonusLink cobrand Visa Card Jul 2016 Oct-Nov 2016 Jan 2017 Mar-May 2017 Aug-Sep 2016 Dec 2016 Feb 2017 Partnered with Advelsoft to provide Online Bill Payment Solutions (JomPAY) 175 SME ready branches Refreshed branch model and Priority Banking Centre New PR1MA home end-financing scheme Signed up PTPTN 1 as JomPAY biller New AmGraduate Programme Appointed as agent of ASNB Awarded the Preferred Bank for SOBA 2016 SME Businesses AmInvest named Malaysia s Best Pension Fund Manager and ETF Manager of the Year Digitised CASA Onboarding Process AmBank Group won 3 awards at the Malaysian e-payments Excellence Awards (MEEA) 1. Perbadanan Tabung Pendidikan Tinggi Nasional 6
7 Wholesale Banking Heartbeat Wholesale Banking Large / Mid Corp SME / Business Banking Enhanced coverage model to enable Relationship Managers to focus on sales and service to increase share of wallet Activated 141 targeted accounts for e-ambiz an internet banking portal designed to facilitate the needs of business Improved credit approval efficiency; turnaround time reduced by 50% Improved credit approval efficiency for SME, turnaround time reduced by 67% Strategic partnership with CGC via Portfolio Guarantee scheme SME and Wholesale Banking client graduation process Segment specific products, Biz Solutions Trade, Contract Financing Debt Capital Markets Global Markets No.1 in Bloomberg League Table for Overall MYR Bond and Sukuk as at Mar 17 Strong income growth from healthy issuances Growing flow business (FX and derivatives) across Large Corp, Mid Corp, SME & Retail segments Improved efficiency for foreign exchange contracts Strong trading desk results from bond market arbitrage Actively managed fixed income trading activities vis-à-vis yield curve changes Transaction Banking JomPAY: Onboarded key players in education segment, loan repayment agency & local councils. Expanding solution to utilities & Muslim welfare contribution segment. Cash Management: Enhancement of eambiz platform including access onthe-move Digital Payment solution: Contactless solution for transportation segment Enhanced structured trade finance products for Islamic segment 7


")

 Auto Finance Lower")
 through partnership with national car dealers Increasing emphasis on new foreign")
8 Retail Banking Heartbeat Retail Banking Mortgage Strong net acceptance & disbursement, up 17% & 44% respectively Increased acceptance mix for secondary market Mobile sales team delivered stronger performance reflecting preference over conventional channels Revamped anti-attrition team Wealth Strong growth momentum in ASNB sales - ranked Top ASNB bank in Q4FY17 Banca Life Sales at all time high in Q4FY17 Priority Banking customers increased >100% Deposits Strengthened payroll proposition via enhancement of AmBank@Work Payroll accounts up 13% YoY Cards & Merchants Launched AmBank BonusLink co-brand Visa Card Strong growth in new card issuances Cards spending increased (up 13%) via enhanced value propositions e.g. Dining, Groceries and Travel Merchant transaction volume acquired up by 5% YoY Retail SME Strategic partnership with CGC via Portfolio Guarantee scheme Increased acquisition of current accounts via payroll/internet banking (CASA up 14% YoY) Auto Finance Lower non-national car sales largely mitigated by improvement in national car loans (up 23% YoY) through partnership with national car dealers Increasing emphasis on new foreign cars with bigger ticket size and better approval rates to achieve higher disbursement value 8


 Development of flexible platform to enable product tailoring Strategic partnership to be the exclusive")

9 General Insurance Heartbeat General Insurance Be the No. 1 Motor Insurer No. 1 with 16.5% market share 1 Strategic partnership with auto dealer supports growth, including franchise portfolio Motor product enhancement to increase competitiveness Grow and retain customer base via renewal initiatives Digitalisation Market leading motor renewal and claims process with integrated road tax in a single transaction and One Touch mobile application Strong growth achieved in online sales Developed agent/broker and partnership online capability Grow in Select Commercial Lines Strong growth momentum in Fire (+10.5%) and Marine Cargo (+24.5%) Development of flexible platform to enable product tailoring Strategic partnership to be the exclusive underwriter for auto warranty Lead in Select Personal Lines Leveraging Banca and Agency portfolio to focus on the sales of specific products via the Bancassurance distribution channel No. 8 with 5.5% market share 1 Relaunched improved personal line products Perfect Rider Plus in May 16 with 91% uplift in gross written premium (GWP) 1. Source: ISM October
10 CFO Presentation 10


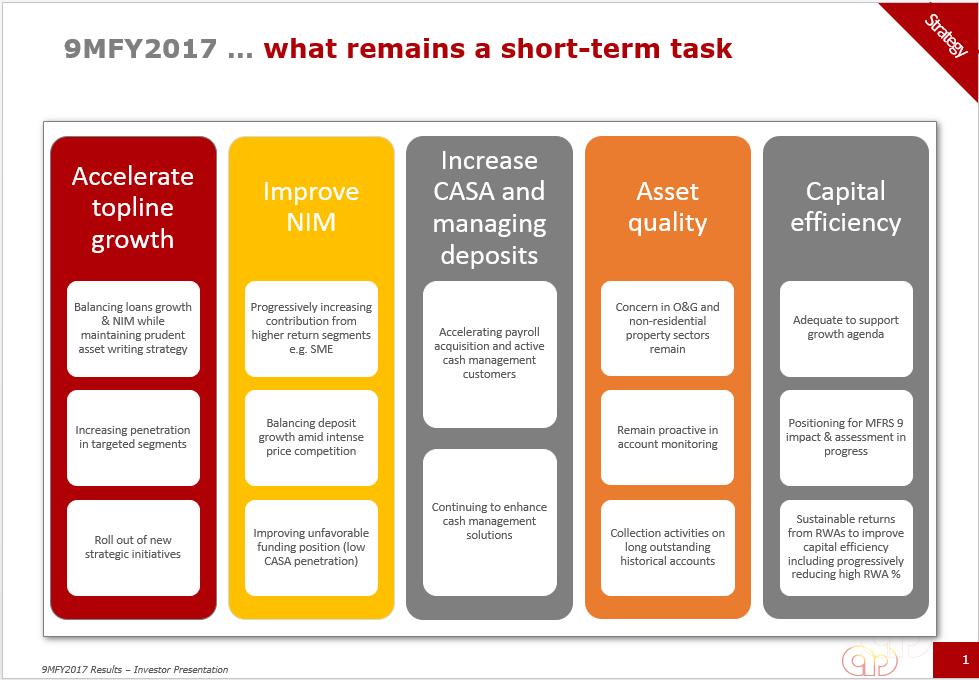
11 FY2017 Short Term Task. Strategy 11
12 FY2017 Performance Highlights Financial Overview Total income Expenses PBP Net Allowances 3,765.6m 2,160.5m 1,605.1m m FY16: 3,695.8m FY16: 2,174.3m FY16: 1,521.5m FY16: m Change: 1.9% Change: 0.6% Change: 5.5% Change: 6.4% PATMI ROE CTI NIM 1,324.6m 8.5% 57.4% 1.98% FY16: 1,302.2m FY16: 8.8% FY16: 58.8% FY16: 2.02% Change: 1.7% Change: 30bps Change: 140bps Change: 4bps GIL EPS 1 CET 1 2 Dividend Payout 1.86% sen 11.6% 40% FY16: 1.94% FY16: sen FY16: 11.3% FY16: 36% Change: 8bps Change: 0.73 sen Change: 30bps Change: 4% 1. Basic Earnings Per Share 2. Based on Aggregated Banking Entities net of proposed dividend 12
13 Quarterly Performance PATMI (RM mil) & ROE (%) 9.3% 10.2% PATMI PBP ROE PATMI QoQ growth: 7.2% ROE QoQ growth: 0.4% 8.0% 7.5% 8.5% 9.0% 8.0% 8.4% Net Lending (RM bil) Loans excluding Auto Finance Auto Finance YoY growth: 4.0% YoY growth (excl.af): 8.0% QoQ growth: 0.5% QoQ growth (excl.af): 1.0% Q4FY17 Results Q1FY16 Q2FY16 Q3FY16 Q4FY16 Q1FY17 Q2FY17 Q3FY17 Q4FY17 Q1FY16 Q2FY16 Q3FY16 Q4FY16 Q1FY17 Q2FY17 Q3FY17 Q4FY17 Customer Deposits 1 (RM bil) and LDR (%) Customer Deposits Adjusted LDR 84.3% 82.8% 84.7% 84.7% 85.8% YoY growth: 2.5% QoQ growth: 5.7% 89.6% 90.3% 85.7% Total Income (RM bil) Non-interest Income Net Interest Income YoY growth: 1.9% QoQ growth: 18.0% , % 57.5% Q1FY16 Q2FY16 Q3FY16 Q4FY16 Q1FY17 Q2FY17 Q3FY17 Q4FY17 1. Customer deposits include stable funding sources Q1FY16 Q2FY16 Q3FY16 Q4FY16 Q1FY17 Q2FY17 Q3FY17 Q4FY17 13
14 PBP grew 5.5% YoY, PATMI up 1.7% Financial Group Overview P&L Profit underpinned by stronger NoII, improved asset quality and recoveries while expenses were well contained YoY growth 4% 12% 2% 1% 5.5% 6% 4% 18% 1% 13% 1.7% 1, % , % 86.6 GIL: 1.86% 81% NIM: 1.98% NoII%: 39.1% CTI: 57.4% Credit Cost: -0.19% Effective tax rate: 22.0% 80% FY16 IntInc NII TInc Expenses PBP Income Income Income Allowances Prov PBT Tax & Zakat RM mil Net Interest Non-Interest Total Provisions/ PAT MI FY17 PBT Tax & Zakat PAT MI PATMI FY17 2, , , , ,605.1 (196.1) 1, , ,324.6 FY16 2, , , , ,521.5 (209.5) 1, , ,302.2 Conventional PATMI Islamic PAT Positive growth in FY17 Contraction in FY17 14
15 Income well diversified with improved Profit Before Provisioning Financial Income Overview Profit Before Provision (RM mil) Reported Underlying YoY growth: 5.5% Divisional Income Contribution (YoY) 27% YoY growth: 1.9% 2, % Insurance 15% Others 5% 2,351 2,511 2,282 2,580 2,195 1,522 1,605 Wholesale Banking 44% 13% FY11 FY12 FY13 FY14 FY15 FY16 FY17 1. Includes divestment gains from AmLife and AmFamily Takaful 8% Retail Banking 36% Divisional PAT Contribution (YoY) >100% YoY growth: 0.7% 13% Insurance 14% Others 2% Wholesale Bank s profit before provision up 17.6% YoY underpinned by Capital Market activities and stronger trading gains 24% Retail Banking 25% Wholesale Banking 59% 1% Retail Bank s profit was lower due to H2FY16 margin compression despite stronger Mortgage loans growth Insurance net profit higher, lifted by revaluation of Life & Takaful insurance liabilities. General Insurance recorded higher PBT though PAT down due to lower tax in FY16 15
16 Stronger non-interest income, offset by H2FY16 margin compression Financial Income Overview Non-interest Income Drivers RM mil Strong YoY growth with encouraging momentum last few quarters in sustainable fees (eg Wealth & Banca), reflecting momentum on strategic agenda YoY growth 18% 28% 6% 73% 28% 13% 29% 19% 54% 12% Composition 13% 11% 8% 21% 3% 8% 4% 28% 4% , ,317.0 FY16 Investment Bank Markets Fund Mgmt Corp & Comm Banking Wealth Management Cards Other Retail Insurance Others FY17 Net Interest Margin Movement bps Margin compression due to roll-off of higher yield legacy Retail loans and deposit mix, alleviated by increasing composition of SME loans and active COF management Asset repricing Deposits bps 198 FY16 Portfolio Rebalancing Wholesale Retail Deposit Rates Deposit Mix FY17 16
17 Improving margins QoQ, reflecting loans mix, disciplined pricing and COF management Financial NIM Overview COF down 7bps YoY from active management of funding mix and deposit costs H2FY17 NIM higher at 2.04%, up 11bps as compared to H1FY17 s 1.93% NIM YoY Trend vs. Industry Quarterly Net Interest Income (RM mil) & NIM Movement 4.99% 4.88% 5.34% 4.75% 5.60% 5.35% 5.11% 4.96% 4.56% 4.63% 4.57% 4.54% Gross Yield Industry Avg. Lending Rate FY16 NIM : 2.02% FY17 NIM : 1.98% 2.12% 2.11% 2.02% 2.06% 1.93% 1.92% 1.94% 1.92% % 3.06% 2.69% 2.90% 3.08% 3.07% 3.27% 3.35% 3.34% 3.17% 3.27% 3.15% COF Avg 1M KLIBOR 2.51% 2.66% 2.75% 2.43% 2.02% 1.98% NIM FY12 FY13 FY14 FY15 FY16 FY17 Q1FY16 Q2FY16 Q3FY16 Q4FY16 Q1FY17 Q2FY17 Q3FY17 Q4FY17 17
18 Expense growth contained through cost saving initiatives Expenses Financial Overview As we move into FY18/19, focus will intensify on productivity and efficiency Planned projects & investments spend in FY17 Efficiency Indicators YoY Change Total income per employee (RM 000) 4.5% Total cost per employee (RM 000) 1.9% Customer deposit per employee (RM mil) 6.8% Gross loans per employee (RM mil) 6.2% Compliance 16% Growth 6% Capex: RM97 mil Opex: RM36 mil Infrastructure 57% Productivity 21% Expense Growth Driver (RM mil) Expenses: YoY: 0.6% (Reported) CTI ratio: FY17: 57.4% FY16: 58.8% , , , , , Personnel (RM34.9m) Productivity (RM7.2m) Growth (RM1.0m) 2, ,160.5 FY16 reported Regulatory Penalty YTD FY16 underlying Realignment of Rewards of Rewards Scheme Scheme Regulatory FY17 pre-investment Productivity & Growth Governance & Compliance Cost Savings & Efficiencies FY17 reported 18
19 Net allowance writebacks underpinned by strong recoveries and improvement in Retail asset quality Financial Asset Overview Quality Allowances (RM mil) Credit Costs vs. Peers¹ FY16 Individual Allowance Collective Allowance Recoveries Others FY17 AmBank Group FY13 FY14 FY15 FY16 FY17 Credit cost 0.21% 0.08% -0.04% -0.19% -0.19% Credit cost (excluding recoveries) 0.90% 0.94% 0.69% 0.46% 0.57% % (8.0) (209.5) (196.1) 0.50% Peers¹ 0.00% % Mar-08 Mar-09 Mar-10 Mar-11 Mar-12 Mar-13 Mar-14 Mar-15 Mar-16 Mar-17 AmBank (116.7) 1. An average of our seven peer banks as at 31 December
20 Retail asset quality continues to improve, whilst Wholesale impacted by impairments in Q4 Financial Asset Overview Quality With focus on preferred segments, Retail GIL ratio continues to improve with active collection and preemptive efforts Loans exposure to Oil & Gas and Commercial Real Estate Sectors reduced 24% and 10% YoY respectively Gross Impaired Loans Ratios Exposure to Oil & Gas Sector by Internal Risk Grades Gross Impaired Loans GIL Ratio 1.98% 1.86% 1.79% 1, , , % 1.86% 1, ,689.3 Impaired 7% Marginal ~ Substandard 2% Satisfactory ~ Moderate 20% Strong ~ Very Strong 71% Total loans to O&G sector: Approximately 2% of total gross loans Exposure to Commercial Real Estate Sector by Internal Risk Grades FY13 FY14 FY15 FY16 FY17 GIL Ratio QoQ Breakdown GIL Ratio Q1FY17 Q2FY17 Q3FY17 Q4FY17 Group 1.69% 1.64% 1.54% 1.86% RB 1.52% 1.53% 1.44% 1.33% WB 1.89% 1.75% 1.64% 2.46% Impaired 8% Marginal ~ Substandard 7% Satisfactory ~ Moderate 34% Strong ~ Very Strong 51% Total loans to Commercial Real Estate sector: Approximately 9% of total gross loans 20
21 Loans growth reflecting focus on new targeted segments Financial Loans Overview YoY increase of 3.5% supported by good momentum in Retail and Wholesale SME Gross Loans Movement Represented by Business (RM bil) ROA: 1.09% LD Ratio: 85.7% YoY growth 6% 2% 10% 21% 8% 8% 12% 8% 3.5% Composition 22% 9% 14% 28% 22% 2% 1% 2% Breakdown by rate sensitivity: Fixed rate 31% Variable rate 69% Breakdown by concept: Islamic 30% Conventional 70% Breakdown by customers type: Retail 53% Non-retail 47% FY16 Large Corp Mid Corp SME Mortgage Auto Fin Cards Retail SME Others FY17 Wholesale 1.5% Retail 5.4% 21
22 Deposits growth outpaced system Financial Deposits Overview CASA growth was underpinned by Retail SME and payroll accounts whilst deposits base grew mainly from Wholesale Fixed Deposits Deposits and CASA Balance (RM bil) Retail FD Wholesale FD CASA Composition (%) 20.7% % Retail CASA Wholesale CASA Deposits YoY growth: 4.1% CASA YoY growth: 6.1% 21.9% 21.5% 21.1% CASA Market Share and Industry CASA Balance¹ (RM bil) 4.4% Industry CASA 4.9% AmBank Grp Mkt Share 4.3% Includes a RM1.6b short-term client placement 4.2% 4.3% Q4FY16 Q1FY17 Q2FY17 Q3FY17 Q4FY17 Mar 16 Jun 16 Sep 16 Dec 16 Mar Based on BNM data as at 31 March
23 Capital levels positioned for growth with headroom for efficiency Financial Capital Overview Group capital ratios remain adequate, whilst we are progressively optimising capital structure and RWA efficiency for Basel III FY2020 Positioning for MFRS 9 and impact assessment in progress Basel III FHC indicative ratio as at 31 March 2017 CET 1: 10.6% Double leverage ratio: 1.12x Leverage ratio: 10.4% Basel III FHC indicative ratio Mar-17 CET 1: 10.6% RWA/Total Assets Capital Adequacy Ratios² RM bil Total Assets RWA/Total Assets Peers 72.7% 72.8% 71.5% 71.2% 72.2% 60.8% 62.4% 61.1% 59.6% 60.2% 1 CET 1 Tier 1 RWCAR/Total CAR 14.8% 15.4% 15.8% 16.1% 16.3% 11.8% 12.3% 12.5% 11.0% 11.1% % 9.7% 10.5% 11.3% 11.6% FY13 FY14 FY15 FY16 FY17 1. An average of our seven peer banks as at 31 December 2016 FY13 FY14 FY15 FY16 FY17 2. Based on Aggregated Banking Entities net of proposed dividend Financial Holding Company Indicative Ratio 132bps 23 bps 1 bps 10 bps 16 bps 3 bps 10.33% 32 bps 11.02% 40 bps 10.62% Dividend Payout Interim Dividend (sen) Final Dividend (sen) Dividend Payout (%) 43% 41% 41% 40% 36% FY16 Profit for FY17 Transfer to Reg Reserve Interim Dividend Paid Others Credit RWA Market RWA Operational RWA FY17 Before Dividend Proposed Final Dividend FHC FY FY13 FY14 FY15 FY16 FY17 3. Proposed final dividend 3 23


24 In Summary Strategy Sustaining NIMs and improving deposit mix Good Progress. Accelerate top line growth with continued emphasis on efficiency & productivity More To Do. Close monitoring of asset quality Progressively improve capital efficiency and return on equity 24
25 Guidance & Expectations for FY2018/FY2019 FY2018 Targets ROE Circa 10% PROFIT Accelerating penetration in targeted segments & expanding into key GDP sectors PEOPLE Investing in an ecosystem providing employees with an environment to work effectively and innovatively CTI Dividend 55% Circa 40% payout RETURNS Balancing growth of quality assets, deposit mix and maximising fees to optimise returns DIGITAL Materialising digital transformation initiatives for unrivalled customer experience & distribution capabilities and efficiency FHC CET 1 ±1% 10.5% CAPITAL Focusing on optimisation and improving risk adjusted returns COMPLIANCE Continue to invest in our compliance culture & infrastructure for business and regulatory requirements 25
26 FY Strategy 26


27 Aspirations Wholesale Banking To be the Top 4 bank with multi-product penetration Strategy Transactional Banking Global Markets Debt Capital Market Corporate Finance Fund Management Private Banking Equity Markets Mid Corporate 10% market share Top 4 PD and Top 3 ipd Top 4 in FX and Derivatives in BNM League Table Top 3 for Malaysian Corporate Bonds/ Sukuk Top 5 for MYR Loan Indication Top 4 IPO house Top 3 M&A Top 4 Equity Fund Raising Top 3 in Unit Trust segment in Malaysia Top 4 Private Retirement Scheme provider in Malaysia Top 2 in Private Banking Services onshore Top 4 Primary Distributor Top 4 Bank to Mid Corporates Expand into sectors strategic to GDP growth Grow Fee Income by penetrating relationship beyond lending Strengthen our capital market franchise Re-align Mid Corp Sales focus and deepen Transaction Banking capabilities Islamic First approach in aligning initiatives to national aspirations and building Islamic Funds People: Products: Technology: Distribution: Increase & diversify skillset of service team Establish bespoke products to cater to customers Build new platforms with wider functionalities, establish bespoke payment solutions capabilities for SME, Govt related accounts Digitise distribution (sales) & marketing channels 27


28 Aspirations Business Banking To be the Top 4 SME bank Strategy Revenue Loans Growth Deposit Growth Fee Income Asset Quality Revenue driven KPI from Relationship Managers onwards Preferred Banker Strategy Defend/Increase NIM focusing on Higher Risk Adjusted Return (RAR) Working Capital focus via Enterprise Lending Programme Target Market Risk Acceptance Criteria for Commercial Segment Portfolio Actions for Existing to Bank customers IHP business Dedicated Deposit Hunting team Non-Borrowing accounts Customer level LDR FX Customer segmentation for volume/margin strategy Bancassurance/Keym an insurance financing Flow business focus from working capital Dedicated Collection/Early Warning/Rehabilitatio n team Independent Collateral Management Unit Dedicated Portfolio Review Forum Periodic credit scrubbings Existing to Bank focus Run the Bank Better Formation of Hunters to capture New to Bank business Grow Non Interest Income through FX & Bancassurance Brand awareness via SOBA & AmBank SME Challenge Programme Lending for Enterprises Focus on enablers and help customer succeed via educational series Fintech collaboration Change the Bank People: - Dedicated Enterprise Banking team to focus on SME segment - Formation of 55 Enterprise Centers nationwide - New set-up to be hunting focus Digital: - End to End Loan Origination System - Cater for speed and volume - Portfolio performance & monitoring Resources: - Dedicated Business Risk Team - Ramping up credit administration team 28


29 Aspirations Retail Banking To be Top 4 in: Mass Affluent & Affluent, SME & Cards and Wealth Management Strategy Firing up new growth engines Attain market leadership in key segments & products Setting up for success Optimise current engines Win in fast growing, underserved segments Affluent Mass Affluent SME Develop an integrated cards and merchant ecosystem Lead the market with an advisory-led wealth management proposition Digital transformation channels, processes, productivity, analytics Leverage distribution footprint, partnerships and new digital channels Breakdown organisational silos, focus on talent & culture Risk & compliance Strengthen retail deposit franchise Harness value in Mass Market customer base Build an integrated cards and merchant ecosystem Lead the market with an advisory-led wealth management proposition Win in Mass Affluent, Affluent and SME Strengthen retail deposit franchise Data & Analytics: Distribution: Technology: People: Leverage on analytics for portfolio actions Expand sourcing to include more third party providers Fintech initiatives to enhance issuing & acquiring businesses Up-skilling staff to improve customer engagement Merchants: Expand new merchants recruitment & acceptance devices, POS network to grow network size & volumes Customers: Strengthen value proposition & improve current facilities for better customer experience Product: Expand product solutions to customise across customer s risk profiles & goals 29


 Improve net financing margin via cost of funds reduction and grow profitable assets")


30 Aspirations Islamic Banking To be the Top 4 Islamic bank Strategy Revenue Financing Margin Liquidity/deposits Drive revenue increase via focused areas Increase composition of non-funded income Grow financing base in selected segments (e.g. SME) Improve net financing margin via cost of funds reduction and grow profitable assets Diversify depositor base Grow low cost deposits Grow low cost and retail deposits and auto financing Push ASB financing Diversify income via fee-based income from wealth, bancatakaful, remittances & cards Intensify SME and Mid Corp clients via transaction banking solutions, FX, vendor and contract financing Niche market segments (e.g. Halal players, religious bodies, affordable housing, Government sector) People: Technology: Pricing: Product: Islamic banking knowledge of the distribution channels Talent to drive new business areas New AmOnline and mobile banking platforms Upgraded cash management Digital credit process Pricing of financing driven by cross-sell and non-funded income Simplified pricing matrix Invoice Financing-i Factoring-i Foreign currency current account-i Front-end Straight- Through-processing 30
31 Aspirations Aspirations Digital Banking and Group Operations Strategy Digital Banking: Materialising digital transformation initiatives for unrivalled customer experience, enhanced distribution capabilities and overall efficiency Customer engagement Sales tools Analytics & Innovation Digital Acquisition Omni-Channel Omni-Presence Customer Relationship Mobility Product / Services / Market Catalogue & Advice Mobile Acquiring Retention Mitigation Product Strategy Segmentation Strategy Targeted Cross / Up Sales Process Reengineering Acquisition & Retention Group Operations Build the Bank for step change in performance Increase efficiency Robotics Process Automation Center of Excellence Build scalability and standardise system/process Re-engineering of underlying process to drive operating efficiency High degree of automation to reduce operating costs and facilitate agility in responding to customers needs Provide the best promise for a range of competencies and scaling across the organisation 31

 Personal Accident (PA) Medical Personal with age 45 Fire: Householder/ Houseowner Misc: Household Guard Fire Terrorism Marine Cargo/ Goods-in-transit Group Medical Foreign")

32 Aspirations General Insurance To be the Most Trusted Insurer in Malaysia Strategy Be the No. 1 Motor Insurer Lead in Select Personal Lines Grow in Select Commercial Lines Build a Customer Oriented Organisation Create a High Performance Culture Private Car Comprehensive Motorcycle Comprehensive Taxi Comprehensive cover only (Town, Chauffeur Driven & Limousine) Special Type (ie. backhoes, excavators) Personal Accident (PA) Medical Personal with age 45 Fire: Householder/ Houseowner Misc: Household Guard Fire Terrorism Marine Cargo/ Goods-in-transit Group Medical Foreign Workers Public & General Liability Miscellaneous Construction Customer Advocacy Program Renewal Initiatives Digital Initiatives Face-to-face Channel Strategic Review Accident Assist Model Improvements Develop talent & development framework aligned to desired culture and behavioural competencies Design and rollout Structured Learning Roadmap for Mgr Development Rewards review initiative Data & Analytics Optimise data management to make more informed business decisions Distribution Develop the best sales capability and effective distribution model People Attract and develop people to be their best Pricing Lead the market with pricing capability Product Deliver easy to understand and competitive products Brand Develop sustainable competitive advantage via a valuable & differentiating brand position Risk Take a leadership role to help manage risk in the community and our organisation Customers Become a customer oriented organisation, applying customer centric principles to all customer touch points Claims Drive a balanced outcome on service, quality and cost management via people, process and supply chain models Technology Invest in technology capabilities to gain competitive edge & reduce complexity to increase speed to market 32
33 Aspirations Aspirations Life Assurance and Takaful Strategy Life Assurance: Focusing on customer-centricity, AmMetLife wants to be the preferred life insurer of choice for all Malaysians Optimise value and risk Drive operational excellence Deliver the right solutions for the right customers Strengthen distribution advantage Optimise unit cost acquisition with focus on Agency, Bancassurance & EB channels Invest in system capabilities to automate processes and build selfservice esolutions Innovative products and solutions to meet protection needs of customers during different life stages Digital solutions for professional agency forces and bancassurance specialists Gain EB market share through service delivery differentiation Takaful: Deliver engaging customer and partner experiences that create competitive advantage and drive value echannel (direct) Agency Bancatakaful To build an Online Straight Through process under Live Digital Project On-line Takaful term plan Unique proposition to provide Warm Lead to the intermediaries Organic growth for existing Agency Force Hybrid Agency Force i.e. leveraging with AmMetLife Insurance Agency Force Distribution via Takaful Specialist, Personal Banker/Wealth Specialist Muslim centric product for bank customers 33
34 Aspirations People and Culture To be the Top 4 Employer of Choice Strategy Elevating the way we work Leadership & Team Building Managing Change Inculcating performance driven culture Technology Enabled workforce Connected Access - anytime/ anywhere Create a flexible workplace Self productivity driven Performance Driven Leadership Bonding Strategic Business Unit/ workforce bonding Understanding our plans and the need for change Regular Engagement Scheduled Communications & Messaging Strategic Change Management Tactical Change Management Channels and Cascade Network Culture Alignment - What & Why Enforcement - How Living the Plan Formal change programme elements Informal change programme elements Leadership alignment Capability building People processes Change champions Viral networks Key behaviours Role based development Talent management Organisation & KPI alignment Culture 34
35 Group Performance 35
36 Yearly Performance FY17 Results PATMI (RM mil) & ROE (%) Cost to Income Ratio and Expenses Growth (%) PATMI (Reported) PATMI: ROE: PATMI (Underlying) CAGR FY13-17: 4.9% CAGR FY13-17: 1.4% CTI: Expenses: YoY Growth: 1.7% YoY Growth: 0.3% CTI% Expenses Growth% ROE (%) CAGR FY13-17: 2.4% CAGR FY13-17: 4.3% 13.9% 14.1% 13.8% YoY growth: 1.4% 1, % 8.5% 47.8% 45.6% 45.7% 58.8% 57.4% 1,621 1,782 1,639 1,302 1, % 3.6% -0.2% 0.8% -0.6% FY13 FY14 FY15 FY16 FY17 FY13 FY14 FY15 FY16 FY17 Total Income (RM mil) and Non-interest Income (%) 31% Total income (Reported) Total income (Underlying) Non-interest income % 34% 41% 4,725 CAGR FY13-17: 3.7% YoY growth: 1.9% 36% 39% ROA (%) and EPS (Basic) EPS 1.37% ROA ROA: CAGR FY13-17: 0.07% YoY growth: 0.04% 1.45% 1.60% EPS: CAGR FY13-17: 5.0% YoY growth: 1.8% 1.05% 1.09% 4,379 4,743 4,263 3,696 3, FY13 FY14 FY15 FY16 FY17 FY13 FY14 FY15 FY16 FY17 36
37 Stronger non-interest income, reflecting progress of Top 4 strategy Non-Int Income Non-interest Income (RM mil) QoQ growth: 48.0% YoY growth: 11.9% Non-interest Income by Lines of Business (YoY) 54% Fee Trading & Investment Insurance Others % Insurance 28% Other Retail 4% Insurance & Others 32% 1% RB 15% 13% Others 4% Investment Bank 13% WB 53% 31% 35% Markets 11% Fund Mgmt 8% 28% 6% % 13% Cards 8% Wealth Management 3% Corp & Comm Banking 21% 54% (6.6) Q1FY16 Q2FY16 Q3FY16 Q4FY16 Q1FY17 Q2FY17 Q3FY17 Q4FY17 28% 37
38 Sustaining Asset Quality in a challenging environment Asset Quality GIL improved 8 bps YoY driven by Retail while Wholesale was impacted by impairment of large corporate accounts in Q4FY17 61% of impaired loans exposure are in real estate and residential properties; these are generally well collateralised Impaired Loans (RM mil) 2.22% 2.00% 1.95% 1.96% 1.86% 1.94% 1.81% 1.81% 1.91% 1.63% 1.68% 1.74% 1.62% 1.62% 1.60% 1.60% Wholesale 2.46% 1.90% 1.76% Group 1.86% 1.69% 1.64% 1.64% 1.66% Industry, 1.63% 1.65% 1.61% 1.54% 1.52% 1.52% 1.44% Retail 1.33% Impaired Loans by Sectors and YoY Movement Q1FY16 Q2FY16 Q3FY16 Q4FY16 Q1FY17 Q2FY17 Q3FY17 Q4FY17 Sector Mar-17 RM mil YoY growth Composition Real Estate % 41.9% Residential Properties % 18.7% Transport Vehicles % 12.0% Loan Loss Coverage¹ 129.3% 127.4% ² 131.7% 105.0% 99.6% ² Adjusted AmBank Group 124.0% ³ Mining and quarrying % 9.1% Manufacturing % 5.6% Construction % 1.0% 81.2% AmBank Group 79.7% Others % 11.7% Total 1, % 100.0% FY13 FY14 FY15 FY16 FY17 1. Includes regulatory reserve 2. Excludes a single large and well-secured impaired corporate loan 3. Excludes 2 large and well-secured impaired corporate loans 38
39 Asset Quality Asset Quality Impaired Loans Key Segments FY14 FY15 FY16 FY17 3.1% 2.8% 2.4% 2.2% 2.0% 1.7% 1.8% 1.7% 1.3% 1.5% 1.3% 1.0% 2.5% 2.2% 1.6% 0.8% Provision Charges/(Writebacks) 1 (RM mil) Performing Loans Non-Performing Loans Recoveries Others Auto Finance Mortgage Retail Wholesale Banking Collective Allowance Balance (RM mil) FY15 FY16 FY FY17 Total: RM 862 mil FY16 Total: RM 1,062 mil FY15 Total: RM 1,413 mil FY13 FY14 FY15 FY16 FY17 1. Includes provision for contingencies, securities, foreclosed property, trade and sundry debtors Defaulted Assets Non-defaulted Assets Model Risk Adjustment Macro Adjustment 39
40 Loans by sector & by purpose vs. industry Loans by Sector AmBank Group (RM bil) Loans Composition 4.2% 2.3% 10.2% 0.5% 4.2% 5.9% 3.2% 5.0% 9.2% 1.5% 53.6% 0.2% YoY Growth 1.9% 22.8% 5.5% 5.4% 6.8% 11.2% 41.8% 45.6% 9.6% 27.3% 5.8% 84.9% 3.5% Mar-17 Loans by Purpose Purchase of transport vehicles Mar-17 RM bil YoY growth Composition % 22.1% Working capital % 31.8% Purchase of resi property % 24.5% Purchase of non-resi property Loans vs Industry % 7.5% Other purpose % 4.2% Purchase of securities % 2.4% Construction % 3.0% Personal use % 2.0% Agriculture Mining & Quarrying Electricity, Gas Manufacturing & Water 3.8 Construction 5.3 Wholesale, Retail, Restaurant Transport, Storage & Com Finance, Insurance, & Biz Act 8.4 Real Estate 1.4 Education & Health 0.1 Household Others Total Loans Credit card % 1.4% Purchase of fixed assets % 1.1% Consumer durables % 0.0% % 100.0% Loans by Purpose Purchase of transport vehicles Mar-17 RM bil YoY growth Composition % 10.9% Working capital % 24.2% ,535.8 Purchase of resi property % 31.7% Purchase of non-resi property % 13.7% Other purpose % 4.3% Mar-17 Loans Composition 2.5% 0.8% 6.7% 0.7% 4.4% 7.4% 2.7% 7.0% 7.2% 2.8% 56.7% 1.1% YoY growth 6.9% 7.0% 3.1% 13.0% 6.2% 6.4% 21.3% 6.6% 10.2% 3.0% 5.2% 6.8% 6.0% Industry (RM bil) Source : BNM, financial statements Purchase of securities % 4.9% Construction % 3.0% Personal use % 4.4% Credit card % 2.3% Purchase of fixed assets % 0.6% Consumer durables % 0.0% 1, % 100.0% 40
41 Deposits movement Deposits AmBank Group (RM bil) Mar-17 Deposits Composition (AmBank Group) YoY growth 7.8% 0.1% 63.0% 4.1% FCY 7% Current Account & Savings Account 20% Term Deposits 73% CASA CASA Term Term Deposits Deposits FCY FCY & Others¹ Others Total Total Deposits Deposits Deposits Composition (Industry) ,708.2 FCY & Others 23% Current Account & Savings Account 27% Industry (RM bil) YoY growth 8.3% 0.8% 3.6% 3.4% Mar-17 Term Deposits 50% 1. Includes foreign currency CASA, term deposits & fixed deposits Source : BNM, financial statements 41
42 Diversified funding sources, prudent liquidity management Funding Conservative approach to liquidity management, LCRs for all banking entities above regulatory requirement Higher composition of stable medium term funding vis-à-vis industry, creates stability but weighs on cost of funds in the short term Liquidity well managed with LDR ² maintained below 100% supported by improving deposits Funding Composition vs. Peers Equity & debt capital Customer deposits Term funding & loans with recourse >1year Term funding & loans with recourse <1year Deposits from banks & Fis FY10 FY13 FY15 FY16 FY17 Industry Ave 1 15% 14% 15% 16% 16% 15% 77% 75% 74% 73% 74% 73% 2% 7% 8% 8% 8% 1% 1% 1% 2% 1% 5% 5% 3% 2% 1% 1% 7% 1. Based on an average of seven peer domestic banks industry data as at Dec 16 Funding Maturity Profiles Term Funding and Debt Capital 17% Deposits from Customers and Banks & FIs 20% 2% 1% Loan-to-deposit Ratio LDR Adjusted LDR ² 99.6% 98.0% 97.6% 94.0% 95.8% 93.4% 89.8% 88.8% 88.1% 83% 76% 83.8% 84.7% 85.7% < 1 yr > 1 yr < 6 mth 6-12 mth 1-3 yr 3-5 yr FY12 FY13 FY14 FY15 FY16 FY17 2. Includes stable funding sources 42
43 Divisional Performance & Economic and Banking Data
44 Wholesale Banking s income in key segments higher Wholesale Total Income (YoY Movement) and Total Assets by Line of Business 32% RM42.9mil Capital & Equity Markets 11% 10% RM30.9mil Transaction Banking 21% 7% RM8.8mil Funds Management 8% Others 2% Capital & Equity Markets 2% Transaction Banking 13% Total Income RM1,645.4mil 32% RM12.2mil Others 3% Global Markets 23% Wholesale Banking Coverage 60% Total Assets RM57.6b Global Markets 14% Wholesale Banking Coverage 43% 12% RM74.8mil QoQ PAT (RM mil) FY16: RM821 mil QoQ growth: 16.6% YoY growth: 0.6% FY17: RM826 mil Wholesale Banking s total income up 13% Q1FY16 Q2FY16 Q3FY16 Q4FY16 Q1FY17 Q2FY17 Q3FY17 Q4FY17 Note: FY16, Q1FY17, Q2FY17 and Q3FY17 numbers have been restated due to realignment of business NoII up 31% YoY reflecting trading gain from DCM syndication, higher fixed income trading and gain from disposal of foreclosed property NII benefits from SME segment growth and active COF management were offset by yield compression from Corporate loans 37% RM60.8mil PAT impacted by impairment of large corporate accounts in Q4FY17 44
45 Wholesale Banking overview Wholesale League Table Market Share of Value Traded on Bursa (KLSE) Market Share 1 As At 31 Mar 2017 (%) Rank 2 DCM (Overall MYR Bonds) 29.5% 1 6.9% 5.5% 5.3% 5.7% 5.2% Islamic Sukuk 27.5% 1 Unit Trust 8.6% 5 Stockbroking 4.8% 7 1. Calendar Year data 2. Comparing rank movement with 31 December 2016 FY13 FY14 FY15 FY16 FY17 Unit Trust AuM (RM bil) QoQ Loan Disbursement and Repayment (RM bil) Disbursement Repayment FY14 FY15 FY16 FY17 Q1FY16 Q2FY16 Q3FY16 Q4FY16 Q1FY17 Q2FY17 Q3FY17 Q4FY17 45
46 Wholesale Banking (Including Business Banking) Wholesale Income Statement (RM mil) YoY growth 0.5% 30.9% 12.9% 4.3% 17.6% >100% 0.8% 1.3% 0.6% RM' mil Net Interest Income Non-Interest Income Total Income Expenses PBP Allowances PBT Tax PAT FY , , , FY , (122.2) 1, Balance Sheet (RM mil/%) FY17 vs FY16 FY17 FY16 Gross Loans / Financing 41, , % FY17 PAT (composition of Group) Gross Impaired Loans 2.46% , % Customer Deposits 52, , % CASA Deposits 8, , % ROA 1.60% 1.55% % Others Wholesale Banking 59% CTI 35.2% 32.8% % Allowance Coverage 52.5% 37.2% % Ave Assets Management 46, , % FY16 PAT FY17 PAT Positive growth in FY17 Contraction in FY17 46
47 Retail Banking focusing on loans growth in preferred segments and higher non-interest income to mitigate margin compression Retail Total Income (YoY Movement) and Loans by Line of Business Total Income RM1,364.9mil QoQ PAT (RM mil) FY16: RM467.2 mil QoQ growth: 42.1% YoY growth: 23.7% FY17: RM356.6 mil 1% RM3.5mil 22% RM8.6mil 19% RM7.0mil Wealth 4% Retail SME 2% Others 1% 65% RM53.3mil Auto 21% 15% RM50.3mil Deposits 33% Others 2% Retail SME 2% Cards 3% Personal Financing 3% 3% RM1.1mil Mortgage 52% Auto 41% Total loans RM48.8b Cards 18% 10% RM26.6mil Mortgage 18% 3% RM7.3mil Q1FY16 Q2FY16 Q3FY16 Q4FY16 Q1FY17 Q2FY17 Q3FY17 Q4FY17 Note: FY16, Q1FY17, Q2FY17 and Q3FY17 numbers have been restated due to realignment of business Retail loans grew 5.4% driven by Mortgages and Cards. Auto loans contracted in line with lower domestic vehicle sales CASA up 7.7% contributed by payroll accounts and Retail SMEs Good growth momentum in sustainable fee income and leading indicators during the year such as Wealth Management sales, Cards acquisition & spending, Merchant volume and Mortgage net acceptance 47
48 Retail Banking Overview Retail Wealth Sales (RM mil) QoQ growth: 41.4% YoY growth: 150.2% Merchant Volume 2,412 Merchant volume (RM'mil) Merchants in force ('000) ,541 2,577 2,690 2,595 2,619 QoQ growth: 3.2% YoY growth: 6.7% ,799 2,890 Q1FY16 Q2FY16 Q3FY16 Q4FY16 Q1FY17 Q2FY17 Q3FY17 Q4FY17 Q1FY16 Q2FY16 Q3FY16 Q4FY16 Q1FY17 Q2FY17 Q3FY17 Q4FY17 QoQ Deposit Balance (RM bil) YoY growth: CASA: 7.7% FD: 3.2% Mortgage and Auto Finance Disbursement QoQ (RM bil) CASA Term Deposits CASA % 28.3% Mortgage Auto Finance Mortgage YoY growth: 42.7% 27.9% 25.8% 25.9% 25.4% 25.8% 26.4% 26.5% Auto YoY growth: 12.2% Q1FY16 Q2FY16 Q3FY16 Q4FY16 Q1FY17 Q2FY17 Q3FY17 Q4FY17 Q1FY16 Q2FY16 Q3FY16 Q4FY16 Q1FY17 Q2FY17 Q3FY17 Q4FY17 48
49 Retail Banking Retail Income Statement (RM mil) YoY growth 6.8% 12.8% 7.9% 2.2% 17.7% 70.0% 23.9% 24.5% 23.7% RM' mil Net Interest Income Non-Interest Income Total Income Expenses PBP Allowances PBT Tax PAT FY17 1, , (21.9) FY16 1, , (73.0) Balance Sheet (RM mil/%) FY17 vs FY16 FY17 FY16 Gross Loans / Financing 46, , % Gross Impaired Loans 1.33% % FY17 PAT (composition of Group) Customer Deposits 40, , % CASA Deposits 10, , % Retail Banking 25% ROA 0.98% 0.74% % Others CTI 63.5% 67.3% +3.8% Allowance Coverage 60.1% 76.6% +16.5% FY16 PAT FY17 PAT Positive growth in FY17 Contraction in FY17 49


50 Retail Banking Distribution channels Retail Branches ATM Regional Offices Perlis 1 3 Perlis Kedah Kedah Pulau Pinang Perak Selangor Kuala Lumpur Putrajaya Kelantan Melaka Pahang Terengganu Negeri Sembilan Johor Sarawak Labuan Brunei Darussalam Sabah Pulau Pinang Perak Selangor Kuala Lumpur Putrajaya 1 3 Negeri Sembilan 7 38 Melaka Johor Pahang Population Density: < 100 persons per km persons per km 501-1,000 persons per km 2 1,001-1,500 persons per km 2 >1,501 persons per km 2 Terengganu 4 16 Kelantan 2 16 Sabah Labuan 1 3 Other Customer Touch Points Sarawak SME branches AmBank Islamic branches Weekend banking branches 7- Eleven Electronic banking centres Internet & mobile banking AmGeneral AmMetlife AmInvestment Bank AmCard Services MBC (140 Cluster Branches) AmOnline AmGenie 29 branches 3 counters 15 branches 48 agencies 7 retail broking 6 corporate MBC Merchant Business Centres 50
51 Islamic Banking Islamic Income Statement (RM mil) YoY growth 1.2% 1.4% 4.5% >100.0% 0.8% 15.8% 6.4% FY17 PAT (composition of Group) 19% RM' mil Total Income Expenses PBP Allowances PBT Tax PATZ FY (24.4) FY (6.6) PATZ: profit after tax and zakat Balance Sheet (RM mil/%) FY16 FY17 FY17 vs FY16 Gross Financing 27, , % Gross Impaired Financing 1.78% % FY17 Gross Financing (composition of Group) Customer Deposits 28, , % CASA Deposits 5, , % 30% ROA 0.64% 0.71% +0.07% CTI 55.5% 57.0% +1.5% Allowance Coverage 65.0% 54.9% % FY16 PAT FY17 PAT Positive growth in FY17 Contraction in FY17 51
52 General insurance sustained Gross Premium and improved historical claims experience Insurance PBT increased 6.7% YoY from improved historical claims experience and gain on disposal of properties, partially offset by higher expenses YoY PAT (RM mil) PAT PBT YoY PAT growth: 12.6% YoY PBT growth: 6.7% Gross written premium (GWP) sustained on higher non-motor insurance with a growth of 6.3% YoY. Lower motor sales impacted motor premiums Key operating ratios remained strong with combined ratio stable at 96.9% whilst loss ratio improved to 62.9%, driven by increase in tariff rates for Motor FY12 FY13 FY14 FY15 FY16 FY17 3. Includes write-back of prior year tax provisions Loss Ratio and Combined Ratio Loss Ratio Combined Ratio 94.8% 90.7% 89.4% 91.2% 96.4% 96.9% Premium Mix and Growth (RM mil) Motor Non-Motor 1, , % YoY GWP growth: 0.8% YoY Motor growth: 0.5% YoY Non-motor growth: 6.3% 1, , , % 18.4% 19.5% 18.1% 65.4% 60.5% 63.0% 62.8% 64.0% 62.9% % 79.6% 81.9% 81.2% 82.0% 81.6% 80.5% FY12¹ FY13² FY14 FY15 FY16 FY17 1. Before acquisition of Kurnia 2. Included 6 months of Kurnia s results (Acquisition of Kurnia completed on 26 Sep 2012) FY12¹ FY13² FY14 FY15 FY16 FY17 NB: The Malaysian Competition Commission is investigating the wider general insurance industry in connection with agreements implemented by PIAM (the General Insurance Association of Malaysia) in relation to the automobile repair industry. 52
53 Insurance and Group Funding & Others Income Statement Insurance (General & Life/Takaful) (RM mil) Insurance & Group Funding YoY growth 15.0% 5.8% 32.9% >100.0% 36.4% >100.0 % 12.5% FY17 PAT (composition of Group) 14% RM' mil Total Income Expenses PBP Allowances PBT Tax PAT FY (1.1) FY (14.0) Income Statement Group Funding & Others (RM mil) YoY growth 27.0% 8.4% 32.1% >100.0% >100.0% >100.0% >100.0 % 12.3% 66.1% FY17 PAT (composition of Group) 2% RM'mil Total Income Expenses PBP Provisions/ Allowances PBT Tax PAT MI PATMI FY (164.7) (207.9) (54.2) FY (124.7) (17.8) (106.9) (43.2) (63.7) 95.1 (158.8) FY16 PAT FY17 PAT Positive growth in FY17 Contraction in FY17 53
54 Funding sources and maturity profile Insights LDR 1 of 85.7% Funding diversity underpinned by CASA: RM19.9 billion Fixed deposits: RM74.2 billion Supplemented by term funding & debt capital AMMB Holdings Berhad 1. RM2b Medium Term Notes Programme (Senior and/or Subordinated) 2. RM10b Basel III-Compliant Tier 2 Subordinated Notes Programme AmBank (M) Berhad 1. RM500m Innovative Tier-1 Capital Securities Programme 2. RM500m Non-innovative Tier 1 Capital Securities Programme 3. RM2b Medium Term Notes 4. RM4b Tier-2 Subordinated Notes 5. RM7b Senior Notes 2 6. USD2b Euro Medium Term Notes AmBank Islamic Berhad 1. RM2b Subordinated Sukuk Musharakah Programme 2. RM3b Senior Sukuk Musyarakah Programme 3. RM3b Basel III-compliant Subordinated Sukuk Murabahah Programme via Tawarruq arrangement AmBank (M) Berhad & AmBank Islamic Berhad Loans with Recourse Recourse obligations on loans sold to Cagamas - maturing in 2017 and 2018 Islamic financing sold to Cagamas maturing in 2018 Funding characteristics Improve funding stability, maturity gap and liquidity ratios Reduce dependence on short-dated deposits to fund long-dated fixed rate loan assets which incur liquidity risk and interest rate risk Diversifies investor base No obligation for buy back since we are not exposed to withdrawal risks and the notes are traded in the open market Enable depositors to invest in long and medium dated papers 1. Includes stable funding sources from additional Tier 1 and Tier 2 capital which do not meet all qualifying criteria for full recognition of capital instruments under Basel III 2. 1 st senior notes issuance by a financial institution in Malaysia 54
55 Shareholding structure Insights 23.8% 1 AmCorp 13.0% EPF 10.9% Others 52.3% AMMB Holdings Berhad As at 31 March 2017 Retail Banking Wholesale Banking Islamic Banking General Insurance Life Assurance & Takaful 100% AmBank (M) Berhad 100% MBF Cards (M sia) Sdn Bhd 100% AMAB Holdings Sdn Bhd 51% AmGeneral Holdings Berhad 2 49% 33.33% Bonuskad Loyalty Sdn Bhd 100% AmBank Islamic Berhad 100% AmInvestment Bank Berhad 100% AmGeneral Insurance Berhad 3 ~50% AmMetLife Insurance Berhad 4 ~50% 100% AmInvestment Group Berhad ~50% AmMetLife Takaful Berhad 4 ~50% Foreign shareholding excluding ANZ FY2011 FY2012 FY2013 FY2014 FY2015 FY2016 FY % 26% 29% 31% 29% 26% 26% 1.ANZ: ANZ Funds Pty Ltd,a wholly owned subsidiary of Australia and New Zealand Banking Group Limited 2.Formerly known as AmG Insurance Berhad 3.Formerly know as Kurnia Insurans (Malaysia) Berhad 4.MetLife owns 50% plus one share in AmMetLife Insurance Berhad, with the remaining shares held by AmBank Group, and AmBank Group owns 50% plus one share in AmMetLife Takaful Berhad, with the remaining shares owned by MetLife 55
56 Banking sector share price movement/target price and recommendations Insights Upgraded Ratings Ratings FY2007 FY2017 AmBank (M) RAM LT: A2, ST: P1 Outlook: Stable LT: AA2, ST: P1 Outlook: Stable +3 S&P LT: BBB-, ST: A-3 Outlook: Stable LT: BBB+, ST: A-2 Outlook: Stable +2 Moody s LT: Baa2, ST: P-3 Outlook: Stable BFSR: D- LT: Baa1, ST: P-2 Outlook: Stable *BCA: baa3 *Adj BCA: baa3 +1 AmInvestment RAM LT: AA3, ST: P1 Outlook: Stable LT: AA2, ST: P1 Outlook: Stable +3 AmBank Islamic RAM LT: A2, ST: P1 Outlook: Stable LT: AA2, ST: P1 Outlook: Stable AMMB RAM NA LT: AA3, ST: P1 Outlook: Stable +3 Target Price and Recommendations * Maintained since 16 Jun Notches of ratings upgrades since 2007 P/EPS : Market Price: RM 5.17 Average TP : RM 4.70 P/BV : 0.96 Buy : 4 (22%) Hold : 12 (67%) Sell : 2 (11%) Ave. TP/ CP : 1.00x Buy/Outperform/Overweight/Add P/EPS & P/BV Source : Bloomberg as at 22 Apr 2017 Hold/Neutral/Market perform Sell/Underperform/Fully valued/reduce/underweight TP: target price 56
57 Mar Jun Sep Dec Mar Jun Sep Dec Mar Jun Sep Dec Mar Jun Sep Dec Mar Opportunities and outlook Insights Real GDP Growth Avg USDMYR % 5.6% 4.7% 6.0% 5.0% 4.2% 4.3% to 4.8% F Source: Bank Negara Malaysia, Bloomberg, CEIC, Internal India Philippines PR China Indonesia Malaysia Thailand Singapore % 2016 GDP 2017 GDP Forecast to Malaysia s GDP Growth GDP grew 4.2% for CY16 supported by private consumption. Private investment moderated to 4.7% led by capital spending in services and manufacturing GDP forecast to grow at 4.3% 4.8% for CY17 led by continued expansion in domestic activities and stronger exports from improving global economy 1Q2017 GDP recorded higher growth of 5.6% mainly driven by private sector activity and higher exports Total Deposits & Repo Business Enterprises Individuals RM1,722.8b Individuals RM660.5b Business Enterprises RM571.6b Industry Deposits Growth (RM bil) The banking system s total deposits 2 grew 2.0% for CY16 (CY15: 2.3%) mainly due to a decline in deposits placed by businesses (CY16: -2.3%, CY15: 0.9%). Nevertheless, household deposits continued to register a healthy growth of 5.1% during the year (CY15: 5.3%) Source: Bank Negara Malaysia Total Loan Applications SME Large Corp Household RM197.4b 1Q 2Q 3Q 4Q 1Q 2Q 3Q 4Q 1Q 2Q 3Q 4Q 1Q 2Q 3Q 4Q 1Q Annual Growth 1 of Outstanding Loans SME 9.2% Household & Large Corp 5.3% Total Loan Applications (RM bil) and Industry Loan Growth The banking system s loans is expected to grow between 5.0% - 6.0% in CY17, supported by modest growth in retail loans especially in mortgage loans for affordable homes and improvement in business loans from higher exports and firmer commodity prices 1. Annual growth is for end-period 2. Excluding deposits by banks 3. Source: Bank Negara Malaysia 57
INVESTOR PRESENTATION
 INVESTOR PRESENTATION Q1FY18 RESULTS 24 AUG 2017 GCEO PRESENTATION 3 4 5 Q1FY18 Performance Highlights 2017 Market Outlook Q1FY18 Business Heartbeat Q1FY18 Performance Highlights Financial Overview Total
INVESTOR PRESENTATION
 INVESTOR PRESENTATION H1FY18 RESULTS 28 NOV 2017 GCEO PRESENTATION 3 4 5 6-9 H1FY18 Performance Highlights 2017 Market Outlook Top 4 Aspirations H1FY18 Business Heartbeat H1FY18 Performance Highlights
9MFY Results. Investor Presentation. 24 February MFY2017 Results Investor Presentation
 9MFY2017 - Results Investor Presentation 24 February 2017 V0 9MFY2017 Results 01 02 03 04 9MFY2017 GCEO GCFO Supplementary information Quick take on our results 9MFY2017 progress Strategic priorities Business
INVESTOR PRESENTATION
 INVESTOR PRESENTATION 9MFY18 RESULTS 28 FEB 2018 GCEO PRESENTATION 3 4 5 6 9MFY18 Performance Highlights 2018 Market Outlook Top 4 Aspirations 9MFY18 Business Heartbeat 9MFY18 Performance Highlights Financial
H1FY Results. Investor Presentation. 21 November H1FY2017 Results Investor Presentation V23
 H1FY2017 - Results Investor Presentation 21 November 2016 V23 Content H1FY2017 Quick take on our results H1FY2017 - Results Investor Presentation GCEO H1FY2017 progress Strategic priorities Business heartbeat
H1FY2019 RESULTS INVESTOR PRESENTATION 22 NOVEMBER 2018
 H1FY2019 RESULTS INVESTOR PRESENTATION 22 NOVEMBER 2018 GCEO PRESENTATION Dato Sulaiman Mohd Tahir 3 4-5 6 H1FY19 Financial snapshot First half business review & Franchise Outlook for 2018 H1FY19 Financial
Q1FY Results, Investor Presentation 22 AUGUST 2016 V18
 Q1FY2017 - Results, Investor Presentation 22 AUGUST 2016 1 V18 Performance indicators Q1FY2017 RM mil Q1FY16 Q1FY17 YoY Growth Total income 963.8 951.2 1.3% Expenses 487.3 535.5 9.9% Allowances -5.9-63.7
H1FY2016 Results, Investor Presentation. 19 November 2015
 H1FY2016 Results, Investor Presentation 19 November 2015 Our vision: As Malaysia s preferred diversified, internationally connected financial solutions group, we take pride in growing your future with
AmBank Group achieves RM461.8 million PAT in Q1FY2013
 AmBank Group achieves RM461.8 million PAT in Q1FY2013 Higher net-interest income and lower allowances Improved Profitability Q1FY2013 (RM mil) Q1FY2013 vs Q1FY2012 1 Profit after tax ( PAT ) 461.8 5.1%
AmBank Group Reports Net Profit of RM878.7 million for 9MFY18
 Media Release 28 February 2018 AmBank Group Reports Net Profit of RM878.7 million for 9MFY18 AMMB Holdings Berhad (AmBank Group or the Group) today announced the financial results for the 9 months ended
AmBank Group - Strategy and Progress Update (ANZ Asia Tour)
") AMMB Holdings Berhad AmBank Group - Strategy and Progress Update (ANZ Asia Tour) Jun 2010 Ashok Ramamurthy Deputy Group Managing Director & Group Chief Financial Officer Executive Summary Strategy & Progress
AMMB Holdings Berhad AmBank Group - Strategy and Progress Update (ANZ Asia Tour) Jun 2010 Ashok Ramamurthy Deputy Group Managing Director & Group Chief Financial Officer Executive Summary Strategy & Progress
Key Performance Highlights (H1FY11 vs H1FY10)
") Press release, 12 November 2010 AMMB delivers a strong performance, PATMI of RM 701.2 mil for H1FY11, up 40.7% HoH Higher revenues and lower allowances, and good loans and deposit growth Proposed interim
Press release, 12 November 2010 AMMB delivers a strong performance, PATMI of RM 701.2 mil for H1FY11, up 40.7% HoH Higher revenues and lower allowances, and good loans and deposit growth Proposed interim
AmBank Group Recorded Net Profit of RM368.7 million for Q1FY2016
 Media Release Your Bank. Malaysia s Bank. AmBank. TM 19 August 2015 AmBank Group Recorded Net Profit of RM368.7 million for Q1FY2016 AMMB Holdings Berhad (AmBank Group or the Group) today announced the
AmBank Group Reports Net Profit of RM1,132 million for FY18
 Media Release 31 May 2018 AmBank Group Reports Net Profit of RM1,132 million for FY18 AMMB Holdings Berhad (AmBank Group or the Group) today announced the results for the financial year ended 31 March
AMMB Holdings Berhad. Maintain NEUTRAL Revised Target Price (TP): RM5.55 (from RM4.55)
: RM5.55 (from RM4.55)") 01 June 2017 4QFY17 Results Review AMMB Holdings Berhad Earnings growth due to NOII Maintain NEUTRAL Revised Target Price (TP): RM5.55 (from RM4.55) INVESTMENT HIGHLIGHTS FY17 earnings were within expectations
01 June 2017 4QFY17 Results Review AMMB Holdings Berhad Earnings growth due to NOII Maintain NEUTRAL Revised Target Price (TP): RM5.55 (from RM4.55) INVESTMENT HIGHLIGHTS FY17 earnings were within expectations
AMMB Q1FY12 RESULTS Growth momentum continues; higher non-interest income and lower allowances
 AMMB Q1FY12 RESULTS Growth momentum continues; higher non-interest income and lower allowances ( AMMB ) continues its growth momentum with a 20% increase in Profit after Tax and Minority Interest ( PATMI
Analysts Presentation First Half 2018 Financial Results. Dato' Khairussaleh Ramli Group Managing Director RHB Banking Group 30 August 2018
 Analysts Presentation First Half Financial Results Dato' Khairussaleh Ramli Group Managing Director RHB Banking Group 30 August Executive Summary H1 Financial Results Strategy Update Summary and Outlook
H1FY2015 Results Investors Presentation Ashok Ramamurthy, Group Managing Director
 19 November 2014 H1FY2015 Results Investors Presentation Ashok Ramamurthy, Group Managing Director 1 AGENDA Page 1. EXECUTIVE SUMMARY 2 2. H1FY2015 GROUP FINANCIAL PERFORMANCE 12 3. OUTLOOK & STRATEGIC
Analysts Presentation 3 rd Quarter 2017 Financial Results. Dato' Khairussaleh Ramli Group Managing Director RHB Banking Group 27 November 2017
 Analysts Presentation 3 rd Quarter Financial Results Dato' Khairussaleh Ramli Group Managing Director RHB Banking Group 27 November Executive Summary 3 rd Quarter Financial Results Strategy Update Summary
Analyst Presentation 1Q18 Results
 CIMB Group Analyst Presentation 1Q18 Results 30 May 2018 Key Financial Highlights Net Profit (RM) ROE Gross Loan (RM) ^ *^ ~ 1,306mil +10.7% Y-o-Y 10.2% -10bps Y-o-Y 323.1bn +0.5% Y-o-Y Cost-to-Income
BANKING SECTOR. Rationale for report: Banking statistics for January 2017
 BANKING SECTOR Sector Report 2 March 2017 Kelvin Ong,CFA kelvin-ong@ambankgroup.com 03-20362294 Higher deposit growth with stronger CASA momentum Rationale for report: Banking statistics for January 2017
Investor Presentation OSK-DMG ASEAN Corporate Day 2012 Kuala Lumpur 27 June
 OSK-DMG ASEAN Corporate Day 2012 Kuala Lumpur 27 June 2012 www.publicbank.com.my Disclaimer 2 The materials and information in the presentations and other documents are for informational purposes only,
RHB Capital Berhad Provisions likely to be higher moving forward
 29 Feb 2016 4QFY15 Results Review RHB Capital Berhad Provisions likely to be higher moving forward INVESTMENT HIGHLIGHTS 12MFY15 normalised net profit of RM1.74b was below our expectation accounting for
Investor Presentation Macquarie ASEAN Conference Singapore August
 Macquarie ASEAN Conference Singapore 27-29 August 2013 www.publicbank.com.my/corporate Disclaimer 2 The materials and information in the presentations and other documents are for informational purposes
Analysts Presentation 3 rd Quarter 2018 Financial Results. Dato' Khairussaleh Ramli Group Managing Director RHB Banking Group 27 November 2018
 Analysts Presentation 3 rd Quarter Financial Results Dato' Khairussaleh Ramli Group Managing Director RHB Banking Group 27 November Executive Summary 3 rd Quarter Financial Results Strategy Update Summary
H1FY18 RESULTS ANALYST PRESENTATION. 26 February 2018
 RESULTS ANALYST PRESENTATION 26 February 2018 1 Agenda 1 Financial Highlights: Key financial highlights Strong underlying performance led by healthy top-line, improved efficiencies & stable asset quality
Analysts Presentation FY2017 Financial Results. Dato' Khairussaleh Ramli Group Managing Director RHB Banking Group 27 February 2018
 Analysts Presentation FY2017 Financial Results Dato' Khairussaleh Ramli Group Managing Director RHB Banking Group 27 February 2018 Executive Summary FY2017 Financial Results Strategy Update Summary and
AmBank Group Presentation
 AmBank Group Presentation Invest Malaysia 2009, Kuala Lumpur 30 June 2009 Ashok Ramamurthy Deputy Group Managing Director and Group Chief Financial Officer AMMB Holdings Berhad Agenda Table of Contents
2014 Full Year Results Presentation
 2014 Full Year Results Presentation 11 February 2015 Disclaimer: This material should be read as an overview of OCBC s current business activities and operating environment. It should not be solely relied
Topline Driven Growth BUY. Last Traded: RM4.19
 C O M P A N Y U P D A T E Wednesday, March 14, 2018 FBMKLCI: 1,864.03 Sector: Finance THIS REPORT IS STRICTLY FOR INTERNAL CIRCULATION ONLY* AMMB Holdings Berhad TP: RM4.70 (+12.2%) Topline Driven Growth
Second Quarter 2017 Results Presentation 27 July 2017
 Second Quarter 2017 Results Presentation 27 July 2017 Disclaimer: This material should be read as an overview of OCBC s current business activities and operating environment. It should not be solely relied
AFFIN Bank Berhad (Incorporated in Malaysia)
") INTERIM FINANCIAL STATEMENTS UNAUDITED STATEMENTS OF FINANCIAL POSITION as at 31 March 2016 Note ASSETS Cash and short-term funds 5,858,185 4,070,710 3,713,510 2,203,022 Deposits and placements with banks
INTERIM FINANCIAL STATEMENTS UNAUDITED STATEMENTS OF FINANCIAL POSITION as at 31 March 2016 Note ASSETS Cash and short-term funds 5,858,185 4,070,710 3,713,510 2,203,022 Deposits and placements with banks
RHB BANK BERHAD 51 st ANNUAL GENERAL MEETING. Dato Khairussaleh Ramli Group Managing Director Presentation To Shareholders 26 th April 2017
 RHB BANK BERHAD 51 st ANNUAL GENERAL MEETING Dato Khairussaleh Ramli Group Managing Director Presentation To Shareholders 26 th April 2017 Overview FY2016 Performance Review IGNITE 2017 2017 Outlook 2016
First Quarter 2017 Results Presentation 09 May 2017
 First Quarter 2017 Results Presentation 09 May 2017 Disclaimer: This material should be read as an overview of OCBC s current business activities and operating environment. It should not be solely relied
Third Quarter 2017 Results Presentation 26 October 2017
 Third Quarter 2017 Results Presentation 26 October 2017 Disclaimer: This material should be read as an overview of OCBC s current business activities and operating environment. It should not be solely
Public Bank Group. Unaudited Q1 Group Results 31 March 2010
 Public Bank Group Unaudited Q1 Group Results 31 March 2010 Release Date: 15 April 2010 Quarter 1 2010 Results EXECUTIVE SUMMARY FINANCIAL PERFORMANCE GROWTH PERFORMANCE BUSINESS PERFORMANCE OTHER HIGHLIGHTS
ANALYSTS/FUND MANAGERS BRIEFING FY2016 RESULTS. 1 March
 ANALYSTS/FUND MANAGERS BRIEFING FY2016 RESULTS 1 March 2017 KEY HIGHLIGHTS & RATIOS PROFIT BEFORE TAX BY SEGMENTS STRATEGIC DIRECTION AFFINITY PROGRAM PROPOSED REORGANIZATION Summary of Key Highlights
Executive Summary. H Financial Results. Summary
 Mr. Kellee Kam Group Managing Director RHB Banking Group 27 August 2014 Executive Summary H1 2014 Financial Results Summary Executive Summary 1 st Half 2014 Results 1 Net profit at RM1.0 billion, up 31.2%
AmIslamic Bank Berhad
 Interim Financial Statements For the Financial Period 1 April 2013 to 30 September 2013 (In Ringgit Malaysia) UNAUDITED STATEMENT OF FINANCIAL POSITION AS AT 30 SEPTEMBER 2013 Note RM 000 RM 000 ASSETS
Analyst Presentation 1H18 Results
 Analyst Presentation 1H18 Results CIMB Group Holdings 29 August 2018 Key Financial Highlights Net Profit (RM) ROE Gross Loan (RM) ^ *^ ~ 2,359mil +3.3% Y-o-Y 9.7% -20bps Y-o-Y 329.9bn +3.4% Y-o-Y Cost-to-Income
Public Bank Group. Presentation to Investors J.P. Morgan Asia Financials Conference Hong Kong March 2011
 Public Bank Group Presentation to Investors J.P. Morgan Asia Financials Conference Hong Kong 10-11 March 2011 Disclaimer The materials and information in the presentations and other documents are for informational
2017 Full Year Results Presentation 14 February 2018
 2017 Full Year Results Presentation 14 February 2018 Disclaimer: This material should be read as an overview of OCBC s current business activities and operating environment. It should not be solely relied
KINDLY REFER TO THE LAST PAGE OF THIS PUBLICATION FOR IMPORTANT DISCLOSURES
 16 August 2018 2QFY18 Results Review Public Bank Berhad Higher than expected interim dividend Maintain BUY Unchanged Target Price (TP): RM27.30 INVESTMENT HIGHLIGHTS Earnings within expectations Net profit
ANALYSTS/FUND MANAGERS PRESENTATION 9MFY17 FINANCIAL RESULTS 30 NOVEMBER 2017
 ANALYSTS/FUND MANAGERS PRESENTATION 9MFY17 FINANCIAL RESULTS 30 NOVEMBER 2017 Agenda 1 Key Performance Highlights 2 Results Overview 3 Affinity Transformation Program 4 Proposed Reorganization 5 References
Market Access. M&A Securities. Results Review 1Q16. Malayan Banking Berhad. Hampered by Loan Loss. Monday, May 30, 2016 HOLD (TP: RM9.
 M&A Securities Results Review 1Q16 PP14767/09/2012(030761) Malayan Banking Berhad Monday, May 30, 2016 HOLD (TP: RM9.10) Hampered by Loan Loss Results Review Actual vs. expectations. Malayan Banking Bhd
Analysts Presentation 1 st Quarter 2018 Financial Results. Dato' Khairussaleh Ramli Group Managing Director RHB Banking Group 31 May 2018
 Analysts Presentation 1 st Quarter 2018 Financial Results Dato' Khairussaleh Ramli Group Managing Director RHB Banking Group 31 May 2018 Executive Summary 1 st Quarter 2018 Financial Results Summary and
COMMITMENTS AND CONTINGENCIES A28 10,194,763 6,822,999
 (14328 - V) INTERIM FINANCIAL STATEMENTS AUDITED STATEMENT OF FINANCIAL POSITION AS AT 31 DECEMBER 2015 Note RM 000 RM 000 ASSETS Cash and balances with banks 3,225,149 2,652,849 Financial assets held-for-trading
INTERIM FINANCIAL STATEMENTS AUDITED STATEMENT OF FINANCIAL POSITION AS AT 31 DECEMBER
 (14328 - V) CONDENSED INTERIM FINANCIAL STATEMENTS AUDITED STATEMENT OF FINANCIAL POSITION AS AT 31 DECEMBER 2018 Note RM 000 RM 000 ASSETS Cash and balances with banks 2,127,231 3,636,868 Financial assets
FINAL SLIDES FY 2015 RESULTS PRESENTATION TO ANALYSTS/FUND MANAGERS 7 MARCH 2016
 FINAL SLIDES FY 2015 RESULTS PRESENTATION TO ANALYSTS/FUND MANAGERS 7 MARCH 2016 Key Highlights Financial Performance Strategic Focus Updates on Affin Hwang Capital 2 Key Highlights Financial Performance
Siam Commercial Bank PCL
 Siam Commercial Bank PCL CLSA Investors Forum 2011 September 2011 1. Agenda Review of Result 2Q11 Page 3-17 2. Going Forward 19-23 IMPORTANT DISCLAIMER: Information contained in this document has been
For personal use only
 NEWS RELEASE 13 April 2012 IAG EXPANDS MALAYSIAN OPERATIONS Insurance Australia Group Limited (IAG) today announced its Malaysian joint venture business, AmG Insurance Berhad (AmG), has entered into a
2015 Full Year Results Presentation
 2015 Full Year Results Presentation 17 February 2016 Disclaimer: This material should be read as an overview of OCBC s current business activities and operating environment. It should not be solely relied
Public Bank Group Unaudited Q3 Group Results
 Public Bank Group Unaudited Q3 Group Results 30 September 2010 Release Date: 18 October 2010 Quarter 3 2010 Results EXECUTIVE SUMMARY FINANCIAL PERFORMANCE GROWTH PERFORMANCE BUSINESS PERFORMANCE OTHER
CIMB Group Holdings Bhd
 01 March 2018 4QFY17 Results Review CIMB Group Holdings Bhd Stellar ending INVESTMENT HIGHLIGHTS Exceeded our expectations, with strong NII and NOII growth, while cost contained NIM dipped in 3QFY17 due
RHB Bank Records RM500.3 Million Net Profit for the First Quarter 2017
 FOR IMMEDIATE RELEASE RHB Bank Records RM500.3 Million Net Profit for the First Quarter 2017 Higher non-fund based income lifted earnings over the previous quarter Cost-to-income ratio improved to 48.9%
AFFIN Islamic Bank Berhad (Incorporated in Malaysia)
") INTERIM FINANCIAL STATEMENTS UNAUDITED STATEMENTS OF FINANCIAL POSITION as at 30 September 2018 Economic Entity The Bank Note ASSETS Cash and short-term funds 2,580,723 1,423,594 2,580,723 1,423,594 Derivative
INTERIM FINANCIAL STATEMENTS UNAUDITED STATEMENTS OF FINANCIAL POSITION as at 30 September 2018 Economic Entity The Bank Note ASSETS Cash and short-term funds 2,580,723 1,423,594 2,580,723 1,423,594 Derivative
MALAYAN BANKING HOLD. Dividend boost in final quarter Company report. (Maintained) Rationale for report: Company Result BANKING
 Rationale for report: Company Result BANKING") BANKING MALAYAN BANKING (MAY MK, MBBM.KL) 22 February 2013 Dividend boost in final quarter Company report Rachel Huang huang-teng-siang@ambankgroup.com +603 2036 2293 Rationale for report: Company Result
BANKING MALAYAN BANKING (MAY MK, MBBM.KL) 22 February 2013 Dividend boost in final quarter Company report Rachel Huang huang-teng-siang@ambankgroup.com +603 2036 2293 Rationale for report: Company Result
1Q18 Financial Results
 1Q18 Financial Results Analyst Meeting Presentation 23 April 2018 IMPORTANT DISCLAIMER: Information contained in this document has been prepared from several sources and the Bank does not confirm the accuracy
Market Access. Results Review 2Q16. M&A Securities. RHB Capital Berhad. Recovery in Decent Traction. Thursday, August 25, 2016 BUY (TP: RM5.
 M&A Securities Results Review 2Q16 PP14767/09/2012(030761) RHB Capital Berhad BUY (TP: RM5.80) Thursday, August 25, 2016 Recovery in Decent Traction Results Review Actual vs. expectations. RHB Bank Berhad
Investor Presentation FY2012 Financial Results
 Investor Presentation FY Financial Results Mr. Kellee Kam Group Managing Director RHB Banking Group 26 February 2013 AGENDA Executive Summary FY Financial Results OSK Investment Bank - Integration Updates
Investor Presentation CLSA Investors Forum Hong Kong September 2017
 www.publicbankgroup.com CLSA Investors Forum Hong Kong 11-15 September 2017 Disclaimer The materials and information in the presentations and other documents are a summary only, do not purport to contain
HSBC BANK MALAYSIA BERHAD (Company No V) AND ITS SUBSIDIARY COMPANIES (Incorporated in Malaysia)
 AND ITS SUBSIDIARY COMPANIES (Incorporated in Malaysia)") HSBC BANK MALAYSIA BERHAD (Company No. ) AND ITS SUBSIDIARY COMPANIES (Incorporated in Malaysia) UNAUDITED CONDENSED INTERIM FINANCIAL STATEMENTS 31 MARCH 2014 Domiciled in Malaysia. Registered Office:
HSBC BANK MALAYSIA BERHAD (Company No. ) AND ITS SUBSIDIARY COMPANIES (Incorporated in Malaysia) UNAUDITED CONDENSED INTERIM FINANCIAL STATEMENTS 31 MARCH 2014 Domiciled in Malaysia. Registered Office:
ICICI Group: Performance & Strategy. November 2015
 ICICI Group: Performance & Strategy November 2015 Certain statements in these slides are forward-looking statements. These statements are based on management's current expectations and are subject to uncertainty
GROWING AND WINNING TOGETHER ANNUAL REPORT 2018
 GROWING AND WINNING TOGETHER ANNUAL REPORT 2018 GROWING AND WINNING TOGETHER ANNUAL REPORT 2018 OUR BUSINESSES AMMB Holdings Berhad AMMB Holdings Berhad is the holding company of AmBank Group and has
CIMB Group chalks a record RM3.29 billion 1H18 Net Profit
 CIMB Group chalks a record RM3.29 billion 1H18 Net Profit Wednesday, 29 August 2018 for immediate release 1H18 record net profit of RM3.29 billion (+44.0% Y-o-Y) bolstered by RM928 million gain on sale
CIMB Group announces record RM1.74 billion Profit Before Tax for 1Q18
 CIMB Group announces record RM1.74 billion Profit Before Tax for 1Q18 Wednesday, 30 May 2018 for immediate release 10.7% Y-o-Y growth in net profit to RM1.31 billion with annualised ROE of 10.2% 1Q18 PBT
Group Audited Financial Results for the Year Ended 31 December 2008
 Group Audited Financial Results for the Year Ended 31 December 2008 Analysts Briefing By Tan Sri Dato Sri Tay Ah Lek Managing Director 20 January 2009 22% Growth in Net Profit to RM2.58 billion RM million
OCBC Group Full Year 2012 Net Profit After Tax Up 73% to S$3.99 billion. Record 2012 core earnings driven by broad-based income growth
 Media Release OCBC Group Full Year 2012 Net Profit After Tax Up 73% to S$3.99 billion Record 2012 core earnings driven by broad-based income growth Singapore, 15 February 2013 - Oversea-Chinese Banking
OCBC Group s Fourth Quarter Earnings Up 8% to S$715 million, Bringing Full Year 2013 Net Profit After Tax to S$2.77 billion
 Media Release OCBC Group s Fourth Quarter Earnings Up 8% to S$715 million, Bringing Full Year 2013 Net Profit After Tax to S$2.77 billion Fourth quarter results driven by 22% increase in earnings from
INTERIM FINANCIAL STATEMENTS UNAUDITED STATEMENT OF FINANCIAL POSITION AS AT 30 JUNE
 (14328 - V) CONDENSED INTERIM FINANCIAL STATEMENTS UNAUDITED STATEMENT OF FINANCIAL POSITION AS AT 30 JUNE 2018 Note RM 000 RM 000 ASSETS Cash and balances with banks 1,927,247 3,636,868 Financial assets
Hong Leong Bank Berhad Surprised provisions but better to be prudent
 25 August 2017 4QFY17 Results Review Hong Leong Bank Berhad Surprised provisions but better to be prudent Revert to NEUTRAL Unchanged Target Price (TP): RM15.70 INVESTMENT HIGHLIGHTS FY17 was slightly
Paragon Banking Group PLC. Financial Results for twelve months ended 30 September 2018
 Paragon Banking Group PLC Financial Results for twelve months ended 3 September 218 218 results highlights 2 Strong financial performance and further strategic progress Strong operational performance New
Investor Presentation UBS APAC Financials Conference 2018 Hong Kong May 2018
 FORGING A SUSTAINABLE FUTURE UBS APAC Financials Conference 2018 Hong Kong 23-25 May 2018 www.publicbankgroup.com Quick Facts One of the Largest Premier Banks in Malaysia In 1966, Tan Sri Dato Sri Dr.
ICICI Group: Strategy & Performance
 ICICI Group: Strategy & Performance Agenda India: macroeconomic scenario Indian banking sector ICICI Group 2 Growth indicators Strong long term growth fundamentals Key drivers of growth Favourable demographics
HSBC Bank Malaysia Berhad V. Risk Weighted Capital Adequacy Framework (Basel II) Pillar 3 Interim Disclosures
 Pillar 3 Interim Disclosures") HSBC BANK MALAYSIA BERHAD (Company No.) (Incorporated in Malaysia) Risk Weighted Capital Adequacy Framework (Basel II) Pillar 3 Interim Disclosures at 30 June 2017 CHIEF EXECUTIVE OFFICER'S ATTESTATION
HSBC BANK MALAYSIA BERHAD (Company No.) (Incorporated in Malaysia) Risk Weighted Capital Adequacy Framework (Basel II) Pillar 3 Interim Disclosures at 30 June 2017 CHIEF EXECUTIVE OFFICER'S ATTESTATION
Investor Presentation
 Humanising Financial Services Investor Presentation Financial Results 4Q and Full Year ended 31 December 2016 23 February 2017 0 www.maybank.com Table of Contents Executive Summary Results Overview Strategic
CIMB s FY17 PBT up 25.1% to a record RM6.11 billion
 CIMB s FY17 PBT up 25.1% to a record RM6.11 billion Wednesday, 28 February 2018 for immediate release Record operating income of RM17.63 billion (+9.7% Y-o-Y) FY17 PBT improved 25.1% Y-o-Y to RM6.11 billion
AFFIN HOLDINGS BHD (AFFIN)
") AFFIN HOLDINGS BHD (AFFIN) All figures in millions of Ringgit Malaysia except per share values and ratios Analysis Date: 21/06/2013 Financial Year: 2012 31/12/2012 Latest Quarter: 31/12/2012 Price: 4.15
AFFIN HOLDINGS BHD (AFFIN) All figures in millions of Ringgit Malaysia except per share values and ratios Analysis Date: 21/06/2013 Financial Year: 2012 31/12/2012 Latest Quarter: 31/12/2012 Price: 4.15
MALAYAN BANKING BERHAD Capturing growth opportunities
 MALAYAN BANKING BERHAD Capturing growth opportunities Dato Sri Abdul Wahid Omar President and CEO Invest Malaysia 2009 Kuala Lumpur 30 June 2009 Capturing growth opportunities Where we are now Malaysia
SIAM COMMERCIAL BANK PCL.
 SIAM COMMERCIAL BANK PCL. 1Q17 Financial Results Analyst Meeting Presentation April 21 st, 2017 IMPORTANT DISCLAIMER: Information contained in this document has been prepared from several sources and the
AFFIN Islamic Bank Berhad (Incorporated in Malaysia)
") INTERIM FINANCIAL STATEMENTS UNAUDITED STATEMENTS OF FINANCIAL POSITION as at 30 September 2017 Economic Entity The Bank Note ASSETS Cash and short-term funds 1,912,027 1,057,844 1,912,027 1,057,844 Deposits
INTERIM FINANCIAL STATEMENTS UNAUDITED STATEMENTS OF FINANCIAL POSITION as at 30 September 2017 Economic Entity The Bank Note ASSETS Cash and short-term funds 1,912,027 1,057,844 1,912,027 1,057,844 Deposits
Performance and Outlook. December 2015
 Performance and Outlook December 2015 Agenda Macro Picture Performance Highlights Q&A 2 Agenda Macro Picture Performance Highlights Fundamentals (IIP) Output conditions Inflation Rates Credit and Deposit
Humanising Financial Services Across Asia
 Humanising Financial Services Across Asia 52 nd Annual General Meeting Presentation to Shareholders Dato Sri Abdul Wahid Omar President and CEO 29 March 2012 0 0 www.maybank.com For the 6-month financial
3Q17 Financial Results. October 20, 2017
 3Q17 Financial Results October 20, 2017 Forward-looking statements and use of key performance metrics and Non-GAAP financial measures This document contains forward-looking statements within the Private
INTERIM FINANCIAL STATEMENTS AUDITED STATEMENT OF FINANCIAL POSITION AS AT 31 DECEMBER
 (14328 - V) CONDENSED INTERIM FINANCIAL STATEMENTS AUDITED STATEMENT OF FINANCIAL POSITION AS AT 31 DECEMBER 2016 Note RM 000 RM 000 ASSETS Cash and balances with banks 651,382 3,225,149 Financial assets
AFFIN Bank Berhad (Incorporated in Malaysia)
") INTERIM FINANCIAL STATEMENTS UNAUDITED STATEMENTS OF FINANCIAL POSITION as at 30 September 2016 Quarter Year-End Quarter Year-End Note ASSETS Cash and short-term funds 4,981,926 4,070,710 3,334,320 2,203,022
INTERIM FINANCIAL STATEMENTS UNAUDITED STATEMENTS OF FINANCIAL POSITION as at 30 September 2016 Quarter Year-End Quarter Year-End Note ASSETS Cash and short-term funds 4,981,926 4,070,710 3,334,320 2,203,022
CHIEF EXECUTIVE OFFICER'S ATTESTATION
 HSBC BANK MALAYSIA BERHAD (Company No.) (Incorporated in Malaysia) Risk Weighted Capital Adequacy Framework (Basel II) Pillar 3 Interim Disclosures at CHIEF EXECUTIVE OFFICER'S ATTESTATION I, Mukhtar Malik
The Bank of Nova Scotia Berhad (Company No U) (Incorporated in Malaysia) and its subsidiaries
 (Incorporated in Malaysia) and its subsidiaries") The Bank of Nova Scotia Berhad (Company No. 308035 U) (Incorporated in Malaysia) and its subsidiaries Unaudited Condensed Interim Financial Statements 31 July 2015 Domiciled in Malaysia Registered office
The Bank of Nova Scotia Berhad (Company No. 308035 U) (Incorporated in Malaysia) and its subsidiaries Unaudited Condensed Interim Financial Statements 31 July 2015 Domiciled in Malaysia Registered office
AmIslamic Bank Berhad
 Interim Financial Statements For the Financial Period 1 April 2014 to 30 June 2014 (In Ringgit Malaysia) UNAUDITED STATEMENT OF FINANCIAL POSITION AS AT 30 JUNE 2014 30 June 31 March 2014 2014 Note RM
HSBC AMANAH MALAYSIA BERHAD (Company No X) (Incorporated in Malaysia) UNAUDITED CONDENSED INTERIM FINANCIAL STATEMENTS 30 JUNE 2016
 (Incorporated in Malaysia) UNAUDITED CONDENSED INTERIM FINANCIAL STATEMENTS 30 JUNE 2016") HSBC AMANAH MALAYSIA BERHAD (Company No. ) (Incorporated in Malaysia) UNAUDITED CONDENSED INTERIM FINANCIAL STATEMENTS 30 JUNE 2016 Domiciled in Malaysia. Registered Office : 2, Leboh Ampang, 50100 Kuala
HSBC AMANAH MALAYSIA BERHAD (Company No. ) (Incorporated in Malaysia) UNAUDITED CONDENSED INTERIM FINANCIAL STATEMENTS 30 JUNE 2016 Domiciled in Malaysia. Registered Office : 2, Leboh Ampang, 50100 Kuala
Siam Commercial Bank PCL DB Access Asia Conference 2012
 Siam Commercial Bank PCL DB Access Asia Conference 2012 May, 2012 Agenda Page 1. Review of Result 1Q12 3-17 2. Future Positioning 19-23 3. 2012 Targets 25 IMPORTANT DISCLAIMER: Information contained in
AmBank Group Results
 AMMB Holdings Berhad AmBank roup Results Investors Presentation Q1FY2011 Results Update 17 August 2010 Cheah Tek Kuang roup Managing Director Contents Executive Summary Q1FY2011 roup Financial Performance
Tune Protect Group Berhad (formerly known as Tune Ins Holdings Berhad) 2QFY16 Financial Results Analyst Presentation 19 August 2016
 2QFY16 Financial Results Analyst Presentation 19 August 2016") Tune Protect Group Berhad (formerly known as Tune Ins Holdings Berhad) 2QFY16 Financial Results Analyst Presentation 19 August 2016 2 AGENDA 01 EXECUTIVE SUMMARY Key highlights 2QFY16 Financial Highlights
Tune Protect Group Berhad (formerly known as Tune Ins Holdings Berhad) 2QFY16 Financial Results Analyst Presentation 19 August 2016 2 AGENDA 01 EXECUTIVE SUMMARY Key highlights 2QFY16 Financial Highlights
RHB Bank Reports Pre-tax Profit of RM1.2 billion for the First Half of 2016
 FOR IMMEDIATE RELEASE RHB Bank Reports Pre-tax Profit of RM1.2 billion for the First Half of 2016 Total income increased by 4.9% to RM3,200.6 million Cost-to-income ratio improved to 49.5% from 54.2% in
RHB Bank Records RM1.7 Billion Net Profit for Financial Year 2016
 FOR IMMEDIATE RELEASE RHB Bank Records RM1.7 Billion Net Profit for Financial Year 2016 Operating profit before allowances recorded strong growth of 21.6% to RM3,094.5 million Cost-to-income ratio improved
CIMB Group announces RM3.41 billion Net Profit for 9M17
 CIMB Group announces RM3.41 billion Net Profit for 9M17 Tuesday, 28 November 2017 for immediate release Record quarterly operating income of RM4.42 billion in 3Q17 9M17 PBT improved 24.6% Y-o-Y to RM4.57
Taking the Digital Leap BUY. Last Traded: RM18.60
 C O M P A N Y U P D A T E Monday, April 09, 2018 FBMKLCI: 1,837.01 Sector: Finance THIS REPORT IS STRICTLY FOR INTERNAL CIRCULATION ONLY* Hong Leong Bank Berhad TP: RM21.30 (+14.5%) Taking the Digital
Market Access. M&A Securities. Results Review 1Q15. BIMB Holdings Bhd BUY (TP:RM4.84) Brilliant Beginning. Results Review
 Brilliant Beginning. Results Review") M&A Securities Results Review 1Q15 PP14767/09/2012(030761) BIMB Holdings Bhd BUY (TP:RM4.84) Wednesday, May 27, 2015 Brilliant Beginning Results Review Actual vs. expectation. BIMB Holdings Berhad (BIMB)
M&A Securities Results Review 1Q15 PP14767/09/2012(030761) BIMB Holdings Bhd BUY (TP:RM4.84) Wednesday, May 27, 2015 Brilliant Beginning Results Review Actual vs. expectation. BIMB Holdings Berhad (BIMB)
Investor Presentation December 2017 Financial Results
 www.publicbankgroup.com Investor Presentation December 2017 Financial Results Income Statement Balance Sheet 2017 2016 Change Total asset RM395.3 bil RM380.1 bil 4.0% Loan: - Group - Domestic Deposit:
HSBC AMANAH MALAYSIA BERHAD (Company No X) (Incorporated in Malaysia) UNAUDITED CONDENSED INTERIM FINANCIAL STATEMENTS 31 MARCH 2015
 (Incorporated in Malaysia) UNAUDITED CONDENSED INTERIM FINANCIAL STATEMENTS 31 MARCH 2015") HSBC AMANAH MALAYSIA BERHAD (Company No. ) (Incorporated in Malaysia) UNAUDITED CONDENSED INTERIM FINANCIAL STATEMENTS 31 MARCH 2015 Domiciled in Malaysia. Registered Office : 2, Leboh Ampang, 50100 Kuala
HSBC AMANAH MALAYSIA BERHAD (Company No. ) (Incorporated in Malaysia) UNAUDITED CONDENSED INTERIM FINANCIAL STATEMENTS 31 MARCH 2015 Domiciled in Malaysia. Registered Office : 2, Leboh Ampang, 50100 Kuala