February Full Year Results Presentation
|
|
|
- Garey Gregory
- 6 years ago
- Views:
Transcription

1 2016 Full Year Results Presentation February
2 2016 Full Year Highlights Record statutory profit before tax $141.4m, up 17% Record net profit after tax $105.5m, up 21% Record statutory (basic) EPS of 55.4 cents, up 16% Record full year dividend of 35 cents, up 9% Record results from core Car Retailing segment Significantly improved result from Truck Retailing segment Solid contribution from acquisitions Gains from sale of property & investments Strong balance sheet 2

3 National Vehicle Sales 3 3

4 Australian New Vehicle Sales 2016 New vehicle market up 2.0% YoY 2 nd record year in a row WA down 5.6%; QLD down 1.1% NSW up 4.4%; SA up 3.9%; VIC up 3.4% Continued strong growth in luxury brands Some imbalance between supply and demand 4
5 Volume and Luxury Brand Market Share 2016 Volume Brands Market Share Luxury Vehicles Market Share* * Luxury is defined as luxury vehicle selling more than 500 units annually (V Facts) 5 5
 6")
6 Volume and Luxury Brand Market Share 2015 Volume Brands Market Share Luxury Vehicles Market Share* * Luxury is defined as luxury vehicle selling more than 500 units annually (V Facts) 6 6
7 Vehicle Sales By Fuel Type Electric vehicle sales down 80% YoY (excl. Tesla). Traditional fuels still make up ~99% of new vehicle sales New Vehicle Sales by Fuel Type (2016 v 2015) -0.7% % % % -80.2% % Electric Hybrid LPG Petrol Diesel Heavy Commercial 7 7
8 Exchange Rate Impact 83% of cars sold in Australia are imported from Japan, Thailand, Korea and EU Countries Manufacturers have long planning horizons and diversified exposures Product and production planning based on 3-7 year cycles Most manufacturers pursuing global common vehicle platform strategies Generally large product runs based on supply of a common product to multiple markets Manufacturer distribution margins (average between 7-10%) can wear some of the adjustment Product specification can and does adjust to maintain price point Australian market relatively accessible and marketing is cost effective, but highly competitive Vehicle prices remain consistent with recent years 8 8

9 Exchange Rates 9
10 Affordability 10
")


11 APE Vehicle Sales 2016 (1) Auction sales of 5,739 units excluded from total (2015: 5,748) 11
12 2016 Full Year Highlights - Financial Record statutory (basic) EPS of 55.4 cents, up 16% Record fully franked final dividend of 22 cents, up 10% EBITDA increased to $179.8m, up 10% Underlying (1) net profit before tax increased to $137.5 million, up 9% Cash flow from operations increased to $110.7m, up 31% Continued financial strength and flexibility: - EBITDA/Interest cover 7.4 times (2016) - EBITDA/Interest cover 7.6 times (2015) (1) Underlying adjustments include Business acquisition costs $1.8 million (include taxes, legal and other costs associated with business acquisitions) and benefit from tax refunds associated with previous years GST payments $4.4 million. 12
13 Financial Summary $ Million Change Revenue 3, ,246.4 Up 18% EBITDA Up 10% EBIT Up 17% PBT Up 17% PAT Up 21% Cash from operating activities Up 31% NTA/share Down -17% Net gearing excluding bailment debt 25.8% 19.6% Up 32% 13
14 Balance Sheet - Summary New vehicle inventory funded by bailment debt. Parts and most used vehicle inventory is balance sheet funded. AHG, Smart Group and Cox Automotive Australia investments valued at $275.1m. Substantial property portfolio underwrites the company s financial position. NTA decreased by 17% to $2.44 per share due to intangibles acquired as part of 2016 business acquisitions and lower value of AHG investment (2016: $3.95/share v 2015: $4.52/share) ($M) CA - CL (excl. held for sale) Freehold Property (incl. held for sale) Other Non Current Tangible Assets 68.4 Investments Intangible Assets Non Current Debt (283.7) Other N/C Liabilities (Deferred tax, and provisions) (36.2) Net Assets
15 Asset Fair Value Adjustments (before tax) 2016 ($M) 2015 ($M) Balance Sheet - Freehold Property Investments Profit or Loss - Investments Freehold Property (2.1) - Intangible Assets - (5.5) Total
16 Earnings Per Share EPS Bridge Cents NPAT Operational Result AHG Investment (net of interest) Profit on Sale Property / Investments MTAI, Impairment, Other Income, InterestExp. Dilution (EIP) 2016 NPAT 16
17 Financial Summary - Cashflow Cash Flow Bridge $ Milion

18 Financial Trends Underlying PBT * Operating Earnings is EBITDA Underlying excluding profit/loss on sale of assets and from associates. It includes AHG dividend. ** PBT Underlying excludes business acquisition costs, GST tax refunds and fair value adjustments relating to freehold property assets, goodwill and investments 18
19 Financial Trends * Operating Earnings is EBITDA Underlying excluding profit/loss on sale of assets and from associates. It includes AHG dividend (from 2012). 19

20 Financial Trends 20

21 Financial Trends 21
22 Segment Results Car retailing Record car retail volumes in NSW with positive contributions from acquisitions. Strong trading in service business. Truck retailing Strong profit performance from truck business despite continued challenging new and used heavy truck trading conditions. Significantly improved results in used and service divisions. Property Cash from property sales received $50.1m. 5 properties added to portfolio in Investment Dividend income of $14.4m and unrealised loss of $37.8m on revaluation of AHG investment. 22
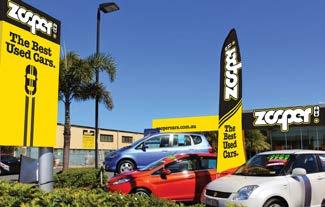
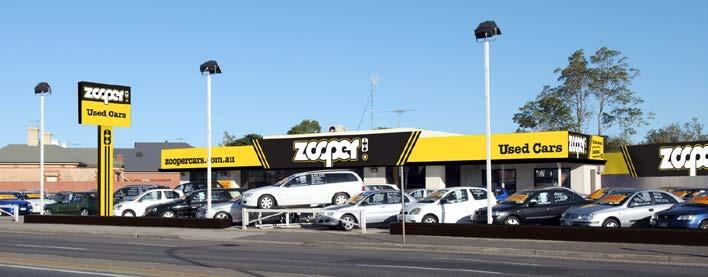
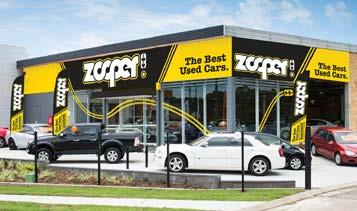
23 Segment Results Car Retailing Record results with profit contribution up 6.8% on prior year Record results for South Australia and Newcastle dealership operations Increased asset base reflects acquisitions across the year and hence only partial profit contribution 2016 ($M) 2015 ($M) Revenue 3, ,884.7 Segment Profit before Tax Total Assets 1, Total Liabilities Net Assets PBT/Revenue 3.0% 3.4% RONA (after tax) 18.3% 26.9% 16 23
24 Segment Results Truck Retailing Segment represents 9.5% of revenue and 2.9% of net assets Strong profit performance from truck business despite continued challenging new and used heavy truck trading conditions. Significantly improved results in used and service divisions ($M) 2015 ($M) Revenue Segment Profit before Tax 6.3 (3.3) Total Assets Total Liabilities Net Assets PBT/Revenue 1.7% (0.9%) RONA (after tax) 19.7% (13.8%) 16 24
25 Segment Results Property Settlement of Fortitude Valley and Woolloongabba properties Revaluation gain of $12.1m, including $1.2m through the statement of profit or loss Acquired 5 new properties in 2016 including three dealership sites for the Mercedes-Benz business in Victoria 2016 ($M) 2015 ($M) Revenue Segment Profit before Tax Revaluation surplus/deficit before tax Total Assets Total Liabilities Net Assets RONA Trading (after tax) 8.6% 4.9% RONA incl revaluations (after tax) 19.6% 6.1% 16 25
26 Segment Results Investments Substantial asset balance providing stable returns Profit before tax excludes unrealised revaluation loss on investments Realised further profits on sale of SIQ shares in ($M) 2015 ($M) Revenue Segment Profit before Tax Revaluation surplus/deficit before tax (38.8) 46.2 Total Assets Total Liabilities Net Assets RONA Trading (after tax) 6.3% 5.3% RONA incl revaluations (after tax) (11.4%) 26.5% 16 26
27 AHG Investment 66,320,000 shares held at 31/12/16 (19.99%) Investment valued at $261.9m at $3.95 (31/12/16) An unrealised revaluation loss of $37.8m within investment segment Share price (31/12/15) $4.52, (31/12/16) $3.95 5,415,650 new shares acquired in $4.52 (avg), costing $24.5m Subsequent to 31/12/16, additional 9,349,235 new shares $3.90 (avg) costing $36.4m. 75,669,235 shares held at 10/02/17 (22.82%) Fully Franked after tax dividends - Mar-16 $5.78m (2015 $5.48m) - Oct-16 $8.54m (2015 $7.92m) - Oct-16 $0.62m (2015 $Nil) (1) (1) Attributable to additional shares purchased in

28 Cox Automotive Australia Investment - $10.0M Completed Structure of the Combined Business NOTE: The "UNDER CONSIDERATION" arrangements depicted above will not form part of the combined business on completion of the Scheme of Arrangement. Cox Automotive may consider making them available to the combined business in future, but there is no obligation on Cox Automotive to make them available within any timeframe, or at all. Accordingly there is no guarantee that those businesses will ever form part of the combined business. 28


 *Source: https://au.")
29 WHY USED CARS? NEW CAR MARKET USED CAR MARKET Leading US Automotive Retailers Carmax Penske Autonation Market Cap.* 12.5Bn (21x) 4.4Bn (13x) 4.8Bn (12x) *Source: as at 20/02/


30 THEORY & RATIONALE Customers Perceptions of the Used Car Buying Experience. Dealers do not have my best interests at heart. Commission based it s only about the sale Try to upsell Don t care about what I need Don t tell the whole truth 30


31 USED CAR PORTFOLIO STRATEGY: ZOOPER + CARZOOS TO MEET EACH CONSUMER NEED 31


32 ZOOPER! USED CARS 32


33 GLOBAL TREND: AUTOMOTIVE RETAIL IN SHOPPING MALLS 33


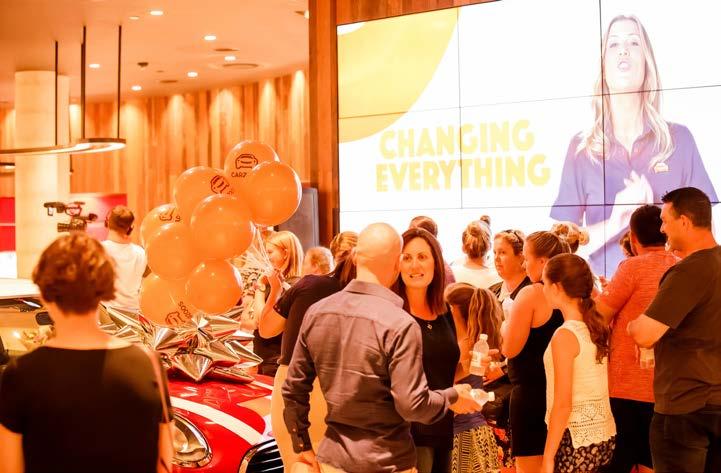
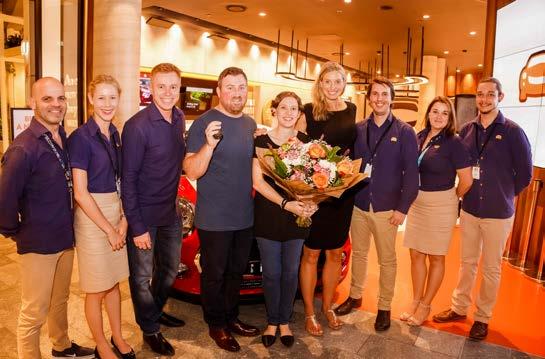

34 CARZOOS 34


35 LEARNINGS TO DATE: Carzoos Retail Store Adoption* *Retail store walk-ins only. Excludes inventory driven appointments 35


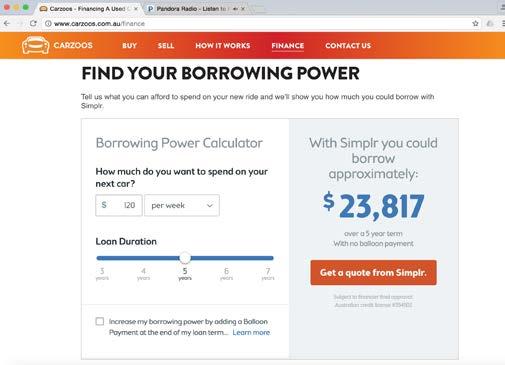
36 Simplr. Finance 36
37 2017 Focus Continued development of Used Car Strategy Zooper and Carzoos, supported by Simplr Further EPS growth for Birrells, Crampton and Tony Ireland group acquisitions Renewed focus on all business processes to deliver optimal operating cost Implement already prepared scenario plans should ASIC announce regulatory rule changes on Finance & Insurance (18 month lead time expected) Carefully selected earnings accretive dealership and ancillary market acquisitions 37
38 Disclaimer The information in this document (information) does not contain all information necessary for investment decisions, is not intended to be an offer, invitation or recommendation with respect to shares, is not financial product advice, and is intended to be general background information on A.P. Eagers Limited (APE). Investors should consult with their own professional advisers. No representation or warranty is made as to the accuracy, adequacy, reliability or completeness of the information. This document does is not, and should not be relied upon as, a promise, representation, warranty or guarantee as to the future performance of APE. This document may contain forward-looking statements, forecasts and estimates (forward-looking statements), including anticipated future performance of APE and the market in which it operates. Forward-looking statements are based on certain key expectations and assumptions of known and unknown risks, uncertainties and other factors, which are deemed reasonable when made but may or may not prove correct. Actual events are difficult to predict and may depend upon factors beyond APE s control. Therefore, actual results may turn out to be materially different from any future results, performance or achievements express or implied by the forward-looking statements. Forward-looking statements only speak as of the date of this document and no representations are made as to the accuracy or fairness of such forward-looking statements. APE disclaims any obligation to update any forward-looking statements, to reflect any change in APE s expectations with regard thereto, or any change in events, conditions or circumstances on which the statements are based. 38
39 Appendix 39
40 A.P. Eagers COMPANY PROFILE 40
41 AP Eagers Today (December 2016) 104 year old automotive retail group founded in years as a listed public company dividend paid every year A.P. Eagers owns $299m of prime real estate Represents all 20 of the top 20 selling vehicle brands in Australia and 33 car brands in total along with 14 truck / bus brands 4,490 employees 140+ dealership locations in QLD, NT, NSW, VIC, TAS and SA 19.9% ownership of Automotive Holdings Group ($262.0m*) 25.8% ownership of DealerMotive ($10.0m) * As at 31 December


42 AP Eagers Volume Car Brands Represents 10 of the top 10 selling volume car brands in Australia 42


43 AP Eagers Luxury* Car Brands Represents 10 of the top 11 selling luxury car brands in Australia * Luxury is defined as a luxury vehicle selling more than 500 units annually (per VFACTS) * Maserati sold 483 units in 2016 (2015: 519 units) 43


44 AP Eagers Truck and Bus Brands Representing 14 truck and bus brands 44
 $1.81bn (47%) $0.0bn $0.64bn (17%) $0.75bn (20%) $0.33bn (9%) $0.")
45 Revenue by State / % of group Revenue AP Eagers $3.83 billion revenue $0.15bn (4%) $1.81bn (47%) $0.0bn $0.64bn (17%) $0.75bn (20%) $0.33bn (9%) $0.16bn (4%) 45
46 Income Opportunity Franchised Dealership NEW CAR SALES: + Accessories + Finance + Insurance + Car Care + Trade-In USED CAR SALES: + Accessories + Finance + Insurance + Car Care + Trade-In VEHICLE SERVICE: - Value add products i.e. Tyres, wheel alignments, batteries, wiper blades. VEHICLE REPAIR: - Warranty (Manufacturer pays) and Non Warranty (Customer pays) - Internal reconditioning of Used Cars PARTS SALES: - Internal (Service, warranty repair, non-warranty repair, accessories) - External (Retail dealership direct to customer) - External (Wholesale / Trade large distribution centres deliver to customers) - Hard parts (Panel) + Mechanical parts TARGET BASED INCENTIVES: - Volume, Market Share, Franchise Standards, Customer Satisfaction 46
2018 Half Year Results Presentation. August 2018
 2018 Half Year Results Presentation August 2018 2018 Half Year Highlights Record statutory profit before tax $69.5m, up 2.1% on 1H17 Record net profit after tax $53.7m, up 8.8% on 1H17 Record statutory
2017 Half Year Results Presentation. August 2017
 2017 Half Year Results Presentation August 2017 2017 Half Year Highlights Record statutory profit before tax $68.1m, up 0.3% on 1H16 Record net profit after tax $49.3m, up 0.4% on 1H16 Statutory (basic)
A.P. Eagers 2011 Full Year Results Presentation
 A.P. Eagers 2011 Full Year Results Presentation March 2012 2011 Full Year Highlights EPS accretive acquisitions improve group earnings by 15% - 16 cents/share Further improvement in like for like results.
A.P. Eagers. Broker Briefing 19 April 2011
 A.P. Eagers Broker Briefing 19 April 2011 A.P. Eagers 98 year old automotive retail group founded in 1913 53 years as a listed public company dividend paid every year Post acquisition A.P. Eagers will
21 February Company Announcements Office ASX Limited. Full Year Accounts. Down 4.1% Up 2.3% Down 7.0% Down 9.2% Up 2.3% Up 2.
 21 February 2018 Company Announcements Office ASX Limited Full Year Accounts Statutory Profit Before Tax of $135.6 million (2016: $141.4 million) Record underlying Profit Before Tax of $140.8 million (2016:
For personal use only. FY2017 H1 Results February 2017
 For personal use only FY2017 H1 Results February 2017 The half year in review Broader automotive market supported by record new vehicle sales in Australia and New Zealand Strong Automotive earnings growth
For personal use only
 25 March 2015 Company Announcements Office ASX Limited Full Year Accounts Attached are the following documents for the year ended 31 December 2014: 1. Directors Report 2. Auditor s Declaration of Independence
FY2017 Full Year Results August 2017
 FY2017 Full Year Results August 2017 Repositioning Automotive in a challenging market Market conditions in FY2017 Lower margins in finance Weak WA market conditions but growth in market share Tighter consumer
It is pleasing that the performance of our dealerships in New Zealand and the eastern states of Australia was strong, he said.
 Automotive Holdings Group Limited 21 Old Aberdeen Place West Perth WA 6005 www.ahgir.com.au ABN 35 111 470 038 ASX / MEDIA STATEMENT 25 August 2017 AHG FULL YEAR RESULTS Record Group revenue of $6.08 billion
MOTORCYCLE HOLDINGS. Interim Financial Results December MotorCycle Holdings
 MOTORCYCLE HOLDINGS Interim Financial Results December 2017 Disclaimer Disclaimer and Important Information This presentation may contain certain unaudited financial information in relation to Limited
A N N U A L R E P O R T
 ANNUAL REPORT 5 YEAR FINANCIAL SUMMARY Year ended 31 December OPERATING RESULTS REVENUE 4,058,779 3,833,222 3,246,376 2,858,113 2,672,813 EBITDA 176,668 179,776 163,077 138,081 122,252 Depreciation and
Sigma Pharmaceuticals Limited
 Investor Relations Contact: Gary Woodford Corporate Affairs Manager Gary.Woodford@signet.com.au Phone: 03 9215 9632 Mobile: 0417 399 204 Mark Hooper CEO and Managing Director Gary Woodford Corporate Affairs
For personal use only
 ACN 072 507 147 ASX & MEDIA RELEASE 25 May 2017 THORN FY17 KEY NUMBERS UP, ISSUES BEING ADDRESSED Consumer leasing and business finance company, Thorn Group Limited (ASX: TGA), has lifted revenue, EBIT
INVESTOR PRESENTATION
 INVESTOR PRESENTATION DISCLOSURE 2 Forward-Looking Statements This presentation includes forward-looking statements within the meaning of the "Safe-Harbor" provisions of the Private Securities Litigation
MOTORCYCLE HOLDINGS LIMITED
 MOTORCYCLE HOLDINGS LIMITED FY2018 Full Year Results Disclaimer Disclaimer and Important Information This presentation may contain certain unaudited financial information in relation to Limited (MTO).
Chairman s Address Annual General Meeting Wednesday 25 May 2016
 Chairman s Address Annual General Meeting Wednesday 25 May 2016 Record Results As you would be aware, AP Eagers financial year end is December 31 and as previously reported, 2015 was another record year
For personal use only
 20 February 2012 APPENDIX 4D HALF YEAR REPORT & DECEMBER 2011 HALF YEAR RESULTS In accordance with ASX Listing Rules, the following documents are attached for release to the market: 2011 Half Year Results
For personal use only. FY2014 Half Year Results Presentation Period Ended 31 December 2013
 FY2014 Half Year Results Presentation Period Ended 31 December 2013 Company Overview Australia s largest automotive retailer by sales, profitability, market capitalisation and workforce 152 franchises
For personal use only
 APPENDIX 4E Cash Converters International Limited ABN: 39 069 141 546 Financial year ended 30 June 2015 RESULTS FOR ANNOUNCEMENT TO THE MARKET 30 June 2015 30 June 2014 Revenues from operations Up 13.0%
For personal use only 1H17 RESULTS PRESENTATION
 For personal use only 1H17 RESULTS PRESENTATION KEY PERFORMANCE METRICS FOR 1H17 OPERATIONAL FINANCIAL CAPITAL MANAGEMENT 1,408 settlements Up 10% $19.8m 1H17 operating profit after tax Up 7% 24.8% gearing
2011 Interim Results. Keith Gordon, Managing Director & Chief Executive Officer Stephen Gobby, Chief Financial Officer
 2011 Interim Results Keith Gordon, Managing Director & Chief Executive Officer Stephen Gobby, Chief Financial Officer Emeco 2011 Interim Results Overview Financials Strategy & Outlook Questions Appendices
ASX CEO CONNECT PRESENTATION. Viva Energy REIT ASX CEO Connect Presentation 29 March 2018
 ASX CEO CONNECT PRESENTATION Viva Energy REIT ASX CEO Connect Presentation 29 March 2018 AGENDA Highlights 4 Financial Results 7 Portfolio Update 11 Industry Update 18 Strategy & Outlook 20 Questions &
Autosports Group. Luxurious future A$2.55 AUSTRALIA. Prestige and luxury growing faster than the market. A focussed business. Not just a roll up
 AUSTRALIA ASG AU Price (at 04:59, 18 Jan 2017 GMT) Outperform A$2.55 Valuation - EV/EBITA A$ 2.34-2.55 12-month target A$ 2.83 12-month TSR % +14.7 Volatility Index Low/Medium GICS sector Retailing Market
ANZ/PROPERTY COUNCIL SURVEY CHART BOOK
 218 For further information please contact Property Council Research P 2 933 19 F 2 933 1978 E research@propertycouncil.com.au W www.propertycouncil.com.au ANZ/PROPERTY COUNCIL SURVEY CHART BOOK JUN QTR
For personal use only
 Affinity Education Group Full Year 2014 Results 27 February 2015 2014 Highlights FY 2014 Earnings Growth Underlying EBITDA of $17.9m (1) and underlying NPAT of $11.4m (1) Underlying EPS of 8.1 cents (1)
H1 FY15 Results Presentation
 H1 FY15 Results Presentation 10 February 2015 Andrew Grech Group Managing Director Wayne Brown CFO Ken Fowlie CEO Australia 1 Disclaimer This document has been prepared by Slater and Gordon Limited (Slater
MotorCycle Holdings (MTO) New HOLD: Harley still lacking traction. Key points. Risks and catalysts
 New HOLD: Harley still lacking traction. Key points. Risks and catalysts") Date Theme Company Update Company MotorCycle Holdings (MTO) New HOLD: Harley still lacking traction We moderate to HOLD (from Buy) with a revised target of $2.36 p/share. We were previously encouraged
Date Theme Company Update Company MotorCycle Holdings (MTO) New HOLD: Harley still lacking traction We moderate to HOLD (from Buy) with a revised target of $2.36 p/share. We were previously encouraged
Q2 11 COMPANY UPDATE
 Q2 11 COMPANY UPDATE DISCLOSURE 2 This presentation includes forward-looking statements within the meaning of the "Safe-Harbor" provisions of the Private Securities Litigation Reform Act of 1995, which
16.1c c c
 1 2016 Interim Result Highlights Successful delivery, ahead of PDS 2 Exceeded revised earnings guidance Six months to 31 Dec 15 Solid capital management 7.97c 7.65c $2.15 28.3% Earnings per unit Distribution
For personal use only
 ARB Corporation Limited Company Update May 2013 Presented by Roger Brown Chairman 1 ARB Introduction ARB was established as a private company in 1975 and listed on ASX in 1987. The Company designs, manufactures
2017 ANNUAL GENERAL MEETING. Chief Executive Officer Operational Presentation SILVER CHEF LIMITED
 2017 ANNUAL GENERAL MEETING Chief Executive Officer Operational Presentation SILVER CHEF LIMITED 1986 2005 2008 2011 2013 2016 Silver Chef established by Non-Executive Chairman Allan English Silver Chef
ANZ/PROPERTY COUNCIL SURVEY CHART BOOK
 218 For further information please contact Property Council Research P 2 933 19 F 2 933 1978 E research@propertycouncil.com.au W www.propertycouncil.com.au ANZ/PROPERTY COUNCIL SURVEY CHART BOOK SEP QTR
Marshall Motor Holdings plc 2017 Full year results presentation March 2018
 Marshall Motor Holdings plc 2017 Full year results presentation March 2018 INTRODUCTION 2 AGENDA Full year Highlights Financial Overview Operating and Strategic Review Current Trading and Outlook Summary
FY18 RESULTS PRESENTATION
 FY18 RESULTS PRESENTATION KEY PERFORMANCE METRICS FOR FY18 OPERATIONAL FINANCIAL CAPITAL MANAGEMENT STRATEGIC GROWTH 2,257 lots under contract with a value of $616m $49.1m FY18 operating profit after tax
PROSPECTUS. Initial Public Offering of Ordinary Shares.
 PROSPECTUS Initial Public Offering of Ordinary Shares. JOINT LEAD MANAGERS FINANCIAL ADVISOR Important Notices Offer This Prospectus is issued by Autosports Group Limited ACN 614 505 261 (Autosports Group,
ANALYST & INVESTOR PRESENTATION
 ANALYST & INVESTOR PRESENTATION Interim results for the 6 months ended 31 August 2017 11 October 2017 Strong results in challenging market Financial highlights Revenues of 1.45bn (2016 : 1.45bn) Group
Investor Presentation January Asbury Automotive Group All rights reserved.
 Investor Presentation January 2018 Forward Looking Statements and Non-GAAP Financial Information To the extent that statements in this presentation are not recitations of historical fact, such statements
AGM PRESENTATION ǀ NOVEMBER 2017 ǀ PAGE 1 ANNUAL GENERAL MEETING
 AGM PRESENTATION ǀ NOVEMBER 2017 ǀ PAGE 1 ANNUAL GENERAL MEETING NOVEMBER 2017 KEY PERFORMANCE METRICS FOR FY17 OPERATIONAL FINANCIAL CAPITAL MANAGEMENT STRATEGIC GROWTH 3,077 settlements Up 7% $44.8m
For personal use only
 BLUE SKY DIVERSIFIED QUANT FUND BLUE SKY DYNAMIC MACRO FUND Blue Sky Alternative Investments February 2016 Private Equity Private Real Estate Hedge Funds Real Assets Disclaimer This presentation has been
PSC INSURANCE GROUP LIMITED AND CONTROLLED ENTITIES ABN:
 PSC INSURANCE GROUP LIMITED AND CONTROLLED ENTITIES ABN: 81 147 812 164 HALF-YEAR INFORMATION FOR THE SIX MONTHS ENDED 31 DECEMBER 2017 PROVIDED TO THE ASX UNDER LISTING RULE 4.2A.3 This half-year financial
Interim FY 2015 results 6 months ended 31 December February 2015
 Interim FY 2015 results 31 December 2014 18 February 2015 Highlights Solid trading result for 1H FY2015; change in accounting policy for acquisition of healthcare practices First half result highlights
amagroupltd.com Page 1
 amagroupltd.com Page 1 WORLD CLASS AUTOMOTIVE SOLUTIONS Page 2 Page 3 Contents. Highlights AMA Group Overview Financial Performance Vehicle Panel Repairs ACAD and Procurement Strategy and Outlook HIGHLIGHTS
RESULTS ANNOUNCEMENT TO THE MARKET Full Year Financial Results [Based on accounts currently being audited]
![RESULTS ANNOUNCEMENT TO THE MARKET Full Year Financial Results [Based on accounts currently being audited]](/thumbs/84/89825982.jpg "RESULTS ANNOUNCEMENT TO THE MARKET Full Year Financial Results [Based on accounts currently being audited]") DWS Limited (and Controlled Entities) ACN 085 656 088 RESULTS ANNOUNCEMENT TO THE MARKET Full Year Financial Results [Based on accounts currently being audited] DWS Limited (DWS) announces the following
DWS Limited (and Controlled Entities) ACN 085 656 088 RESULTS ANNOUNCEMENT TO THE MARKET Full Year Financial Results [Based on accounts currently being audited] DWS Limited (DWS) announces the following
Penske Automotive Group, Inc. (PAG-NYSE)
") February 13, 2015 Penske Automotive Group, Inc. (PAG-NYSE) Current Recommendation Prior Recommendation Neutral Date of Last Change 07/16/2014 Current Price (02/12/15) $47.96 Target Price $58.00 SUMMARY
February 13, 2015 Penske Automotive Group, Inc. (PAG-NYSE) Current Recommendation Prior Recommendation Neutral Date of Last Change 07/16/2014 Current Price (02/12/15) $47.96 Target Price $58.00 SUMMARY
CONSOLIDATED FINANCIAL STATEMENT YEAR ENDED DECEMBER
 CONSOLIDATED FINANCIAL STATEMENT YEAR ENDED DECEMBER 31 2016 BOURBONOFFSHORE.COM SUMMARY 1. Financial position statement...3 2. Statement of comprehensive income... 4 3. Statement of consolidated cash-flows...
National Tyre & Wheel Limited Appendix 4D Half-year report for the period ended 31 December 2017
 National Tyre & Wheel Limited Appendix 4D Half-year report for the period ended 31 December 2017 1. Company details Name of entity: National Tyre & Wheel Limited and its controlled entities ABN: 97 095
For personal use only
 DWS Limited 2018 Full Year Results Presentation Contents Introduction Danny Wallis (CEO) / Stuart Whipp (CFO) Results Highlights Full Year Results Capital Management Operations Update Summary and Outlook
25 February The Manager Market Announcements Australian Securities Exchange Limited 20 Bridge Street SYDNEY NSW 2000.
 Level 1 157 Grenfell Street Adelaide SA 5000 GPO Box 2155 Adelaide SA 5001 Adelaide Brighton Ltd ACN 007 596 018 Telephone (08) 8223 8000 International +618 8223 8000 Facsimile (08) 8215 0030 www.adbri.com.au
For personal use only
 Mantra Group H1FY2015 Results Presentation 26 February 2015 Important notice and disclaimer Important notice and disclaimer This document is a presentation of general background information about the activities
BROKER PRESENTATION JUNE 2017
 PACIFIC ENERGY LIMITED ASX : PEA BROKER PRESENTATION JUNE 2017 Important Notice and Disclaimer This presentation has been prepared by (PEA) for information purposes only. This presentation is not a product
Ainsworth Game Technology Limited
 FY18 Annual Results Announcement Ainsworth Game Technology Limited www.agtslots.com Disclaimer IMPORTANT NOTICE This presentation has been prepared by Ainsworth Game Technology Limited ACN 068 516 665
For personal use only
 NATIONAL STORAGE REIT JP MORGAN AUSTRALIAN REIT FORUM ASIA MARCH 2017 IMPORTANT NOTE & DISCLAIMER This presentation has been prepared by National Storage REIT ( NSR ) comprising National and may involve
INVESTOR PRESENTATION SG FLEET GROUP LIMITED - FY2016 RESULTS
 INVESTOR PRESENTATION SG FLEET GROUP LIMITED - FY2016 RESULTS 16 August 2016 Important Notice and Disclaimer IMPORTANT INFORMATION The information in this presentation is general in nature and does not
For personal use only ACQUISITION OF BEST TRACTOR PARTS INVESTOR PRESENTATION
 ACQUISITION OF BEST TRACTOR PARTS INVESTOR PRESENTATION 27 August 2012 CLICK TO EDIT MASTER TITLE 2 2 2 IMPORTANT NOTICE AND DISCLAIMER This presentation and these materials (together the Presentation
Full Year Results to 31 January 2018 Announced 22 March 2018
 Sigma Healthcare Limited Full Year Results to 31 January 2018 Announced 22 March 2018 ASX Ticker: SIG Important Notice The material provided is a presentation of general information about Sigma s activities
2017 INVESTOR PRESENTATION SEPTEMBER 2017
 PACIFIC ENERGY LIMITED ASX : PEA 2017 INVESTOR PRESENTATION SEPTEMBER 2017 Important Notice and Disclaimer This presentation has been prepared by (PEA) for information purposes only. This presentation
Abacus Diversified Income Fund II
 Abacus Diversified Income Fund II DISCLOSURE OF INFORMATION The Australian Securities and Investments Commission (ASIC) has developed six benchmarks and eight disclosure principles for unlisted property
LLOYDS BANKING GROUP S AUSTRALIAN BUSINESSES
 ACQUISITION OF LLOYDS BANKING GROUP S AUSTRALIAN BUSINESSES 11 OCTOBER 2013 Gail Kelly Chief Executive Officer Philip Coffey Chief Financial Officer Westpac Banking Corporation ABN 33 007 457 141. A value
TAG PACIFIC HALF YEAR RESULT
 A S X A N N O U N C E M E N T TAG PACIFIC HALF YEAR RESULT Sydney 21 February 2012 Tag Pacific Limited (ASX: TAG) Group EBITDA $5.9 million Statutory NPAT $4.0 million, up $4.1 million on HY2010 Earnings
For personal use only. Beacon Lighting Group Limited RESULTS PRESENTATION F Y 20 14
 For personal use only Beacon Lighting Group Limited RESULTS PRESENTATION F Y 20 14 AGENDA 1. BACKGROUND 2. RESULTS OVERVIEW 3. TRADING PERFORMANCE 4. CASH FLOW, BALANCE SHEET, DIVIDEND 5. GROWTH STRATEGY
RESULTS ANNOUNCEMENT TO THE MARKET Full Year Financial Results [Based on accounts currently being audited]
![RESULTS ANNOUNCEMENT TO THE MARKET Full Year Financial Results [Based on accounts currently being audited]](/thumbs/84/89825998.jpg "RESULTS ANNOUNCEMENT TO THE MARKET Full Year Financial Results [Based on accounts currently being audited]") DWS Limited (and Controlled Entities) ACN 085 656 088 RESULTS ANNOUNCEMENT TO THE MARKET Full Year Financial Results [Based on accounts currently being audited] DWS Limited (DWS) announces the following
DWS Limited (and Controlled Entities) ACN 085 656 088 RESULTS ANNOUNCEMENT TO THE MARKET Full Year Financial Results [Based on accounts currently being audited] DWS Limited (DWS) announces the following
TURNERS AUTOMOTIVE GROUP LIMITED Results for announcement to the market
 Results for announcement to the market Reporting Period 12 months to 31 March 2018 Previous Reporting Period 12 months to 31 March 2017 Amount (NZD000s) Percentage change Revenue from ordinary activities
ASG Macquarie Conference Presentation. May 2018
 ASG Macquarie Conference Presentation May 2018 1 IMPORTANT NOTICE AND DISCLAIMER This presentation contains summary information about Autosports Group Limited (ACN 614 505 261) (ASG) and its activities
AGM Presentation November 2016
 AGM Presentation November 2016 At this time last year At last year s AGM, we were facing the following challenges: The bank had terminated our transactional banking and debt facilities as well as forcing
Sales increased 8.1% to $128.0m (HY17: $118.4m)
") Nick Scali Limited NCK.ASX HY18 Results Presentation 7th February 2018 Key Highlights Sales increased 8.1% to $128.0m (HY17: $118.4m) Sales Like for like sales growth of +2.6% for Nick Scali Furniture
Nick Scali Limited NCK.ASX HY18 Results Presentation 7th February 2018 Key Highlights Sales increased 8.1% to $128.0m (HY17: $118.4m) Sales Like for like sales growth of +2.6% for Nick Scali Furniture
Viva Energy REIT HY2017 Results 30 June August 2017
 Viva Energy REIT HY2017 Results 30 June 2017 17 August 2017 Disclaimer: This presentation has been prepared by Viva Energy REIT ( VVR or Viva Energy REIT ) which is a stapled entity comprising a share
Investor presentation
 FY17 INVESTOR PRESENTATION 1 18 August 2017 Investor presentation FY17 Agenda FY17 INVESTOR PRESENTATION 1. Overview & strategic landscape Melos Sulicich CEO & Managing Director 2. Financial results David
Agenda. 1. Results overview 2. Segmented results & key metrics 3. Balance sheet & capital management 4. Strategy & outlook
 Agenda 1. Results overview 2. Segmented results & key metrics 3. Balance sheet & capital management 4. Strategy & outlook 1. Results overview Mark Fitzgibbon Chief Executive Officer & Managing Director
For personal use only
 Appendix 4D Results for announcement to the market (ACN 104 113 760) This half-year report is provided to the Australian Securities Exchange (ASX) under ASX listing Rule 4.2A.3. Current reporting period:
A n n u a l G e n e r a l M e e t i n g C E O P r e s e n t a t i o n
 2 0 1 6 A n n u a l G e n e r a l M e e t i n g C E O P r e s e n t a t i o n Our Brands 2 Disclaimer The material in this presentation has been prepared by Bapcor Limited ( Bapcor ) ABN 80 153 199 912
A. P. EAGERS LIMITED ABN March ASX Market Announcements Australian Securities Exchange. Full Year Accounts
 27 March 2012 ASX Market Announcements Australian Securities Exchange Full Year Accounts Attached are the following documents for the year ended 31 December 2011: 1. Directors Report 2. Auditor s Declaration
ANZ Convertible Preference Shares (CPS) Australia and New Zealand Banking Group Limited August 2008
 Australia and New Zealand Banking Group Limited August 2008") ANZ Convertible Preference Shares (CPS) Australia and New Zealand Banking Group Limited August 2008 1 Disclaimer Australia and New Zealand Banking Group Limited (ABN 11 005 357 522) ("ANZ") is the proposed
ANZ Convertible Preference Shares (CPS) Australia and New Zealand Banking Group Limited August 2008 1 Disclaimer Australia and New Zealand Banking Group Limited (ABN 11 005 357 522) ("ANZ") is the proposed
Sales increased 8.1% to $128.0m (HY17: $118.4m) Increase assisted by sales from new stores opened in FY17 and HY18
 Increase assisted by sales from new stores opened in FY17 and HY18") Nick Scali Limited NCK.ASX Macquarie Conference 2nd May 2018 Key H1-18 Highlights Sales Sales increased 8.1% to $128.0m (HY17: $118.4m) Increase assisted by sales from new stores opened in FY17 and HY18
Nick Scali Limited NCK.ASX Macquarie Conference 2nd May 2018 Key H1-18 Highlights Sales Sales increased 8.1% to $128.0m (HY17: $118.4m) Increase assisted by sales from new stores opened in FY17 and HY18
2018 half year results investor presentation
 2018 half year results investor presentation 26 Feb 2018 Important notice and disclaimer This presentation includes information about the activities of amaysim Australia Limited ( amaysim ) which is current
FY2018 Full Year Results August 2018
 FY2018 Full Year Results August 2018 Disclaimer This presentation contains forward looking statements that are subject to risk factors associated with automotive retail and logistics businesses. The Company
FY17 Results Presentation. Chris Sutherland, Managing Director 24 May 2017
 FY17 Results Presentation Chris Sutherland, Managing Director 24 May 2017 Important notice and disclaimer The information contained in this presentation is for information purposes only and does not constitute
For personal use only
 MMS Group 18 October 2016 Presenters Mike Salisbury, CEO Mark Blackburn, CFO McMillanShakespeareGroup Overview Record FY16 profit result with strong free cash flow Segment revenue of $503.2m, +29.9% EBITDA
For personal use only
 31 July 2015 The Manager Listings ASX Market Announcements Australian Securities Exchange Level 4 Exchange Centre 20 Bridge Street Sydney NSW 2000 Via e-lodgement Tassal completes De Costi Seafoods Acquisition
Bank of Queensland Full year results 31 August Bank of Queensland Limited ABN AFSL No
 Bank of Queensland Full year results 31 August 2013 Bank of Queensland Limited ABN 32 009 656 740. AFSL No 244616. Agenda Result overview Stuart Grimshaw Managing Director and CEO Financial detail Anthony
ASX Small Cap Conference Hong Kong
 ASX Small Cap Conference Hong Kong 21 st October 2010 John DeLano Chief Executive Officer and Managing Director Not for distribution or release in the United States or to U.S. persons 1 Disclaimer Important
(RBD) INVESTOR PRESENTATION
 INVESTOR PRESENTATION") RESTAURANT BRANDS NEW ZEALAND LIMITED (RBD) INVESTOR PRESENTATION MAY 2018 RUSSEL CREEDY GROUP CHIEF EXECUTIVE OFFICER GRANT ELLIS GROUP CHIEF FINANCIAL OFFICER 1 OUTLINE Restaurant Brands 101 FY18 Results
RESTAURANT BRANDS NEW ZEALAND LIMITED (RBD) INVESTOR PRESENTATION MAY 2018 RUSSEL CREEDY GROUP CHIEF EXECUTIVE OFFICER GRANT ELLIS GROUP CHIEF FINANCIAL OFFICER 1 OUTLINE Restaurant Brands 101 FY18 Results
For personal use only
 Sietel LIMITED ACN 004 217 734 Incorporated in Victoria 24 November 2016 Company Announcements Office Australian Securities Exchange Limited 20 Bridge Street SYDNEY NSW 2000 Dear Sirs, Announcement to
INVESTOR PRESENTATION
 INVESTOR PRESENTATION 1 LITHIA MOTORS APRIL 2016 DISCLOSURE Forward-Looking Statements This presentation includes forward-looking statements within the meaning of the "Safe-Harbor" provisions of the Private
Q4'15 COMPANY UPDATE
 Q4'15 COMPANY UPDATE 1 LITHIA MOTORS FEBRUARY 2016 DISCLOSURE Forward-Looking Statements This presentation includes forward-looking statements within the meaning of the "Safe-Harbor" provisions of the
CONSOLIDATED FINANCIAL STATEMENT YEAR ENDED DECEMBER
 CONSOLIDATED FINANCIAL STATEMENT YEAR ENDED DECEMBER 31 2017 BOURBONOFFSHORE.COM SUMMARY 1. Financial position statement...3 2. Statement of comprehensive income... 4 3. Statement of consolidated cash-flows...
Private vehicle expenses 2018 The costs of owning a car
 Private vehicle expenses 2018 The costs of owning a car Introduction This Schedule is a guide to the average cost of owning and operating vehicles for private purposes. It is based on typical vehicles
Financial results. Full year ended 30 June Nick Hawkins Chief Financial Officer. Peter Harmer Managing Director and Chief Executive Officer
 Financial results Full year ended 30 June 2017 Peter Harmer Managing Director and Chief Executive Officer Nick Hawkins Chief Financial Officer 23 August 2017 Overview Peter Harmer Managing Director and
A. P. EAGERS LIMITED. 27 March Company Announcements Office ASX Limited. Full Year Accounts
 27 March 2009 Company Announcements Office ASX Limited Full Year Accounts I attach the following documents for the year ended 31 December 2008: 1. Directors Report 2. Auditor s Declaration of Independence
FY2015 Annual Results August Brett McKeon - CEO David Bailey - CFO
 FY2015 Annual Results August 27 2015 Brett McKeon - CEO David Bailey - CFO FY2015 Financial Results Highlights Delivery on FY15 Prospectus forecasts Pro forma NPAT $19.3 million up 8.4% against IPO forecast
Big River Industries Limited (ASX:BRI)
") Big River Industries Limited (ASX:BRI) FY2018 Half Year Results Briefing 27 February 2018 Optus Stadium - Perth H1 FY2018 - Contents 1. Highlights 2. Business Diversity Strengthening 3. Sales Highlights
Big River Industries Limited (ASX:BRI) FY2018 Half Year Results Briefing 27 February 2018 Optus Stadium - Perth H1 FY2018 - Contents 1. Highlights 2. Business Diversity Strengthening 3. Sales Highlights
For personal use only
 Market Office Announcement ASX Limited Date: 9 November 2018 THINK CHILDCARE LIMITED ( TNK ) ACQUIRES 5 CHILDCARE CENTRES AND REDUCES YEAR ON YEAR OCCUPANCY GAP TO 0.5% TNK has contracted to acquire five
COLLINS FOODS LIMITED
 COLLINS FOODS LIMITED FULL YEAR RESULTS 26 June 2017 ACN 151 420 781 : strong growth across key financial metrics $m FY16 Underlying [1] Statutory Significant Items [2] Underlying Change vs FY16 Underlying
FY2013 Results Presentation By Chris Sutherland, Managing Director 29 May 2013
 FY2013 Results Presentation By Chris Sutherland, Managing Director 29 May 2013 Important notice and disclaimer The information contained in this presentation is for information purposes p only and does
Insurance Brokers SECTOR REPORT. Solid Hold. -4% Jun-12. Dec-12. Mar-13. Sep-13. Sep-12. Jun-13. Source: APRA, Baillieu Holst estimates
 11 May 2018 RECOMMENDATIONS AUB Group (AUB) Rating HOLD Risk Low Price Target $14.50 Share Price $14.17 Steadfast Group (SDF) Rating HOLD Risk Low Price Target $2.80 Share Price $2.88 RESEARCH ANALYST
Qube Holdings Limited
 Qube Holdings Limited Investor Presentation FY 18 Interim Results 1 Disclaimer Important Notice ABN 141 497 230 53 The information contained in this Presentation or subsequently provided to the recipient
Financial Data Report ROGERS AND COMPANY LIMITED (THE GROUP) for the period ending 31.Dec.2015
 for the period ending 31.Dec.2015") Financial Data Report (THE GROUP) for the period ending 31.Dec.2015 INVESTMENT Equity Statistics Particulars Units 31-Mar-16 Current Market Price MUR 27.75 52 week H/L* MUR 32.50 / 26.90 Market Capitalisation
Financial Data Report (THE GROUP) for the period ending 31.Dec.2015 INVESTMENT Equity Statistics Particulars Units 31-Mar-16 Current Market Price MUR 27.75 52 week H/L* MUR 32.50 / 26.90 Market Capitalisation
Multiplex Acumen Property Fund
 Multiplex Acumen Property Fund 2008 Consolidated Full Year Results 28 August 2008 1 Important Notices Whilst every effort is made to provide accurate and complete information, this presentation has been
For personal use only. F Y R e s u l t s P r e s e n t a t i o n
 F Y 2 0 1 6 R e s u l t s P r e s e n t a t i o n Our Brands 2 Disclaimer The material in this presentation has been prepared by Bapcor Limited ( Bapcor ) ABN 80 153 199 912 and is general background information
For personal use only
 Aspen Group 2016 Full Year Results Presentation 30 August 2016 1 AGENDA 1 2 3 4 Business overview Financial highlights Strategy / business update FY17 focus Appendices 2 1 BUSINESS OVERVIEW Aspen continues
17 April Genex Power s Kidston Solar Farm, Queensland, UGL. Refer to ASX/Media Release for further information
 ANALYST AND INVESTOR PRESENTATION 1Q RESULTS 2018 Marcelino Fernández Verdes, Executive Chairman Michael Wright, Chief Executive Officer Stefan Camphausen, Chief Financial Officer Genex Power s Kidston