A.P. Eagers. Broker Briefing 19 April 2011
|
|
|
- Matthew Higgins
- 5 years ago
- Views:
Transcription
1 A.P. Eagers Broker Briefing 19 April 2011
2 A.P. Eagers 98 year old automotive retail group founded in years as a listed public company dividend paid every year Post acquisition A.P. Eagers will own more than 70 acres of prime real estate with land and buildings of $321m Represents all 12 of the top 12 selling vehicle brands in Australia and 31 car brands in total along with 12 truck / bus brands 97 dealership locations in Qld, NT, NSW, Vic and SA 2,900 employees


3 A.P. Eagers Volume Car Brands Represents 12 of the top 12 selling volume car brands in Australia


4 A.P. Eagers Luxury Car Brands Represents 8 of the top 9 selling luxury car brands in Australia


5 A.P. Eagers Truck and Bus Brands Representing 12 truck and bus brands
6 A.P. Eagers / Adtrans Post Merger ADG APE Combined Annually: Annually: Annually: Total Cars Sold 16,000 49,000 65,000 New Cars Sold 6,500 32,000 38,500 Used Cars Sold 7,500 17,000 24,500 New / Used Trucks 2, ,200 Retail Finance Contracts $126m $300m $426m Vehicle Servicing $32m $121m $153m Parts Sales $90m $240m $330m Annual Turnover $2.4 Billion Representing only 3.7% of Franchised Retail Industry based on VFACTS 2010
7 Operational Highlights for 2010 Substantial earnings accretive growth utilising only limited new equity (6% of capital). Caloundra City Auto Qld April 2010 Adtrans Group SA (Cars), Vic & NSW (Trucks) October 2010 Sydney Truck Centre NSW (Western Star/MAN) October 2010 Eblens Subaru March 2011 Geographical Spread Change (based on turnover) 2010* Qld 65% 45% Cars 100% 88% NSW/ACT 27% 24% Trucks 0% 12% NT 9% 6% VIC/TAS 0% 6% SA 0% 19% Based on APE $1.7bn / ADG $0.7bn Plus Eblens $0.05bn Total $2.45bn WA 0% 0% * 2010 % s do not include Adtrans
 20.1% AP Eagers $0.45 BN Adtrans $0.12 BN (24%) 30.6% Adtrans $0.15 BN (6%) $0.0 BN AP Eagers $1.7 billion Adtrans $0.7 billion Eblens (SA) $0.05billion Total $2.45 billion ACT 1.")
8 AP Eagers / Adtrans $0.0 BN 11.3% AP Eagers $0.15 BN (6%) 1.0% Adtrans/Eblens $0.48 BN (19%) Shaded % s = New motor vehicles sales market share Dec YTD % VIC 27.2% AP Eagers $1.10 BN (45%) 20.1% AP Eagers $0.45 BN Adtrans $0.12 BN (24%) 30.6% Adtrans $0.15 BN (6%) $0.0 BN AP Eagers $1.7 billion Adtrans $0.7 billion Eblens (SA) $0.05billion Total $2.45 billion ACT 1.6% TAS 1.9%
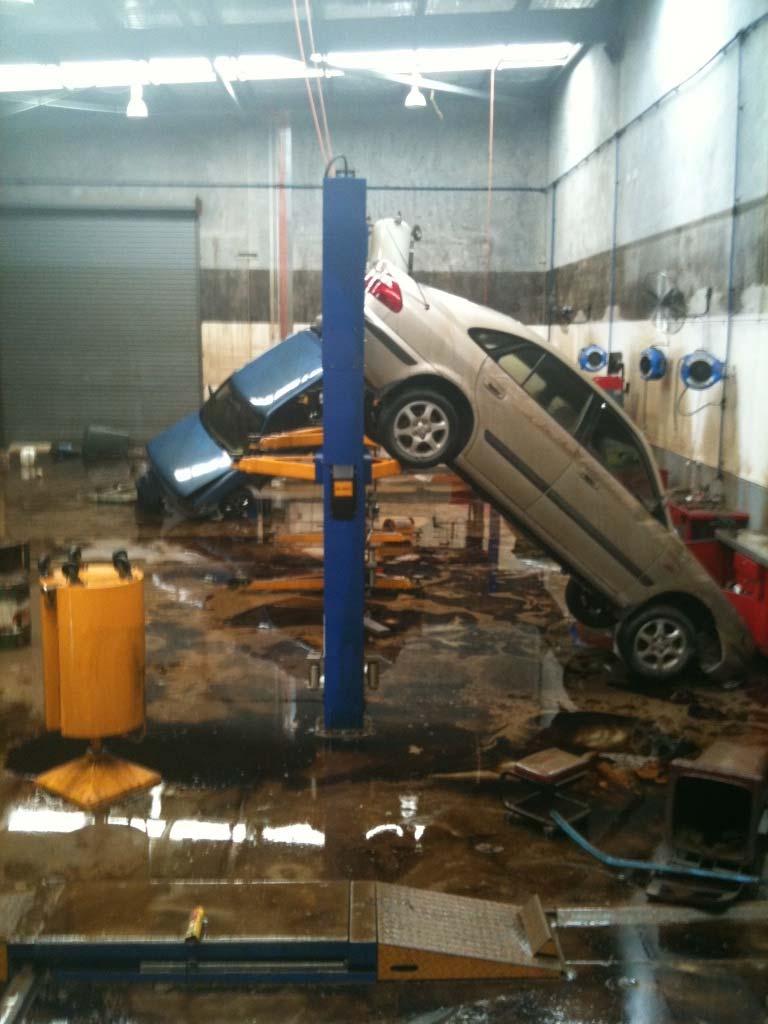
9 Queensland Floods
10 Queensland Floods/Cyclone Damage and disruption to riverside operations Physical damage and business interruption covered by insurance AP Eagers donated flood relief support vehicles to charities and the Reconstruction Authority (Gov.) Qld vehicle sales bounced back in March but still trailing the nation YTD Impact after insurance recovery neutral
11 Japanese Earthquake Issues Car manufacturing plants mostly okay Parts supply disrupted Some power constraints Lack of certainty on parts supply resolutions
12 Japanese Earthquake Impact 40% of imported vehicles come from Japan Greater than 50% of vehicle sales in Australia are Japanese brands We are being informed that supply of Japanese product could be impacted by up to 50% over a three to six month period All Japanese brands are affected Product and time frames vary due to circumstances At April 19 th, AP Eagers expects ups and downs by month, but a neutral affect on calendar year 2011 results
13 Profitability and New Vehicle Stock Availability Jan June (1 st Half) Industry Profitability Jan June (1 st Half) Industry Vehicle Stock June Dec (2 nd Half) Industry Profitability June Dec (2 nd Half) Industry Vehicle Stock V. Good & Increasing Lots, but manageable V. Good & Increasing Lots, but manageable Stable Recovering Solid, still Stimulus driven Lots and increasing, alarming levels by June Disastrous Lots, slowly decreasing at the expense of profit Decreasing fast, some short supply by June Utopia, Stimulus driven Very limited stock industry-wide, freeing up by year end Correct stock levels, but creeping upwards by June Solid, Stimulus over Relatively high stock for some Mfr s reducing to normal by year end. Forecast, Solid Forecast, correct stock levels. When vehicle stock is in line with natural demand then the industry structure produces a good return on invested capital.
14 Financial Highlights (Full Year 2010 vs 2009) 1. Solid margins, in a more cautious retail market» NPBT/Sales 2.6% vs 3.0%.» EBITDA/Sales 4.0% vs 4.6%. but compare well with history and industry. 2. Substantial earnings accretive growth achieved with limited new equity issued (6% of capital). Caloundra City Auto - QLD Adtrans Group - S.A (Cars), Vic & NSW (Trucks) Sydney Truck Centre (Western Star/MAN) - NSW
15 Group Financial Results Underlying Trading Performance Margins reduced from record levels due to a return to a more normal level of vehicle inventory, a generally more cautious retail customer environment, and weakness in the S.E. Queensland market. Underlying Trading Performance FY 2010 $m Change Revenue 1,811 +9% EBITDA % EBIT % NPBT % NPAT % EBITDA/Sales 4.0% -13% EBIT/Sales 3.8% -12% NPBT/Sales 2.6% - 13%


16 Ongoing margin improvement trend - albeit below record 2009 levels.

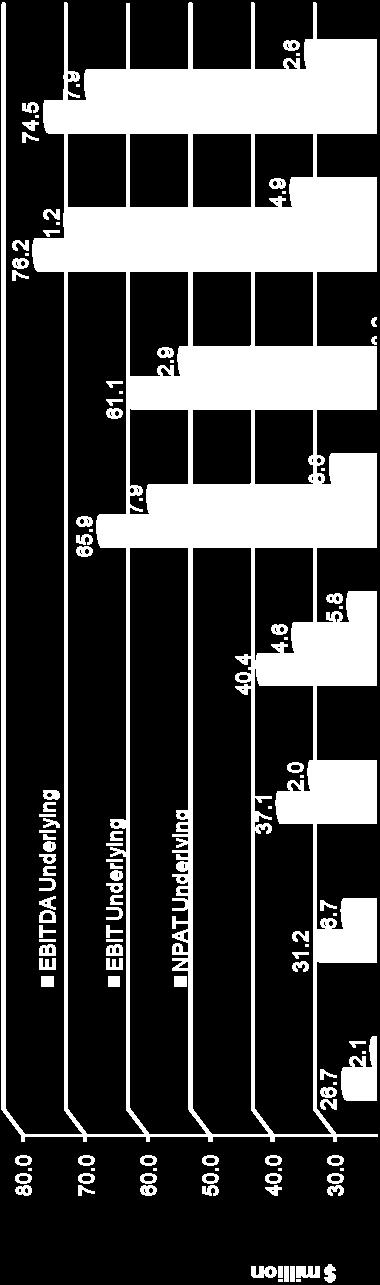
17 Financial Trends

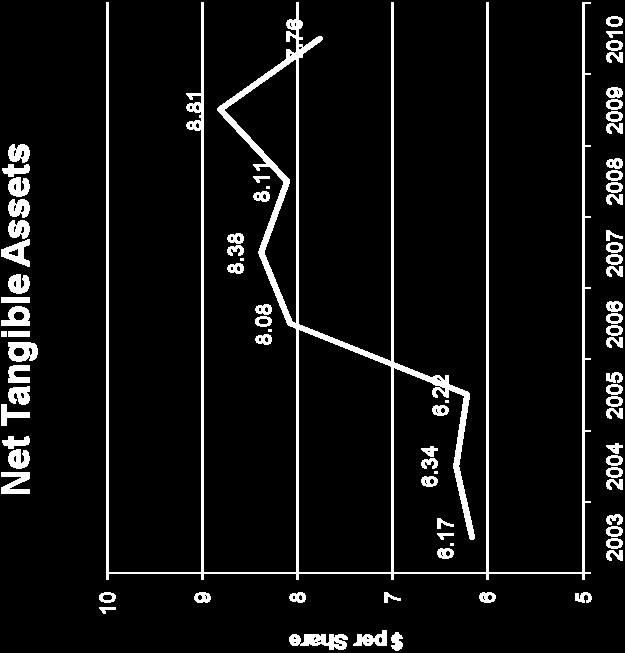
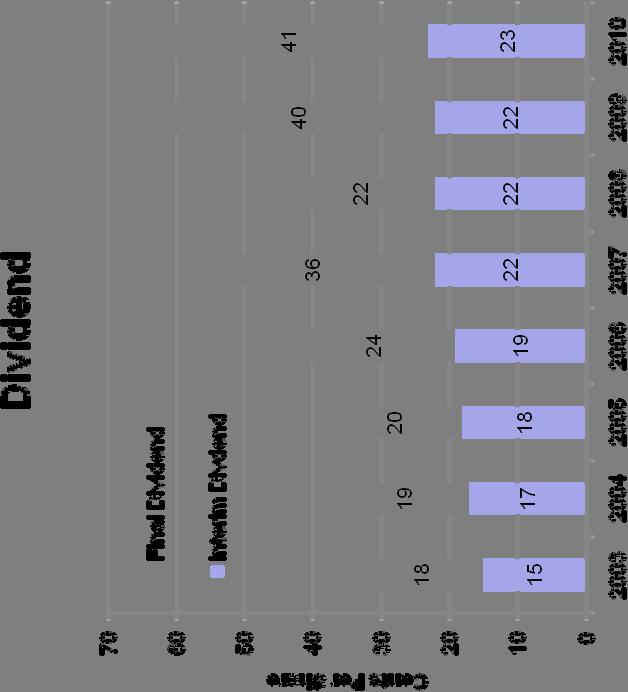
18 Financial Trends
19 Group Balance Sheet - Summary Acquisitions of Caloundra City Auto, Adtrans and Sydney Truck Centre. Takeover of Adtrans eliminated the previous equity accounted investment. Use of cash reserves, debt and equity (6% of issued capital) for growth. CA-CL (excl. held for sale) FY10 $m Change ($m) Change % Investments 2.7 (24.2) -90% PP&E (incl. held for sale) % Intangibles % Non Current Borrowings % Net Assets %
20 Borrowings Cash and debt used for earning accretive acquisitions. Inventories have adjusted to more normal levels. Adtrans $74.5m of car and truck bailment. Dec 10 $m Dec 09 $m Cash Current - Bailment & O draft N/Current (Bank Debt) Total Borrowing Total Gearing (D/D+E) 53.2% 46.4% - net of cash Gearing excl.bailment, cash (D/D+E) 32.0% 22.6% Interest Cover (EBITDA/Borrowing Cost) 3.5 times 3.6 times Bailment (floorplan) finance: industry specific, cost effective finance, secured directly to vehicle inventory, and linked to retail finance offering.
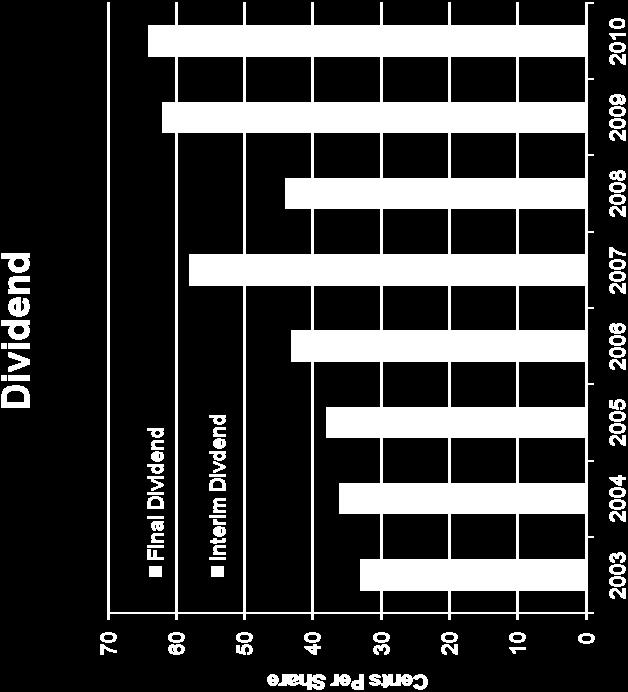
21 Group Cash Flow - Summary Higher tax payments ($13.5m) due to 2009 profitability. Growth investments of $43.6 m. Dividend paid in 2010 of 63 cents ( cents). FY2010 $m FY2009 $m Cash from operations PP&E Acq./Disp (1.3) 11.8 Business Acq./Disp. (43.6) (0.2) Net proceeds from borrowings 25.0 (40.6) Repayment Share buy back (5.0) (4.0) Dividends (net DRP) (18.8) (12.1) Dividend former (9.1) - ADG s holders Inc/(Dec) in Cash (21.7) 20.1
22 Franchise Automotive Retail Segment Whole of Adtrans included in Franchise Auto segment. Margin/Return lower due to more cautious trading environment and higher interest costs RONA not comparable due to inclusion of Adtrans net assets but only 2.3 months of consolidated earnings. Excluding Adtrans and business acquisition costs = 21.0%. FY2010 $m FY2009 $m Revenue ,606.6 Profit before tax Total Assets Total Liabilities Net Assets PBT/Revenue 2.3% 3.0% RONA (after tax) 14.0% 24.0%
23 Property Segment Lower property related debt and interest costs. Adtrans property assets included in Auto Franchise segment in Property valuation problematic for specific use assets in fragmented/confused market with virtually no directly relevant sales evidence. FY2010 $m FY2009 $m Rental Income Profit before tax Revaluation (6.1) (8.5) surplus/(deficit) (b/tax) Total Assets Total Liabilities Net Assets RONA Trading (a/tax) 4.6% 3.8% RONA incl. revaluations 2.0% 0.5%
24 Adtrans Heavy duty truck industry remains subdued. Acquired Western Star, Man, Foton and Dennis Eagle (Nov 2010) Other truck opportunities pending Eblens added to Adtrans SA car division (March 2011) Integration benefits to flow through during 2011 and 2012.

25 National Heavy Commercial Sales 2002 to 2010 (15,001 kgs GVM and over)
26 Adtrans 2011 EPS 27% of ADG s PAT results were already in APE results due to equity accounting 73% of ADG is therefore additional earnings Acquisition funding via approximately $50m (cash and debt) and $22m in AP Eagers shares (equity) Forecast EPS accretion of 8 cents per share
27 AP Eagers in 2011 and Beyond IH 2011 Priority, secure value from 2010 acquisitions Maintain and improve core dealership results 2H 2011 and Beyond No shortage of growth opportunities Evaluation and decisions critical to maximise EPS
A.P. Eagers 2011 Full Year Results Presentation
 A.P. Eagers 2011 Full Year Results Presentation March 2012 2011 Full Year Highlights EPS accretive acquisitions improve group earnings by 15% - 16 cents/share Further improvement in like for like results.
2018 Half Year Results Presentation. August 2018
 2018 Half Year Results Presentation August 2018 2018 Half Year Highlights Record statutory profit before tax $69.5m, up 2.1% on 1H17 Record net profit after tax $53.7m, up 8.8% on 1H17 Record statutory
February Full Year Results Presentation
 2016 Full Year Results Presentation February 2017 1 2016 Full Year Highlights Record statutory profit before tax $141.4m, up 17% Record net profit after tax $105.5m, up 21% Record statutory (basic) EPS
2017 Half Year Results Presentation. August 2017
 2017 Half Year Results Presentation August 2017 2017 Half Year Highlights Record statutory profit before tax $68.1m, up 0.3% on 1H16 Record net profit after tax $49.3m, up 0.4% on 1H16 Statutory (basic)
For personal use only. FY2017 H1 Results February 2017
 For personal use only FY2017 H1 Results February 2017 The half year in review Broader automotive market supported by record new vehicle sales in Australia and New Zealand Strong Automotive earnings growth
For personal use only. FY2014 Half Year Results Presentation Period Ended 31 December 2013
 FY2014 Half Year Results Presentation Period Ended 31 December 2013 Company Overview Australia s largest automotive retailer by sales, profitability, market capitalisation and workforce 152 franchises
FY2017 Full Year Results August 2017
 FY2017 Full Year Results August 2017 Repositioning Automotive in a challenging market Market conditions in FY2017 Lower margins in finance Weak WA market conditions but growth in market share Tighter consumer
For personal use only 1H17 RESULTS PRESENTATION
 For personal use only 1H17 RESULTS PRESENTATION KEY PERFORMANCE METRICS FOR 1H17 OPERATIONAL FINANCIAL CAPITAL MANAGEMENT 1,408 settlements Up 10% $19.8m 1H17 operating profit after tax Up 7% 24.8% gearing
For personal use only
 20 February 2012 APPENDIX 4D HALF YEAR REPORT & DECEMBER 2011 HALF YEAR RESULTS In accordance with ASX Listing Rules, the following documents are attached for release to the market: 2011 Half Year Results
For personal use only
 August 2011 Page 2 Highlights FY11 A year of consolidation, consistent delivery and ongoing, profitable, organic growth: Consolidated NPAT of $43.5m (normalised growth of +56%). Normalised (1) Basic EPS
A. P. EAGERS LIMITED ABN March ASX Market Announcements Australian Securities Exchange. Full Year Accounts
 27 March 2012 ASX Market Announcements Australian Securities Exchange Full Year Accounts Attached are the following documents for the year ended 31 December 2011: 1. Directors Report 2. Auditor s Declaration
For personal use only. Beacon Lighting Group Limited RESULTS PRESENTATION F Y 20 14
 For personal use only Beacon Lighting Group Limited RESULTS PRESENTATION F Y 20 14 AGENDA 1. BACKGROUND 2. RESULTS OVERVIEW 3. TRADING PERFORMANCE 4. CASH FLOW, BALANCE SHEET, DIVIDEND 5. GROWTH STRATEGY
For personal use only
 G8 Education Full Year Results Presentation Year Ended 31 December 2016 G8 Education Limited (ASX:GEM) 20 February 2017 Key Messages 2016 Revenue up 10.2% from prior year driven by fee increases and acquisitions
21 February Company Announcements Office ASX Limited. Full Year Accounts. Down 4.1% Up 2.3% Down 7.0% Down 9.2% Up 2.3% Up 2.
 21 February 2018 Company Announcements Office ASX Limited Full Year Accounts Statutory Profit Before Tax of $135.6 million (2016: $141.4 million) Record underlying Profit Before Tax of $140.8 million (2016:
Select Harvests Limited ( SHV )
") Select Harvests Limited ( SHV ) 2016 Annual General Meeting Growing Together 25 November 2016 Disclaimer & Basis of Preparation This presentation is provided for information purposes only and has been
Select Harvests Limited ( SHV ) 2016 Annual General Meeting Growing Together 25 November 2016 Disclaimer & Basis of Preparation This presentation is provided for information purposes only and has been
For personal use only
 G8 Education Year End Overview 2013 G8 Education Limited (ASX:GEM) 17 February 2014 Corporate Snapshot Capital Structure Directors & Senior Management Fully Paid Ordinary Shares (current) 301.7 million
Big River Industries Limited (ASX:BRI)
") Big River Industries Limited (ASX:BRI) FY2018 Half Year Results Briefing 27 February 2018 Optus Stadium - Perth H1 FY2018 - Contents 1. Highlights 2. Business Diversity Strengthening 3. Sales Highlights
Big River Industries Limited (ASX:BRI) FY2018 Half Year Results Briefing 27 February 2018 Optus Stadium - Perth H1 FY2018 - Contents 1. Highlights 2. Business Diversity Strengthening 3. Sales Highlights
Autosports Group. Luxurious future A$2.55 AUSTRALIA. Prestige and luxury growing faster than the market. A focussed business. Not just a roll up
 AUSTRALIA ASG AU Price (at 04:59, 18 Jan 2017 GMT) Outperform A$2.55 Valuation - EV/EBITA A$ 2.34-2.55 12-month target A$ 2.83 12-month TSR % +14.7 Volatility Index Low/Medium GICS sector Retailing Market
(RBD) INVESTOR PRESENTATION
 INVESTOR PRESENTATION") RESTAURANT BRANDS NEW ZEALAND LIMITED (RBD) INVESTOR PRESENTATION MAY 2018 RUSSEL CREEDY GROUP CHIEF EXECUTIVE OFFICER GRANT ELLIS GROUP CHIEF FINANCIAL OFFICER 1 OUTLINE Restaurant Brands 101 FY18 Results
RESTAURANT BRANDS NEW ZEALAND LIMITED (RBD) INVESTOR PRESENTATION MAY 2018 RUSSEL CREEDY GROUP CHIEF EXECUTIVE OFFICER GRANT ELLIS GROUP CHIEF FINANCIAL OFFICER 1 OUTLINE Restaurant Brands 101 FY18 Results
FINANCIAL RESULTS PRESENTATION H1FY18
 Virtus Health (ASX:VRT) FINANCIAL RESULTS PRESENTATION H1FY18 Tuesday 20 th February, 2018 9.15am AEDT DISCLAIMER The material in this presentation has been prepared by Virtus Health Limited ABN 80 129
Offshore Investor Presentation April
 Offshore Investor Presentation April 2008 www.stockland.com.au Stockland s Position in the A-REIT Sector Stockland was formed in 1952 and pioneered the stapled security structure Stockland s current position*
FY2015 Annual Results August Brett McKeon - CEO David Bailey - CFO
 FY2015 Annual Results August 27 2015 Brett McKeon - CEO David Bailey - CFO FY2015 Financial Results Highlights Delivery on FY15 Prospectus forecasts Pro forma NPAT $19.3 million up 8.4% against IPO forecast
8 August Merrylands, NSW
 8 August 2012 Merrylands, NSW Agenda 1 Results summary: Matthew Quinn 2 Capital management: Tim Foster 3 Business commentary Retail: John Schroder Office & Industrial: John Schroder Residential Communities:
FY 10 Results presentation 17 th August Denis Mackenzie, Managing Director Kevin McLaine, CFO
 FY 10 Results presentation 17 th August 2010 Denis Mackenzie, Managing Director Kevin McLaine, CFO Agenda + FY10 Results + Industry trends + Business outlook 2 Executive Summary Revenue growth has been
For personal use only. F Y R e s u l t s P r e s e n t a t i o n
 F Y 2 0 1 6 R e s u l t s P r e s e n t a t i o n Our Brands 2 Disclaimer The material in this presentation has been prepared by Bapcor Limited ( Bapcor ) ABN 80 153 199 912 and is general background information
Suncorp Group Limited
 An introduction 1 Suncorp Group Leading financial services brands in Australia and New Zealand Top 20 ASX listed company $14.4 billion market capitalisation at 15 Feb 2013 $93.5 billion in group assets
A N N U A L R E P O R T
 ANNUAL REPORT 5 YEAR FINANCIAL SUMMARY Year ended 31 December OPERATING RESULTS REVENUE 4,058,779 3,833,222 3,246,376 2,858,113 2,672,813 EBITDA 176,668 179,776 163,077 138,081 122,252 Depreciation and
Presentation outline. Company objectives. Financial highlights. Review of recent developments. Outlook and FY2008 forecast
 2007 Annual Results Presentation outline Company objectives Financial highlights Review of recent developments Outlook and FY2008 forecast Company objectives Primary objective growth in earnings per share
Watpac Limited. 31 December 2016 Half Year Results Presentation. 16 February 2017
 Watpac Limited 31 December 2016 Half Year Results Presentation 16 February 2017 1H FY17 Group financial summary Construction earnings down; Civil & Mining improves and project funding capacity substantially
TRELLIDOR HOLDINGS LIMITED UNAUDITED INTERIM RESULTS FOR THE SIX MONTHS ENDED 31 DECEMBER 2017
 TRELLIDOR HOLDINGS LIMITED UNAUDITED INTERIM RESULTS FOR THE SIX MONTHS ENDED 31 DECEMBER 2017 GROUP HIGHLIGHTS 5% Revenue 5% PAT 5% HEPS 35.2c 5% Interim dividend declared 11.0 cents per share Slide 2
Credit Suisse Annual Asian Investment Conference
 Adelaide Brighton Limited Credit Suisse Annual Asian Investment Conference Hong Kong, 27 30 March 2017 Martin Brydon Chief Executive Officer and Managing Director Adelaide Brighton Limited Overview of
2017 Full Year Results Presentation
 2017 Full Year Results Presentation Australia's leading supplier of aluminium products and solutions 5 plants; 8 extrusion presses 18 distribution centres Australia-wide Annual extrusion capacity 70k tonnes
2011 Interim Results. Keith Gordon, Managing Director & Chief Executive Officer Stephen Gobby, Chief Financial Officer
 2011 Interim Results Keith Gordon, Managing Director & Chief Executive Officer Stephen Gobby, Chief Financial Officer Emeco 2011 Interim Results Overview Financials Strategy & Outlook Questions Appendices
The Outlook for the Australian Residential Sector Presentation to Buildex
 The Outlook for the Australian Residential Sector Presentation to Buildex Andrew Harvey HIA Senior Economist October 2010 Presentation Outline The economic backdrop global economy domestic economic outlook
APPENDIX 4E YEAR ENDED 30 JUNE 2010
 APPENDIX 4E PRELIMINARY FINAL REPORT APPENDIX 4E YEAR ENDED 30 JUNE Key Dates 27 August Announcement of Profit for Year Ended 30 Announcement of Final Dividend 5 November Record date for determining entitlement
Stamp Duty on Transfers of Land
 Stamp Duty on Transfers of Land New South Wales NON-FIRST HOME BUYER - STAMP DUTY PAYABLE - NSW $0 - $14,000 $1.25 for every $100 or part of the dutiable value $14,001 - $30,000 $175 plus $1.50 for every
IAG announces FY08 result in line with July guidance and reports progress with implementation of operating model
 MEDIA RELEASE 22 AUGUST 2008 IAG announces FY08 result in line with July guidance and reports progress with implementation of operating model Insurance Australia Group Limited (IAG) today announced a net
FY18 RESULTS PRESENTATION
 FY18 RESULTS PRESENTATION KEY PERFORMANCE METRICS FOR FY18 OPERATIONAL FINANCIAL CAPITAL MANAGEMENT STRATEGIC GROWTH 2,257 lots under contract with a value of $616m $49.1m FY18 operating profit after tax
HARVEY NORMAN HOLDINGS LIMITED DELIVERS STRONG SECOND HALF. PROFIT FROM UNDERLYING BUSINESS OPERATIONS OF $250.42M FOR FY09
 28 August HARVEY NORMAN HOLDINGS LIMITED DELIVERS STRONG SECOND HALF. PROFIT FROM UNDERLYING BUSINESS OPERATIONS OF $250.42M FOR FY09 Harvey Norman Holdings Limited announced today that profit from underlying
HALF YEAR RESULTS PRESENTATION
 ASX Announcement 16 February 2016 HALF YEAR RESULTS PRESENTATION Attached is the presentation regarding the financial results of The Star Entertainment Group Limited (The Star Entertainment Group) for
Strong Second Half Performance
 Chairman and Managing Director s Review The 2014 financial year was marked by contrasting halves where we experienced a strongly improved second half following the transitory period that impacted the first
First Half FY13. Results Presentation March 2013
 First Half FY13 Results Presentation March 2013 Summary information Disclaimer This presentation contains summary information of TOX Solutions Limited ( TOX ) and is dated March 2013. The information is
Beacon Lighting Group Limited RESULTS PRESENTATION HI F Y 20 15
 Beacon Lighting Group Limited RESULTS PRESENTATION HI F Y 20 15 DISCLAIMER The purpose of this presentation is to provide background material in relation to the H1 FY2015 results of Beacon Lighting Group
Real Estate Risks and Opportunities
 Real Estate Risks and Opportunities 1 Agenda The economy Valuation issues Market snapshots Risks and opportunities 2 Economy: selected sector trends 3 Economy in CY2006 - positive Headline growth +2.8%
2017 ANNUAL GENERAL MEETING. Chief Executive Officer Operational Presentation SILVER CHEF LIMITED
 2017 ANNUAL GENERAL MEETING Chief Executive Officer Operational Presentation SILVER CHEF LIMITED 1986 2005 2008 2011 2013 2016 Silver Chef established by Non-Executive Chairman Allan English Silver Chef
For personal use only
 Appendix 4D Half Year Ended 31 December 2016 ACN 105 493 203 1. The information contained in this report is for the half-year ended 31 December 2016 and the previous corresponding half-year period 31 December
FY2013 Results Presentation By Chris Sutherland, Managing Director 29 May 2013
 FY2013 Results Presentation By Chris Sutherland, Managing Director 29 May 2013 Important notice and disclaimer The information contained in this presentation is for information purposes p only and does
1H14 HIGHLIGHTS. EBITDA of $165.6m, 19% increase on 1H13 (excl one-off items*). NPAT and EPS up 15% vs 1H13.
. NPAT and EPS up 15% vs 1H13.") -1- 1H14 HIGHLIGHTS EBITDA of $165.6m, 19% increase on 1H13 (excl one-off items*). NPAT and EPS up 15% vs 1H13. Consumer division EBITDA up 17% vs 1H13 (excl one-off items*), driven by organic broadband
-1- 1H14 HIGHLIGHTS EBITDA of $165.6m, 19% increase on 1H13 (excl one-off items*). NPAT and EPS up 15% vs 1H13. Consumer division EBITDA up 17% vs 1H13 (excl one-off items*), driven by organic broadband
16.1c c c
 1 2016 Interim Result Highlights Successful delivery, ahead of PDS 2 Exceeded revised earnings guidance Six months to 31 Dec 15 Solid capital management 7.97c 7.65c $2.15 28.3% Earnings per unit Distribution
STATE BY STATE ANALYSIS N E W H O M E B U I L D I N G
 HALF YEARLY REVIEW STATE BY STATE ANALYSIS STATE RANKINGS N E W H O M E B U I L D I N G A state by state performance review of residential construction Summer 2018 STATES STAMP DUTY DEPENDENCE: WORST IN
FY17 Results Presentation. Chris Sutherland, Managing Director 24 May 2017
 FY17 Results Presentation Chris Sutherland, Managing Director 24 May 2017 Important notice and disclaimer The information contained in this presentation is for information purposes only and does not constitute
CONSOLIDATED BUSINESS RESULTS
 CONSOLIDATED BUSINESS RESULTS FOR THE THIRD QUARTER ENDED DECEMBER 31, 2018 February 1, 2019 NSK Ltd. Cautionary Statements with Respect to Forward-Looking Statements Statements made in this report with
For personal use only
 APPENDIX 4E Cash Converters International Limited ABN: 39 069 141 546 Financial year ended 30 June 2015 RESULTS FOR ANNOUNCEMENT TO THE MARKET 30 June 2015 30 June 2014 Revenues from operations Up 13.0%
For personal use only. Veris. Simon THOMAS Chief Executive Officer. 6 th December Slide 1
 Veris Simon THOMAS Chief Executive Officer 6 th December 2016 Slide 1 Introduction Business Veris is the only ASX listed company (VRS) that is undergoing a growth strategy centred on consolidation of the
For personal use only
 Affinity Education Group Full Year 2014 Results 27 February 2015 2014 Highlights FY 2014 Earnings Growth Underlying EBITDA of $17.9m (1) and underlying NPAT of $11.4m (1) Underlying EPS of 8.1 cents (1)
August 2011
 August 2011 www.inmplc.com 1 OVERVIEW/ OPERATIONS ANALYSIS GK O Reilly Chief Executive Officer DISCLAIMER Forward Looking Information: This presentation contains forward-looking statements, which are subject
amagroupltd.com Page 1
 amagroupltd.com Page 1 WORLD CLASS AUTOMOTIVE SOLUTIONS Page 2 Page 3 Contents. Highlights AMA Group Overview Financial Performance Vehicle Panel Repairs ACAD and Procurement Strategy and Outlook HIGHLIGHTS
INDEPTH RESEARCH NOTE Brambles Ltd Buy
 Phone 1300 980 849 Email research@tradingequities.com.au INDEPTH RESEARCH NOTE Brambles Ltd Buy Price: A$9.74 Price Target: A$10.65 ASX: BXB 20 February 2018 Brambles (BXB) 1H18 results were mixed in our
For personal use only
 Ruralco 2012 Full Year Results Briefing 20 November 2012 1 Presentation Outline Performance Overview Activity Performance Capital Management Strategy Update Summary & Outlook 2 Key Outcomes Performance
Sigma Pharmaceuticals Limited
 Investor Relations Contact: Gary Woodford Corporate Affairs Manager Gary.Woodford@signet.com.au Phone: 03 9215 9632 Mobile: 0417 399 204 Mark Hooper CEO and Managing Director Gary Woodford Corporate Affairs
MIRVAC GROUP 3 MAY Management Update INCLUDING 3Q16 HIGHLIGHTS
 MIRVAC GROUP 3 MAY 2016 Management Update INCLUDING 3Q16 HIGHLIGHTS URBAN FOCUS > We are an urban company, we create places for people to live, work and shop > We understand the fabric of cities and the
COLLINS FOODS LIMITED. MORGANS ANNUAL QLD CONFERENCE 8 October 2014
 COLLINS FOODS LIMITED MORGANS ANNUAL QLD CONFERENCE 8 October 2014 Page 1 Chief Executive Officer Graham Maxwell Collins Foods Limited 170 KFC restaurants across Queensland, Western Australia and Northern
For personal use only
 2015 ANNUAL GENERAL MEETING 26 November 2015 ASX: AIK Andrew Grant Managing Director 1 CONTENTS INVESTMENT PROPOSITION 3 GROUP OVERVIEW 5 INVESTMENTS TLRENTALS 9 HAL GROUP ITSERVICES 20 LEADING EDGE GROUP
Q3 and January-September 2012 Results
 Q3 and January-September 2012 Results Bodo Uebber Member of the Board of Management Finance & Controlling and Daimler Financial Services October 24, 2012 Highlights in Q3 2012 Group sales Sales record
For personal use only
 MMS Group FY17 Half Year Presentation Presenters Mike Salisbury, CEO Mark Blackburn, CFO McMillanShakespeareGroup For personal use only Overview Overview 2 Overview Key initiatives for building long term
For personal use only
 25 March 2015 Company Announcements Office ASX Limited Full Year Accounts Attached are the following documents for the year ended 31 December 2014: 1. Directors Report 2. Auditor s Declaration of Independence
FULL YEAR RESULTS PRESENTATION
 ASX Announcement 26 August 2016 FULL YEAR RESULTS PRESENTATION Attached is the presentation regarding the financial results of The Star Entertainment Group Limited (The Star Entertainment Group) for the
COLLINS FOODS LIMITED
 COLLINS FOODS LIMITED 2014 FINANCIAL YEAR RESULTS 25 June 2014 FY14 financial overview $m FY13 FY14 WA impact (1) Significant items (2) FY14 Underlying Change versus FY13 Underlying Revenue 423.9 440.6
Tabcorp Holdings Limited 2015/16
 Tabcorp Holdings Limited ABN 66 063 780 709 2015/16 Full Year Results Presentation 4 August 2016 Draft version 15 (01-08-13) FY16 overview Statutory results NPAT $169.7m, down 49.3% EPS 20.4 cents per
Summary of Financial Results for FY2012 (Fiscal Year Ended March 31, 2012)
") 1/6 Summary of Financial Results for (Fiscal Year Ended March 31, 2012) Yoshio Shirai President, Member of The Board Hino Motors, Ltd. April 26, 2012 2/6 Overview of Accounts for and FY2013 Forecasts 1.
1/6 Summary of Financial Results for (Fiscal Year Ended March 31, 2012) Yoshio Shirai President, Member of The Board Hino Motors, Ltd. April 26, 2012 2/6 Overview of Accounts for and FY2013 Forecasts 1.
Chairman s Address Annual General Meeting Wednesday 25 May 2016
 Chairman s Address Annual General Meeting Wednesday 25 May 2016 Record Results As you would be aware, AP Eagers financial year end is December 31 and as previously reported, 2015 was another record year
Key statistics for Sensis Business Index (September 2018) SM B confidence: National average +42 7
 SM B confidence: National average +42 7") Key statistics for Sensis Business Index (September 2018) The Sensis Business Index is a quarterly survey of 1,000 small and medium businesses, which commenced in 1993. Note: This survey was conducted
Key statistics for Sensis Business Index (September 2018) The Sensis Business Index is a quarterly survey of 1,000 small and medium businesses, which commenced in 1993. Note: This survey was conducted
NRW HOLDINGS LIMITED ANNUAL GENERAL MEETING 28 th November 2012
 NRW HOLDINGS LIMITED 2012 ANNUAL GENERAL MEETING 28 th November 2012 DISCLAIMER AND IMPORTANT NOTICE 2 Information, including forecast financial information in this presentation should not be considered
Macquarie Securities Western Australia Forum. 15 October 2014
 Macquarie Securities Western Australia Forum 15 October 2014 Disclaimer Summary information This presentation contains summary information of TOX Solutions Limited ( TOX ) and is dated 15 October 2014.
Operating and Financial Review
 12 CABCHARGE 216 ANNUAL REPORT Operating and Financial Review We recognise the substantial opportunity for growth in personal transport in Australia in the midst of changing industry dynamics. We start
Q2 11 COMPANY UPDATE
 Q2 11 COMPANY UPDATE DISCLOSURE 2 This presentation includes forward-looking statements within the meaning of the "Safe-Harbor" provisions of the Private Securities Litigation Reform Act of 1995, which
The Outlook for the Housing Industry in New South Wales
 The Outlook for the Housing Industry in New South Wales Dr. Harley Dale HIA Chief Economist HIA Industry Outlook Breakfast Sydney March 2011 Where are we heading? The economic backdrop is improving and...
AGM Presentation November 2016
 AGM Presentation November 2016 At this time last year At last year s AGM, we were facing the following challenges: The bank had terminated our transactional banking and debt facilities as well as forcing
2011 INVESTOR BRIEFING
 2011 INVESTOR BRIEFING 14 June 2011 ABN 60 090 739 923 4 AUSTRALIA INTERMEDIATED () Accelerating growth in home markets PETER HARMER CHIEF EXECUTIVE OFFICER 30 BUSINESS OVERVIEW DIVERSE PORTFOLIO MIX Large
NAB MONTHLY BUSINESS SURVEY JANUARY 2018 FURTHER CONFIRMATION OF BUSINESS STRENGTH
 EMBARGOED UNTIL: :3AM AEDT, 3 FEBRUARY 28 NAB MONTHLY BUSINESS SURVEY JANUARY 28 FURTHER CONFIRMATION OF BUSINESS STRENGTH NAB Australian Economics Strong trend business conditions provide further confirmation
barometer A study of the mortgage market in Australia April 2011
 barometer A study of the mortgage market in Australia April 11 barometer contents Introduction 3 Methodology 4 Executive Summary 5 1. Current Issues 8. Findings 1 3. First Home Buyers 15 4. Owner Occupiers
Financial Results Half year ended 31 December February 2012
 Financial Results Half year ended 31 December 2011 22 February 2012 Result overview and strategic highlights Mick McCormack Managing Director and CEO 1H 2012 Results Presentation 2 Delivering on strategy
Q3 and January-September 2011 Results
 Q3 and January-September 2011 Results October 27, 2011 2 Key developments in Q3 2011 Group unit sales increased in all divisions, revenue grew by 5% EBIT of 2.0 billion again at a high level Mercedes-Benz
FULL YEAR RESULTS 13 AUGUST 2018
 FULL YEAR RESULTS 13 AUGUST 2018 AGENDA Highlights Operating Performance Final Dividend Business Strategy Outlook Conclusion HIGHLIGHTS GENERAL HIGHLIGHTS Year on year revenue, earnings and dividend growth
A-REIT SECTOR UPDATE FOR THE SIX MONTHS TO 31 DECEMBER 2013
 A-REIT SECTOR UPDATE FOR THE SIX MONTHS TO 31 DECEMBER 2013 A-REIT SECTOR UPDATE FOR THE SIX MONTHS TO 31 DECEMBER 2013 CONTENTS A-REIT SECTOR UPDATE FOR THE SIX MONTHS TO 31 DECEMBER 2013 1 SECTOR PERFORMANCE
Select Harvests Limited ( SHV ) Half Year ending 31 December Results Presentation 28 February 2017
 Half Year ending 31 December Results Presentation 28 February 2017") Select Harvests Limited ( SHV ) Half Year ending 31 December 2016 - Results Presentation 28 February 2017 Disclaimer & Basis of Preparation This presentation is provided for information purposes only and
Select Harvests Limited ( SHV ) Half Year ending 31 December 2016 - Results Presentation 28 February 2017 Disclaimer & Basis of Preparation This presentation is provided for information purposes only and
Martin Lindqvist, President & CEO Marco Wirén, CFO February 11, 2011
 Results for the fourth quarter 2010 Martin Lindqvist, President & CEO Marco Wirén, CFO February 11, 2011 Forward-looking statements The presentation and the materials constituting it contain certain statements
Half Year Results Presentation 31 December 2005
 Half Year Results Presentation 31 December 2005 1 st Half FY2006 Highlights Strong first half year result Revenue EBITDA EBITDA % NPAT NPAT% EPS DPS Actual $121.9m $35.4m 29.0% $15.7m 12.9% 11.0c 5.2c
SKYCITY Entertainment Group Limited
 SKYCITY Entertainment Group Limited 1H18 Results Investor Presentation 9 February 2018 Disclaimer All information included in this presentation is provided as at 9 February 2018 This presentation includes
Paul Maguire Philip Bennett Paul Witheridge Managing Director Chief Financial Officer Chief Financial Officer
 McPherson s Limited Results for the year to 30 June 2011 Paul Maguire Philip Bennett Paul Witheridge Managing Director Chief Financial Officer Chief Financial Officer McPherson s Limited McPherson s Limited
3Q16 Capital, Funding & Asset Quality Update (Pillar 3) August Westpac Banking Corporation ABN
 August Westpac Banking Corporation ABN") 3Q16 Capital, Funding & Asset Quality Update (Pillar 3) August 2016 Westpac Banking Corporation ABN 33 007 457 141. This document should be read in conjunction with Westpac s Pillar 3 Report June 2016,
3Q16 Capital, Funding & Asset Quality Update (Pillar 3) August 2016 Westpac Banking Corporation ABN 33 007 457 141. This document should be read in conjunction with Westpac s Pillar 3 Report June 2016,
Mobilität erfahren Zukunft entwickeln. Experience mobility Drive the future.
 ElringKlinger Group Mobilität erfahren Zukunft entwickeln. Experience mobility Drive the future. Conference Call Results First Half-year and Second Quarter 2010 1 Q2 2010: Key developments! Strong recovery
For personal use only
 Affinity Education Group (ASX:AFJ) Morgans Conference 10 October 2014 Disclaimer This presentation contains general information in summary form which is current as at 10 October 2014. It presents financial
Research Note: Household Energy Costs in Australia 2006 to
 Research Note: Household Energy Costs in Australia 2006 to 2016 1 Ben Phillips ANU Centre for Social Research and Methods February 2017 1 This work was funded by News Corp Australia. The author would like
24 th Annual General Meeting
 24 th Annual General Meeting 28 October 2016 gwagroup.com.au Agenda Chairman s Address Managing Director s Address Formal Business Darryl McDonough Chairman Tim Salt Managing Director Darryl McDonough
Qube Holdings Limited
 Qube Holdings Limited Investor Presentation FY 18 Interim Results 1 Disclaimer Important Notice ABN 141 497 230 53 The information contained in this Presentation or subsequently provided to the recipient
ASG Macquarie Conference Presentation. May 2018
 ASG Macquarie Conference Presentation May 2018 1 IMPORTANT NOTICE AND DISCLAIMER This presentation contains summary information about Autosports Group Limited (ACN 614 505 261) (ASG) and its activities
For personal use only
 Appendix 4D Name of Entity: G8 Education Limited ABN: 95 123 828 553 Current Financial Period Ended: Half-Year ended 30 June 2014 Previous Corresponding Reporting Period Half-Year ended 30 June 2013 Results
Motor Industry Services Australian Listed Dealer Groups comparison June 2017
 Motor Industry Services Australian Listed Dealer Groups comparison June 2017 kpmg.com.au Executive summary June 2017 results The big are getting bigger and at the same time are preparing their business
JB Hi-Fi Limited. Full Year Results Presentation 30 June 2009
 JB Hi-Fi Limited Full Year Results Presentation 30 June 2009 11 August 2009 Agenda 1. Performance 2. Historical Performance 3. Trading Update 4. Financial Detail 5. Dividends 6. Store Update 7. Investment