Press Release 20 October, 2017
|
|
|
- Gwendoline Barrett
- 6 years ago
- Views:
Transcription
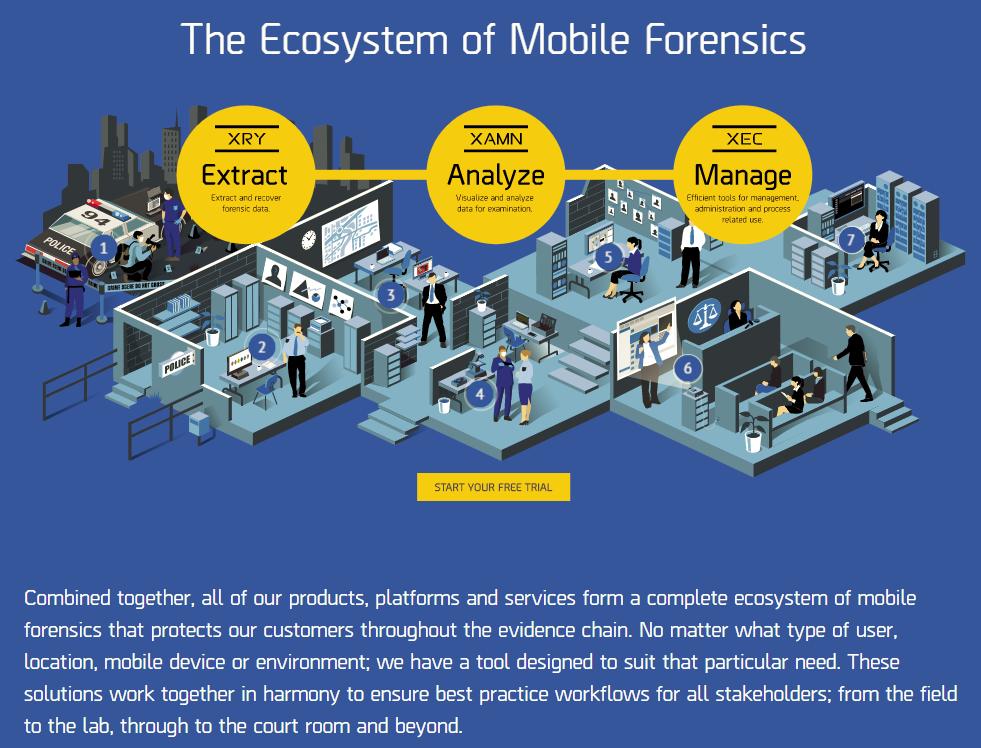
1 Press Release 20 October, 2017 Net sales increased 42.5 percent to SEK (71.6) million (43.7 percent in local currencies) EBIT increased to SEK 40.0 (23.3) million The EBIT margin reached 39.2 (32.5) percent (39.0 percent in local currencies) Profit after tax was SEK 30.4 (18.3) million Earnings per share reached SEK 1.65 (0.99) Cash flow from operating activities amounted to SEK -1.0 (27.5) million Net sales increased 27.3 percent to SEK (170.4) million (27.0 percent in local currencies) EBIT reached SEK 51.9 (37.1) million The EBIT margin reached 23.9 (21.8) percent (23.9 percent in local currencies) Profit after tax was SEK 38.8 (28.2) million Earnings per share reached SEK 2.12 (1.53) Cash flow from operating activities amounted to SEK -2.7 (36.0) million Cash and cash equivalents and short-term placements att the end of the period amounted to SEK 76.3 (107.1) million MSAB is a world leader in mobile forensics technology with the aim of extracting and analysing data from confiscated mobile devices, mainly from mobile phones. The company has its own sales offices and sales representatives in Europe, North America, South America, China, Australia, Singapore and Russia, and together with a number of distributors, covers most of the world. The proprietary products have become a de facto standard in the field and are used for securing evidence in more than 100 countries. These products are complemented by a wide range of training courses with the possibility of becoming certified in a forensically sound methodology. Customers are primarily law enforcement agencies, such as police, military and customs. MSAB is listed on NASDAQ Stockholm under the ticker symbol: MSAB B. 1
2 MSAB delivered its best quarter ever with record sales and a good profit margin. Some business deals based on parts of our Ecosystem with long lead times have now materialized into concrete agreements. Sales in the third quarter grew 43 percent amounting to SEK (71.6) million. EBIT rose to SEK 40.0 (23.3) million, corresponding to an EBIT margin of 39.2 (32.5) percent. For the first nine months of the year sales grew 27 percent, reaching SEK (170.4) million. EBIT increased to SEK 51.9 (37.1) million, corresponding to an EBIT margin of 23.9 (21.8) percent. The larger turnover increased profit and gave a stronger EBIT margin. We experienced good growth in all our regions and our investments in the MSAB Ecosystem are now showing results. With more products and process solutions, we can address a broader market as well as increase the potential with existing customers. Mobile forensics is playing an ever greater and increasingly important role in the day-to-day work of the police. This means that more police, even outside of the IT lab, are coming into contact with mobile phones and need a greater understanding of the possibilities for securing evidence from them. In order to do this, an increase in knowledge and training are necessary. An example of how important information from a mobile phone can be is illustrated by an actual case from Stockholm. The police arrested a suspect in the subway, in connection with the arrest, they went through the suspect s mobile phone where they found an incriminating video of the suspect committing aggravated assault against another man. This case demonstrates how important it is to give more police access to mobile forensic tools outside of the IT lab. The case above demonstrates how much evidence there is on mobile phones. But even when it comes to the dramatically growing incidence of cybercrime, it is often a smart phone that holds the key to a successful criminal investigation. There are many examples where crimes against children, threats, break-ins, embezzlement, and many others are concluded only with the help of a mobile phone. Access to these new technologies and hence new methods to commit crimes also challenges the police s ways of working as never before. Today, a negligibly small proportion of the police s budget is spent on modern tools to solve crimes. I am convinced that law enforcement authorities will start allocating considerably greater resources at an increasingly quicker pace to digitalization in order to be able to solve the increasing number of crimes reported. The most critical component for securing evidence is the mobile phone. MSAB has a strong offering that can help the police make a difference. Law enforcement authorities that invest in MSAB s Ecosystem not only have access to the best products on the market, but also greater confidence from the public and more satisfied employees. MSAB s third quarter demonstrated strong growth, a large portion of which lies in our broadened product portfolio. We now cover more segments in the market, which strengthens our business opportunities and reduces our business risk exposure. The strength in MSAB:s business model is the combination of recurring revenues and scalability. The fact that a large portion of operating cost is covered by license renewals gives us the comfort to work with a long-term perspective to continue grow the business. The scalable business model allows large orders to be delivered with retained quality and without bottlenecks. Historically this combination has been reflected in MSAB:s growth, profit margins and cash flow. Due to our customers purchasing patterns, revenue will continue to vary from quarter to quarter wherefore the company performance should be evaluated on an annual basis, especially since we continuously invest in existing and new products, the organization and the market. All to ensure that MSAB continues to be the leading supplier in our market. We feel confident moving forward because the trend toward long-term growth is strong. The need to read and analyze the content of seized mobile phones continues to rise. We see how more and more authorities around the world are starting to review their entire digital strategy and that is precisely what MSAB has worked and planned for. Stockholm, October 2017 Joel Bollö Chief Executive Officer 2


 compared with the corresponding period last year, sales for the region grew 46 percent.")


3 EMEA & Latin America during the period, sales for the region grew 46 percent, where a major deal for Kiosk solutions, made public by the Company on 25 September, contributed significantly. Excluding this particular deal, other markets within the region also demonstrated good growth. North America during the period, sales in the region grew 8 percent, consisting mostly of major deals primarily with federal customers. A significant portion of these sales was for the Field Version system. Sales to local and state law enforcement authorities still represent only a small portion of the region s total sales, but the trend is favorable and the potential is good. Asia and CIS (Commonwealth of Independent States) compared with the corresponding period last year, sales for the region grew 46 percent. There was growth over the entire region, the result of targeted efforts by the Company, including through a subsidiary in Singapore which started up during the previous year. During the quarter, a new version of XRY was launched, which includes, amongst other things, support for extraction of information from drones, a type of information carrier which is becoming increasingly common in crime contexts. Kiosk and XEC were also updated, and their platform and solutions were at the core of the major deal that was announced this quarter. The positive trend for revenue from training operations continued with growth of 32 percent for the period, generated primarily in North America and Europe. Training represented 8 (7) percent of total Income for the period. In September, a significant order from a European authority was announced, consisting of a solution that comprised both Kiosk and XEC. 3
 million. In local currencies, net sales increased 43.7 percent for the quarter and 27.0 percent for the period. Expenses for goods for resale reached SEK 11.4 (9.")


 percent. The number of employees in the Group at the end of the period was 139 (118).")
 million, which corresponds to an EBIT margin of 23.9 (21.8) percent. In local currencies, the EBIT margin was 39.")
4 Consolidated net sales increased during the third quarter by 42.5 percent to SEK (71.6) million and increased for the period by 43.7 percent to SEK (170.4) million. In local currencies, net sales increased 43.7 percent for the quarter and 27.0 percent for the period. Expenses for goods for resale reached SEK 11.4 (9.4) million for the quarter and SEK 17.3 (15.0) million for the period. The increase in expenses is primarily related to the major European order in September, which included a larger amount of hardware relative to the Company s average sales. Other expenses for the quarter amounted to SEK 14.8 (11.3) million and SEK 49.0 (37.0) million for the quarter. Major focus on marketing activities during the year are the main reason for the increase in expenses. Personnel expenses for the quarter amounted to SEK 35.6 (27.2) million and SEK 97.9 (80.1) for the period. This increase was driven mainly by an increase in the number of employees, primarily within sales and marketing as well as development. Cash flow from operating activities for the quarter reached SEK -1.0 (27.5) million and SEK -2.7 (36.0) million for the period. The negative cash flow is due to several large orders, including the publicized European order and most American federal orders, being delivered and invoiced at the end of the quarter, thereby increasing receivables. The positive effect on cash flow will occur as payments come in during the fourth quarter. The longterm receivable of SEK 4.0 million which arose during the quarter is accrued income related to the European order, where part of the payment is spread out over a two-year period. During the period, dividends in the amount of SEK 40.4 (40.4) million were paid out. Cash and cash equivalents at the end of the period amounted to SEK 76.3 (107.1) million. The equity ratio at the end of the period was SEK 52.2 (55.7) percent. The number of employees in the Group at the end of the period was 139 (118). The average number of employees was 131 (116). EBIT for the quarter was SEK 40.0 (23.3) million, which corresponds to an EBIT margin of 39.2 (32.5) percent. EBIT for the period was SEK 51.9 (37.1) million, which corresponds to an EBIT margin of 23.9 (21.8) percent. In local currencies, the EBIT margin was 39.0 percent for the quarter and 23.9 percent for the period. Net financial income/expense amounted to SEK -0.6 (0.6) million for the quarter and SEK (1.2) million for the period. Net financial income/expense consisted mainly of revaluation of cash and cash equivalents in foreign currencies. Revenues and expenses are denominated in the same currencies to the extent possible. Profit after tax for the quarter reached SEK 30.4 (18.3) million and SEK 38.8 (28.2) million for the period. 4
5 MSAB is not dependent on the seasons in the sense that is normally meant by seasonal effects. Most of the Company s customers, however, follow the calendar year as their budget period, and historically, this has been reflected in sales in that the fourth quarter is stronger than other quarters in the calendar year. The AGM will be held in Stockholm on 15 May, Shareholders who wish to have a matter addressed att the AGM must submit a written proposal latest 6 February, 2017 in order to guarantee that the matter is included in the Notice of the AGM. The Group s activities expose it to risks and uncertainty factors. Information on risks and uncertainties other than currency exposure due to foreign subsidiaries and the fact that most invoicing in Sweden is denominated in foreign currencies can be found in more detail in the 2016 Annual Report. The Annual Report is available on the Company s website. The Nomination Committee in MSAB consists of Chairman Erik Hermansson (Humle Kapitalförvaltning AB) and Board members Henrik Tjernberg and Joakim Dal (Edastra Venture Capital AB). The Nomination Committee is tasked with proposing candidates for the positions of AGM Chairman, Board members, Chairman of the Board and Auditor, as well as Board and Auditor remuneration, and proposals for Nomination Committee procedures. This quarterly report has been prepared for the Group in accordance with the Swedish Annual Accounts Act and IAS 34 Interim Financial Reporting, and for the Parent Company in accordance with the Swedish Annual Accounts Act and the Swedish Financial Reporting Board s recommendation RFR 2 Accounting for Legal Entities. Information as per IAS 34 Interim Financial Reporting is provided in notes as well as in other places in the interim report. The accounting principles applied by the Group and the Parent Company are consistent, unless stated below, with the accounting principles used to prepare the most recent annual report. New and revised IFRS standards, interpretations from the IFRS Interpretations Committee and amendments to RFR 2 applied as of 1 January, 2017 have no impact on the Parent Company s or the Group s financial reporting. As of 1 January, 2018, IFRS 15 Revenue from Contracts, shall be applied. The Company has analyzed the effects of this principle and the assessment is that it will not entail any significant changes with respect to when the Company recognizes revenues. In essence, IFRS 15 only entails extended disclosure requirements in the annual report. Based on preliminary analysis of IFRS 9, which comes into force on 1 January 2018, the assessment is that the reporting is not affected except for additional disclosure requirements. Net sales for the Parent Company for the period amounted to SEK (127.0) million. EBIT for the period was SEK 42.7 (33.0) million. Investments during the period claimed SEK 0.6 (0.3) million. There were 101 (88) persons employed in the Parent Company at the end of the period. There were no related party transactions during the quarter. 2 February, 2018 Year-end report This report contains information that MSAB, Corporate ID number , is obligated to make public pursuant to the EU Market Abuse Regulations. This information was submitted for publication through the agency of the contact person set out below, at 08:00 CEST on 20 October, This report, earlier financial reports and press releases are available on the Company s website: Send questions to: Chief Executive Officer Joel Bollö Tel: joel.bollo@msab.com 5
6 The under-signed certify that this interim report provides, in accordance with current regulations, a fair and true overview of the Parent Company and the Group s operations, financial position and results, as well as describing the significant risks and uncertainty factors to which the Parent Company and its subsidiaries are exposed. Stockholm, 20 October, 2017 Corporate ID number Henrik Tjernberg Joel Bollö Robert Ahldin Örjan Gatu Chairman of the Board Chief Executive Officer Board member Board member Jan-Olof Backman Carl Bildt Katarina G Bonde Board member Board member Board member Introduction We have reviewed the interim report for Micro Systemation AB (publ) for the period January 1 - September 30, The Board of Directors and the President are responsible for the preparation and presentation of this interim report in accordance with IAS 34 and the Annual Accounts Act. Our responsibility is to express a conclusion on this interim report based on our review. Scope of Review We conducted our review in accordance with the International Standard on Review Engagements ISRE 2410, Review of Interim Financial Information Performed by the Independent Auditor of the Entity. A review consists of making inquiries, primarily of persons responsible for financial and accounting matters, and applying analytical and other review procedures. A review has a different focus and is substantially less in scope than an audit conducted in accordance with ISA and other generally accepted auditing practices. The procedures performed in a review do not enable us to obtain a level of assurance that would make us aware of all significant matters that might be identified in an audit. Therefore, the conclusion expressed based on a review does not give the same level of assurance as a conclusion expressed based on an audit. Conclusion Based on our review, nothing has come to our attention that causes us to believe that the interim report is not, in all material respects, prepared for the Group in accordance with IAS 34 and the Annual Accounts Act, and for the Parent Company in accordance with the Annual Accounts Act. Stockholm, October 20, 2017 Deloitte AB Erik Olin Authorized Public Accountant 6
7 Jul-Sept Jan-Sept 12 months Full year MSEK Oct-Sept 2016 Net sales Cost of goods sold Other external costs Personnel costs Depreciation of fixed assets Total operating cost Operating profit - EBIT Financial income Financial expenses Profit/loss before tax Tax Net profit/loss after tax Jul-Sept Jan-Sept 12 months Full year MSEK Oct-Sept 2016 Net profit/loss after tax Currency translation differences Tax on currency translation differences Total comprehensive income Comprehensive income for the period attributable to the shareholders of the parent company Jul-Sept Jan-Sept 12 months Oct-Sept 2016 Revenue growth, % EBIT-margin, % Cash flow from operating activities per share, SEK Return on equity, % Return on capital employed, % Equity per share, SEK Earnings per share, basic, SEK Earnings per share, diluted, SEK Average number of shares, basic, million Average number of shares, diluted, million
8 30-sep Dec-31 MSEK ASSETS Intangible assets Tangible assets Deferred tax asset Other long term asset Total non-current assets Inventories Accounts receivable - trade Current tax asset Other current assets Cash and cash equivalents Total current assets TOTAL ASSETS EQUITY AND LIABILITIES Equity Accounts payable - trade Current tax liability Other current liabilities Total current liabilities TOTAL EQUITY AND LIABILITIES Sep-16 Dec-31 MSEK Opening balance Profit/loss for the period Issue of share option rights Conversion of share option rights Dividend Equity at the end of the period
9 Jul-Sept Jan-Sept 12 months MSEK Oct-Sept 2016 Cash flow before working capital changes Working capital changes Cash flow from operating activities Investments in fixed assets Cash flow from investing activities Dividend paid to shareholders Premium received/conversion of share option rights Cash flow from financing activities Cash flow for the period Cash at the beginning of the period Exchange rate difference in cash Cash at the end of the period Q3 Q2 Q1 Q4 Q3 Q2 Q1 Q4 Q3 Q2 Q1 Q4 Q3 Q2 Q1 Net sales, MSEK EBIT, MSEK EBIT-margin, % Earnings per share, SEK Return on equity, % Return on capital employed, % Equity ratio, % Cash flow from operations/per share, SEK Equity per share, SEK
10 The Company presents certain financial metrics in the interim report that are not defined under IFRS. The Company believes that these metrics provide useful supplemental information to investors and the Company's management as they allow for the evaluation of the Company's performance. EBIT Earnings before interest and taxes. EBIT margin EBIT in relation to net sales. Earnings per share * Profit/loss after tax in relation to average number of outstanding shares after dilution. Return on equity Profit/loss after tax in relation to average adjusted equity. Return on capital employed EBIT plus financial items in relation to average capital employed. Equity ratio Equity in relation to total assets. Cash flow from operations/per share Cash flow from operations in relation to average number of outstanding shares after dilution. Equity per share Equity in relation to outstanding shares at the end of the period. Average adjusted equity Average of equity during 12 months-period. Opening plus closing shareholders' equity divided by two. Capital employed /average capital employed Capital employed is calculated as total assets less non- interest-bearing liabilities. Average capital employed is calculated as capital employed over a 12 months period. Capital employed at beginning of period plus capital employed at end of period divided by two. Revenue growth, % Sales current period in relation to same period prior year Net financial items Net of financial income and expenses * Defined in line with IFRS Reconciliations of measurements that are not defined under IFRS Q3 Q2 Q1 Q4 Q3 Q2 Q1 Q4 Q3 Q2 Q1 Q4 Q3 Q2 Q1 Total assets, MSEK Accounts payables, MSEK Tax liabilities, MSEK Other liabilities, MSEK Capital employed, MSEK 100, Average capital employed, MSEK
11 Jan-Sept MSEK Net sales Cost of goods sold Other external costs Personnell costs Depreciation of fixed assets Total operating cost Operating profit - EBIT Net financial items Profit/loss before tax Tax Net profit/loss after tax Jan-Sept MSEK Net profit/loss after tax Total comprehensive income
12 Sept-30 MSEK ASSETS Intangible assets Tangible assets Shares in group companies Other long term asset Total fixed assets Inventories Accounts receivable - trade Other current assets Cash and cash equivalents Total current assets TOTAL ASSETS EQUITY AND LIABILITIES Share capital Share premium Restricted equity Statutory reserve Profit brought forward Non-restricted equity Total equity Accounts payable - trade Current tax liability Other current liabilities Total current liabilities TOTAL EQUITY AND LIABILITIES
13 13
Press release 26 October, 2018
 Press release 26 October, 2018 Net sales increased 0.4 percent to SEK 217.7 (216.9) million (-2 percent in local currencies). EBIT for the year amounted to SEK 24.0 (51.9) million. The EBIT margin reached
Press release 21 July, 2017
 Press release 21 July, 2017 Net sales increased 14 percent to SEK 59.5 (52.0) million (11 percent in local currencies) EBIT decreased to SEK 6.0 (8.5) million The EBIT margin reached 10.2 (16.3) percent
Shareholders in MICRO SYSTEMATION AB (publ)
") Shareholders in MICRO SYSTEMATION AB (publ) are hereby given notice to attend the Annual General Meeting (AGM) on Wednesday, 10 May, 2017 at 18.00 in Gällöfsta City's premises at Biblioteksgatan 29 in
Shareholders in MICRO SYSTEMATION AB (publ) are hereby given notice to attend the Annual General Meeting (AGM) on Wednesday, 10 May, 2017 at 18.00 in Gällöfsta City's premises at Biblioteksgatan 29 in
Operating profit increased by 44 percent to 27.2 MSEK (19.0). Result after tax increased by 52 percent to 27.7 MSEK (18.3).
. Result after tax increased by 52 percent to 27.7 MSEK (18.3).") Interim report January-September 2016 November 10, 2016 Third quarter Net sales amounted to 167.0 MSEK (149.7), an increase by 11.6 percent compared to the corresponding quarter last year. At comparable
Interim report January-September 2016 November 10, 2016 Third quarter Net sales amounted to 167.0 MSEK (149.7), an increase by 11.6 percent compared to the corresponding quarter last year. At comparable
Summary of the third quarter and first nine months of 2017
 Interim Report January September 2017 Evolution Gaming Group AB (publ) Third quarter of 2017 (Q3 2016) Operating revenues increased by 56% to EUR 45.7 million (29.2) EBITDA increased by 103% to EUR 21.8
Boule Diagnostics AB (publ) Interim report January September Earnings more than doubled and continued sales success
 Interim report January September Earnings more than doubled and continued sales success") Boule Diagnostics AB (publ) Interim report January September 2016 Earnings more than doubled and continued sales success Quarter July September 2016 Net sales amounted to SEK 108.5 million (88.8), up 22.2
Boule Diagnostics AB (publ) Interim report January September 2016 Earnings more than doubled and continued sales success Quarter July September 2016 Net sales amounted to SEK 108.5 million (88.8), up 22.2
Interim report. January - September Interim report for the period January - September Third quarter, July - September 2015
 Interim report January - September 2015 October 30, 2015 Interim report for the period January - September 2015 Third quarter, July - September 2015 Group net sales in the third quarter 2015 amounted to
Biotage continues to grow with increased profitability
 Interim report January-September 2018 November 6, 2018 Biotage continues to grow with increased profitability Third quarter, July - September 2018 Net sales amounted to 232.2 MSEK (177.7), which is an
Interim report. January - September President s comments. Third quarter. January - September
 Interim report January - September Third quarter > Net sales increased by 20 percent during the third quarter to SEK 2,695 M (2,253). Net sales increased by 13 percent in local currencies. > Operating
hms networks JANUARY - SEPTEMBER 2012 First nine months Third quarter
 hms networks I N T E R I M JANUARY - SEPTEMBER First nine months q Net sales for the first nine months in- creased with 2 % reaching SEK 295 m (289), corresponding to a 1 % increase in local currencies
Interim report. January September President s comments. The third quarter. January-September
 Interim report January September The third quarter > > Net sales increased by 30 percent during the third quarter to SEK 1,906 M (1,462). Net sales increased by 12 percent in local currencies > > Operating
BTS Group AB reports continued strong growth in both turnover and results
 BTS Group AB (publ) Interim Report 1 January 30 September 2005 BTS Group AB reports continued strong growth in both turnover and results During the nine-month period, net turnover rose by 34 per cent and
 Interim Report January September 2018 ------------------------------------------------------------------------------------------------ July September in summary Net sales rose by about 74 percent to SEK
Interim report January September 2015
 Boule Diagnostics AB (publ) Interim report January September 2015 Increased sales and a higher gross margin Quarter, July-September 2015 Net sales amounted to SEK 88.8 million (73.6), up 20.7 percent.
Interim report. January - September Interim report for the period January - September Third quarter July September 2014
 Interim report January - September 2014 October 30, 2014 Interim report for the period January - September 2014 Third quarter July September 2014 Group net sales in the third quarter 2014 amounted to 118.5
Year-end report. January-December President s comments. January - December. Fourth quarter
 Year-end report January-December Fourth quarter > Net sales increased during the fourth quarter by 7 percent to SEK 2,204 M (2,059). Net sales increased by 13 percent in local currencies > Operating profit
Interim report. January September President s comments. January - September. Third quarter
 Interim report January September Third quarter > > Net sales increased during the third quarter by 13 percent to SEK 2,253 M (1,997). Net sales increased by 13 percent in local currencies > > Operating
Interim report January 1 September 30, Raw material impact makes quarterly result negative
 Interim report January 1 September 30, Åseda, October 23, Raw material impact makes quarterly result negative Third quarter Turnover MSEK 219.6 (177.6), up 24 percent compared to previous year Operating
Interim Report. January September High sales growth continues with strengthened order book. July September January September 2015
 Q3 Interim Report January September Doro AB Corporate Identity Number 556161-9429 34.5% Net sales growth 6.7% EBIT margin High sales growth continues with strengthened order book July September Net sales
Interim report 1 January 30 September
 Interim report 1 January 30 September 2017 THE INTERIM PERIOD Net revenue totalled SEK 1,231 million (783) Operating profit amounted to SEK 166 million (86) Profit before tax amounted to SEK 150 million
YEAR-END REPORT for the period FULL YEAR Sales increased by 12.2 % to MSEK (MSEK 657.0) EBITDA amounted to MSEK 75.0 (MSEK 75.
 EBITDA amounted to MSEK 75.0 (MSEK 75.") FULL YEAR Sales increased by 12.2 % to MSEK 737.2 (MSEK 657.0) EBITDA amounted to MSEK 75.0 (MSEK 75.5) Profit before tax increased by 1.9 % to MSEK 68.3 (MSEK 67.0) Profit margin before tax amounted to
FULL YEAR Sales increased by 12.2 % to MSEK 737.2 (MSEK 657.0) EBITDA amounted to MSEK 75.0 (MSEK 75.5) Profit before tax increased by 1.9 % to MSEK 68.3 (MSEK 67.0) Profit margin before tax amounted to
Interim report January-September 2017 Published on October 26, 2017
 Interim report January-September 2017 Published on October 26, 2017 Third quarter 2017 Increased sales and strong result Sales increased 7 per cent to 2,936 MSEK (2,742). Operating profit amounted to 470
Interim report January - March First quarter. The group in brief
 Interim report January - March 2017 First quarter Net sales increased by 105% to MSEK 21.1 (10.3) Operating profit declined to MSEK -4.9 (-3.3). Adjusted operating profit* increased to MSEK 1.6 (-3.3)
Micronic Mydata AB (publ) Full year report 2013
 Full year report 2013") Micronic Mydata AB (publ) Full year report 2013 Press release 308E Fourth quarter 2013 Net sales were SEK 325 (481) million EBIT was SEK 42 (119) million Earnings per share were SEK 0.35 (1.28) Outlook
Micronic Mydata AB (publ) Full year report 2013 Press release 308E Fourth quarter 2013 Net sales were SEK 325 (481) million EBIT was SEK 42 (119) million Earnings per share were SEK 0.35 (1.28) Outlook
Interim report. January - March First quarter January - March 2015
 Interim report January - March 2015 April 28, 2015 First quarter January - March 2015 Group net sales in the first quarter 2015 amounted to 144.2 MSEK (113.7), an increase by 26.8 percent compared to the
JANUARY-MARCH Interim Report High order intake and increased sales, plus clear earnings improvement
 ON RSTP FRNT USB PWR CON X1 X5 X9 X2 X3 24-11 V DC X4 X8 1BASE-T X6 X1 X7 X11 X12 M12 Torque.6±,1 Nm /,45±,1 lbft Interim Report 1 218 Video recording DC OPR ERR X1 X2 Signal DC OPR ERR X1 X2 Cloud solution
Smart Eye Interim Report January December 2017
 Smart Eye Interim Report January December 2017 I Summary fourth quarter 2017 Net sales totalled SEK 10,506 (14,574) thousand which corresponds to a drop of 28%. Operating profit/loss totalled SEK 14,814
First quarter of 2018 (Q1 2017) Events during the first quarter of Summary of the first quarter of 2018
 Events during the first quarter of Summary of the first quarter of 2018") Interim report January March 2018 Evolution Gaming Group AB (publ) First quarter of 2018 (Q1 2017) Operating revenues increased by 30% to EUR 51.6 MEUR (39.7) EBITDA increased by 29% to EUR 22.0 million
Interim report January March 2018 Evolution Gaming Group AB (publ) First quarter of 2018 (Q1 2017) Operating revenues increased by 30% to EUR 51.6 MEUR (39.7) EBITDA increased by 29% to EUR 22.0 million
GUNNEBO INTERIM REPORT JANUARY-SEPTEMBER 2014
 Gothenburg, October 23, 2014 GUNNEBO INTERIM REPORT JANUARY-SEPTEMBER 2014 The CEO s comments on the third quarter During the quarter, order intake increased organically by 1% compared with last year.
INTERIM REPORT. 1 January 30 September THE INTERIM PERIOD THE THIRD QUARTER. Important events during the period
 INTERIM REPORT 1 January 30 September 2018 THE INTERIM PERIOD Net revenue totalled SEK 1,495 million (1,23 Operating profit amounted to SEK 173 million (166) Profit before tax amounted to SEK 162 million
Record profit and market growth
 1 28 July 2010 No. 13/10 Record profit and market growth Sales totaled SEK 9,356 M (8,899), an increase of 5%, made up of 2% organic growth, 8% acquired growth and exchange-rate effects of -5%. Growth
Mycronic AB (publ), Interim report January-March 2015
, Interim report January-March 2015") Q1 PRESS RELEASE 339E Mycronic AB (publ), Interim report January-March 2015 About Mycronic Mycronic AB is a high-tech Swedish company engaged in the development, manufacturing and marketing of production
Q1 PRESS RELEASE 339E Mycronic AB (publ), Interim report January-March 2015 About Mycronic Mycronic AB is a high-tech Swedish company engaged in the development, manufacturing and marketing of production
C-RAD AB - CONSOLIDATED YEAR-END REPORT
 C-RAD AB - CONSOLIDATED YEAR-END REPORT JANUARY DECEMBER 2017 PRESS RELEASE JANUARY 31, 2018 POSITIVE RESULT FOR THE FOURTH QUARTER 2017 FOURTH QUARTER 2017 Order intake: 47.5 (41.9) MSEK, +13%. Revenues:
Stable trend and continued preparations for IPO
 OVZON INTERIM REPORT, JANUARY MARCH 2018 Stable trend and continued preparations for IPO JANUARY MARCH 2018 QUARTER Revenue amounted to TSEK 46,311 (49,176) Operating loss totalled TSEK 11,623 (loss: 1,524)
Strong quarter with good margins
 [Skriv här] Boule Diagnostics AB (publ) Interim report January September 2017 Strong quarter with good margins Quarter July September 2017 Net sales amounted to SEK 109.7 million (108.5), up 1.1 percent.
Interim report Q3, July September 2017 Stockholm, 25 October 2017
 Interim report Q3, July September Stockholm, 25 October As of the second quarter of, Cloetta Italia S.r.l. is accounted for as discontinued operation. The comparative figures in the consolidated profit
Interim report 1 January 31 March 2011
 Interim report 1 January 31 March 2011 Net sales for continuing operations increased to SEK 96.7 M (85.4), up approximately 19%. Order bookings rose approximately 34% to SEK 122.9 M (96.4).* During the
Operating profit increased by 34 percent to 50.0 MSEK (37.2). Result after tax increased by 36 percent to 51.4 MSEK (37.7).
. Result after tax increased by 36 percent to 51.4 MSEK (37.7).") Interim report January - June 2018 July 16, 2018 Record figures for sales as well as operating profit Second quarter, April - June 2018 Net sales amounted to 236.1 MSEK (196.3), which is an increase by
Interim report January - June 2018 July 16, 2018 Record figures for sales as well as operating profit Second quarter, April - June 2018 Net sales amounted to 236.1 MSEK (196.3), which is an increase by
Quarterly Report Q1 2018
 Quarterly Report Q1 2018 26 April 2018 The global leader in door opening solutions A good start to the year First quarter Net sales increased by 2% to SEK 18,550 M (18,142), with organic growth of 4% (6)
Interim report 1 May October 2013
 Interim report 1 May 2013 31 October 2013 Second quarter 2013/14 Sales increased by 4 % to 1,678 MSEK (1,614). In local currencies, growth was up 6 % Operating profit increased by 23 % to 126 MSEK (102)
The fast track to the cloud
 Interim Report 3 The fast track to the cloud JANUARY SEPTEMBER The group is reporting a positive operating profit and completing its restructuring with impairment of a holding in its Brazilian associated
Interim Report. July September July- Sept. Sept
 Q3 Interim Report July September Doro AB Corporate Identity Number 556161-9429 18.2% Net sales growth 8.9% EBIT margin Growth in all markets and improved margins July September Net sales amounted to SEK
Clas Ohlson: Year-end report 1 May April 2013
 Clas Ohlson: Year-end report 1 May 2012 30 April 2013 Fourth quarter * Sales totalled SEK 1,274 M (1,272). In local currencies, growth was 3%. * Operating loss of SEK 19 M reported (profit: 10). * Loss
QUARTERLY REPORT Q3/ ANOTO
 Q3/ 2014 2014 ANOTO Anoto Group AB is a global leader in digital writing solutions, which enables fast and reliable transmission of handwriting into a digital format. Anoto operates worldwide through a
Interim report January-June 2016
 Interim report January-June 2016 Unchanged market conditions Net revenues amounted to MSEK 898 (927) for the second quarter and MSEK 1,800 (1,843) for the first half of the year. Profit after net financial
Interim report 1 May January 2014
 Interim report 1 May 2013 31 January 2014 Third quarter 2013/14 Sales increased by 3 % to 2,238 MSEK (2,169). In local currencies, the increase was 7 % Operating profit increased by 34 % to 330 MSEK (247)
Interim report January-September 2018 Published on October 25, 2018
 Interim report January-September 2018 Published on October 25, 2018 Third quarter 2018 Increased sales and higher result Sales increased 17 per cent to 3,443 (2,936). Operating profit increased 12 per
C-RAD AB - INTERIM REPORT Q1
 C-RAD AB - INTERIM REPORT Q1 JANUARY MARCH 2018 PRESS RELEASE APRIL 26, 2018 CONTINUED STRONG GROWTH, REVENUE INCREASED BY 31 PERCENT FIRST QUARTER 2018 Order intake: 50.6 (40.2) MSEK, 26%. Revenues: 33.8
equal to a 19 % (20) operating margin Order intake was SEK 336 m (328), corresponding to an increase of 3 %
 operating margin Order intake was SEK 336 m (328), corresponding to an increase of 3 %") Second quarter Net sales for the second quarter reached SEK 329 m (299), corresponding to an increase of 10 % Operating profit reached SEK 63 m (59) equal to a 19 % (20) operating margin Order intake was
Second quarter Net sales for the second quarter reached SEK 329 m (299), corresponding to an increase of 10 % Operating profit reached SEK 63 m (59) equal to a 19 % (20) operating margin Order intake was
Interim Report. January September Alimak Group AB ALIG, SE
 ALIG, SE715891 Interim Report January September 217 For more information contact: Mathilda Eriksson, IR Manager, Phone: +46 ()8 42 14 41 Stefan Rinaldo, COO and acting CFO, Phone: +46 ()8 42 14 47 2 217
Operating profit for the quarter amounted to MSEK 1 (12). Operating margin was 1 percent (6).
. Operating margin was 1 percent (6).") 3 rd Quarter of Net sales for the third quarter of amounted to MSEK 188 (198), a decrease by 5 percent compared with the corresponding quarter of the previous year. Operating profit for the quarter amounted
3 rd Quarter of Net sales for the third quarter of amounted to MSEK 188 (198), a decrease by 5 percent compared with the corresponding quarter of the previous year. Operating profit for the quarter amounted
INTERIM REPORT 1 JANUARY 30 SEPTEMBER 2011
 INTERIM REPORT 1 JANUARY 3 SEPTEMBER 211 Quarterly period, July to September 211 * Poolia revenues were MSEK 263.8 (245.4), an increase of 7%, which corresponds to 9% in local currency. Operating profit/loss
C-RAD AB - INTERIM REPORT
 C-RAD AB - INTERIM REPORT JANUARY - JUNE 2018 Press release August 17, 2018 PROFITABLE QUARTER, REVENUE INCREASED BY 61 PERCENT SECOND QUARTER 2018 Order intake: 56.4 (49.3) MSEK, 14%. Revenues: 51.9 (32.2)
INTERIM REPORT for the period SIGNIFICANT BUSINESS EVENTS JANUARY-SEPTEMBER Sales increased by 15.6 % to MSEK (MSEK 470.
 JANUARY-SEPTEMBER SIGNIFICANT BUSINESS EVENTS Sales increased by 15.6 % to MSEK 544.1 (MSEK 470.5) EBITDA increased to MSEK 55.1 (MSEK 50.4) Profit before tax increased by 15.0 % to MSEK 49.7 (MSEK 43.2)
Strong online performance and increased margins
 Q3 THIRD QUARTER MARCH 1, 2016 MAY 31, 2016 Strong online performance and increased margins Summary of third quarter of 20 Third quarter Net sales for the quarter rose 3.6 per cent to SEK 1,989 million
SEK M Q Q Change, % 9M M 2017 Change, % Net sales 8,300 7, ,663 23,873 7 Organic sales, %
 Interim report July September A solid quarter Net sales for the third quarter of rose 14 percent to SEK 8,3 M (7,31). Organic sales increased 4 percent. Excluding project deliveries, the corresponding
NEW SPORTS APPAREL COLLECTION
 BJÖRN BORG AB INTERIM REPORT JANUARY - SEPTEMBER NEW SPORTS APPAREL COLLECTION JULY 1 SEPTEMBER 30, The Group s net sales amounted to SEK 180.0 million (191.4), a decrease of 6.0 percent. Excluding currency
RAYSEARCH LABORATORIES AB (PUBL)
") RAYSEARCH LABORATORIES AB (PUBL) INTERIM REPORT JANUARY 1 SEPTEMBER 30, 2014 JANUARY 1 SEPTEMBER 30, 2014 Net sales for the period amounted to SEK 177.4 M (114.4) Profit after tax was SEK 19.1 M (loss:
RAYSEARCH LABORATORIES AB (PUBL) INTERIM REPORT JANUARY 1 SEPTEMBER 30, 2014 JANUARY 1 SEPTEMBER 30, 2014 Net sales for the period amounted to SEK 177.4 M (114.4) Profit after tax was SEK 19.1 M (loss:
Boule Diagnostics AB (publ)
") Boule Diagnostics AB (publ) Year-end report January December 2012 Continued strong sales growth Quarter October December 2012 Net sales totaled SEK 76.3 million (67.7), up 12.7 percent. Changes in the
Boule Diagnostics AB (publ) Year-end report January December 2012 Continued strong sales growth Quarter October December 2012 Net sales totaled SEK 76.3 million (67.7), up 12.7 percent. Changes in the
Yearly. Fourth quarter YEAR-END REPORT 2018 JANUARY - DECEMBER. Net sales for the fourth quarter reached SEK 363 m (301), corresponding to an
, corresponding to an") YEAR-END REPORT JANUARY - DECEMBER Fourth quarter Net sales for the fourth quarter reached SEK 363 m (301), corresponding to an increase of 20 %. Currency translations had a positive effect of SEK 21 m
YEAR-END REPORT JANUARY - DECEMBER Fourth quarter Net sales for the fourth quarter reached SEK 363 m (301), corresponding to an increase of 20 %. Currency translations had a positive effect of SEK 21 m
Avanza Preliminary Financial Statement 2007
 007 Avanza Preliminary Financial Statement 2007 Preliminary Financial Statement 2007 < Operating income increased by 22 per cent (60%) to SEK 557 million (SEK 455 m) < The profit after tax totalled SEK
INCREASED SALES AND SIGNIFICANTLY IMPROVED EARNINGS
 INCREASED SALES AND SIGNIFICANTLY IMPROVED EARNINGS January September 2016 2015 Change (%) Net sales 13,030 9,770 +33 Expenses (31,325) (31,646) +1 EBITDA (11,503) (11,918) +3 EBITDA excluding legal fees
hms networks JANUARY - DECEMBER 2013 Fourth quarter
 hms networks Y E A R - E N D R E P O R T 2 0 1 3 JANUARY - DECEMBER q Net sales for the full year reached SEK 501 m (382), corresponding to a 31 % increase. The revaluation of the Swedish currency had
C-RAD AB - INTERIM REPORT
 C-RAD AB - INTERIM REPORT JANUARY - SEPTEMBER 2018 Press release October 26, 2018 C-RAD REPORTS ALL-TIME HIGH IN QUARTERLY ORDER INTAKE THIRD QUARTER 2018 Order intake: 64.2 (55.5) MSEK, 16%. Revenues:
In the third quarter, Byggmax increased net sales by 4.5 percent and EBIT improved and amounted to SEK 175 M
 Interim report January - September 2014 In the third quarter, Byggmax increased net sales by 4.5 percent and EBIT improved and amounted to SEK 175 M July 1 - September 30 Net sales amounted to SEK 1,228.1
REPORT ON THE THIRD QUARTER 2017
 REPORT ON THE THIRD QUARTER 217 NET SALES 3,399 (3,142) OPERATING PROFIT (EBIT) 648 (426) OPERATING CASH FLOW 667 (535) THIRD QUARTER FIRST NINE MONTHS Net sales for the quarter totaled SEK 3,399 million
Scania Interim Report January September 2013
 23 October 2013 Scania Interim Report January September 2013 Summary of the first nine months of 2013 Operating income fell to SEK 5,939 m. (6,135), and earnings per share fell to SEK 5.30 (5.94) Net sales
Very strong license sales
 Interim Report JANUARY MARCH 214 Very strong license sales License revenue for January-March increased with 27 percent to SEK 53.4 (42.) million Sales for January-March increased with 9 percent to SEK
Instrument sales remain strong
 [Skriv här] Boule Diagnostics AB (publ) Interim report January March 2017 Instrument sales remain strong Quarter January March 2017 Net sales amounted to SEK 106.6 million (84.4), up 26.3 percent. Adjusted
Scania Interim Report January September 2016
 28 October 2016 Scania Interim Report January September 2016 Summary of the first nine months of 2016 Operating income amounted to SEK 3,733 m. (7,046), and was negatively impacted by a provision of SEK
CONTINUED GROWTH AND EARNINGS IMPROVEMENT FOR ASSA ABLOY
 August 9 2007 No 13/07 CONTINUED GROWTH AND EARNINGS IMPROVEMENT FOR ASSA ABLOY Sales in the second quarter increased by 8% to SEK 8,329 M (7,689), with 7% organic growth, 5% acquired growth and exchange-rate
ri december 2009 Interim Report
 ri december 2009 Interim Report January March 2010 Interim Report January March 2010 Total income amounted to SEK 9.7 m (35.7) or, excluding the sale of the VoIP patent in 2009, SEK 9.7 m (4.3). Sales
A good start to the year. Regulatory Story. First quarter. RNS Number : 2060M ASSA ABLOY AB (publ) 26 April Organic growth +4%
 26 April Organic growth +4%") Regulatory Story Go to market news section ASSA ABLOY AB (publ) - 77BL Released 08:33 26-Apr-2018 1st Quarter Results RNS Number : 2060M ASSA ABLOY AB (publ) 26 April 2018 Organic growth +4% Operating
Regulatory Story Go to market news section ASSA ABLOY AB (publ) - 77BL Released 08:33 26-Apr-2018 1st Quarter Results RNS Number : 2060M ASSA ABLOY AB (publ) 26 April 2018 Organic growth +4% Operating
Year-end report Strong end to the year
 Year-end report 2016 Strong end to the year Net revenues amounted to MSEK 887 (841) for the quarter and MSEK 3,528 (3,522) for the full year. Profit after net financial items totaled MSEK 113 (113) for
Ework commences year on-track
 Interim report Q1 2018 Ework commences year on-track First Quarter 2018 compared to Net sales increased by 10% to SEK 2,623 M (2,389). EBIT was down by 18% to SEK 22.5 M (27.4). Order intake fell by 5%
Investments and adaptations for the future one-off costs impacting the result
 Interim report January 1 September 30, 2017 Odd Molly International AB (publ) Stockholm, Sweden, October 24, 2017 Investments and adaptations for the future one-off costs impacting the result JULY 1 SEPTEMBER
Interim report January 1 December 31, 2015 Further increase in sales and stronger profitability
 Odd Molly International AB (publ) Stockholm, Sweden, February 18, 2016 Interim report January 1 December 31, 2015 Further increase in sales and stronger profitability January 1 December 31, 2015 Net sales
Good performance in a weak market
 1 7 February 2013 No. 2/13 Good performance in a weak market Fourth quarter Sales increased by 4% in the quarter, with 0% organic growth, and totaled SEK 12,239 M (11,744). Good growth in Americas and
April-June January-June Important events during the second quarter. Important events after the end of the period
 April-June 2014 Consolidated revenue for the period is 40 635 (21 822) ksek, an increase of 86% compared to the same period 2013. Operating result for the period is 2 353 (3 387) ksek. Excluding re-listing
FULL YEAR REPORT 2016
 FULL YEAR REPORT 2016 THE FULL YEAR AND THE FOURTH QUARTER o Net sales amounted to MSEK 347.3 (69.1), whereof the fourth quarter MSEK 96.5 (57.4) o EBITDA was MSEK 51.7 (-71.7), whereof the fourth quarter
hms networks First quarter Last twelve months INTERIM REPORT 2017 JANUARY - MARCH
 hms networks INTERIM REPORT JANUARY - MARCH Last twelve months Net sales for the last twelve months amounted to SEK 1 030 m (732) corresponding to a 37 % increase in local currencies. The revaluation of
Interim report January September Satisfactory progress in Q3
 Interim report January September 2013 Satisfactory progress in Q3 Quarter 3 Incoming orders amounted to SEK 641.4m (420.5), which after adjustments is an increase of 7.0%* compared with the same period
Year-end Report January 1 December 31, 2010
 Year-end Report January 1 December 31, 2010 Press release, February 14, 2011 Sales grew 22 percent in the fourth quarter with cash flow of SEK 103 m Highlights of the fourth quarter of 2010: Net sales
Strong performance online, tougher in brickand-mortar
 Interim report January 1 June 30, 2017 Odd Molly International AB (publ) Stockholm, Sweden August 16, 2017 Strong performance online, tougher in brickand-mortar stores APRIL 1 JUNE 30, 2017 Total operating
Growth in network video continues
 Interim report January June Growth in network video continues Net sales during the period amounted to SEK 540 M (401). Operating profit during the period totaled SEK 81 M (55). Profit before tax during
Summary of the fourth quarter and full-year 2017
 Year-end report January December 2017 Evolution Gaming Group AB (publ) Fourth quarter of 2017 (Q4 2016) Operating revenues increased by 48% to EUR 50.7 million (34.3) EBITDA increased by 74% to EUR 22.6
INTERIM REPORT 1 JANUARY 30 SEPTEMBER 2013
 INTERIM REPORT 1 JANUARY 30 SEPTEMBER 2013 Quarterly period July-September Poolia's revenue amounted to SEK 178.2 (217.8) million, a decline of 18.2% (18.5% in local currency). Operating profit/loss was
Very strong quarter for Medical Solutions
 Nolato AB nine-month interim report 218, page 1 of 21 Nolato AB (publ) nine-month interim report 218 Very strong quarter for Medical Solutions Third quarter of 218 in brief Sales increased to SEK 1,98
P R E S S R E L E A S E
 P R E S S R E L E A S E from ASSA ABLOY AB (publ) 2 November 2004 No. 12/04 ASSA ABLOY: CONTINUED STRONG ORGANIC GROWTH IN THE THIRD QUARTER Sales in the third quarter increased organically by 6% to SEK
Year-end report President s comments
 Year-end report Net sales during the year amounted to SEK 2,933 M (2,301), and sales amounted to SEK 875 M (659) for the fourth quarter. Operating profit for the year totaled SEK 415 M (308), and operating
YEAR-END REPORT JANUARY 1 DECEMBER 31, YEAR-END REPORT / ORC GROUP HOLDING AB (PUBL)
") YEAR-END REPORT JANUARY 1 DECEMBER 31, 2014 1 YEAR-END REPORT / ORC GROUP HOLDING AB (PUBL) JANUARY 1 DECEMBER 31, 2014 YEAR-END REPORT JANUARY 1 DECEMBER 31, 2014 2 STABLE FINANCIAL RESULT AND STRATEGIC
YEAR-END REPORT JANUARY 1 DECEMBER 31, 2014 1 YEAR-END REPORT / ORC GROUP HOLDING AB (PUBL) JANUARY 1 DECEMBER 31, 2014 YEAR-END REPORT JANUARY 1 DECEMBER 31, 2014 2 STABLE FINANCIAL RESULT AND STRATEGIC
Interim report January September 2018
 Handicare Group AB (publ) Ingmar Bergmans gata 4 SE-114 34 Stockholm, Sweden Tel: +46 8 523 281 00 Corp. Reg. No.: 556982-7115 www.handicaregroup.com Interim report January September 2018 Low organic growth
IAR Systems Group AB Interim report January-June IAR Systems Group AB Interim report January-March 2017
 IAR Systems Group AB Interim report January-June 217 IAR Systems Group AB Interim report January-March 217 IAR Systems Group AB Interim report January-June 217 Q1 Q2 Strong recovery in Asia and stable
GROSS PROFIT GROWTH OF 24.5 PERCENT AND SUBSTANTIALLY IMPROVED EBIT
 Interim Report Nepa AB (publ) Q3 2018 GROSS PROFIT GROWTH OF 24.5 PERCENT AND SUBSTANTIALLY IMPROVED EBIT This is a translation of the Swedish interim report. If there should be any discrepancies, the
Year-end Report 2016 January - December YEAR-END REPORT 2016 OCTOBER DECEMBER 2016 JANUARY DECEMBER 2016 TROAX GROUP FIGURES
 Year-end Report 2016 January - December Troax Group AB (publ) Hillerstorp 14th February, 2017 YEAR-END REPORT 2016 OCTOBER DECEMBER 2016 Order intake increased by 21 per cent, or 26 per cent adjusted for
Year-end report 1 January 31 December 2011
 Year-end report 1 January 31 December 2011 Net sales rose about 18%* to SEK 414 M (358). Order bookings amounted to SEK 414 M (376), up approximately 13%*. Operating profit amounted to SEK 22.6 M (22.9).
FINANCIAL INFORMATION IN BRIEF
 INTERIM REPORT 1 January 30 September 2016 FINANCIAL INFORMATION IN BRIEF Third quarter: 1 July-30 September 2016 Sales for the third quarter amounted to SEK 0.6 (1.0) million. Operating result in the
Record high first-half earnings
 Interim report January June Record high first-half earnings Net sales during the period amounted to SEK 401 M (320). Operating profit for the period totaled SEK 55 M (3). Profit before tax was SEK 55 M
Ework finishes 2017 strongly
 Year-End Report Q4 January- Ework finishes strongly Fourth quarter compared to the corresponding period of Net sales increased by 17% to SEK 2,714 M (2,320). EBIT for the period was up by 23% to SEK 36.0
Solid underlying development in the fourth quarter
 Interim Report Q4 2016 Full-year summary 2016 2 February 2017 The global leader in door opening solutions Solid underlying development in the fourth quarter Fourth quarter Sales increased by 6% to SEK