Press release 26 October, 2018
|
|
|
- Christopher Nash
- 5 years ago
- Views:
Transcription
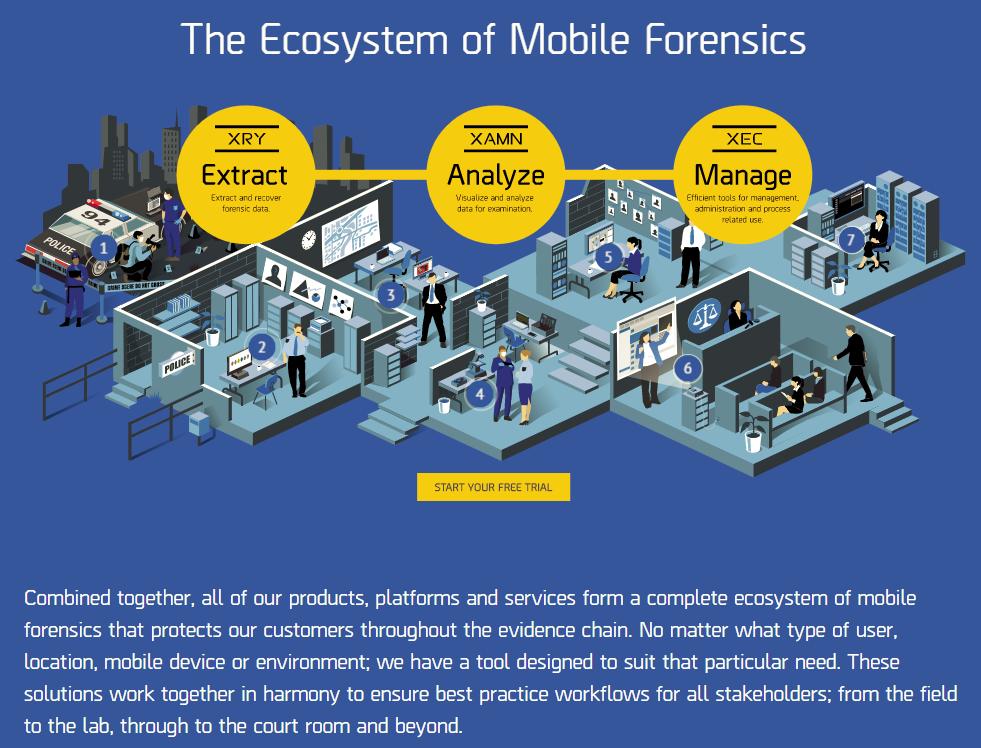
1 Press release 26 October, 2018 Net sales increased 0.4 percent to SEK (216.9) million (-2 percent in local currencies). EBIT for the year amounted to SEK 24.0 (51.9) million. The EBIT margin reached 11.0 (23.9) percent. Profit after tax amounted to SEK 20.4 (38.8) million. Earnings per share were SEK 1.10 (2.12). Cash flow from operating activities amounted to SEK (-2.7) million. Cash and cash equivalents and short-term investments amounted to SEK 70.5 (76.3) million at the end of the period. Net sales declined 12.4 percent to SEK 89.4 (102.0) million (-19 percent in local currencies). EBIT amounted to SEK 20.1 (40.0) million. The EBIT margin reached 22.5 (39.2) percent. Profit after tax amounted to SEK 14.7 (30.4) million. Earnings per share were SEK 0.79 (1.65). Cash flow from operating activities amounted to SEK (-1.0) million. MSAB is a world leader in mobile forensics technology with the aim of extracting and analysing data from confiscated mobile devices, mainly from mobile phones. The company has its own sales offices and sales representatives in Europe, North America, South America, China, Australia, Singapore, Japan and Russia, and together with a number of distributors, covers most of the world. The proprietary products have become a de facto standard in the field and are used for securing evidence in more than 100 countries. These products are complemented by a wide range of training courses with the possibility of becoming certified in a forensically sound methodology. Customers are primarily law enforcement agencies, such as police, military and customs. MSAB is listed on NASDAQ Stockholm under the ticker symbol: MSAB B. 1
2 Sales amounted to SEK (216.9) million for the first nine months of the year. EBIT amounted to SEK 24.0 (51.9) million, corresponding to an EBIT margin of 11.0 (23.9) percent. Sales for the quarter amounted to SEK 89.4 (102.0) million. Only once has the company demonstrated a higher quarterly revenue, which was for the corresponding quarter of 2017 where a single major order from Germany influenced heavily. Lower sales in this year's third quarter and continued investments for future growth affected earnings for the quarter, which amounted to SEK 20.1 (40.0) million. The market for mobile forensics is evolving and changing rapidly. A major growth area is what we call Frontline, i.e. solutions intended to decentralize the ability of police to assimilate digital evidence - an ability that must be as close to the scene of the crime in time and space as possible. A popular expression within law enforcement is "the critical first 48 hours", i.e., securing relevant evidence within this timeframe increases the likelihood of solving the crime by as much as 50 percent. Today, virtually all suspects have a mobile phone or some other type of digital device. This is also where most of the crucial evidence is found. Thus, a decentralization of expertise to take advantage of digital evidence is a must for police to do their job with good results. We see our customers' awareness of this need increasing. This is also reflected in our sales. The proportion of new sales in the Frontline category is highly significant as compared to just a few years ago. At the same time we are convinced that we have only scratched the surface of our customers' needs for these solutions. We have surveyed cities the size of Stockholm and larger around the globe, and can state that only a fraction of these have implemented some form of decentralised solution for securing digital evidence. It is our firm belief that we can make the police far more effective in their fight against crime by helping them with Frontline solutions. A good example is the London Metropolitan Police who invested early in our Kiosk solution and have been successfully using it to make London a safer place for years. This development is not news for MSAB. Our product mix in the MSAB Ecosystem family is well-designed to meet market demands. MSAB's core competence is the capacity to unlock, extract and decrypt information in digital devices. This expertise can be found in our XRY software, which has been well-established in forensic labs over most of the world for several years. Our Frontline solutions consist of the same core products, packaged in a user-friendly platform which can be used by almost any police officer. We call these solutions Kiosk, Tablet and XRY Express. A couple other examples of customers who have ordered these products are the French Gendarmerie Nationale, which we announced in July, and a major order from Germany in the third quarter of As mentioned earlier, time is of the essence when it comes to securing critical evidence. To do this efficiently and to be the best globally, we have now launched the fastest and most advanced version of XAMN ever. With XAMN 4.0, our customers can quickly and in a legally secure way work with evidence from mobile phones with a level of efficiency that has never before been achieved. MSAB's solutions meet a challenge that no law enforcement agency can resist. Our view is that it is only a matter of time before all police operations around the world will need some form of Frontline solution. This implies that geographic expansion is another important vertical in MSAB's future growth. In addition to EMEA and North America, MSAB has been established for a number of years in Asia with subsidiaries in China, Singapore, Australia and, most recently, Japan. We intend to continue our establishment and expansion country by country. We are continuing to invest in our organisation. On one hand, we invest continuously in our product offering, while at the same time expanding our sales and marketing activities in existing markets, but mainly in new geographic areas where we see potential. Synonymous for all our investments is that they are completely focused on and intended to maximize the great growth potential we see in the markets where we are active. Often the investments come first, with results in terms of growth following later, which leads to a temporary weakening of the company's results. It is important to note that what we sell primarily is a license to use our software. This means that our business model is scalable, which proves itself in the third quarter with a level of sales that takes us to an EBIT margin over 20 percent. Furthermore, our customers to a large extent renew their licenses, which ensures a high degree of recurring revenues. As CEO of MSAB, I am optimistic about the future and our opportunities for growth, but this does not, however, free us from challenges nor the need for investments where the effect is somewhat delayed. I am convinced that what we do is so important and necessary for law enforcement authorities that I cannot be anything but positive, not just about how we contribute to society, but also for our own opportunities for growth in the future. Stockholm, October 2018 Joel Bollö Chief Executive Officer 2


 growth is good in southeast Asia and Australia but clearly weaker in China,")

3 EMEA and Latin America sales for the region declined slightly compared with last year, mainly due to the exceptionally large German order received last year. The order from the French Gendarmerie Nationale for Frontline solutions is the most substantial, but sales in the UK and the Nordic countries were also stable during the period. During the quarter, an updated version of XRY was released, including support for ios 12. Support is now available for the extraction of data from approximately 25,000 mobile devices. North America sales for the region are basically the same as the previous year. We have seen a tendency to spread federal purchasing out over the year a little more than in the past where most purchasing occurred during the third quarter. Asia and CIS (Commonwealth of Independent States) growth is good in southeast Asia and Australia but clearly weaker in China, which means that overall the region is growing compared to the previous year. Sales are basically the same as for the previous year. Increased sales of Frontline solutions will have a positive impact on sales of training. During the quarter, training online and on demand was launched, which means part of training revenues will be fully scalable. Sales of training products for the period represented 8 (8) percent of total sales. In July, the company announced a new order from the French Gendarmerie Nationale. The order value is approximately SEK 12 million with delivery in the third quarter and an impact on revenues in the quarter of about SEK 10 million. 3
 million for the quarter and SEK 26.2 (17.")

 million for the quarter and SEK 115.7 (97.9) million for the period.")
 million, corresponding to an EBIT margin of 22.5 (39.2) percent. EBIT for the period amounted to SEK 24.0 (51.9) million, corresponding to an EBIT margin of 11.0 (23.9) percent.")

 million for the quarter and SEK -23.7 (-2.7) million for the period.")
4 Consolidated net sales declined 12.4 percent during the quarter to SEK 89.4 (102.0) million and increased 0.4 percent for the period to SEK (216.9) million. In local currencies, net sales declined 19 percent for the quarter and 2 percent for the period. Expenses for goods for resale amounted to SEK 11.0 (11.4) million for the quarter and SEK 26.2 (17.3) million for the period. Direct expenses are dependent on the product mix sold, where a higher proportion of mainly Field version entails higher costs, as was the case in the first quarter of the year. Other external expenses amounted to SEK 17.7 (14.8) million for the quarter and SEK 51.1 (49.0) million for the period. Personnel expenses amounted to SEK 40.3 (35.6) million for the quarter and SEK (97.9) million for the period. Increased expenses for the quarter and the period are mainly attributable to investments in personnel related to product and market to promote further growth. EBIT for the quarter amounted to SEK 20.1 (40.0) million, corresponding to an EBIT margin of 22.5 (39.2) percent. EBIT for the period amounted to SEK 24.0 (51.9) million, corresponding to an EBIT margin of 11.0 (23.9) percent. Net financial income/expense amounted to SEK -0.6 (-0.6) million for the quarter and SEK 2.9 (-0.9) million for the period. Net financial income/expense consisted primarily of revaluation of cash and cash equivalents in foreign currencies. Revenues and expenses are matched in the same currencies to the extent possible. Profit after tax for the quarter was SEK 14.7 (30.4) million and SEK 20.4 (38.8) million for the period. The equity/assets ratio at the end of the period was 55.2 (52.2) percent. Cash flow from operating activities amounted to SEK (-1.0) million for the quarter and SEK (-2.7) million for the period. The negative cash flow is attributable to a weaker result and that the largest proportion of sales took place at the end of the quarter and are thus not yet booked. During the period, dividends amounting to SEK 40.4 (40.4) million were paid out and options were converted to shares in the amount of SEK 5.9 million. Cash and cash equivalents at the end of the period amounted to SEK 70.5 (76.3) million. Both consolidated sales and profit tend to fluctuate from quarter to quarter, mainly due to our customers' purchasing patterns and individual larger orders. This is illustrated in the chart below, which clearly shows a large variation between individual quarters in terms of sales, and given the company's relatively fixed cost base, this leads to a corresponding variation in profit. The trend over a one-year period shows steadier and more stable patterns. The comparison between 2017 and 2018 in this report is impacted significantly by a single large order in the third quarter of The number of employees in the Group at the end of the period was 165 (139). The average number of employees was 149 (131). 4
5 MSAB is not dependent on the seasons in the sense that is normally meant by the term seasonal effects. However, the majority of the company's customers have a purchasing pattern that follows their budget period. Budget periods differ between countries, but most common is that they follow the calendar year or end on 30 September. This has historically been reflected in sales in such a way that the second half of the year is stronger than the first half. The Group s activities expose it to risks and uncertainty factors. Information on risks and uncertainties other than currency exposure due to foreign subsidiaries and the fact that most invoicing in Sweden is denominated in foreign currencies can be found in more detail in the 2017 Annual Report. The Annual Report is available on the Company s website. This interim report has been prepared for the Group in accordance with the Swedish Annual Accounts Act and IAS 34 Interim Financial Reporting, and for the Parent Company in accordance with the Swedish Annual Accounts Act and the Swedish Financial Reporting Board s recommendation RFR 2 Accounting for Legal Entities. Information as per IAS 34 Interim Financial Reporting is provided in notes as well as in other places throughout this interim report. The accounting principles adopted for the Group and the Parent Company are consistent, unless stated below, with the accounting principles used to prepare the most recent annual report. From January 1, 2018, IFRS 15, Revenue from Contracts, has been applied. As reported earlier, this principle does not entail any substantial changes with respect to when in time the Company's revenue is reported. The new standard has had some impact on the proportion of revenues that accrue depending on contract length (1 3 years), where the percentage accrued for a one-year contract has increased but decreased for two- and three-year contracts. The structure of the contract at the date of transition entails no significant difference on when revenue is recognised. Thus, IFRS 15 only entails extended disclosure requirements. The Group has applied IFRS 15 retroactively for The Group also applies IFRS 9, which has not impacted financial statements. The new standard IFRS 16 Leases, which replaces the current IAS 17, enters into force 1 January, The company's assessment is that this new standard will have no significant impact on the Company s results. Essentially, commitments regarding a few leases will be reported as both liabilities and assets in the balance sheet. The AGM will be held in Stockholm on 15 May, Shareholders who wish to have an issue addressed at the AGM must submit a written proposal by 6 February, 2019 to guarantee the matter s inclusion in the Notice of the AGM. The Nomination Committee consists of Chairman Erik Hermansson (Humle Kapitalförvaltning AB), and committee members Henrik Tjernberg and Joakim Dal (Edastra Venture Capital AB). The Nomination Committee is tasked with proposing candidates for AGM Chairman, Board members, Chairman of the Board and Auditors, as well as Board and Auditor remuneration and proposals for Nomination Committee procedures. The Parent Company's net sales for the period amounted to SEK (159.9) million. EBIT for the period amounted to SEK 19.6 (42.7) million. Investments during the period amounted to 1.0 (0.6) million, which were for the most part IT-related. The number of employees in the Parent Company was 123 (101) at the end of the period. No related party translations occurred during the period other than transactions covered within the framework of approved incentive programmes. 1 February, 2018 Year-end report 2018 The information in this report is such that MSAB, Corporate ID number , is required to disclose in accordance with the EU s Market Abuse Regulation. The information in this report was submitted for publication on 26 October, 2018 at 08:00 CEST through the offices of the contact person listed below. This report and previous financial reports and press releases are available on the company's website Questions should be addressed to: Chief Executive Officer Joel Bollo Tel joel.bollo@msab.com 5
6 The under-signed certify that this interim report provides, in accordance with current regulations, a fair and true overview of the Parent Company s and Group s operations, financial position and earnings, as well as describing the significant risks and uncertainty factors to which the Parent Company and the subsidiaries that comprise the Group are exposed. Stockholm, 26 October, 2018 Corporate ID number Henrik Tjernberg Joel Bollö Robert Ahldin Chairman of the Board Chief Executive Officer Board member Jan-Olof Backman Carl Bildt Katarina G. Bonde Board member Board member Board member Introduction We have conducted a review of the interim report for Micro Systemation AB (publ) for the period from 1 January, 2018 to 30 September, The Board of Directors and the Chief Executive Officer are responsible for the preparation and presentation of this interim report in accordance with IAS 34 and the Swedish Annual Accounts Act. Our responsibility is to express a conclusion on this interim report based on our review. Focus and scope of the review We conducted our review in accordance with International Standard on Review Engagements ISRE 2410 Review of interim Financial Information performed by MSAB s chosen independent auditor. A review consists of making enquiries, primarily of persons responsible for financial and accounting matters, and applying analytical and other review procedures. A review has a different focus and is substantially less in scope than an audit conducted in accordance with International Standards on Auditing (ISA) and other generally accepted auditing standards in Sweden. The procedures performed in a review do not enable us to obtain assurance that we would become aware of all significant matters that might be identified in an audit. Thus, conclusions based on a review do not give the same level of assurance as conclusions based on an audit. Conclusion Based on our review, nothing has come to our attention that causes us to believe that the interim report has not been prepared, in all material respects, in accordance with IAS 34 and the Swedish Annual Accounts Act and for the Parent Company in accordance with the Swedish Annual Accounts Act. Stockholm, October 26, 2018 Deloitte AB Erik Olin Certified Public Accountant 6
7 Jul-Sept Jan-Sept 12 months Full year MSEK Oct-Sept 2017 Net sales Cost of goods sold Other external costs Personnel costs Depreciation of fixed assets Total operating cost Operating profit - EBIT Financial income Financial expenses Profit/loss before tax Tax Net pr ofit/ loss after tax Jul-Sept Jan-Sept 12 months Full year MSEK Oct-Sept 2017 Net profit/loss after tax Currency translation differences Tax on currency translation differences Total com pr ehensive incom e Comprehensive income for the period attributable to the shareholders of the parent company , Jul-Sept Jan-Sept 12 months Oct-Sept 2017 Revenue growth, % EBIT-margin, % Cash flow from operating activities per share, SEK Return on equity, % Return on capital employed, % Equity per share, SEK Earnings per share, basic, SEK Earnings per share, diluted, SEK Average number of shares, basic, million Average number of shares, diluted, million
8 30-sep Dec-31 MSEK ASSETS Intangible assets Tangible assets Deferred tax asset Other long term asset Total non-current assets Inventories Accounts receivable - trade Current tax asset Other current assets Cash and cash equivalents Total current assets TOTAL ASSETS EQUITY AND LIABILITIES Equity Accounts payable - trade Current tax liability Other current liabilities Total current liabilities TOTAL EQUITY AND LIABILITIES sep Dec-31 MSEK Opening balance Profit/loss for the period Issue of share option rights Conversion of share option rights Dividend Equity at the end of the period
9 Jul-Sept Jan-Sept 12 months MSEK Oct-Sept 2017 Cash flow before working capital changes Working capital changes Cash flow from operating activities Investments in fixed assets Cash flow from investing activities Dividend paid to shareholders Premium received/conversion of share option rights Cash flow from financing activities Cash flow for the period Cash at the beginning of the period Exchange rate difference in cash Cash at the end of the period MSEK Jan-Sep 2018 Asia & CIS EMEA & Latin America North America Total Product sales Training & other services Total Recognized at a certain point in time Recognized over time Total MSEK Jan-Sep 2017 EMEA & Latin Asia & CIS America North America Total Product sales Training & other services Total Recognized at a certain point in time Recognized over time Total Q3 Q2 Q1 Q4 Q3 Q2 Q1 Q4 Q3 Q2 Q1 Q4 Q3 Q2 Q1 Net sales, MSEK EBIT, MSEK EBIT-margin, % Earnings per share, SEK Return on equity, % Return on capital employed, % Equity ratio, % Cash flow from operations/per share, SEK Equity per share, SEK
10 The Company presents certain financial metrics in the interim report that are not defined under IFRS. The Company believes that these metrics provide useful supplemental information to investors and the Company's management as they allow for the evaluation of the Company's performance.the key ratios are further described in the 2017 annual report. EBIT Earnings before interest and taxes. EBIT margin EBIT in relation to net sales. Earnings per share * Profit/loss after tax in relation to average number of outstanding shares after dilution. Return on equity Profit/loss after tax in relation to average adjusted equity. Return on capital employed EBIT plus financial items in relation to average capital employed. Equity ratio Equity in relation to total assets. Cash flow from operations/per share Cash flow from operations in relation to average number of outstanding shares after dilution. Equity per share Equity in relation to outstanding shares at the end of the period. Average adjusted equity Average of equity during 12 months-period. Opening plus closing shareholders' equity divided by two. Capital employed /average capital employed Capital employed is calculated as total assets less non- interest-bearing liabilities. Average capital employed is calculated as capital employed over a 12 months period. Capital employed at beginning of period plus capital employed at end of period divided by two. Revenue growth, % Sales current period in relation to same period prior year Net financial items Net of financial income and expenses * Defined in line with IFRS Reconciliations of measurements that are not defined under IFRS Q3 Q2 Q1 Q4 Q3 Q2 Q1 Q4 Q3 Q2 Q1 Q4 Q3 Q2 Q1 Total assets, MSEK , Accounts payables, MSEK , , Tax liabilities, MSEK Other liabilities, MSEK , Capital employed, MSEK Average capital employed, MSEK
11 Jan-Sept MSEK Net sales Cost of goods sold Other external costs Personnell costs Depreciation of fixed assets Total operating cost Operating profit - EBIT Net financial items Profit/loss before tax Tax Net pr ofit/loss after tax Jan-Sept MSEK Net profit/loss after tax Total comprehensive income
12 Sept-30 MSEK ASSETS Intangible assets Tangible assets Shares in group companies Other long term asset Total fixed assets Inventories Accounts receivable - trade Other current assets Cash and cash equivalents Total current assets TOTAL ASSETS EQUITY AND LIABILITIES Share capital Share premium Restricted equity Statutory reserve Profit brought forward Non-restricted equity Total equity Accounts payable - trade Current tax liability Other current liabilities Total current liabilities TOTAL EQUITY AND LIABILITIES
13 13
Press Release 20 October, 2017
 Press Release 20 October, 2017 Net sales increased 42.5 percent to SEK 102.0 (71.6) million (43.7 percent in local currencies) EBIT increased to SEK 40.0 (23.3) million The EBIT margin reached 39.2 (32.5)
Press release 21 July, 2017
 Press release 21 July, 2017 Net sales increased 14 percent to SEK 59.5 (52.0) million (11 percent in local currencies) EBIT decreased to SEK 6.0 (8.5) million The EBIT margin reached 10.2 (16.3) percent
INTERIM REPORT 1 JANUARY 30 SEPTEMBER 2013
 INTERIM REPORT 1 JANUARY 30 SEPTEMBER 2013 Quarterly period July-September Poolia's revenue amounted to SEK 178.2 (217.8) million, a decline of 18.2% (18.5% in local currency). Operating profit/loss was
Shareholders in MICRO SYSTEMATION AB (publ)
") Shareholders in MICRO SYSTEMATION AB (publ) are hereby given notice to attend the Annual General Meeting (AGM) on Wednesday, 10 May, 2017 at 18.00 in Gällöfsta City's premises at Biblioteksgatan 29 in
Shareholders in MICRO SYSTEMATION AB (publ) are hereby given notice to attend the Annual General Meeting (AGM) on Wednesday, 10 May, 2017 at 18.00 in Gällöfsta City's premises at Biblioteksgatan 29 in
Summary of the third quarter and first nine months of 2017
 Interim Report January September 2017 Evolution Gaming Group AB (publ) Third quarter of 2017 (Q3 2016) Operating revenues increased by 56% to EUR 45.7 million (29.2) EBITDA increased by 103% to EUR 21.8
Boule Diagnostics AB (publ) Interim report January September Earnings more than doubled and continued sales success
 Interim report January September Earnings more than doubled and continued sales success") Boule Diagnostics AB (publ) Interim report January September 2016 Earnings more than doubled and continued sales success Quarter July September 2016 Net sales amounted to SEK 108.5 million (88.8), up 22.2
Boule Diagnostics AB (publ) Interim report January September 2016 Earnings more than doubled and continued sales success Quarter July September 2016 Net sales amounted to SEK 108.5 million (88.8), up 22.2
INTERIM REPORT 1 JANUARY 31 MARCH 2017
 INTERIM REPORT 1 JANUARY 31 MARCH 2017 Quarterly period January-March Reported revenue, earnings, cash flow and financial ratios relate to continuing operations, and do not include Poolia UK. Poolia s
Interim report. January - September President s comments. Third quarter. January - September
 Interim report January - September Third quarter > Net sales increased by 20 percent during the third quarter to SEK 2,695 M (2,253). Net sales increased by 13 percent in local currencies. > Operating
INTERIM REPORT 1 JANUARY 31 MARCH 2018
 INTERIM REPORT 1 JANUARY 31 MARCH 2018 Quarterly period January-March Poolia s revenue amounted to SEK 200.4 (199.2) million. Operating profit amounted to SEK 4.8 (7.0) million, with an operating margin
Operating profit increased by 44 percent to 27.2 MSEK (19.0). Result after tax increased by 52 percent to 27.7 MSEK (18.3).
. Result after tax increased by 52 percent to 27.7 MSEK (18.3).") Interim report January-September 2016 November 10, 2016 Third quarter Net sales amounted to 167.0 MSEK (149.7), an increase by 11.6 percent compared to the corresponding quarter last year. At comparable
Interim report January-September 2016 November 10, 2016 Third quarter Net sales amounted to 167.0 MSEK (149.7), an increase by 11.6 percent compared to the corresponding quarter last year. At comparable
Continued margin improvements (All figures in brackets refer to the corresponding period in 2009)
") Continued margin improvements (All figures in brackets refer to the corresponding period in 2009) Sales for the third quarter amounted to SEK 3,228 million (3,568). Organic growth was negative 1 per cent.
Continued margin improvements (All figures in brackets refer to the corresponding period in 2009) Sales for the third quarter amounted to SEK 3,228 million (3,568). Organic growth was negative 1 per cent.
INTERIM REPORT 1 JANUARY 30 SEPTEMBER 2011
 INTERIM REPORT 1 JANUARY 3 SEPTEMBER 211 Quarterly period, July to September 211 * Poolia revenues were MSEK 263.8 (245.4), an increase of 7%, which corresponds to 9% in local currency. Operating profit/loss
BTS Group AB reports continued strong growth in both turnover and results
 BTS Group AB (publ) Interim Report 1 January 30 September 2005 BTS Group AB reports continued strong growth in both turnover and results During the nine-month period, net turnover rose by 34 per cent and
INTERIM REPORT 1 JANUARY 31 MARCH 2015
 INTERIM REPORT 1 JANUARY 31 MARCH 2015 Quarterly period January-March, continuing Reported revenue, earnings, cash flow and financial ratios relate to continuing, and do not include Poolia UK. Revenue
C-RAD AB - CONSOLIDATED YEAR-END REPORT
 C-RAD AB - CONSOLIDATED YEAR-END REPORT JANUARY DECEMBER 2017 PRESS RELEASE JANUARY 31, 2018 POSITIVE RESULT FOR THE FOURTH QUARTER 2017 FOURTH QUARTER 2017 Order intake: 47.5 (41.9) MSEK, +13%. Revenues:
INTERIM REPORT 1 JANUARY 31 MARCH 2012
 INTERIM REPORT 1 JANUARY 31 MARCH 2012 Quarterly period January-March Poolia's operating income amounted to SEK 276.7 (283.6), million, which is a decline of -2.4%, (-2.6% in local currency). Operating
Interim report. January - September Interim report for the period January - September Third quarter, July - September 2015
 Interim report January - September 2015 October 30, 2015 Interim report for the period January - September 2015 Third quarter, July - September 2015 Group net sales in the third quarter 2015 amounted to
QUARTERLY REPORT Q3/ ANOTO
 Q3/ 2014 2014 ANOTO Anoto Group AB is a global leader in digital writing solutions, which enables fast and reliable transmission of handwriting into a digital format. Anoto operates worldwide through a
Biotage continues to grow with increased profitability
 Interim report January-September 2018 November 6, 2018 Biotage continues to grow with increased profitability Third quarter, July - September 2018 Net sales amounted to 232.2 MSEK (177.7), which is an
Micronic Mydata AB (publ) Full year report 2013
 Full year report 2013") Micronic Mydata AB (publ) Full year report 2013 Press release 308E Fourth quarter 2013 Net sales were SEK 325 (481) million EBIT was SEK 42 (119) million Earnings per share were SEK 0.35 (1.28) Outlook
Micronic Mydata AB (publ) Full year report 2013 Press release 308E Fourth quarter 2013 Net sales were SEK 325 (481) million EBIT was SEK 42 (119) million Earnings per share were SEK 0.35 (1.28) Outlook
Interim report January September 2015
 Boule Diagnostics AB (publ) Interim report January September 2015 Increased sales and a higher gross margin Quarter, July-September 2015 Net sales amounted to SEK 88.8 million (73.6), up 20.7 percent.
Interim report January-September 2017 Published on October 26, 2017
 Interim report January-September 2017 Published on October 26, 2017 Third quarter 2017 Increased sales and strong result Sales increased 7 per cent to 2,936 MSEK (2,742). Operating profit amounted to 470
Interim Report. July September July- Sept. Sept
 Q3 Interim Report July September Doro AB Corporate Identity Number 556161-9429 18.2% Net sales growth 8.9% EBIT margin Growth in all markets and improved margins July September Net sales amounted to SEK
Operating profit increased by 34 percent to 50.0 MSEK (37.2). Result after tax increased by 36 percent to 51.4 MSEK (37.7).
. Result after tax increased by 36 percent to 51.4 MSEK (37.7).") Interim report January - June 2018 July 16, 2018 Record figures for sales as well as operating profit Second quarter, April - June 2018 Net sales amounted to 236.1 MSEK (196.3), which is an increase by
Interim report January - June 2018 July 16, 2018 Record figures for sales as well as operating profit Second quarter, April - June 2018 Net sales amounted to 236.1 MSEK (196.3), which is an increase by
Interim report 1 January 30 September
 Interim report 1 January 30 September 2017 THE INTERIM PERIOD Net revenue totalled SEK 1,231 million (783) Operating profit amounted to SEK 166 million (86) Profit before tax amounted to SEK 150 million
hms networks JANUARY - SEPTEMBER 2012 First nine months Third quarter
 hms networks I N T E R I M JANUARY - SEPTEMBER First nine months q Net sales for the first nine months in- creased with 2 % reaching SEK 295 m (289), corresponding to a 1 % increase in local currencies
Ework commences year on-track
 Interim report Q1 2018 Ework commences year on-track First Quarter 2018 compared to Net sales increased by 10% to SEK 2,623 M (2,389). EBIT was down by 18% to SEK 22.5 M (27.4). Order intake fell by 5%
 Interim Report January September 2018 ------------------------------------------------------------------------------------------------ July September in summary Net sales rose by about 74 percent to SEK
EMPOWERING INNOVATION
 EMPOWERING INNOVATION INTERIM REPORT THIRD QUARTER 2017 This English translation is for information purposes only. In case of any discrepancies between this version and the Swedish, the Swedish version
equal to a 19 % (20) operating margin Order intake was SEK 336 m (328), corresponding to an increase of 3 %
 operating margin Order intake was SEK 336 m (328), corresponding to an increase of 3 %") Second quarter Net sales for the second quarter reached SEK 329 m (299), corresponding to an increase of 10 % Operating profit reached SEK 63 m (59) equal to a 19 % (20) operating margin Order intake was
Second quarter Net sales for the second quarter reached SEK 329 m (299), corresponding to an increase of 10 % Operating profit reached SEK 63 m (59) equal to a 19 % (20) operating margin Order intake was
Interim Report. January September High sales growth continues with strengthened order book. July September January September 2015
 Q3 Interim Report January September Doro AB Corporate Identity Number 556161-9429 34.5% Net sales growth 6.7% EBIT margin High sales growth continues with strengthened order book July September Net sales
The fast track to the cloud
 Interim Report 3 The fast track to the cloud JANUARY SEPTEMBER The group is reporting a positive operating profit and completing its restructuring with impairment of a holding in its Brazilian associated
ENGLISH VERSION OF THE INTERIM REPORT PUBLISHED ON 29 APRIL 2009
 ENGLISH VERSION OF THE INTERIM REPORT PUBLISHED ON 29 APRIL 2009 MD and CEO Johan Eriksson comments on Poolia s interim report for 1 January 31 March 2009 Poolia posts a healthy report in a tough market
Interim report. January - September Interim report for the period January - September Third quarter July September 2014
 Interim report January - September 2014 October 30, 2014 Interim report for the period January - September 2014 Third quarter July September 2014 Group net sales in the third quarter 2014 amounted to 118.5
C-RAD AB - INTERIM REPORT
 C-RAD AB - INTERIM REPORT JANUARY - JUNE 2018 Press release August 17, 2018 PROFITABLE QUARTER, REVENUE INCREASED BY 61 PERCENT SECOND QUARTER 2018 Order intake: 56.4 (49.3) MSEK, 14%. Revenues: 51.9 (32.2)
Interim report January - March First quarter. The group in brief
 Interim report January - March 2017 First quarter Net sales increased by 105% to MSEK 21.1 (10.3) Operating profit declined to MSEK -4.9 (-3.3). Adjusted operating profit* increased to MSEK 1.6 (-3.3)
Financial Report 1 April March 2018
 Financial Report 1 April 2017-31 March Fourth quarter (1 January - 31 March ) Revenue amounted to 960 (968). EBITA totalled 53 (46), corresponding to an EBITA margin of 5.5 percent (4.8). Operating profit
GUNNEBO INTERIM REPORT JANUARY-SEPTEMBER 2014
 Gothenburg, October 23, 2014 GUNNEBO INTERIM REPORT JANUARY-SEPTEMBER 2014 The CEO s comments on the third quarter During the quarter, order intake increased organically by 1% compared with last year.
Interim Report Q3 1 January 30 September 2013
 Interim Report Q3 1 January 3 September 213 THE PERIOD IN BRIEF JANUARY SEPTEMBER 213 The period in brief GROUP NET SALES PER QUARTER 5 4 3 2 1 29 21 211 212 213 Q1 Q2 Q3 Q4 Third quarter 213 JULY-SEPTEMBER
Interim report. January September President s comments. The third quarter. January-September
 Interim report January September The third quarter > > Net sales increased by 30 percent during the third quarter to SEK 1,906 M (1,462). Net sales increased by 12 percent in local currencies > > Operating
INTERIM REPORT. 1 January 30 September THE INTERIM PERIOD THE THIRD QUARTER. Important events during the period
 INTERIM REPORT 1 January 30 September 2018 THE INTERIM PERIOD Net revenue totalled SEK 1,495 million (1,23 Operating profit amounted to SEK 173 million (166) Profit before tax amounted to SEK 162 million
Half-year report January-June 2018 Published on July 18, 2018
 Half-year report January-June 2018 Published on July 18, 2018 Second quarter 2018 Increased sales and higher result Sales increased 7 per cent to 3,461 MSEK (3,230). Operating profit increased 9 per cent
Interim report January-June 2016
 Interim report January-June 2016 Unchanged market conditions Net revenues amounted to MSEK 898 (927) for the second quarter and MSEK 1,800 (1,843) for the first half of the year. Profit after net financial
Interim report January September Satisfactory progress in Q3
 Interim report January September 2013 Satisfactory progress in Q3 Quarter 3 Incoming orders amounted to SEK 641.4m (420.5), which after adjustments is an increase of 7.0%* compared with the same period
Interim report, January June 2012
 Second quarter - Interim report, January June Orders received MSEK 1,659 (1,504). After adjustments for acquired operations and currency effects, orders received have increased by 8 % compared with the
April-June January-June Important events during the second quarter. Important events after the end of the period
 April-June 2014 Consolidated revenue for the period is 40 635 (21 822) ksek, an increase of 86% compared to the same period 2013. Operating result for the period is 2 353 (3 387) ksek. Excluding re-listing
Scania Interim Report January September 2013
 23 October 2013 Scania Interim Report January September 2013 Summary of the first nine months of 2013 Operating income fell to SEK 5,939 m. (6,135), and earnings per share fell to SEK 5.30 (5.94) Net sales
Stable trend and continued preparations for IPO
 OVZON INTERIM REPORT, JANUARY MARCH 2018 Stable trend and continued preparations for IPO JANUARY MARCH 2018 QUARTER Revenue amounted to TSEK 46,311 (49,176) Operating loss totalled TSEK 11,623 (loss: 1,524)
Year-end report. January-December President s comments. January - December. Fourth quarter
 Year-end report January-December Fourth quarter > Net sales increased during the fourth quarter by 7 percent to SEK 2,204 M (2,059). Net sales increased by 13 percent in local currencies > Operating profit
Mycronic AB (publ), Interim report January-March 2015
, Interim report January-March 2015") Q1 PRESS RELEASE 339E Mycronic AB (publ), Interim report January-March 2015 About Mycronic Mycronic AB is a high-tech Swedish company engaged in the development, manufacturing and marketing of production
Q1 PRESS RELEASE 339E Mycronic AB (publ), Interim report January-March 2015 About Mycronic Mycronic AB is a high-tech Swedish company engaged in the development, manufacturing and marketing of production
RAYSEARCH LABORATORIES AB (PUBL)
") RAYSEARCH LABORATORIES AB (PUBL) INTERIM REPORT JANUARY 1 SEPTEMBER 30, 2014 JANUARY 1 SEPTEMBER 30, 2014 Net sales for the period amounted to SEK 177.4 M (114.4) Profit after tax was SEK 19.1 M (loss:
RAYSEARCH LABORATORIES AB (PUBL) INTERIM REPORT JANUARY 1 SEPTEMBER 30, 2014 JANUARY 1 SEPTEMBER 30, 2014 Net sales for the period amounted to SEK 177.4 M (114.4) Profit after tax was SEK 19.1 M (loss:
Record profit and market growth
 1 28 July 2010 No. 13/10 Record profit and market growth Sales totaled SEK 9,356 M (8,899), an increase of 5%, made up of 2% organic growth, 8% acquired growth and exchange-rate effects of -5%. Growth
Interim report. January - March First quarter January - March 2015
 Interim report January - March 2015 April 28, 2015 First quarter January - March 2015 Group net sales in the first quarter 2015 amounted to 144.2 MSEK (113.7), an increase by 26.8 percent compared to the
Very strong quarter for Medical Solutions
 Nolato AB nine-month interim report 218, page 1 of 21 Nolato AB (publ) nine-month interim report 218 Very strong quarter for Medical Solutions Third quarter of 218 in brief Sales increased to SEK 1,98
INTERIM REPORT, 1 JANUARY 30 JUNE 2011
 INTERIM REPORT, 1 JANUARY 3 JUNE 211 Quarterly period, April to June 211 Poolia revenues, excluding Dedicare, were MSEK 283.2 (252.5), an increase of 12%, which corresponds to 15% in local currency. Poolia
Strong quarter with good margins
 [Skriv här] Boule Diagnostics AB (publ) Interim report January September 2017 Strong quarter with good margins Quarter July September 2017 Net sales amounted to SEK 109.7 million (108.5), up 1.1 percent.
Ework finishes 2017 strongly
 Year-End Report Q4 January- Ework finishes strongly Fourth quarter compared to the corresponding period of Net sales increased by 17% to SEK 2,714 M (2,320). EBIT for the period was up by 23% to SEK 36.0
INTERIM REPORT JANUARY MARCH 2016
 G5 ENTERTAINMENT AB INTERIM REPORT JANUARY MARCH INTERIM REPORT JANUARY MARCH JANUARY MARCH Consolidated revenue for the period was SEK 101.2 M (97.6), an increase of 4 per cent compared to the same period
IAR Systems Group AB Interim report January-June IAR Systems Group AB Interim report January-March 2017
 IAR Systems Group AB Interim report January-June 217 IAR Systems Group AB Interim report January-March 217 IAR Systems Group AB Interim report January-June 217 Q1 Q2 Strong recovery in Asia and stable
Interim report 1 January 31 March 2017 Actic Group AB
 Q1 Interim report 1 January 31 March Actic Group AB Continued growth and strengthened position INTERIM REPORT 1 JANUARY 31 MARCH ACTIC GROUP AB 1 Interim report 1 January 31 March First quarter January
Strong performance online, tougher in brickand-mortar
 Interim report January 1 June 30, 2017 Odd Molly International AB (publ) Stockholm, Sweden August 16, 2017 Strong performance online, tougher in brickand-mortar stores APRIL 1 JUNE 30, 2017 Total operating
First quarter of 2018 (Q1 2017) Events during the first quarter of Summary of the first quarter of 2018
 Events during the first quarter of Summary of the first quarter of 2018") Interim report January March 2018 Evolution Gaming Group AB (publ) First quarter of 2018 (Q1 2017) Operating revenues increased by 30% to EUR 51.6 MEUR (39.7) EBITDA increased by 29% to EUR 22.0 million
Interim report January March 2018 Evolution Gaming Group AB (publ) First quarter of 2018 (Q1 2017) Operating revenues increased by 30% to EUR 51.6 MEUR (39.7) EBITDA increased by 29% to EUR 22.0 million
Very strong license sales
 Interim Report JANUARY MARCH 214 Very strong license sales License revenue for January-March increased with 27 percent to SEK 53.4 (42.) million Sales for January-March increased with 9 percent to SEK
Scania Interim Report January September 2016
 28 October 2016 Scania Interim Report January September 2016 Summary of the first nine months of 2016 Operating income amounted to SEK 3,733 m. (7,046), and was negatively impacted by a provision of SEK
FINANCIAL INFORMATION IN BRIEF
 INTERIM REPORT 1 January 30 September 2016 FINANCIAL INFORMATION IN BRIEF Third quarter: 1 July-30 September 2016 Sales for the third quarter amounted to SEK 0.6 (1.0) million. Operating result in the
Interim report 1 May October 2013
 Interim report 1 May 2013 31 October 2013 Second quarter 2013/14 Sales increased by 4 % to 1,678 MSEK (1,614). In local currencies, growth was up 6 % Operating profit increased by 23 % to 126 MSEK (102)
Weak quarter, especially in Europe
 Interim report January March 2013 Weak quarter, especially in Europe Incoming orders amounted to SEK 683.2m (493.7), which adjusted is a decrease by 1.7 %*. Net sales amounted to SEK 614.5m (505.9), which
Instrument sales remain strong
 [Skriv här] Boule Diagnostics AB (publ) Interim report January March 2017 Instrument sales remain strong Quarter January March 2017 Net sales amounted to SEK 106.6 million (84.4), up 26.3 percent. Adjusted
Interim report January-September 2018 Published on October 25, 2018
 Interim report January-September 2018 Published on October 25, 2018 Third quarter 2018 Increased sales and higher result Sales increased 17 per cent to 3,443 (2,936). Operating profit increased 12 per
C-RAD AB - INTERIM REPORT Q1
 C-RAD AB - INTERIM REPORT Q1 JANUARY MARCH 2018 PRESS RELEASE APRIL 26, 2018 CONTINUED STRONG GROWTH, REVENUE INCREASED BY 31 PERCENT FIRST QUARTER 2018 Order intake: 50.6 (40.2) MSEK, 26%. Revenues: 33.8
Lindab International AB (publ) Interim Report
 Interim Report") Lindab Interim Report January-September Lindab International AB (publ) Interim Report Third quarter Net sales increased by 2 percent to SEK 2,081 m (2,042), of which organic growth amounted to 2 percent.
Lindab Interim Report January-September Lindab International AB (publ) Interim Report Third quarter Net sales increased by 2 percent to SEK 2,081 m (2,042), of which organic growth amounted to 2 percent.
C-RAD AB - INTERIM REPORT
 C-RAD AB - INTERIM REPORT JANUARY - SEPTEMBER 2018 Press release October 26, 2018 C-RAD REPORTS ALL-TIME HIGH IN QUARTERLY ORDER INTAKE THIRD QUARTER 2018 Order intake: 64.2 (55.5) MSEK, 16%. Revenues:
hms networks First quarter Last twelve months INTERIM REPORT 2017 JANUARY - MARCH
 hms networks INTERIM REPORT JANUARY - MARCH Last twelve months Net sales for the last twelve months amounted to SEK 1 030 m (732) corresponding to a 37 % increase in local currencies. The revaluation of
Year-end report Strong end to the year
 Year-end report 2016 Strong end to the year Net revenues amounted to MSEK 887 (841) for the quarter and MSEK 3,528 (3,522) for the full year. Profit after net financial items totaled MSEK 113 (113) for
Year-end report 2017 January - December YEAR-END REPORT 2017 OCTOBER DECEMBER 2017 JANUARY DECEMBER 2017
 Year-end report 2017 January - December Troax Group AB (publ) Hillerstorp 12th of February, 2018 YEAR-END REPORT 2017 OCTOBER DECEMBER 2017 Order intake increased by 17 per cent to 38,4 (32,8) MEUR. Adjusted
hms networks JANUARY - DECEMBER 2014 Fourth quarter
 hms networks Y E A R - E N D R E P O R T 2 0 1 4 JANUARY - DECEMBER q Net sales for the full year increased by 18 % reaching SEK 589 m (501), corresponding to a 13 % increase in local currencies. The revaluation
 Interim Report January March 2018 ------------------------------------------------------------------------------------------------ First quarter in brief Net sales rose by about 30 percent to SEK 6,246k
hms networks JANUARY - DECEMBER 2013 Fourth quarter
 hms networks Y E A R - E N D R E P O R T 2 0 1 3 JANUARY - DECEMBER q Net sales for the full year reached SEK 501 m (382), corresponding to a 31 % increase. The revaluation of the Swedish currency had
Interim report January March 2018
 Interim report January March 218 Strong growth and stable margin First quarter 218 Net sales rose by percent to SEK 945 million (815). Organic growth was 9 percent. Order intake was in line with net sales.
NYNAS Interim report 1 january 30 June 2014
 NYNAS Interim report 1 january 30 June 2014 2 Interim report 1 january 30 June 2014Q2 Nynas AB (Publ.), corporate re. no 556029-2509, parent company for Nynas. Nynas is a leading international group specialised
Strong growth and increased earnings across all business areas
 Nolato AB three-month interim report 218, page 1 of 18 Nolato AB (publ) three-month interim report 218 Strong growth and increased earnings across all business areas First quarter of 218 in brief Sales
Axis achieves profitability
 Interim Report January September 2001 Axis achieves profitability Group sales for comparable units during the first nine months amounted to SEK 487 M (440). Total sales, including Netch, which was divested
hms networks Fourth quarter Yearly Y E A R - E N D R E P O R T JANUARY - DECEMBER
 hms networks Y E A R - E N D R E P O R T 2 0 1 6 JANUARY - DECEMBER Yearly Net sales for the full year increased by 36 % reaching SEK 952 m (702), corresponding to a 34 % increase in local currencies.
Smart Eye Interim Report January December 2017
 Smart Eye Interim Report January December 2017 I Summary fourth quarter 2017 Net sales totalled SEK 10,506 (14,574) thousand which corresponds to a drop of 28%. Operating profit/loss totalled SEK 14,814
Summary of the fourth quarter and full-year 2017
 Year-end report January December 2017 Evolution Gaming Group AB (publ) Fourth quarter of 2017 (Q4 2016) Operating revenues increased by 48% to EUR 50.7 million (34.3) EBITDA increased by 74% to EUR 22.6
Interim report. January September President s comments. January - September. Third quarter
 Interim report January September Third quarter > > Net sales increased during the third quarter by 13 percent to SEK 2,253 M (1,997). Net sales increased by 13 percent in local currencies > > Operating
YEAR-END REPORT for the period FULL YEAR Sales increased by 12.2 % to MSEK (MSEK 657.0) EBITDA amounted to MSEK 75.0 (MSEK 75.
 EBITDA amounted to MSEK 75.0 (MSEK 75.") FULL YEAR Sales increased by 12.2 % to MSEK 737.2 (MSEK 657.0) EBITDA amounted to MSEK 75.0 (MSEK 75.5) Profit before tax increased by 1.9 % to MSEK 68.3 (MSEK 67.0) Profit margin before tax amounted to
FULL YEAR Sales increased by 12.2 % to MSEK 737.2 (MSEK 657.0) EBITDA amounted to MSEK 75.0 (MSEK 75.5) Profit before tax increased by 1.9 % to MSEK 68.3 (MSEK 67.0) Profit margin before tax amounted to
Investments and adaptations for the future one-off costs impacting the result
 Interim report January 1 September 30, 2017 Odd Molly International AB (publ) Stockholm, Sweden, October 24, 2017 Investments and adaptations for the future one-off costs impacting the result JULY 1 SEPTEMBER
Earnings remain strong with solid return on capital
 Nolato AB nine-month interim report 213, page 1 of 15 Nolato AB (publ) nine-month interim report 213 Earnings remain strong with solid return on capital Third quarter of 213 in brief Sales rose by 12%
P R E S S R E L E A S E
 P R E S S R E L E A S E from ASSA ABLOY AB (publ) 2 November 2004 No. 12/04 ASSA ABLOY: CONTINUED STRONG ORGANIC GROWTH IN THE THIRD QUARTER Sales in the third quarter increased organically by 6% to SEK
Financial Statement 2013
 Financial Statement 2013 Strong incoming orders at year-end Quarter 4 Incoming orders amounted to SEK 777.8m (734.8), which adjusted is an increase of 7.5 %*. Net sales amounted to SEK 706.0m (762.9),
Interim report Q3, July September 2017 Stockholm, 25 October 2017
 Interim report Q3, July September Stockholm, 25 October As of the second quarter of, Cloetta Italia S.r.l. is accounted for as discontinued operation. The comparative figures in the consolidated profit
Interim Report Third quarter,
 Interim Report Third quarter, 1 Acting CEO s comments All-time high operating profit Our determined, focused and hard work based upon our clear strategy is continuing to yield good results. For the 27th
Interim report Third quarter 2018
 Interim report Third quarter 2018 Press release 26 October 2018 Third quarter 2018 Net sales increased by 15% to MSEK 7,458 (6,492). Organic growth was 7% (10). Operating profit (EBIT) was MSEK 524 (510).
Yearly. Fourth quarter YEAR-END REPORT 2018 JANUARY - DECEMBER. Net sales for the fourth quarter reached SEK 363 m (301), corresponding to an
, corresponding to an") YEAR-END REPORT JANUARY - DECEMBER Fourth quarter Net sales for the fourth quarter reached SEK 363 m (301), corresponding to an increase of 20 %. Currency translations had a positive effect of SEK 21 m
YEAR-END REPORT JANUARY - DECEMBER Fourth quarter Net sales for the fourth quarter reached SEK 363 m (301), corresponding to an increase of 20 %. Currency translations had a positive effect of SEK 21 m
Managing cash in society.
 interim report January June 2012 Managing cash in society. Continued margin improvement January June 2012 Revenue during the period amounted to MSEK 5,720 MSEK (5,210). Real growth amounted to 6 percent
JANUARY-MARCH Interim Report High order intake and increased sales, plus clear earnings improvement
 ON RSTP FRNT USB PWR CON X1 X5 X9 X2 X3 24-11 V DC X4 X8 1BASE-T X6 X1 X7 X11 X12 M12 Torque.6±,1 Nm /,45±,1 lbft Interim Report 1 218 Video recording DC OPR ERR X1 X2 Signal DC OPR ERR X1 X2 Cloud solution
Scania Interim Report January September 2017
 30 October 2017 Scania Interim Report January September 2017 Summary of the first nine months of 2017 Operating income, excluding items affecting comparability, amounted to SEK 9,080 m. (7,492) Operating
Clas Ohlson: Year-end report 1 May April 2013
 Clas Ohlson: Year-end report 1 May 2012 30 April 2013 Fourth quarter * Sales totalled SEK 1,274 M (1,272). In local currencies, growth was 3%. * Operating loss of SEK 19 M reported (profit: 10). * Loss
Jan-March Jan-March 12-months rolling. Jan-Dec SEK m
 Instalco Interim report January - March Continued healthy growth and good profitability January March Net sales increased by SEK 45.2 million to SEK 689 (474) million. Organic growth was 9.3 percent. Adjusted