Company presentation September 2017
|
|
|
- Liliana McLaughlin
- 6 years ago
- Views:
Transcription

1 Company presentation September Business model 2. Market & environment 3. Order book position 4. Key financial figures 5. Forecast 6. Share 7. Annex
2 1. Business model Classic building services business since 1980 Individual detached and semi-detached houses built for private end-users according to the solid construction method Homes built on customers land at locations allmost all across Germany Financial advice that is not tied to a specific bank since 2010 Financing and building insurance broking across the whole of Germany especially for HELMA Group private customers Group parent company Wholly-owned subsidiary Residential property development since 1984 Attractive total concepts in owner-occupier homes area for private end-users (detached, semi-detached, terraced and multi-family houses), as well as institutional investors (terraced and multi-family houses) Including land with current focus on Berlin, Hamburg, Hanover, Leipzig and Munich 93.9%-owned subsidiary Holiday property development business since 2011 Development, planning and sale of holiday properties to private customers for own use or as high-yield capital investment Including land with current focus on Baltic Sea Coast and German seaside locations 95.1%-owned subsidiary 2
3 1. Business model Hamburg Competitive strengths Experienced: Several thousand references Hanover Berlin Attractive: Individual all-inclusive packages Magdeburg Value-retaining: Sustainable product quality Personal: Regional presence Dusseldorf Dortmund Leipzig Secure: High creditworthiness and transparency Cologne Zella-Mehlis Chemnitz Dresden Koblenz Gießen Frankfurt Trier Würzburg Mannheim Core Regions HELMA Eigenheimbau AG Core Regions HELMA Wohnungsbau GmbH Munich Core Regions HELMA Ferienimmobilien GmbH Sales location 3


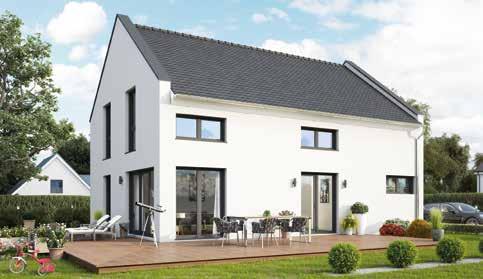


4 1. Business model HELMA Eigenheimbau and HELMA Wohnungsbau: individual dream homes 4
")


 Teltow - Rosenviertel (Berlin region >70 detached homes in")
5 1. Business model HELMA Wohnungsbau: reference property development projects in the owner-occupier homes area individual detached homes (extract) Dallgow-Döberitz (Berlin region approx. 46 units in detached homes, semi-detached homes, and terraced houses in planning) Laatzen - Erdbeerfeld (Hanover region >100 detached homes in planning) Spandau - Havel Marina (Berlin region approx. 300 units in detached homes, terraced houses and multi-family houses for sale / in planning) Teltow - Rosenviertel (Berlin region >70 detached homes in planning) Berlin - Karlshorst (255 detached homes realized) Berlin - Pankow (110 detached homes realized) 5


 Potsdam")

6 1. Business model HELMA Wohnungsbau: Reference projects for property development business in owner-occupier homes area preplanned semi-detached houses, terraced houses and multi-family houses (extract) Leipzig (16 apartments under construction) Munich - Großhadern (10 apartments for sale) Potsdam Kurfürstenresidenz (11 apartments for sale) Saarmund (Brandenburg region, 6 semi-detached house und 11 terraced houses under construction) 6

 Kirchseeon (Munich region, 42")

 Berlin - Karlshorst (95 apartments")
7 1. Business model HELMA Wohnungsbau: Reference projects for property development business in owner-occupier homes area preplanned semi-detached houses, terraced houses and multi-family houses (extract) Kirchseeon (Munich region, 42 apartments under construction) Pfaffenhofen (Munich region, 6 semi-detached homes, 20 terraced houses and 13 apartments under construction) Hanover Buchholz (45 apartments and 4 commercial units for sale) Berlin - Karlshorst (95 apartments under construction) 7


8 1. Business model HELMA Ferienimmobilien: OstseeResort Olpenitz (Schleswig-Holstein) Construction phase VII-B: 16 Holiday apartments Construction phase II-B: 122 Holiday apartments Construction phase IV: c. 120 Holiday apartments Construction phase VII-A: c. 64 Holiday homes Construction phase II-A: 145 Holiday homes Construction phase VI: c. 265 Holiday homes/ Holiday apartments Construction phase I 36 Holiday apartments Construction phase V: c. 180 Holiday apartments plus 45 commercial units Construction phase III-B: 60 Floating houses Construction phase III-A: c. 99 Holiday homes/ Holiday apartments 8

 DünenResort Binz (77 units")
")

9 1. Business model HELMA Ferienimmobilien: Projects on the island of Rügen and near Berlin (extract) DünenResort Binz (77 units realised) White beach villas Port Olpenitz (24 units realised) Ostseepark Glowe (27 units realised) Hafendorf Zerpenschleuse (200 units for sale / under construction) 9
10 2. Market & environment Positive economic data Trend towards living in conurbations centred on major German cities Housing shortage in large German cities due to high influx rates Real estate enjoys high status as a retirement provision and as capital investment High demand for new-builds to replace detached and semi-detached properties no longer capable of renovation Strong employment market data / favourable interest rates Residential construction approvals and completions (newbuild) in Germany 350, , , , , ,000 50,000 Approvals in residential buildings to be newly constructed Completions in newly constructed residential buildings Building approvals figures for detached/semi-detached houses Building approvals figures for multi-family houses Source: Statistisches Bundesamt 10
11 3. Order book position HELMA Group new order intake and order book position k 300, ,000 CAGR 22 % 269, , , , ,000 50, , % 158, % 193, % 6 % 120,642-4 % 116, ,092 9 % 195, ,815 5 % 197, H H /31/ /31/ /30/ /30/2017 New order intake, net IFRS Order book, net IFRS High new order intake and order book position create solid foundation for further revenue growth 11
12 3. Order book position Group companies contributions to consolidated new order intake in k 2016 Share in % 2015 Share in % 2014 Share in % 2013 Share in % 2012 Share in % HELMA Eigenheimbau AG* 99, , , , , HELMA Wohnungsbau GmbH 150, , , , , HELMA Ferienimmobilien GmbH 36, , , , , Total 286, , , , , *HELMA LUX S.A. was merged with HELMA Eigenheimbau AG in The new order intake of HELMA LUX S.A. in FY is included in the figures for HELMA Eigenheimbau AG. Decline in order intake at HELMA Eigenheimbau AG after a strong increase in the previous year Significant growth of new order intake at property development subsidiaries 12
13 4. Key financial figures Sustained growth in sales and earnings k 250, ,842 k 25, , , ,000 50, , % 138,018 CAGR 23 % 24 % 170, % 210, % 103,010 7 % 110,067 20,000 15,000 10,000 5,000 7, % 10,336 CAGR 32 % 40 % 14, % 18, % 22,156 6,375 3 % 6, H H Group revenue H H Adjusted Group EBIT Adjusted Group EBIT = earnings before interests and taxes disposal of capitalised interests Consolidated net income grows to k 13,498 in FY 2016 (FY 2015: k 9,952) and to k 4,005 in H (H1 2016: k 3,612) Earnings per share increase to 3.37 in FY 2016 (FY 2015: 2.69) and to 1.00 in H (H1 2016: 0.90) 13
14 4. Key financial figures Contributions of Group companies to consolidated revenue in k 2016 Share in % 2015 Share in % 2014 Share in % 2013 Share in % 2012 Share in % HELMA Eigenheimbau AG* 91, , , , , HELMA Wohnungsbau GmbH 139, , , , , HELMA Ferienimmobilien GmbH 31, , , , , Hausbau Finanz GmbH Total 263, , , , , *HELMA LUX S.A. was merged with HELMA Eigenheimbau AG in The revenue of HELMA LUX S.A. in FY is included in the figures for HELMA Eigenheimbau AG. High-margin property development business is increasing in importance 14
15 4. Key financial figures Trends in cost ratios to revenue % Adjusted materials expense ratio Personnel expense ratio Adjusted other operating expense ratio Cost of materials ratio constantly at a good level below 80 % Declining personnel expense ratio due to increased property development business s share of group revenue (land shares are less labor intensive) 15
16 4. Key financial figures Trends in profit margins % Adjusted gross profit margin Adjusted EBIT margin EBT margin Return on sales (ROS) Expected medium-term adjusted EBIT margin at 7-10 %, in 2017 prospectively in the lower third of the range 16
17 4. Key financial figures Solid financial position with equity ratio above the sector average Consolidated balance sheet structure of assets Consolidated balance sheet structure of equity and liabilities in k 06/30/2017 Share 12/31/2016 Share 12/31/2015 Share Non-current assets 18, % 18, % 18, % - of which property, plant and equipment 15, % 16, % 16, % Current assets 283, % 259, % 226, % - of which inventories including land 192, % 173, % 154, % - of which cash and cash equivalents 12, % 11, % 12, % Total Assets 301, % 278, % 244, % in k 06/30/2017 Share 12/31/2016 Share 12/31/2015 Share Equity 84, % 80, % 69, % Non-current liabilities 135, % 112, % 67, % - of which non-current financial liabilities 127, % 103, % 60, % Current liabilities 81, % 85, % 107, % - of which current financial liabilities 46, % 32, % 50, % Total equity and liabilities 301, % 278, % 244, % Significant corporate growth feeds through to growth in total assets High inventories including land recognised as current assets at cost prices (principle of lowest value) secures continued growth of high-margin property development business Equity base well above the average sector level enables financing land purchases through land acquisition financing facilities with favourable interest rates Current financial liabilities mainly comprise financing facilities for land and projects. As it is to be assumed that these financing facilities will be repaid through the final acquirer`s purchase price payments within the next twelve months, these liabilities are to be presented as current financial liabilities irrespective of the actual financing term. 17
18 4. Key financial figures Group cash flow statement in k H H Cash flow from operating activities -20,782-36,230-14,261-31,297-18,582-36,440-8,043 - of which cash earnings 17,077 13,681 11,210 9,145 6,447 4,379 5,630 - of which change in working capital -37,857-49,921-25,517-40,308-24,979-40,812-13,628 - of which gain/loss on disposal of fixed assets Cash flow from investing activities -1,859-1,922-2,062-1, ,100 Cash flow from financing activities 21,479 43,729 16,418 38,571 16,930 38,093 11,115 Cash and cash equivalents at the end of the period 11,331 12,493 6,916 6,821 1,540 12,404 14,465 Sustainably positive cash earnings Buildup of working capital (land purchases) to expand high-margin property development business 18
19 5. Forecast Continuous increase of consolidated revenue k 400, , , , ,000 CAGR 23 % 210, , ,000 to 300, ,000 to 340, ,000 to 400, , ,000 50, , % 138, % 170, % 25 % e 2018e 2019e Group revenue Continuation of profitable growth trend expected with adjusted EBIT margin in a range of 7-10 % for 2017 and subsequent years 19
20 5. Forecast Financing strategy Equity base well above the average sector level as basis for further corporate growth Operating cash flow from current projects and retained profits Land purchase finance arrangements with various, mainly long-standing, partner banks Use of unsecured credit lines for temporary current financing made available by a broad spectrum of banks Capital market transactions or a promissory note issue comprise additional options where required In May 2017, a further promissory note with a volume of 27.0 million consisting of two fixed interest tranches with maturities of 5 and 7 years and an average interest rate of 2.69 % p.a. was issued. 20
21 6. Share Performance of the HELMA share /25/ /25/2017 ISIN: DE000A0EQ578 XETRA closing price on August 25, 2017: Market capitalisation on August 25, 2017: million Free float market capitalisation on August 25, million 21
22 6. Share Dividend in Dividend per share Retention of predominant portion of earnings forms important pillar to stabilize equity ratio at high level compared to sector average Shareholder structure 22
23 7. Annex The HELMA Group at a glance Earnings and dividend Revenue in k 263, , , , , ,588 74,535 EBITDA in k 23,455 19,494 15,971 11,793 8,774 6,132 3,851 Adjusted EBITDA* in k 23,949 20,076 16,301 11,843 8,774 6,132 3,851 Operating earnings (EBIT) in k 21,662 17,774 14,167 10,286 7,335 4,786 2,724 Adjusted operating earnings (EBIT)* in k 22,156 18,356 14,497 10,336 7,335 4,786 2,724 Earnings before taxes (EBT) in k 19,568 14,956 11,690 8,271 5,755 3,381 1,910 Net income after minority interests in k 13,498 9,952 8,132 5,606 3,799 2,310 1,302 Cash earnings in k 17,077 13,681 11,210 9,145 6,448 4,396 2,923 Earnings per share** in Dividend per share in Adjusted gross profit margin in % EBIT margin in % Adjusted EBIT margin* in % Return on sales (ROS) in % Sales performance Net new orders received in k 286, , , , , ,828 97,629 Selected balance sheet items and key figures 12/31/ /31/ /31/ /31/ /31/ /31/ /31/2010 Property, plant and equipment in k 16,398 16,342 16,139 15,760 15,022 16,311 14,568 Inventories including land in k 173, ,369 96,054 78,408 35,816 19,830 8,628 Cash an cash equivalents in k 11,331 12,493 6,916 6,821 1,540 3,793 3,074 Equity in k 80,236 69,898 40,952 28,033 20,365 17,067 12,199 Net debt in k 124,320 98,581 79,401 68,034 36,347 16,552 10,261 Total assets in k 278, , , ,600 84,645 63,868 42,965 Equity ratio in % Other data 12/31/ /31/ /31/ /31/ /31/ /31/ /31/2010 Number of employees * adjusted for the disposal of capitalised interest ** relative to the average number of shares in circulation during the financial year 23


24 7. Annex Financial Calendar 2017 IR contact January 12, 2017 March 30, 2017 March 30, 2017 June 1, 2017 June 22-23, 2017 July 7, 2017 July 13, 2017 August 31, 2017 November 27-29, Order intake figures 2016 Annual Report Metzler German Microcap Day, Frankfurt / Main Quirin Champions Conference, Frankfurt / Main Berenberg Pan-European Discovery Conference, Venice Annual General Meeting, Lehrte 2017 Half-year order intake figures 2017 Half-year Report German Equity Forum, Frankfurt / Main Dipl.-Kfm. Gerrit Janssen, CFA Management Board member, CFO Elaine Hirsch, MBA Executive Assistant Zum Meersefeld 4 D Lehrte Phone: 49 (0) 5132 / ir@helma.de 24

25 7. Annex We are HELMA 25
26 Disclaimer This document includes forward-looking statements. Forward-looking statements comprise all statements which do not describe past events, but which instead apply terms such as believe, assume, expect, estimate, plan, intend, could or similar formulations. By their nature, such forward-looking statements are nevertheless subject to risks and uncertainties, as they relate to future events and are based on the current assumptions and estimates of HELMA Eigenheimbau AG, which might not be realised at all in the future, or not as assumed. For this reason, they do not represent a guarantee of the occurrence of future events or performance at HELMA Eigenheimbau AG, and the actual financial position and the results that are actually achieved at HELMA Eigenheimbau AG, as well as macroeconomic trends and legal conditions, can differ significantly from the expectations that were assumed either explicitly or implicitly in the forward-looking statements, and fail to fulfil them. Note: Slight differences can occur in the summation of amounts and percentages in this document due to commercial rounding. 26
Company presentation June 2018
 Company presentation June 2018 1. Business model 2. Market & environment 3. Order book position 4. Key financial figures 5. Forecast 6. Share 7. Annex 1. Business model Classic building services business
We love to build for your life!
 We love to build for your life! H18 Our vision: WE LOVE TO BUILD FOR YOUR LIFE! Over a thousand customers every year report enthusiastically: "It's more than just an advertising slogan at HELMA. They actually
We love to build for your life.
 We love to build for your life. 14 We take responsibility: HELMA code of In our code of values which guides us in our daily ideas and activities we summarise the values that are particularly important
People. Performance. Progress.
 People. Performance. Progress. 13 The HELMA Group at a glance Earnings and dividend 2013 2012 2011 2010 2009 Revenue in million 138.0 114.0 103.6 74.5 62.4 EBITDA in million 11.8 8.8 6.1 3.9 2.4 Operating
Helma Eigenheimbau. Scale research report - Update. Market bottlenecks limiting momentum. H117 results showing moderate growth
 Scale research report - Update Helma Eigenheimbau Market bottlenecks limiting momentum Home builders 14 September 2017 Price 41.60 Market cap 166m Helma s H117 results confirmed the anticipated slowdown
CORESTATE Capital Group
 CORESTATE Capital Group Q3 2017 Earnings Presentation November 2017 Disclaimer This presentation contains forward-looking statements that involve a number of risks and uncertainties. Such statements are
ACCENTRO Real Estate AG
 ACCENTRO Real Estate AG Germany s Market Leader in Residential Property Privatisation Company Presentation, 6th November 2018 Interim Financial Report for the 3rd quarter 2018, 30th September 2018 ACCENTRO
Deutsche Wohnen SE.» 9M 2017 results. Conference Call, 14 November 2017
 Deutsche Wohnen SE» 9M 2017 results Conference Call, 14 November 2017 1 » Agenda 1 Highlights 9M 2017 2 Portfolio 3 Financials 4 Appendix 2 » Highlights 9M 2017 Strong operating business L-f-l rental growth
Helma Eigenheimbau. Scale research report - Initiation. Ready to drive home value. Well positioned for continued growth...
 Scale research report - Initiation Helma Eigenheimbau Ready to drive home value Home builders 12 May 2017 Price 39 Market cap 156m Helma Eigenheimbau provides an opportunity to gain entry into a growth
FIRST QUARTER 2017 INTERIM STATEMENT
 DEMIRE Deutsche Mittelstand Real Estate AG FIRST QUARTER 2017 INTERIM STATEMENT Fiscal Year January 1 Dezember 31 2017 Foreword of the Executive Board Dear Shareholders, With the quarterly statement for
2 nd quarter
 Q22008 Key Figures key figures 2 nd quarter 2008 2 nd quarter 2007 1 st half of 2008 1 st half of 2007 revenues and earnings EUR 000 EUR 000 EUR 000 EUR 000 Revenues 51,711 34,949 98,309 58,409 Total operating
INTERIM REPORT ON THE 3RD QUARTER GROWING CASHFLOWS
 INTERIM REPORT 2017 ON THE 3RD QUARTER GROWING CASHFLOWS 2 Group financials Group financials 3 GROUP FINANCIALS in EUR m 01 / 01 09 / 30 / 2017 01 / 01 09 / 30 / 2016 Income statement key figures Rental
Real Estate Markets Germany Dr. Thomas Beyerle, London 22nd of September
 Real Estate Markets Germany 2015 Dr. Thomas Beyerle, London 22nd of September German economy Why invest in Germany? 2 2015 2000 2001 2002 2003 2004 2005 2006 2007 2008 2009 2010 2011 2012 2013 2014 2015
Fast and sustainable, profitable growth. Company profile (April 2019)
") Fast and sustainable, profitable growth. Company profile (April 219) FCR Immobilien AG business model FCR with a clear orientation and great potential for increase in value Clear profile FCR Immobilien
Fast and sustainable, profitable growth. Company profile (April 219) FCR Immobilien AG business model FCR with a clear orientation and great potential for increase in value Clear profile FCR Immobilien
Fast and sustainable, profitable growth. Company profile (February 2019)
") Fast and sustainable, profitable growth. Company profile (February 219) Equity Story Highly profitable player with strong growth prospects on attractive real estate markets Sustainable, profitable business
Fast and sustainable, profitable growth. Company profile (February 219) Equity Story Highly profitable player with strong growth prospects on attractive real estate markets Sustainable, profitable business
On track! Results for Q1 Q3 2017
 On track! Results for Q1 Q3 2017 Technology-based financial services Investment highlights in Q1 Q3 2017 and forecast for 2017 Key figures for Q1 Q3 2017 (yoy) Revenue: 143.7 million (+27%) EBIT: 18.6
Deutsche Wohnen AG.» Company presentation. September 2012
 Deutsche Wohnen AG» Company presentation September 2012 1 » Agenda 1 Major highlights in H1/2012 2 BauBeCon acquisition 3 Proven asset and portfolio management track record in connection with the right
9-Month Report of FJA AG
 www.fja.com 9-Month Report of FJA AG 01.01.2008-30.09.2008 Contact FJA AG Elsenheimerstrasse 65 80687 Munich GERMANY Investor Relations Phone: + 49 89 76901-274 or -7002 Fax: + 49 89 7698813 Email: investor.relations@fja.com
Group interim report as of 30 June Creating today the city of tomorrow
 Creating today the city of tomorrow Contents 2 Group key figures 3 Group interim management report 18 Group interim financial statements 35 Further information 2 Deutsche Wohnen SE Group key figures Group
CONFERENCE CALL HALF-YEAR FINANCIAL REPORT AUGUST 2017
 CONFERENCE CALL HALF-YEAR FINANCIAL REPORT 207 6 AUGUST 207 RETAIL TURNOVER H 207 RETAILERS Retail sector % change to 206 rent-to-sales ratio in % % of sales % of space Department stores -.4 6.3 7.3 3.0
Conference call presentation Q
 Conference call presentation Q1 2018 2018 Content 2 I. TAG highlights Q1 2018 II. TAG financials Q1 2018 III. TAG portfolio Q1 2018 IV. TAG outlook FY 2018 V. Appendix 3 5 12 16 19 Portfolio details, vacancy
Invest. Optimize. Realize. KEY FIGURES. 2 Key Figures PATRIZIA Immobilien AG Fiscal Year 2008 First Quarter. 1 st quarter
 Q12008 2 Key Figures Immobilien AG Fiscal Year 2008 First Quarter KEY FIGURES 31.03.2007 REVENUES AND EARNINGS EUR 000 EUR 000 Revenues 46,598 23,460 Total operating performance 31,639 612,589 EBITDA 6,967
DEMIRE Deutsche Mittelstand Real Estate AG Conference Call Full Year Results 2017
 DEMIRE Deutsche Mittelstand Real Estate AG Conference Call Full Year Results 2017 26 Disclaimer This document is for informational purposes only. This document is not intended to form the basis of any
Company Presentation. January 2018
 Company Presentation January 2018 Disclaimer This document is for informational purposes only. This document is not intended to form the basis of any investment decision and should not be considered as
The Company. Design Build Service 2015/16
 The Company Design Build Service 2015/16 2 Financial Report 2015/16 The forty-seventh financial year began on 1 April 2015 and ended on 31 March 2016. Geschäftsbericht Financial Report 2015/16 3 409 buildings
CONFERENCE CALL. 9M 2015 Results
 CONFERENCE CALL 9M 2015 Results 13.11.2015 9M 2015 SHOPPING CENTERS Retail turnover 9M 2015 1) Retail sector % change rent-to-sales ratio in % % of sales % of space Department stores -2.3 6.0 7.8 13.5
DEMIRE Deutsche Mittelstand Real Estate AG. Fiscal Year 1 January 31 December 2017
 DEMIRE Deutsche Mittelstand Real Estate AG Third Quarter 2017 Interim Statement Fiscal Year 1 January 31 December 2017 Foreword of the Executive Board Dear Shareholders, It is with great satisfaction that
S IMMO. Accumulate (old: Buy) Target: Euro (old: Euro 16.00)
 Target: Euro (old: Euro 16.00)") S IMMO Accumulate (old: Buy) Target: Euro 17.50 (old: Euro 16.00) 06 April 2018 Price (Euro) 16.50 52 weeks range 16.50 / 11.50 Key Data Country Austria Industry Real Estate Market Segment Prime Market
S IMMO Accumulate (old: Buy) Target: Euro 17.50 (old: Euro 16.00) 06 April 2018 Price (Euro) 16.50 52 weeks range 16.50 / 11.50 Key Data Country Austria Industry Real Estate Market Segment Prime Market
03/09 THE CHANGING FACE OF RETAIL. HSBC Real Estate Conference Frankfurt, 4 March feelestate.de
 03/09 feelestate.de THE CHANGING FACE OF RETAIL HSBC Real Estate Conference Frankfurt, 4 March 2009 Contents Company Shopping Centers Financials Shopping Center Share Appendix Company Shopping Centers
Koenig & Bauer AG at 15 th German Corporate Conference 2016 January 19, 2016, Frankfurt
 People & Print Koenig & Bauer AG at 15 th German Corporate Conference 2016 January 19, 2016, Frankfurt Mathias Dähn, CFO Agenda Company overview Strategy & growth drivers Q3 2015 & outlook KBA Koenig &
Buy (unchanged) Target: Euro (unchanged)
 Target: Euro (unchanged)") EYEMAXX Real Estate Buy (unchanged) Target: Euro 19.00 (unchanged) 27 June 18 Price (Euro) 1 52 weeks range 15.48 / 9.18 EYEMAXX with good news flow regarding new projects, additions to the property portfolio,
EYEMAXX Real Estate Buy (unchanged) Target: Euro 19.00 (unchanged) 27 June 18 Price (Euro) 1 52 weeks range 15.48 / 9.18 EYEMAXX with good news flow regarding new projects, additions to the property portfolio,
Strategic Financing of a Listed Company
 Strategic Financing of a Listed Company Christian Hillermann ADLER Real Estate AG Dr. Sven Janssen Oddo Seydler Bank AG Contents ADLER Real Estate AG company presentation 1. Company highlights 2. Event
Noratis Enhancement of property values
 November 2018 Disclaimer This document is not a securities prospectus, and the information contained therein does not constitute an offer to sell, or a solicitation of an offer to buy, securities of Noratis
Private equity an attractive asset class
 26 shares Shares Private equity an attractive asset class Private equity is a highly attractive investment option that, compared with other equity investments, especially stock investments, frequently
COLLATERALISED AND LIQUID ETC SIMPLE TRADING. SIMPLY COLLATERALISED. SIMPLY LIQUID. The bank for a changing world
 ETCs SIMPLE INVESTMENT IN COMMODITIES ETC COLLATERALISED AND LIQUID SIMPLE TRADING. SIMPLY COLLATERALISED. SIMPLY LIQUID. The bank for a changing world 4 WHY ETCs? 6 FUNCTIONING OF ETCs DAILY DETERMINATION
Trends in the Secondary Markets
 Trends in the Secondary Markets The Hidden Champions The Secondary Markets 1 1 Due to the high demand pressure and associated price rises in established office markets, smaller markets are becoming more
BNP PARIBAS SECURITIES SERVICES
 BNP PARIBAS SECURITIES SERVICES PROVIDING RESPONSIBLE SERVICE TO OUR CLIENTS securities.bnpparibas.de The bank for a changing world 2 BNP PARIBAS GLOBALLY One of the leading banks in the eurozone 189,000
UBM Development AG Buy (unchanged) Target: Euro (unchanged)
 Target: Euro (unchanged)") Buy (unchanged) Target: Euro 50.00 (unchanged) Price (Euro) 37.80 52 weeks range 43.90 / 33.00 Key Data Country Austria Industry Real Estate Segment Development (trading oriented) ISIN AT0000815402 WKN
Buy (unchanged) Target: Euro 50.00 (unchanged) Price (Euro) 37.80 52 weeks range 43.90 / 33.00 Key Data Country Austria Industry Real Estate Segment Development (trading oriented) ISIN AT0000815402 WKN
12 th Annual General Meeting. + Vienna, 8 May 2013
 12 th Annual General Meeting + Vienna, 8 May 2013 conwert is a fully integrated real estate company focusing on residential properties and apartment buildings in Germany and Austria. This focus is complemented
Quarterly Financial Statements as per 31 March 2016 Conference Call
 Quarterly Financial Statements as per 31 March 2016 Conference Call Munich, Andreas Helber, CFO Agenda 1. Development of the Group 1-3/2016 2. Development of the Segments 1-3/2016 3. Outlook for FY 2016
CORESTATE Capital Holding Company presentation. January 2018
 CORESTATE Capital Holding Company presentation January 2018 Disclaimer This presentation contains forward-looking statements that involve a number of risks and uncertainties. Such statements are based
First Quarter 2017 Interim Statement
 DEMIRE Deutsche Mittelstand Real Estate AG First Quarter 2017 Interim Statement Fiscal Year January 1 Dezember 31 2017 Foreword of the Executive Board Dear Shareholders, With the quarterly statement for
NORATIS ENHANCEMENT OF PROPERTY VALUES
 September 2018 DISCLAIMER This document is not a securities prospectus, and the information contained therein does not constitute an offer to sell, or a solicitation of an offer to buy, securities of Noratis
SHAPING THE FUTURE Q1 Report 2018
 SHAPING THE FUTURE Q1 Report 2018 Key share data Ticker / ISIN AM3D / DE000A111338 Letter from the Board Dear shareholders, customers, business partners and employees, Number of shares 17,980,867 Closing
Company presentation November 2017
 Company presentation November 2017 1 CONTENT Content I. TAG overview and strategy 3 2 II. III. IV. TAG portfolio TAG services business TAG return on capex 7 12 16 V. TAG acquisitions and disposals 21 VI.
Westgrund AG Overview
 February 2015 Westgrund AG Overview Geographical focus on Northern and Eastern Germany Köln 6 3 Bremen 31 Frankfurt Hamburg Hannover 24 München WESTGRUND Real estate portfolio based on sqm 6 30 Leipzig
Interim Report First Half 2014 Conference Call
 Interim Report First Half 2014 Conference Call Munich, Prof. Klaus Josef Lutz, CEO Andreas Helber, CFO Agenda 1. Development of the Group in the first half of 2014 2. Development of the Segments in the
Catella Research. Housing Market Ranking Germany 2015 Regional Housing Markets under the Microscope
 Catella Research Housing Market Ranking Germany 2015 Regional Housing Markets under the Microscope About Catella Catella is a leading financial advisor and asset manager in Europe, active in the property,
Report on the first half of fiscal 2003
 TAG Tegernsee Immobilien- und Beteiligungs-Aktiengesellschaft Securities code number 830 350 I S I N DE0008303504 Reuters TEGG Mu.F, Bloomberg TEG GR Report on the first half of fiscal 2003 Improved EBITDA
TAG Immobilien AG Q1 - Q3 2012
 TAG Immobilien AG Q1 - Q3 2012 Q1-Q3 2011 TAG I 1 Content I. TAG Highlights Q3 2012 page 3 II. TAG FFO, Vacancy, Achievements, Investment Case Q3 2012 page 4-7 III. TAG Portfolio Q3 2012 page 8-10 IV.
CORESTATE Capital Group A Leading Real Estate Investment Manager
 CORESTATE Capital Group A Leading Real Estate Investment Manager H1 2017 Earnings Presentation 16 August 2017 Page 1 CORESTATE Capital Holding S.A. Disclaimer This presentation contains forward-looking
Performance at a glance
 Interim Report 1-9/2014 Usable space by usage type *) as of Performance at a glance 73.3% Residential 26.7% Commercial *) Fair value allocation as commercial or residential is based on the majority use
Company presentation. June 30, 2015
 Company presentation June 30, 2015 Short profile of WL BANK Established in 1877 National and international Pfandbrief bank with a balance sheet total of approx. EUR 38 billion Head office in Münster (Westphalia),
INTERIM STATEMENT GODEWIND IMMOBILIEN AG 1
 INTERIM STATEMENT GODEWIND IMMOBILIEN AG 1 GODEWIND IMMOBILIEN AG FRANKFURT AM MAIN CONSOLIDATED INTERIM STATEMENT IN COMPLIANCE WITH IFRS FOR THE PERIOD 1 JANUARY TO 31 MARCH 2018 The following consolidated
Half-Year Report 2016
 DEMIRE Deutsche Mittelstand Real Estate AG Half-Year Report 2016 Fiscal Year January 1 December 31, 2016 2 DEMIRE at a glance Key Figures Group in EURK Consolidated income statement 01/01/2016 30/06/2016
New Energy Solutions. Quaterly Statement
 New Energy Solutions Quaterly Statement 1-2018 Key Share Figures Ticker / ISIN PNE3 / DE000A0JBPG2 Number of shares 76,556,026 Closing price (31/3/2018)* Highest / lowest price* (1/1/-31/3/2018) Market
Deutsche Konsum REIT-AG. Interim financial report for the period from 1 October 2016 to 30 June 2017 of 2016/2017 fiscal year
 Deutsche Konsum REIT-AG Interim financial report for the period from 1 October 2016 to 30 June 2017 of 2016/2017 fiscal year Table of contents 1. Business performance... 5 2. Net assets, funding and earnings
N O R M A G R O U P S E
 NORMA GROUP SE Overview of Key Figures Q3 2017 1 Q3 2016 1 Q1 Q3 2017 1 Q1 Q3 2016 1 Order situation Oder book (Sep 30) EUR millions 322.7 282.7 Income statement Revenue EUR millions 244.4 216.6 763.4
DG HYP INVESTOR PRESENTATION. Situation as at: 30 June 2016
 DG HYP INVESTOR PRESENTATION Situation as at: 30 June 2016 AGENDA 1. Company profile and business strategy 2. Facts and figures 3. DG HYP funding 4. Analysis of the mortgage cover pool 5. Appendix DG HYP
Interim report on the 2nd quarter of 2010
 Interim report on the 2nd quarter of 2010 1 Group Financials Group Financials (IFRS) in TEUR 01/01-06/30/2010 (adjusted) 01/01-06/30/2009 A. Income statement key figures Revenues 39,827 73,306 a) Property
Sandpiper Digital Payments AG
 December 18th, 2018 Research Comment Sandpiper Digital Payments AG Investment portfolio becomes more focused Rating: Speculative Buy (unchanged) Price: 0.072 Euro Price target: 0.22 Euro Analyst: Dipl.-Kfm.
2011 feelestate.de CONFERENCE CALL INTERIM REPORT H August 2011
 2011 feelestate.de CONFERENCE CALL INTERIM REPORT H1 2011 11 August 2011 H1 2011 Highlights H1 2011 January: Increase of the shareholding in Stadt-Galerie Hameln to 100% March: Opening of the Extension
Lloyd Fonds AG. Accumulate (unchanged) Target: Euro 0.75 (unchanged)
 Target: Euro 0.75 (unchanged)") Accumulate (unchanged) Target: Euro 0.75 (unchanged) 4 June 14 Price (Euro) 0.50 High / Low (52 weeks) 0.64 / 0.36 Key data Country Germany Market Segment Entry Standard Securities ID-Number 617487 ISIN
Accumulate (unchanged) Target: Euro 0.75 (unchanged) 4 June 14 Price (Euro) 0.50 High / Low (52 weeks) 0.64 / 0.36 Key data Country Germany Market Segment Entry Standard Securities ID-Number 617487 ISIN
CONFERENCE CALL QUARTERLY STATEMENT 9M NOVEMBER 2017
 CONFERENCE CALL QUARTERLY STATEMENT 9M 207 6 NOVEMBER 207 RETAIL TURNOVER 9M 207 Retail sector % change to 206 rent-to-sales ratio in % % of sales % of space Department stores -0.5 6.2 7.4 3. Food -0.4
CONSOLIDATED HALF-YEAR FINANCIAL REPORT
 CONSOLIDATED HALF-YEAR FINANCIAL REPORT FOR THE FIRST HALF-YEAR 2018 1 FRANKFURT AM MAIN CONSOLIDATED HALF-YEAR IFRS FINANCIAL REPORT FOR THE PERIOD 1 JANUARY TO 30 JUNE 2018 TABLE OF KEY FIGURES 1.1.
Conference Call on Q3 / 9M 2015
 Conference Call on Q3 / 9M 2015 Business Development, Financials & Outlook 12 November 2015 PATRIZIA Immobilien AG PATRIZIA Bürohaus Fuggerstrasse 26 86150 Augsburg T +49 821 50910-000 F +49 821 50910-999
HSBC Real Estate Conference. Frankfurt, 27 February 2008
 HSBC Real Estate Conference Frankfurt, 27 February 2008 Contents Company Shopping Centers Financials Shopping Center Share Appendix 2 Equity Story Deutsche EuroShop is Germany s only public company that
TRANSFORMATION VALUE SUCCESS
 Increased maneuverability More efficient IT organization Optimal Business Support Managing Change In IT TRANSFORMATION VALUE SUCCESS Henry Göttler COO SNP Schneider-Neureither & Partner AG Eigenkapitalforum
BayWa Group Interim Report as at 30 June 2010 Conference Call, 5 August > Klaus Josef Lutz, Chief Executive Officer
 BayWa Group Interim Report as at 30 June 2010 Conference Call, 5 August 2010 > Klaus Josef Lutz, Chief Executive Officer Market developments in Q2/2010 Agriculture Firmer producer prices (milk and grain)
People & Print Conference Call H1 Results August 2015
 People & Print Conference Call H1 Results 2015 11 August 2015 Claus Bolza-Schünemann, CEO Mathias Dähn, CFO Agenda Highlights Q2 2015 Business performance H1 2015 Outlook and strategy KBA Conference Call
S IMMO. Buy (unchanged) Target: Euro (old: Euro 20.00)
 Target: Euro (old: Euro 20.00)") S IMMO Buy (unchanged) Target: Euro 20.50 (old: Euro 20.00) Price (Euro) 16.84 52 weeks range 18.64 / 13.92 Key Data Country Austria Industry Real Estate Market Segment Prime Market ISIN AT0000652250 WKN
S IMMO Buy (unchanged) Target: Euro 20.50 (old: Euro 20.00) Price (Euro) 16.84 52 weeks range 18.64 / 13.92 Key Data Country Austria Industry Real Estate Market Segment Prime Market ISIN AT0000652250 WKN
Rolling Up German Real Estate
 Rolling Up German Real Estate Initiative Immobilien-Aktie Frankfurt / Main Frank Schaich, CEO Page 1 1. Snapshot 2. Fair Value s strategy 3. Real estate portfolio 4. Direct investments 5. Participations
Growing Assets Q Figures
 2014 Growing Assets Q1 2014 Figures CONTENT Content 22 I. TAG Highlights FY 2013 / Q1 2014 3 II. TAG Strategy/ Efficiency: Growth and Margins 5 III. TAG Achievements: Vacancy reduction / rent increases
This document is a non-binding translation only. For the binding document please refer to the German version, published under
 Q1 Interim Report First Quarter 2015 This document is a non-binding translation only. For the binding document please refer to the German version, published under www.adler-ag.com 2 Interim report for
Net income for the period % %
 QUARTERLY STATEMENT Q3 2018 Key figures KION Group overview in million Q3 2018 Q3 2017 * Change Q1 Q3 2018 Q1 Q3 2017 * Change Order intake 2,060.3 1,847.2 11.5% 6,369.3 5,699.5 11.8% Revenue 1,895.9 1,832.4
VALUE. QUALITY. RESPONSIBILITY.
 VALUE. QUALITY. RESPONSIBILITY. SUSTAINABLE PORT- FOLIO MANAGEMENT WITH A COMMITMENT TO QUALITY Deutsche Wohnen, with its focus on Berlin, is one of the leading publicly listed property companies in Europe.
CORESTATE Capital. Company Presentation. February 2018
 CORESTATE Capital Company Presentation February 2018 Disclaimer This presentation contains forward-looking statements that involve a number of risks and uncertainties. Such statements are based on a number
DG HYP INVESTOR PRESENTATION. Situation as at: 30 June 2017
 DG HYP INVESTOR PRESENTATION Situation as at: 30 June 2017 AGENDA 1. Company profile and business strategy 2. Facts and figures 3. DG HYP funding 4. Analysis of the mortgage cover pool 5. Appendix DG HYP
COMPANY PRESENTATION. Deutsches Eigenkapitalforum 2012 Dr. Cornelius Patt, CEO
 COMPANY PRESENTATION Deutsches Eigenkapitalforum 2012 Dr. Cornelius Patt, CEO SAFE HARBOR STATEMENT This document includes supplemental financial measures that are or may be non-gaap financial measures.
Company presentation June 2017
 Company presentation June 2017 1 CONTENT Content I. TAG overview and strategy 3 2 II. III. IV. TAG portfolio TAG return on capex TAG acquisitions and disposals 7 13 18 V. TAG financing structure VI. TAG
THE NEW FREEDOM IN BUSINESS COMMUNI CATIONS.
 THE NEW FREEDOM IN BUSINESS COMMUNI CATIONS. Interim report Q3 2018 KEY FIGURES Business customers 20,000 + Development of seats 305,000 + Revenue 9 months 2018 EUR 31.2 M Share of recurring revenue 81
Interim Report JANUARY TO SEPTEMBER 2017
 9M Interim Report JANUARY TO SEPTEMBER 2017 KEY FIGURES REVENUES AND EARNINGS in EUR k 2017 2016 ¹ 01.01. 30.09.2017 01.01. 30.09.2016 Change Revenues 163,006 163,935 0.6% Total operating performance 157,068
FINANCIAL REPORT 30 NOVEMBER ST HALF OF FISCAL YEAR 2017/2018
 FINANCIAL REPORT 30 NOVEMBER 2017 1ST HALF OF FISCAL YEAR 2017/2018 CONTENTS 03 KEY PERFORMANCE INDICATORS 04 HIGHLIGHTS 05 HELLA ON THE CAPITAL MARKET 07 INTERIM GROUP MANAGEMENT REPORT 07 Economic development
Company presentation. MBB SE Frankfurt am Main, 1 June 2017
 Company presentation MBB SE Frankfurt am Main, 1 June 2017 Mission: As a listed family business, MBB generates exceptional sales and value growth through technological expertise Growth Family business
ACCENTRO Real Estate AG
 ACCENTRO Real Estate AG Germany s Market Leader in Residential Property Privatisation Company Presentation, 9 August 2018 Half-Year Financial Report, 30 June 2018 ACCENTRO AG 1 AGENDA 1 Overview and business
CONFERENCE Call FY2017 Preliminary Results 6 MARCH 2018
 CONFERENCE Call FY07 Preliminary Results 6 MARCH 08 SHOPPING CENTERS # Retail turnover 07 RETAIL SECTOR % change in 07 rent-to-sales ratio in % DEPARTMENT STORES -0.7 6. 7.4 3. FOOD -.5 7.6 8.9 6.4 FASHION
Mission Statement. Key areas of MPH Health Care AG
 INTERIM REPORT 2018 2 Mission Statement As an investment company, the strategic focus of our activities is on companies in high-growth segments of the health care market. This includes services covered
9M 2018 RESULTS 09 NOVEMBER 2018 TLG IMMOBILIEN AG 9M 2018 RESULTS
 TLG IMMOBILIEN AG 9M 208 RESULTS DISCLAIMER This presentation includes statements, estimates, opinions and projections with respect to anticipated future performance of TLG IMMOBILIEN ("Forward-Looking
From melting steel to 3D-printing: investing in the technology-driven German Mittelstand. as at 31 October 2016
 From melting steel to 3D-printing: investing in the technology-driven German Mittelstand as at 31 October 2016 1. The business model GESCO an association of industrial SMEs including market and technology
Quarterly Financial Statements as per 31 March 2015 Conference Call
 Quarterly Financial Statements as per 31 March 2015 Conference Call Munich, 7 May 2015 Andreas Helber, CFO Agenda 1. Development of the Group 1-3/2015 2. Development of the Segments 1-3/2015 3. Outlook
Deutsche Wohnen SE.» Q results. Conference Call, 15 May 2018
 Deutsche Wohnen SE» Q1 2018 results Conference Call, 15 May 2018 1 » Agenda 1 Highlights Q1 2018 2 Portfolio 3 Financials 4 Appendix 2 » Highlights Q1 2018 Operating business remains strong L-f-l rental
Interim report as per March 31, 2017
 Interim report as per March 31, 2017 Key financial figures Sales (in keur) Operating income (in keur) Financial income (in keur) 2013 7,978 2014 11,063 2015 13,659 2016 14,425 2017 14,795 3M 2017 14,795
We create value. TAG ı Interim report ı
 We create value 27 1 TAG ı Interim report ı TAG Group in figures in TEUR 1/1/-3/31/7 1/1/-3/31/6 2 TAG ı TAG Group in figures ı Revenues 12,843 14,594 a) Sale of properties 3,72 8,83 b) Facility management
CORESTATE Capital Group
 CORESTATE Capital Group A Fully Integrated Real Estate Investment Manager As of Q3 2016 1 CORESTATE at a Glance Real Estate Investment Management Platform Real estate investment manager specialized in
T O O U R S H A R E H O L D E R S A N D B U S I N E S S P A R T N E R S,
 III. QUARTERLY REPORT 2000 1/1-9/30/2000 T O O U R S H A R E H O L D E R S A N D B U S I N E S S P A R T N E R S, As expected, growth within the BOV Group accelerated further as of 30 September 2000. With
The Digitisers Quarterly Statement as at 30 June 2017
 The Digitisers Quarterly Statement as at 30 June 2017 Key Figures IFRS in KEUR 10/2016 06/2017 10/2015 06/2016 Difference in % Earnings situation Sales revenues 223,031 199,932 23,099 12% EBITDA 21,828
INDUS business model We are passionate about SMEs
 2 INDUS business model We are passionate about SMEs * As of 1 October 2017, the Group has 45 instead of 46 investments. This is the result of the integration of the FICHTHORN investment in the SELZER Group.
DATAGROUP increases revenues and benefits from low interest rates
 DATAGROUP increases revenues and benefits from low interest rates Q2 figures for FY 2015/2016 (01.01.-31.03.2016) Revenues up 4% to 41.1m (previous year 39.5m) Service share reaches 79% (previous year
GROUP FINANCIAL STATEMENTS
 GROUP FINANCIAL STATEMENTS INSTONE REAL ESTATE GROUP N.V. 31 DECEMBER 2017 FIGURES OF INSTONE REAL ESTATE WE ARE A LEADING NATIONWIDE RESIDENTIAL REAL ESTATE DEVELOPER IN GERMANY. OUR PURCHASER GROUPS
Interim Condensed Consolidated Financial Statements_ for the period 1 January to 31 March 2017
 Interim Condensed Consolidated Financial Statements_ for the period 1 January to 31 March 2017 Consolidated Statements of Financial Position_ 2 Consolidated Statements of Financial Position_ Assets Notes