Metsä Board Investor presentation 1 6/ August 2017
|
|
|
- Lee Porter
- 6 years ago
- Views:
Transcription

1 Metsä Board 3 August 2017

2 Contents 2 1 6/2017 Investment highlights 3 Strategy and financial targets 13 Operating environment and market position 21 Growth in the paperboard business 30 Husum investment programme and update 37 Result for January June Balance sheet and financing 55 Production, capacities and sourcing 63 Product development focus areas 69 Sustainability 74 Shares and owners 80 Appendix 84 Contact information 92

3 Investment highlights
4 4 Metsä Board in brief Focus on premium fresh fibre paperboards Market leader in folding boxboard and white fresh fibre linerboard in Europe, global market leader in coated white fresh fibre linerboard Global sales to over 100 countries and eight production units in Finland and Sweden Strong fibre know-how and self-sufficiency in pulp Sales in 2016 EUR 1.7 billion and comparable operating result EUR 137 million Appr. 2,500 employees in 23 countries 15% 25% 17 % Sales split in % 10% 75 % Folding boxboard Linerboards Market pulp Others 50% Sales split by region in 2016 EMEA Americas APAC


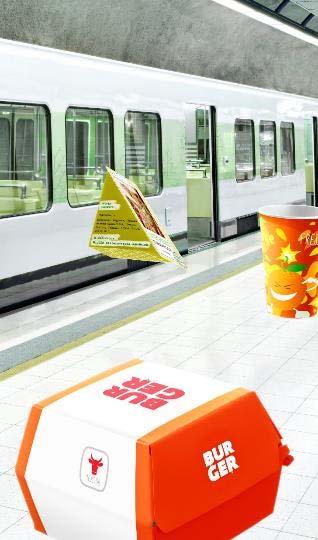
5 Solutions for wide variety of brand applications In pack On shelf On display On the go In graphics Packaging solutions for consumer goods Retail ready tray solutions Display and point-of-sale solutions Solutions for food service Solutions for graphical uses 5
6 Metsä Board has a broad customer base 50% of Metsä Board s folding boxboard sales are negotiated directly with brand owners BRAND OWNERS CONVERTERS MERCHANTS CORRUGATED BOX MANUFACTURERS FOLDING BOXBOARD WHITE LINERBOARDS 6

7 Metsä Board s paperboards have many competitive advantages Lightweight Up to 30% lighter than competing grades (eg SBS, WLC) with at least the same stiffness Purity and safety Important in food and food service packaging, eg recycled paperboard should not be in direct contact with food products Sustainability Wood raw material is 100% traceable to sustainably managed northern forests Quality Excellent printability and runnability 7
 are made of chemical pulp, which maximizes the strength of the board. Coating layers (1) can be one or several and on top or both sides.")
8 Metsä Board s folding boxboard has a three-layer structure Metsä Board s folding boxboards are produced from BCTMP or mechanical pulp, which is used in the middle layer (3) to make the board bulky and light. The two outer fibre layers (2 and 4) are made of chemical pulp, which maximizes the strength of the board. Coating layers (1) can be one or several and on top or both sides. 8
9 Strong profitability development 2016 was negatively impacted by Husum s new FBB machine ramp-up Comparable ROCE-% Comparable EBIT-% % ,4 9,1 11,3 8,1 Target over 12% 10,3 % ,2 6,8 9,0 8,0 9, / /2017 9
10 Strong improvement in productivity over time Personnel Production capacity (tonnes) / employee at current mills Capacity tn / employee Productivity (capacity) Personnel average E

11 High threshold for new producers to enter high-quality paperboard segment High investment costs Limited availability of high yield pulp (e.g. BCTMP) Global brand owners and corrugated box manufacturers not willing to change paperboard suppliers easily in the high-quality segments High speed packaging lines very quality sensitive Requirements for unified brand look and feel globally Sustainability and product safety aspects Skilled people and organizations a crucial success factor 11
12 Clearly lower capex in 2017 EUR million Investments in H were EUR 31 million (H1/16: EUR 103 million) Estimated capex in FY 2017 is EUR million E Maintenance capex Growth capex Depreciation 12 Main growth in capex in : Husum investment programme, extrusion coating line and equity investment in Metsä Fibre s bioproduct mill

13 Strategy and financial targets


14 Metsä Board s vision is to be the preferred supplier of premium paperboards creating value for customers globally Strategic cornerstones Focus Growth Profitability Values Responsible profitability Reliability Cooperation Renewal 14

15 Strategic cornerstones: Focus Focus on premium fresh fibre paperboards for consumer and retail packaging This means to us: We focus on serving customers whose quality expectations require our high quality, light and strong packaging materials Our paperboards are produced from fresh fibres Our products are used for packages at the store and from the store to the consumer 15

16 Strategic cornerstones: Profitability Profitability is based on superior cost efficiency and healthy sales prices driven by high-quality pulps and unique technical know-how This means to us: Our superior cost efficiency will be achieved by further developing productivity and efficiency of our mills, operations and people We will continue to drive down purchasing costs in all areas Our self-sufficiency in high-quality pulps together with unique paperboard making expertise helps us to improve our market position further and maintain healthy price levels 16

17 Strategic cornerstones: Growth Grow profitably together with brand owner, converter and merchant customers globally in businesses that benefit from our safe and sustainable paperboards This means to us: We grow in end-uses where our product is best suited to protecting our customers products and promoting their brands and businesses Our customer base is global, including brand owner, private label, converter and merchant customers By selecting businesses that benefit from our paperboards we can generate value for our customers and grow profitably with them 17
18 Financial targets Efficient use of capital and higher profitability through focused growth Comparable ROCE, % Net IB debt / Comparable EBITDA, % Annual growth in total paperboard deliveries, % Target: > 12% 4,8 6,4 9,1 11,3 8,1 3,4 2,9 1,8 Target: < 2.5x 1,2 2,0 Target is to exceed relevant market growth* 4% 7% 10% 13% 12% * Global fresh fibre paperboard demand growth 3-4%/a Dividend policy: Metsä Board aims to distribute at least 50% of its result for the financial period in annual dividends to its shareholders 18


19 Main priorities and actions to achieve financial targets Grow the paperboard businesses profitably globally Ensure successful sales of new capacity Secure good price levels Keep best in class product quality and improve supply chain Develop new products for existing and new end uses Continue productivity improvements and cost savings 19
20 Dividend and EPS Metsä Board s dividend payout target is at least 50 per cent of the result for the financial period Dividend for 2016: EUR 0.19 per share Totalling EUR 68 million 0,50 0,40 0,30 0,20 0,10 EPS and DPS, EUR Corresponds to 76 per cent of EPS 0, Earnings per share Dividend per share 20

21 Operating environment and market position

22 Global trends driving growth in packaging Growing consumption Stronger demand for sustainable packaging Greater significance of resource efficiency drives circular economy and life-cycle thinking Increasing regulation brings additional obligations Social responsibility throughout the value chain CMD Joukio
23 The global paperboard packaging market is about USD 260 billion The total packaging market is USD 840 billion Average annual growth rate of paperboard packaging USD bn % p.a. Paperboard packaging USD 260 bn Other wood fibre based packaging Non-fibre based packaging Roughly half is made of fresh fibres Source: Smithers Pira
24 Global cartonboard* market is 36 Mt/a of which folding boxboard market is about 9 Mt/a North America 6 Mt/a EMEA 8 Mt/a Avg. growth rate for folding boxboard is 3 4%/a Folding boxboard Other fresh fibre grades (e.g. SBS, CUK) Recycled grades Lat.Am. 2 Mt/a APAC 20 Mt/a 24 * Excluding liquid packaging board, cup & plate stock, liner and uncoated recycled board. Source: Metsä Board estimates
25 Global food service board* market is 3.5 Mt/a Avg. growth rate for food service board is 3 5%/a EMEA 0.9 Mt/a Cups Plates Americas 1.6 Mt/a APAC 1.0 Mt/a Cartons 25 * Base board (e.g. SBB or FBB) only, excl. other laminate materials such as aluminium and PE. Source: Metsä Board estimates
26 Global white linerboard market is 10.5 Mt/a Global white coated kraftliner market is 1 Mt/a White coated kraftliner White uncoated kraftliner White recycled liner Americas 3 Mt/a Americas 3 Mt/a EMEA 4,5 Mt /a APAC 3 Mt/a Global containerboard market is 155 Mt/a, of which White linerboards 7% Brown kraftliner 17% Brown testliner 37% 26 Fluting 39% Source: Metsä Board estimates
27 Metsä Board has a strong position in Europe Largest Folding Boxboard Producers in Europe Total capacity: 3.7M tonnes Largest White Fresh Fibre Linerboard Producers in Europe Total capacity: 2.2M tonnes Metsä Board 36% Metsä Board 31% Stora Enso 20% Smurfit Kappa 22% Kotkamills Oy 11% Mondi 14% Mayr-Melnhof 9% BillerudKorsnäs 10% International Paper 7% SCA 7% Others 17% Others 15% Sources: Company information, Pöyry Management Consulting Oy Q2/2017
28 Market price development in folding boxboard and white-top kraftliner in Europe EUR/ tn Folding boxboard White-top kraftliner 28 Sources: RISI, Inc. & FOEX Indexes Ltd
29 Pulp price development (PIX) EUR Softwood, USD USD Softwood, EUR Hardwood, EUR Hardwood, USD '10 '11 '12 '13 '14 '15 '16 ' Source: Foex Indexes Ltd

30 Growth in the paperboard business
 Recycled paperboards (eg WLC) Source: Metsä Board s own estimate n/a +2%/a or more +1 to +2%/a -1 to +1%/a -1 to -2%/a -2%/a or")
31 Globally growing paperboard market PAPERBOARD 5-YEAR GROWTH FORECAST EMEA Americas APAC Folding boxboard (FBB) Food service board (FSB) Coated white kraftliner n/a Uncoated white kraftliner Other fresh fibre paperboards (eg SBS, CUK) Recycled paperboards (eg WLC) Source: Metsä Board s own estimate n/a +2%/a or more +1 to +2%/a -1 to +1%/a -1 to -2%/a -2%/a or more 31
32 Metsä Board s growth exceeds clearly the average market growth Metsä Board s annual paperboard deliveries, 1,000 tonnes target 32 Fresh fibre linerboard Folding boxboard
33 Most important growth area is Americas 300 Actual and targeted deliveries to Americas ,000 tonnes target Folding boxboard Fresh fibre linerboard 33
34 Metsä Board's regional goals GROWTH IN THE AMERICAS IN THE COMING YEARS MAINTAIN THE STRONG MARKET POSITION IN EUROPE FOCUS ON PREMIUM PAPERBOARD SEGMENTS IN THE ASIA-PACIFIC REGION AMERICAS SHARE OF SALES IN % EMEA SHARE OF SALES IN % APAC SHARE OF SALES IN % 34
35 Metsä Board's growth drivers in Europe GROWTH IN THE AMERICAS IN THE COMING YEARS AMERICAS SHARE OF SALES IN % MAINTAIN THE STRONG MARKET POSITION IN EUROPE EMEA SHARE OF SALES IN % EUROPE A leading market position with strong, FOCUS long-lasting ON customer relationships PREMIUM especially with brand PAPERBOARD owners SEGMENTS IN Safety THE is increasing ASIA-PACIFIC significance in food REGION packaging Paperboard is a strong alternative to plastics and aluminium Growing APAC e-commerce increasing SHARE OF demand SALES IN 2016 for high-end white-top 8 % kraftliners 35
36 Metsä Board's growth drivers in Americas GROWTH IN THE AMERICAS IN THE COMING YEARS AMERICAS SHARE OF SALES IN % MAINTAIN FOCUS ON THE STRONG PREMIUM AMERICAS MARKET PAPERBOARD POSITION Local production IN not able to meet rising SEGMENTS trend of IN EUROPE lightweighting THE ASIA-PACIFIC REGION Non-integrated converters looking for alternative board suppliers Paperboard a strong alternative to plastics especially in food service applications EMEA APAC SHARE Growing OF SALES e-commerce IN 2016 increasing demand SHARE OF for SALES IN high-end % white-top kraftliners 8 % 36

37 Husum investment programme and update

38 Husum investment programme Launched at the end of 2014 Two paper machines closed in 2015 One paper machine converted to produce linerboard (BM2) New folding boxboard machine (BM1) started up in February 2016 Enhancements to the pulp mill and the mill site s own port New extrusion coating line started up in April 2017 Folding boxboard production Capacity approximately 400,000 t/a Deliveries mainly to Americas and food service globally Linerboard production Capacity approximately 270,000 t/a Deliveries to Europe and Americas 38

39 Investment in PE coating EUR 38 million investment, capacity of 100,000 t/a Targeted at food packaging and food service applications PE-coated * paperboard is an alternative to plastics and the mainstream barrier solution today PE fulfills important barrier requirements: Good water and moisture barrier Grease barrier (short time e.g. for food service) Good heat sealing properties Husum PE coating line utilises latest technology and benefits from a fully integrated production site Supports growth in a new customer segment 39
40 The integrated mill model improves efficiency and sustainability of the supply chain Husum integrated mill: Certified wood resources Raw material Own pulp mill at the mill site Paperboard production (BM1) Extrusion coating line (EM1) Own deep water port Raw Pulp material Raw Paperboard material Raw Extrusion material Raw Logistics material 40
41 Targeted sales and sales split for new paperboard volume from Husum mill A total of 400,000 tonnes of new FBB capacity Incremental capacity in linerboard *) 1,000 tonnes Deliveries in 2015 Folding boxboard to Americas Food service board globally Linerboard to Europe and Americas Targeted deliveries in *) Until July 2016 the paperboard machine (BM2) produced simultaneously fine paper reels.

42 Husum folding boxboard update post H1/2017 Capacity utilisation rate in FBB during H was 70% In June, both production and deliveries were over 85% of monthly capacity The target of having the capacity in full use by end of 2018 is intact Production costs per tonne produced still higher compared to Finnish mills Geographical sales mix burdened the average price in FBB Deliveries of own PE-coated paperboards to customers have started 42
43 Potential to improve profitability of Husum At least EUR 100 million EBIT improvement from 2016 to ,000 tonnes 2016 of pulp Efficiency >95% with 2019 production lost in 2016 Restructuring: improvement programme FBB capacity utilisation rate normal sales price + EUR 25 million + EUR 5 million + EUR >70 million 43

44 Result for January June 2017

45 Q in summary Good demand for high-quality paperboards continued Stable or rising market price levels Metsä Board s paperboard deliveries up by 11% from Q The average price of folding boxboard was burdened by Husum s geographic sales mix Steady working capital despite the strong sales growth New extrusion coating line in Husum started up 45
46 Key financials Q2/17 Q1/17 Change Q2/17 vs. Q1/17 H1/17 H1/16 Change H1/17 vs. H1/16 Sales EUR, m % % 1,720 EBITDA* EUR, m % % 231 Operating result* EUR, m % % 138 % of sales % Result before taxes* EUR, m % % 107 Earnings per share EUR % % 0.25 ROCE* % Capex EUR, m % % 162 Cash flow from operations EUR, m % IB Net debt, at end of period EUR, m % % 464 *comparable
47 All-time high in paperboard deliveries 500 Folding boxboard White fresh fibre linerboard 1,000 tonnes Growth in total paperboard deliveries: +11% Q2/17 vs. Q1/17 +18% H1/17 vs. H1/16 +12% FY16 vs. FY15 0 Q Q Q Q Q Q Q Q Q Q FY 2015: 1.4m tonnes FY 2016: 1.6m tonnes
48 Sales and operating result Sales EUR million Comparable operating result EUR million and % EUR million EUR million ,0 % 8,5 % 7,7 % 7,8 % 10,2 % 9,2 % 12% 10% 8% 6% 4% Q1 16 Q2 16 Q3 16 Q4 16 Q1 17 Q Q1 16 Q2 16 Q3 16 Q4 16 Q1 17 Q2 17 2% 0% H1 2016: EUR 859 million +7% H1 2017: EUR 919 million H1 2016: EUR 71 million +25% H1 2017: EUR 89 million 48
49 Impacts on operating result Q vs. Q and H vs. H Comparable operating result, EUR million Q vs. Q EBIT-% 10.2 EBIT-% 9.2 Q Q Comparable operating result, EUR million H vs. H EBIT-% 8.2 EBIT-% 9.7 H H Growing delivery volumes in paperboard and positive development in market pulp - Geographic sales mix of Husum s FBB and product mix of Husum s white linerboards, maintenance at Finnish mills + Positive development at Finnish paperboard mills and in market pulp, positive impact from FX rates including hedges - Increased latex price 49 WTKL = white-top kraftliner FBB = folding boxboard
50 Return on capital employed, % 18% 16% 14% 12% Target >12% 10% 8% Q2/17: 10.3% 6% 4% 2% 0% Q1/13 Q2/13 Q3/13 Q4/13 Q1/14 Q2/14 Q3/14 Q4/14 Q1/15 Q2/15 Q3/15 Q4/15 Q1/16 Q2/16 Q3/16 Q4/16 Q1/17 Q2/17 50 Comparable ROCE, %
51 Cash flows clearly positive Working capital remained nearly unchanged despite the strong growth in Q EUR million Q1/15 Q2/15 Q3/15 Q4/15 Q1/16 Q2/16 Q3/16 Q4/16 Q1/17 Q2/17 51 Cash flow from operations, quarterly Cash flow from operations, rolling 12 months Free cash flow, quarterly Free cash flow, rolling 12 months
52 Stable balance sheet 600 Net gearing, % 44% 54% 49% 44% 44% 45% 0,6 0,5 600 Interest-bearing net debt / comparable EBITDA 2,0 2,1 2,1 2,0 3,0 Financial target: <2.5x 2,0 1,9 2, % 0,4 0, , , ,0 0, /16 9/16 12/16 3/17 6/ /16 9/16 12/16 3/17 6/17 0,0 Interest-bearing net debt, EUR million Net gearing, % Interest-bearing net debt, EUR million Interest-bearing net debt / EBITDA (rolling 12-month) 52

53 Near-term outlook Price levels in FBB are expected to be stable, several linerboard producers have announced price increases. Pulp market expected to remain in balance Metsä Board s Q3 paperboard delivery volumes are expected to stay flat compared to Q2 Focus on improving the geographic sales mix in Husum s folding boxboard and increase the share of North American sales, in particular Start-up phase of Metsä Fibre s new bioproduct mill in August is expected to have only a minor negative impact on Metsä Board s result 53

54 Profit guidance Metsä Board's comparable operating result for the third quarter of 2017 is expected to improve slightly compared to the second quarter of

55 Balance sheet and financing
56 Strong balance sheet 50% 40% 30% 20% 10% 0% Equity ratio, % 48% 51% 46% 41% 39% / % 70% 60% 50% 40% 30% 20% 10% 0% Net gearing, % 70% 51% 44% 45% 32% / Net debt, EUR million and Net debt / Comparable EBITDA 2,9 1,8 1,2 2, /2017 Net debt, EUR million 2, Net debt/ebitda (rolling 12 months) 56
57 Debt structure and liquidity 30 June 2017 Interest-bearing debt, total EUR 640 million Available liquidity, total EUR 343 million Bonds Loans from financial institutions Pension loans Finance leases and other loans Other short-term loans Cash and cash equivalents Revolving credit facility Unraised pension loans 57 Average maturity of long-term loans on 30 June 2017 was 2.0 years.
58 Maturity schedule in long-term IB debt EUR million Long-term interest-bearing debt (total EUR 558 million) and committed undrawn credit facilities 30 June >2021 Long-term interest bearing liabilities Committed undrawn credit facilities 58
59 Debt programmes 30 June 2017 Metsä Board s significant debt securities issued and outstanding at 30 June 2017 Long-term borrowings Total amount, EUR million Outstanding, EUR million Average interest rate* ), % Maturity EUR 225 million bond Issue Syndicated credit facility EUR 51 million bilateral loans EUR 23 million finance leases EUR 213 million pension loans * ) The average interest rate take into account outstanding interest rate swaps and amortised arrangement fees. The average interest rate of all Metsä Board interest bearing net liabilities incl. interest rate derivatives per 30 June 2017 is 3.3%. Metsä Board s principal long-term liquidity reserves at 30 June 2017 Long-term borrowings Total amount, EUR million Outstanding, EUR million Average interest rate* ), % Maturity Revolving credit facility Pension loan facilities Short-term funding programmes Metsä Group internal short-term limit months Metsä Group Treasury funding programmes EUR 150 million domestic CP programme months 59
60 Steadily decreasing net financial costs EUR million % 60 5,0 50 4,6 4,5 40 4,2 30 3,8 4,0 20 3,3 3,3 3, , H1/2017 Net financials in H were EUR -12 million (H1/16: EUR -14 million) Net exchange gains and losses in H1 amounted to EUR -0.6 million (EUR -0.3 million) 60 Net financial costs, EUR million Average interest rate at the end of period, %
61 FX exposure and sensitivities Impact of FX rate changes including hedges Q vs. Q1 2017: EUR -1.5 million H vs. H1 2016: EUR 11 million Annual transaction exposure EUR 1.1 billion 35 % 5 % 2 % USD 58 % SEK GBP Other currencies FX sensitivities excluding hedges 10% strengthening of foreign currency vs. EUR will have an impact on Metsä Board s EBIT of Currency USD, $ SEK GBP, Next 12 months EUR +70 million EUR -40 million EUR +7 million 61 Hedging policy: 100% of balance sheet position and 50% of annual net FX flows
62 Metsä Board 's credit rating BB+ Ba1 BB Ba2 BB- Ba3 Standard & Poor s Moody s Positive Stable B+ B1 B B2 B- B3 CCC+ Caa1 CCC Caa

63 Production, capacities and sourcing

64 Metsä Board s production units 64 Integrated mills Husum, Sweden Kemi 400,000 t/a folding boxboard 270,000 t/a white linerboard 730,000 t/a chemical pulp 410,000 t/a white linerboard 620,000 t/a chemical pulp by Metsä Fibre Äänekoski Joutseno 240,000 t/a folding boxboard 530,000 t/a chemical pulp by Metsä Fibre 320,000 t/a BCTMP 690,000 t/a chemical pulp by Metsä Fibre Non-integrated mills Kyro (Kyröskoski) Simpele 190,000 t/a folding boxboard 280,000 t/a folding boxboard Tako (Tampere) Kaskinen 210,000 t/a folding boxboard 340,000 t/a BCTMP Husum Taking into account Metsä Group s pulp production, Metsä Board s pulp balance is 400,000 t/a long Kemi Äänekoski Kaskinen Simpele Tako Joutseno Kyro
65 Paperboard capacity Town Country Machines Folding boxboard White fresh fibre linerboard Total Tampere (Tako) Finland Kyröskoski (Kyro) Finland Äänekoski Finland Simpele Finland Kemi Finland Husum Sweden Total 8 1, ,000 65
66 Pulp capacity Metsä Board pulp mills Country Chemical pulp BCTMP Total Husum Sweden Joutseno Finland Kaskinen Finland Total ,390 Metsä Fibre pulp mills Country Chemical pulp BCTMP Total Äänekoski Finland Kemi Finland Rauma Finland Joutseno Finland Total 2,480 2,480 66
67 Deliveries by region in 2016 Folding boxboard Fresh fibre linerboard 11% 1% 16% 48% 32% 60% 25% Western Europe 7% Eastern Europe Americas 67 Asia and Pacific
68 Sourcing 2016 Electricity sourcing (total 2,438 GWh) Primary energy used (total 12.0 TWh) Wood sourcing by country (total 4.6 million cubic metres) Purchased energy 45% Outsourced generation 3% Own generation 20% Hydro 4% Gas 7% Peat Coal 2% Oil 2% 2% Russia 13% Baltic countries 18 % Sweden 38% Through PVO shareholding 32% Nuclear power 22% Woodbased 60% Finland 31% 68

69 Product development focus areas
70 Key product development focus areas Sustainable lightweighting Improved BCTMP Microfibrillated cellulose (MFC) Strength additives Barrier board PE extrusion coated products Dispersion barriers Bio-based raw materials 70


71 Lighter-weight paperboards: Better with Less SBB Solid bleached board Average FBB Folding boxboard Metsä Board lightweight paperboard WLC White lined chipboard 71


72 Metsä Board Barrier boards roadmap Bio based barrier Bio based light barrier Bio based barrier Non bio-based barrier Outsourced PE extrusion coating Own PE extrusion coating
73 Barrier boards types BIODEGRADABLE RENEWABLE Bio based, bio-degradable coating, i.e. starch, PLA etc. Bioplastic coating, i.e. green PE Oil based, bio-degradable coating Latex based dispersion coating PE extrusion coating NON-RENEWABLE Metsä Board s baseboard is bio based, biodegradable and compostable. NON-BIODEGRADABLE 73

74 Sustainability
75 The circular economy of a durable and safe package Pure paperboard helps to store the packaged product safely. Fresh fibre is a pure and safe, renewable raw material. Our paperboards are recyclable and biodegradable, or they can be used for energy production. Durable paperboard protects the packaged product effectively. We only use carefully selected and safe raw materials in our products. We follow good manufacturing principles (GMP). All of our products meet the requirements of relevant international legislation. 75
76 Metsä Board uses water efficiently Rain waters the forest Metsä Board has decreased its CO 2 emissions by 45% since 2009 and the use of water by 14% since % of water used in the production process is returned back to the waterways Also lakes and seas are a source of recreation Forests are a source of recreation Metsä Board s board production is mostly integrated in pulp production Waste waters are always carefully cleaned before returned back to the waterways Light weight boards are resource efficient both for us as well as for our customers Bark is utilised as a bio-energy source Metsä Board only uses surface water in its production Metsä Board s paperboards can be recycled, depending upon local recycling services


77 Metsä Board s sustainability targets WOOD THE SHARE OF CERTIFIED WOOD >80% PERFORMANCE % BIOENERGY SHARE OF TOTAL PURCHASED ENERGY 51% WELL-BEING SICKNESS ABSENTEEISM <3% PERFORMANCE % CLIMATE FOSSIL CO 2 EMISSIONS PER PRODUCT TONNE % PERFORMANCE % LOGISTICS ENSURE THE SUSTAINAINABILITY OF MAIN LOGISTIC FLOWS PERFORMANCE % SAFETY AT WORK -10% LOST-TIME ACCIDENTS FREQUENCY ANNUALLY PERFORMANCE % ENERGY ENERGY EFFICIENCY IMPROVEMENT PERFORMANCE % RESOURCE EFFICIENCY 12% -17% PROCESS WATER USE PER PRODUCT TONNE PERFORMANCE % 77


78 Metsä Board scored again high in CDP in 2016 CDP Water A List For the second year in a row Metsä Board was globally the only forest company chosen to the A List CDP Climate A List Only 9% of the companies were chosen on the list CDP Forest programme Leadership status CDP Supply chain programme Metsä Board participates together with its customers L Oréal nominated Metsä Board to its best performer as packaging material supplier in
 No regulation of mineral oil but concentration limits of")
79 Increased regulation to ensure product safety EU Commission In December 2016, announced plans to regulate printed food contact materials (FCMs) on EU level Food Contact Material legislation in Switzerland Part of Swiss Food law Recycled paper cannot be used as FCM, if direct contact with food products (exceptions for example eggs) No regulation of mineral oil but concentration limits of certain polyaromatic hydrocarbons micrograms/kg food has been set Draft German mineral oil regulation 4th ordinance draft was published in March 2017 The draft focuses on mineral oil migration from recycled fibre based packaging materials to food EU notification is expected to start during autumn
80 Shares and owners
81 Market cap and ownership distribution Metsä Board shares (METSB, METSA) are listed on Nasdaq Helsinki Market cap and foreign owners 30 June 2017 Ownership distribution 30 June 2017 EUR million % / % 18 % Metsäliitto Cooperative 22 % 42 % Domestic institutional investors Domestic private investors * Foreign owners Market cap, EUR million Share of foreign owners, % * Metsäliitto Cooperative has 61% of voting rights 81
82 Ownership structure on 30 June 2017 Shares, % (total no. of shares 355,512,746) Votes, % (total no. of votes 1,037,530,115) 4 % 2 % 3 % 13 % 42 % Metsäliitto Cooperative Foreign owners* Households Public sector organisations 11 % 1 % 4 % 1 % 7 % Metsäliitto Cooperative Public sector organisations Households Foreign owners* 18 % 18 % Finance and insurance companies Non-profit organisations 15 % 61 % Non-profit organisations Finance and insurance companies Other companies * incl. nominee registered Other companies 82 Metsä Board has two series of shares: 35,886,682 A-shares and 319,626,064 B-shares. A-share entitles to 20 votes and B-share entitle to 1 vote at a General Meeting.
83 Transformation has increased shareholder value Enterprise value, EUR million Dividend and payout ratio % EUR mill EUR 0,20 0,16 0,12 0,08 0,04 90 % 75 % 60 % 45 % 30 % 15 % , % Net debt Market capitalization Dividend, EUR Dividend/EPS, % 83


84 Appendix


85 Corporate Management Team Mika Joukio CEO Chairman of CMT since 2014 Share ownership 261,884 Jussi Noponen CFO Member of CMT since 2016 Share ownership: 50,000 Sari Pajari SVP, Marketing and Sales Member of CMT since 2011 Share ownership: 45,740 Ari Kiviranta SVP, Development Member of CMT since 2014 Share ownership: 16,236 Susanna Tainio SVP, HR Member of CMT since 2015 Share ownership 20,505 Harri Pihlajaniemi was appointed SVP, Production, and a member of the Corporate Management Team on 6 June He will start by 6 September 2017 at the latest. Share ownerships are B-shares 85
86 METSÄ GROUP Sales EUR 4.7 billion Personnel 9,300 METSÄLIITTO COOPERATIVE Group s parent company Owned by 104,000 Finnish forest owners METSÄ FOREST METSÄ TISSUE METSÄ WOOD METSÄ BOARD METSÄ FIBRE Wood Supply and Forest Services Tissue and cooking papers Wood Products Paperboard Pulp and Sawn Timber Sales: EUR 1.5 billion Personnel: 860 Sales: EUR 1.0 billion Personnel: 2,700 Sales: EUR 0.5 billion Personnel: 1,520 Sales: EUR 1.7 billion Personnel: 2,500 Sales: EUR 1.6 billion Personnel: 1,230 Metsäliitto Cooperative holding 100% Metsäliitto Cooperative holding 100% Metsäliitto Cooperative holding 100% Metsäliitto Cooperative holding 42%, 61% of votes Metsäliitto Cooperative holding 50.2%, Metsä Board 24.9%, Itochu Corporation 24.9% 86
87 Metsä Board s associated company Metsä Fibre builds a Bioproduct Mill INVESTMENT, EUR 1.2 billion WOOD USAGE, m 3 /a 6.5 million CERTIFIED WOOD 90 percent CAPACITY, tonnes/a 1.3 million METSÄ BOARD INVESTED EUR 24.9 MILLION IN EQUITY COMPANY S PULP BALANCE WILL GROW BY 200,000 TONNES/A. ELECTRICITY, Wh/a 1.8 tera ELECTRICITY SELF SUFFICIENCY 240 percent START UP August

 100% of sales from 2017 onwards Major improvement in profitability and financial")

88 Restructuring to a pure-play paperboard company from 2005 onwards From 26 to 8 production units Paper capacity from 5 million tonnes to zero Paperboard capacity from 1.1 million tonnes to 2.0 million tonnes Major divestments incl. Graphic Papers and Map Merchants Paperboard (incl. market pulp) 100% of sales from 2017 onwards Major improvement in profitability and financial position Today strong position and growing #1 producer of folding boxboard in Europe #1 producer of coated white-top kraftliner globally Husum investment programme enabling significant growth steps 88
89 M&A activity Acquisitions Biberist Paper Mill Simpele Mill UK Paper Modo Paper Zanders Kemiart Liners (53 %) Chemicals Business Divestments 89 Botnia Wood Corrugated Packaging MD Papier Albbruck Metsä Tissue Savon Sellu Forestia PSM 8% in Botnia 9% in Botnia Carton plants Map New Thames Graphic Papers B2 shares in PVO MB Uruguay Part of Reflex Hallein mill Rest of Reflex 0.5% in PVO Alizay mill Lielahti real estate 7.3 % in Metsä Fibre Gohrsmühle mill
90 Significant Divestments EUR 3.7 billion in assets divested since 2001 Year Divestiture Enterprise Value, EUR million 2015 Gohrsmühle mill in Germany neg Lielahti real-estate Alizay property and other estates % stake in Metsä Fibre % stake in PVO Hallein Metsä-Botnia s Uruguayan operations 300* 2008 Graphic Papers ,000 shares in PVO New Thames mill 82** 2007 Map Merchant Group Folding carton plants Botnia (9%) Botnia (8%) Savon Sellu Forestia (95%) Metsä Tissue Papierfabrik Albbruck MD Papier Noviant (19%) 41 3, * Cash portion **Incl. pension liabilities
91 Sales and EBIT-% development ,6 6,8 9,0 8,0 9,0 7,0 % ,2 5, ,8 1,1 2,4 3,6 3,0 1,0 1, ,1 6, ,0 5,0 7,0 Sales, EUR million Comparable EBIT % 91

92 Contact information Katri Sundström Vice President, Investor relations Tel
93
Metsä Board Presentation material Jussi Noponen, CFO Katri Sundström, Head of IR
 Metsä Board Presentation material Jussi Noponen, CFO Katri Sundström, Head of IR Jefferies Industrials Conference 2017 New York, US Contents Company highlights....... 3 Husum investment programme and update
Metsä Board Investor presentation 1 9/ November 2017
 Metsä Board 1 November 2017 Contents Investment highlights 3 Strategy and financial targets 13 Operating environment and market position 21 Growth in the paperboard business 30 Husum investment programme
Metsä Board Investor presentation 1 3/ May 2017
 Metsä Board 1 3/2017 4 May 2017 Contents Investment highlights 3 Strategy and financial targets 12 Operating environment and market position 20 Growth in the paperboard business 29 Result for January March
Metsä Board Investor presentation 1 6/ August 2018
 Metsä Board 2 August 2018 Contents This is Metsä Board 3 Strategy and financial targets 14 Operating environment and market position 21 Growth in the paperboard business 32 2018 Half-Year Financial Report
Metsä Board Investor presentation January-September 2016
 Metsä Board Investor presentation January-September 2016 Contents Investment highlights 3 Strategic cornerstones and financial targets 12 Operating environment and market position 22 Q3/2016 results and
Metsä Board Investor presentation Q4/2015
 Metsä Board Investor presentation Q4/2015 Q4/2015 Contents Investment highlights 3 Operating environment and market position 15 Strategic cornerstones and financial targets 22 Finalising the transformation
Metsä Board. Investor presentation January December 2018
 Metsä Board January December 2018 Contents Metsä Board in brief 3 Operating environment and demand drivers 15 Main contributors in Metsä Board s profitability 23 Results: January September 2018 29 Balance
Metsä Board. Half Year Report 1 6/2017 Presentation material
 Metsä Board Half Year Report 1 6/217 Presentation material Q2 217 in summary Good demand for high-quality paperboards continued Stable or rising market price levels Metsä Board s paperboard deliveries
Metsä Board. Interim report 1 3/2017 Presentation material
 Metsä Board Interim report 1 3/217 Presentation material Q1 217 in summary Good demand for high-quality paperboards continued Stable or rising market price levels Metsä Board s paperboard and market pulp
Metsä Board. Final Steps of Transformation to a Paperboard Company. Mika Joukio, CEO 10 December Metsä Board
 Metsä Board Final Steps of Transformation to a Paperboard Company Mika Joukio, CEO 10 December 2014 Metsä Board Metsä Board Grows Its Paperboard Business, Plans to Fully Exit Paper Production and Considers
Metsä Board. Interim Report 1 9/2017 Presentation material
 Metsä Board Interim Report 1 9/217 Presentation material January September 217: Increasing sales and improved operating result EUR million Sales EUR million 5 4 3 2 1 436 423 44 422 445 474 479 Q1 16 Q2
Metsä Board. Q4 and FY 2016 Results
 Metsä Board Q4 and FY 216 Results Q4 216 in summary Sales declined moderately, and comparable EBIT remained roughly at the same level as in Q3 216 Delivery volumes in paperboard and market pulp declined
Metsä Board Interim report Q3/2015
 Metsä Board Interim report Solid performance in Profitability improved from the previous quarter Paperboard delivery volumes grew and price levels remained stable Production of coated paper ended at Husum
Metsä Board Corporation s operating result for the first half of 2012 excluding nonrecurring items was EUR 24 million
 Metsä Board Corporation Interim Report 1 January 30 June 2012 Metsä Board Corporation s operating result for the first half of 2012 excluding nonrecurring items was EUR 24 million Result for the first
Improving profitability, solid financial position and updated financial targets
 Improving profitability, solid financial position and updated financial targets Jussi Noponen CFO Metsä Board Capital Markets Day 2017 Disclaimer This presentation includes forward-looking statements.
Q METSÄ BOARD CORPORATION INTERIM REPORT. Metsä Board Interim Report 1 January 30 September November 2014 at 12:00 noon Page 1 / 29
 Page 1 / 29 METSÄ BOARD CORPORATION INTERIM REPORT Q3 2014 Metsä Board is Europe s leading producer of folding boxboard, the world s leading manufacturer of coated white-top fresh forest fibre kraftliners
M-real. More Focused and Profitable Company. Henri Sederholm AVP, Group Financing. Citi European Credit Conference.
 M-real More Focused and Profitable Company Henri Sederholm AVP, Group Financing Citi European Credit Conference November 25 2008 1 Agenda 1. General 2. Successful strategic review 3. Graphic Papers divestment
Metsä Group Interim Report Q3/2016
 Metsä Group Interim Report Q3/2016 Kari Jordan President and CEO Metsä Group Q3 Business developed as expected Sales EUR 3,483 million (1 9/2016: EUR 3,811 million) Comparable operating result EUR 332
METSÄ BOARD INTERIM REPORT
 Page 1/25 METSÄ BOARD INTERIM REPORT JANUARY SEPTEMBER 2017 Page 2/25 METSÄ BOARD S COMPARABLE OPERATING RESULT IN JANUARY SEPTEMBER 2017 WAS EUR 139 MILLION JANUARY SEPTEMBER 2017 (1 9/2016) Sales were
METSÄ BOARD CORPORATION INTERIM REPORT
 Page 1/29 METSÄ BOARD CORPORATION INTERIM REPORT Q1/2016 Metsä Board is a leading European producer of folding boxboards and white fresh forest fibre linerboards, and a market pulp supplier. Its lightweight
METSÄ BOARD CORPORATION INTERIM REPORT Q3/2015
 Page 1/29 METSÄ BOARD CORPORATION INTERIM REPORT Q3/2015 Page 2/29 METSÄ BOARD CORPORATION S OPERATING RESULT EXCLUDING NON-RECURRING ITEMS FOR JANUARY SEPTEMBER 2015 WAS EUR 144.8 MILLION RESULT FOR JANUARY
METSÄ BOARD CORPORATION HALF YEAR FINANCIAL REPORT JANUARY-JUNE 2016
 METSÄ BOARD CORPORATION HALF YEAR FINANCIAL REPORT JANUARY-JUNE 2016 Half year financial report 1 January 30 June 2016 4 August 2016 at 12:00 noon Page 1/30 METSÄ BOARD CORPORATION S OPERATING RESULT EXCLUDING
METSÄ BOARD INTERIM REPORT
 Page 1/24 METSÄ BOARD INTERIM REPORT JANUARY SEPTEMBER 2016 Metsä Board is a leading European producer of folding boxboards and white linerboards made from fresh fibres, and a market pulp supplier. Its
M-real s operating result excluding non-recurring items for the first half of 2011 EUR 75 million
 M-real s operating result excluding non-recurring items for the first half of 2011 EUR 75 million Result for the first half of 2011 Sales EUR 1,345 million (Q1 Q2/2010: 1,278) Operating result excluding
METSÄ BOARD CORPORATION INTERIM REPORT Q2/2015
 Page 1/29 METSÄ BOARD CORPORATION INTERIM REPORT Q2/2015 Page 2/29 METSÄ BOARD CORPORATION S OPERATING RESULT EXCLUDING NON-RECURRING ITEMS FOR THE FIRST HALF OF 2015 WAS EUR 90.2 MILLION RESULT FOR THE
METSÄ BOARD ANNUAL REPORT 2015
 METSÄ BOARD ANNUAL REPORT 2015 CONTENTS 2 CEO's review 4 Strategy and operating environment 6 Restructuring 8 Markets 10 Products 12 Personnel 14 Sustainability 18 Financial statements The Carta Integra
METSÄ BOARD FINANCIAL STATEMENTS BULLETIN. Financial statements bulletin for 1 January 31 December February 2018 at 12:00 noon Page 1/27
 METSÄ BOARD FINANCIAL STATEMENTS BULLETIN 2017 Financial statements bulletin for 1 January 31 December 2017 Page 1/27 Page 2/27 METSÄ BOARD S COMPARABLE OPERATING RESULT IN 2017 WAS EUR 194 MILLION JANUARY
Metsäliitto Group s operating profit excluding non-recurring items EUR 178 million in the first half of the year
 1/16 Metsäliitto Group Interim Report January June Metsäliitto Group s operating profit excluding non-recurring items EUR 178 million in the first half of the year Result for the first six months of Sales
METSÄ BOARD INTERIM REPORT
 Financial statements bulletin for 1 January 31 March 2018 03/05/2018 at 12:00 noon Page 1/26 METSÄ BOARD INTERIM REPORT JANUARY SEPTEMBER 2018 Page 2/26 METSÄ BOARD S COMPARABLE OPERATING RESULT IN JANUARY
Creating value in the bioeconomy. CEO Karl-Henrik Sundström
 Creating value in the bioeconomy CEO Karl-Henrik Sundström We are perfectly positioned to benefit from the megatrends Global warming Growing middle class Eco awareness Changing lifestyles Increasing demand
Metsä Group s operating result excluding non-recurring items in January September was EUR 256 million
 Metsä Group Interim Report 1 January 30 September Stock Exchange Release 1 (28) Metsä Group s operating result excluding non-recurring items in January September was EUR 256 million Result for January
Nordea Forest Products & Paper Seminar 11 May 2016 Susanne Lithander, CFO
 WE PACKAGING FOR A Nordea Forest Products & Paper Seminar 11 May 2016 Susanne Lithander, CFO PURE PLAY PACKAGING MATERIALS COMPANY High performance packaging materials Target customer segments requiring
Metsäliitto Group s operating result excluding nonrecurring items was EUR 405 million
 1 (21) Metsäliitto Group s operating result excluding nonrecurring items was EUR 405 million Result for January September Sales EUR 3,986 million (1 9/: EUR 3,647 million). Operating result excluding non-recurring
Nedbank Capital 2010 Investment Conference. 22 September 2010
 Nedbank Capital 2010 Investment Conference 22 September 2010 Agenda Mondi at a glance Group strategy Segment review Summary Presenter David Hathorn Chief Executive Officer Mondi Nedbank Capital 2010 Investment
Metsäliitto Group s operating result excluding nonrecurring items was EUR 120 million in January-September
 Interim report January September October 22, 1 (20) Metsäliitto Group s interim report 1 9/ Metsäliitto Group s operating result excluding nonrecurring items was EUR 120 million in January-September Result
Stora Enso strategy and market environment. CEO Karl-Henrik Sundström
 strategy and market environment CEO Karl-Henrik Sundström Finnish Large Cap Summit 214 2 November 214 It should be noted that certain statements herein which are not historical facts, including, without
MONDI GROUP Deutsche Bank 9 th European Paper Seminar. 8 November 2011 London
 MONDI GROUP Deutsche Bank 9 th European Paper Seminar 8 November 2011 London Mondi s strategic positioning Current trading update Medium term sector fundamentals Cash flow prioritisation Appendices Mondi
METSÄ GROUP INTERIM REPORT
 METSÄ GROUP INTERIM REPORT JANUARY MARCH 2016 Metsä Group Interim Report 1 January 31 March 2016 Page 1/25 Page 1/25 METSÄ GROUP S OPERATING RESULT EXCLUDING NON-RECUR- RING ITEMS WAS EUR 109 MILLION IN
Metsä Group s operating result for January March was EUR 89 million excluding non-recurring items
 Metsä Group Interim Report 1 January 31 March 2013 Stock Exchange Release 1 (29) Metsä Group s operating result for January March was EUR 89 million excluding non-recurring items Result for the first quarter
Transformation driving sales growth
 Transformation driving sales growth Martin Ros SVP, Group Treasurer Disclaimer It should be noted that Stora Enso and its business are exposed to various risks and uncertainties and certain statements
METSÄ BOARD INTERIM REPORT
 Page 1/24 METSÄ BOARD INTERIM REPORT JANUARY MARCH 2017 Page 2/24 METSÄ BOARD'S COMPARABLE OPERATING RESULT IN JANUARY MARCH 2017 WAS EUR 45 MILLION JANUARY MARCH 2017 (10 12/2016) Sales amounted to EUR
UPM Financial Review Jussi Pesonen President and CEO 2 February 2011
 UPM Financial Review 2 Jussi Pesonen President and CEO 2 February 211 2 in brief Solid top-line recovery in all businesses 2 UPM - 2 sales grew by 16%, driven by volumes - sales grew by 12%, driven by
Carnegie Pulp & Paper Seminar March 2016 Susanne Lithander, CFO
 WE PACKAGING FOR A Carnegie Pulp & Paper Seminar March 2016 Susanne Lithander, CFO PURE PLAY PACKAGING MATERIALS COMPANY High performance packaging materials Target customer segments requiring strong,
Stora Enso Profitable growth
 Stora Enso Profitable growth SVP, Investor Relations Ulla Paajanen-Sainio 9 March 2016 Disclaimer It should be noted that certain statements herein which are not historical facts, including, without limitation
Metsäliitto Group s operating result excluding non-recurring items was EUR 314 million in 2011
 Metsäliitto Group Financial Statements Bulletin 2011 Stock Exchange Release 1 (30) This 2011 Financial Statements Bulletin still uses the Metsäliitto Group company names in use in 2011. Metsäliitto Group
Stora Enso strategy and Q3 results. SVP, Head of Investor Relations, Ulla Paajanen-Sainio
 strategy and Q3 results SVP, Head of Investor Relations, Ulla Paajanen-Sainio It should be noted that certain statements herein which are not historical facts, including, without limitation those regarding
Metsäliitto Group s operating result excluding nonrecurring items EUR 130 million
 Metsäliitto Group Interim Report 1 January 31 March 2011 4 May 2011 1 (20) Metsäliitto Group s operating result excluding nonrecurring items EUR 130 million Result for the first quarter of 2011 Sales were
MONDI GROUP RESULTS FOR THE YEAR ENDED 31 DECEMBER February 2011
 MONDI GROUP RESULTS FOR THE YEAR ENDED 31 DECEMBER 21 February 2011 Agenda Highlights Financial overview Operational review Summary Appendices Page 2 Key financial highlights Earnings significantly up
MONDI GROUP Merrill Lynch Pan European Paper & Packaging Forum September 2011 London
 MONDI GROUP Merrill Lynch Pan European Paper & Packaging Forum 2011 20 September 2011 London Mondi s strategic positioning Sector fundamentals Cash flow prioritisation Appendices Mondi September 2011 Page
Financial results Q April 2011
 Financial results Q1 2011 20 April 2011 It should be noted that certain statements herein which are not historical facts, including, without limitation those regarding expectations for market growth and
ANNUAL GENERAL MEETING President and CEO Jussi Pesonen
 ANNUAL GENERAL MEETING 2014 President and CEO Jussi Pesonen Contents Year 2013 in transformation strategy Sustainable competitiveness Summary 2 3 YEAR 2013 Profitability over two economic slowdowns Europe
METSÄ GROUP HALF YEAR FINANCIAL REPORT
 Page 1/25 METSÄ GROUP HALF YEAR FINANCIAL REPORT JANUARY JUNE 2016 Page 1/25 METSÄ GROUP S OPERATING RESULT EXCLUDING NON-RECUR- RING ITEMS IN JANUARY JUNE 2016 WAS EUR 229 MILLION JANUARY JUNE 2016 (1
Financial Insights. Finnish and Swedish Forest Industry Q Tieto Forest Industry Consulting
 Financial Insights Finnish and Swedish Forest Industry Q3 Tieto Forest Industry Consulting www.tieto.com Executive summary In the manufacturing and forest sector, there is a strong digitalization trend
Stora Enso s strategy and market environment. Nordea Forest Products & Paper Seminar, 28 May 2014 CFO Seppo Parvi Stora Enso
 s strategy and market environment Nordea Forest Products & Paper Seminar, 28 May 2014 CFO Seppo Parvi It should be noted that certain statements herein which are not historical facts, including, without
Metsä Group s operating result for January June EUR 114 million excluding non-recurring items
 Metsä Group Interim Report 1 January 30 June 2012 Stock Exchange Release 1 (24) Metsä Group s operating result for January June EUR 114 million excluding non-recurring items Result in the first half of
Mondi Group Full year results for the year ended 31 December February 2015
 Mondi Group Full year results for the year ended 31 December 2014 24 February 2015 Agenda Highlights Financial overview Operational overview Delivering on our strategy Outlook Appendices 2 Highlights million
INTERIM REPORT 1 JANUARY 30 SEPTEMBER 2011
 INTERIM REPORT 1 JANUARY 30 SEPTEMBER 2011 1 2 3 4 UPM INTERIM REPORT 1 JANUARY 30 SEPTEMBER 2011 Q3/2011 Earnings per share excluding special items were EUR 0.19 (0.28), and reported EUR 0.21 (0.34) EBITDA
Navigating through the storm
 Navigating through the storm Markus Rauramo, CFO 4 June 2009 It should be noted that certain statements herein which are not historical facts, including, without limitation those regarding expectations
Financial results for Q4 and full year 2016
 Financial results for Q4 and full year 2016 CEO Karl-Henrik Sundström CFO Seppo Parvi Disclaimer It should be noted that Stora Enso and its business are exposed to various risks and uncertainties and certain
Metsä Group s operating result for 2013 excluding non-recurring items was EUR 342 million
 Metsä Group Financial Statements Bulletin Stock Exchange Release 1 (29) Metsä Group s operating result for excluding non-recurring items was EUR 342 million Operating result excluding non-recurring items
Navigating through the storm
 Navigating through the storm Jouko Karvinen, CEO 27 May 2009 It should be noted that certain statements herein which are not historical facts, including, without limitation those regarding expectations
Transformation driving sales growth
 Transformation driving sales growth CEO Karl-Henrik Sundström Disclaimer It should be noted that and its business are exposed to various risks and uncertainties and certain statements herein which are
Sustainable profitable growth continues despite temporary headwinds Financial results for Q2 2018
 Sustainable profitable growth continues despite temporary headwinds Financial results for Q2 2018 CEO Karl-Henrik Sundström CFO Seppo Parvi Disclaimer It should be noted that Stora Enso and its business
Financial results for Q3 2017
 Financial results for Q3 2017 CEO Karl-Henrik Sundström CFO Seppo Parvi Disclaimer It should be noted that Stora Enso and its business are exposed to various risks and uncertainties and certain statements
Accelerating our renewable future. CFO Seppo Parvi 29 November 2017
 Accelerating our renewable future CFO Seppo Parvi Disclaimer It should be noted that and its business are exposed to various risks and uncertainties and certain statements herein which are not historical
UPM. SEB Enskilda Finnish Blue Chip Seminar Jussi Pesonen President and CEO 25 August, 2011
 UPM SEB Enskilda Finnish Blue Chip Seminar 2011 Jussi Pesonen President and CEO 25 August, 2011 FINANCIALS Q2 2011 FINANCIALS Solid result despite challenging cost environment Q2/2011 vs. Q2/2010 H1/2011
Interim report 1 January 30 September 2012
 Interim report 1 January 30 September 2012 1 2 3 4 UPM interim report 1 January 30 September 2012 Q3/2012 Earnings per share excluding special items were EUR 0.15 (0.19), and reported EUR 0.06 (-0.21)
METSÄ GROUP HALF YEAR FINANCIAL REPORT
 EET Page 1/26 METSÄ GROUP HALF YEAR FINANCIAL REPORT JANUARY JUNE 2018 EEST Page 1/26 METSÄ GROUP S COMPARABLE OPERATING RESULT IN JANUARY JUNE 2018 WAS EUR 418 MILLION JANUARY JUNE 2018 (1 6/2017) Sales
Financial results for Q1 2017
 Financial results for Q1 2017 CEO Karl-Henrik Sundström CFO Seppo Parvi Disclaimer It should be noted that Stora Enso and its business are exposed to various risks and uncertainties and certain statements
Promising start of the year Financial results for Q CEO Karl-Henrik Sundström CFO Seppo Parvi. 27 April 2018
 Promising start of the year Financial results for Q1 2018 CEO Karl-Henrik Sundström CFO Seppo Parvi Disclaimer It should be noted that Stora Enso and its business are exposed to various risks and uncertainties
UPM Q4 RESULTS Jussi Pesonen President and CEO 31 January 2013
 UPM Q4 RESULTS 212 Jussi Pesonen President and CEO 31 January 213 Q4 212 highlights Stable financial performance compared with Q3 212 and Q4 211 Operating cash flow continued strong at EUR 352m in Q4 212
RISI International Containerboard Conference 2018
 RISI International Containerboard Conference 2018 The European Containerboard Market Florian Stockert November 2018 The image part with relationship ID rid10 was not found in the file. The image part with
Financial Results Q CEO Karl-Henrik Sundström and CFO Seppo Parvi
 Financial Results Q3 2014 CEO Karl-Henrik Sundström and CFO Seppo Parvi 22 October 2014 It should be noted that certain statements herein which are not historical facts, including, without limitation those
Stora Enso s transformation to renewable materials company. Acting CFO Jyrki Tammivuori
 Stora Enso s transformation to renewable materials company Acting CFO Jyrki Tammivuori 09 September 2013 It should be noted that certain statements herein which are not historical facts, including, without
Acquisition of M-real Coated Graphics Paper Business 29 September 2008
 Acquisition of M-real Coated Graphics Paper Business 29 September 2008 This document is not an offer of securities for sale in the United States. Securities may not be offered or sold in the United States
Third Quarter & First Nine Months November 2015
 Third Quarter & First Nine Months 2015 4 November 2015 Disclaimer The presentation contains forward-looking statements, including statements about the Company's intentions, beliefs and expectations. These
Financial results for Q3 2016
 Financial results for Q3 2016 CEO Karl-Henrik Sundström CFO Seppo Parvi Disclaimer It should be noted that Stora Enso and its business are exposed to various risks and uncertainties and certain statements
INTERIM REPORT 1 JANUARY 30 JUNE 2009
 1 2 3 4 INTERIM REPORT 1 JANUARY 30 JUNE 2009 UPM Interim Report 1 January 30 June 2009 Earnings per share for the second quarter were 0.02 (0.18), and excluding special items 0.03 (0.17) Operating profit
Stora Enso transformation. CFO Karl-Henrik Sundström
 Stora Enso transformation CFO Karl-Henrik Sundström 7 May 2013 It should be noted that certain statements herein which are not historical facts, including, without limitation those regarding expectations
Carnegie Small & Mid Cap Seminar September Per Lindberg, CEO and President, and Susanne Lithander, CFO
 Carnegie Small & Mid Cap Seminar September 2014 Per Lindberg, CEO and President, and Susanne Lithander, CFO 1 WE PACKAGING FOR A 2 BILLERUDKORSNÄS IN FACTS & FIGURES NET SALES (2013) 20 Billion SEK OPERATING
Orders received, net sales and profitability increased
 Orders received, net sales and profitability increased Interim Review, January March 216 April 27, 216 Pasi Laine, President and CEO Kari Saarinen, CFO Agenda Interim Review, January March 216 1 2 3 4
Financial results for Q4 and full year 2017
 Financial results for Q4 and full year 2017 CEO Karl-Henrik Sundström CFO Seppo Parvi Disclaimer It should be noted that Stora Enso and its business are exposed to various risks and uncertainties and certain
Metsä Group Financial Statements Bulletin February 2019 at 12:00 noon EET Page 1/27 DE METSÄ GROUP FINANCIAL STATEMENTS BULLETIN
 Page 1/27 DE METSÄ GROUP FINANCIAL STATEMENTS BULLETIN 2018 Page 1/27 METSÄ GROUP S COMPARABLE OPERATING RESULT IN 2018 WAS EUR 849 MILLION JANUARY DECEMBER 2018 (1 12/2017) Sales were EUR 5,709 million
UPM-Kymmene. Interim Review
 UPM-Kymmene Interim Review 1 6/2002 UPM-Kymmene Interim Review 1 January 30 June 2002 Second-quarter earnings per share, excluding capital gains/losses, were 0.49 (0.60 for the first quarter). Operating
JANUARY 1 SEPTEMBER 30, 2018 (compared with the year-earlier period)
") Q3 218 JANUARY 1 SEPTEMBER 3, 218 (compared with the year-earlier period) Net sales increased 11% to SEK 13,829m (12,422). The growth was primarily attributable to Paper and Wood. EBITDA increased 46%
Q3 218 JANUARY 1 SEPTEMBER 3, 218 (compared with the year-earlier period) Net sales increased 11% to SEK 13,829m (12,422). The growth was primarily attributable to Paper and Wood. EBITDA increased 46%
INTERIM REPORT 1 JANUARY 30 JUNE 2013
 INTERIM REPORT 1 JANUARY 30 JUNE 2013 1 2 3 4 Q2/2013 (compared with Q2/2012) Earnings per share excluding special items were EUR 0.20 (0.16), and reported EUR 0.22 (0.39) Operating profit excluding special
StepChange Consulting Selected Financial Benchmarking. September 2015
 1 StepChange Consulting Selected Financial Benchmarking September 2015 Agenda Graphic Paper peer group Packaging peer group Tissue peer group Pulp peer group Flexible Packaging peer group 3 Paper companies
YEAR-END REPORT JANUARY-DECEMBER Petra Einarsson, CEO, Susanne Lithander, CFO
 YEAR-END REPORT JANUARY-DECEMBER 2017 2018-01-29 Petra Einarsson, CEO, Susanne Lithander, CFO STABLE RESULTS Financial targets fulfilled Area Target Outcome 2017 Strong demand offset by production disruptions
Mondi Group Capital Markets Day October 2017
 Mondi Group Capital Markets Day October 2017 Agenda for the day 9:00-9:35 Welcome and Mondi Group overview 9:35-10:05 Packaging Paper 10:05-10:30 Fibre Packaging 10:30-10:55 Break 10:55-11:30 Consumer
Make it real. annual report 2000
 Make it real. annual report 2000 Contents 3 Metsä-Serla s Brands 4 Information for Shareholders 5 The Year in Brief and Main Events in 2000 6 President s Review 8 Metsä-Serla s Business Areas 12 Paper
INTERIM REPORT 1 JANUARY 30 JUNE
 INTERIM REPORT 1 JANUARY 30 JUNE 2011 1 2 3 4 UPM INTERIM REPORT 1 JANUARY 30 JUNE 2011 Q2/2011 Earnings per share were EUR 0.56 (0.33), excluding special items EUR 0.26 (0.29) EBITDA was EUR 372 million,
EBITDA margin Earnings per share SEK Operating cash flow ,751 2,273
 Q4 218 FULL YEAR 218 (217) Net sales increased 13% to SEK 18,755m (16,664). Sales grew in all segments. EBITDA increased 44% to SEK 5,252m (3,648). The improvement in EBITDA was mainly related to higher
Q Interim Report Healthy net sales growth in constant currencies
 GROUP October 25, 2013 Interim Report Healthy net sales growth in constant currencies CEO Jukka Moisio Director, Finance Thomas Geust Group highlights 2 Q3 Q3 Q1-Q3 Q1-Q3 FY EUR million 2013 2012 2013
Financial Results Q CEO Jouko Karvinen and CFO Markus Rauramo
 Financial Results Q1 2012 CEO Jouko Karvinen and CFO Markus Rauramo 24 April 2012 It should be noted that certain statements herein which are not historical facts. including. without limitation those regarding
INVESTOR PRESENTATION Q Lennart Eberleh
 INVESTOR PRESENTATION Q4 2017 Lennart Eberleh 1 CONTENTS Rottneros in brief: Sustainable growth in selected niches The market Q4 and full year 2017 The way forward 2 SUSTAINABLE GROWTH IN SELECTED NICHES
Third Quarter 2018 Earnings I October 25, 2018
 Third Quarter 208 Earnings I October 25, 208 Forward-Looking Statements Certain statements in this presentation may be considered forward-looking statements. Words such as expects, anticipates, estimates,
Karl-Henrik Sundström, CEO
 Karl-Henrik Sundström, CEO Have you ever thought about what a tree can do? STEFORSSLO Stora Enso celebrating 100 years on the Helsinki Stock Exchange Full year 2016 results EUR Million 2016 2015 Change
Valmet unique offering with process technology, automation and services. SEB Nordic Seminar January 8, 2019
 Valmet unique offering with process technology, automation and services SEB Nordic Seminar January 8, 2019 Agenda Valmet roadshow presentation 1 Valmet in brief 2 Investment highlights 3 Financials 4 Conclusion
Vattenfall Capital Markets Day 2009
 Vattenfall Capital Markets Day 2009 Presentation by: Dag Andresen First Senior Executive Vice President Group CFO Amsterdam, 23 September 2009 Contents Financial targets and outcome Nuon acquisition Actions
Stora Enso Biomaterials growth based on customer focus and innovation
 Stora Enso Biomaterials growth based on customer focus and innovation Juan Bueno, EVP, Biomaterials 8 March 2012 It should be noted that certain statements herein which are not historical facts, including,