Retain. Joe Hinrichs 2014 FIRST QUARTER EARNINGS REVIEW. Executive Vice President, Ford Motor Company President, The Americas APRIL 25, 2014
|
|
|
- Marianna Clarke
- 5 years ago
- Views:
Transcription

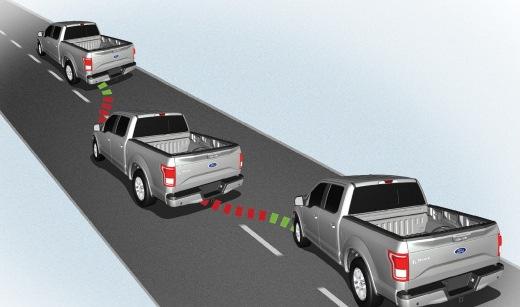


1 Retain LANE-KEEPING AID Joe Hinrichs 2014 FIRST QUARTER EARNINGS REVIEW Executive Vice President, Ford Motor Company President, The Americas APRIL 25, 2014 Deutsche Bank Conference (PRELIMINARY June 4, 2014 RESULTS)
2 AGENDA ONE Ford Plan Update North America South America Assumptions and Key Metrics Closing Remarks Q&A SLIDE 1
3 OUR PLAN -- Continue implementation of our global Plan: Aggressively restructure to operate profitably at the current demand and changing model mix Accelerate development of new products our customers want and value Finance our Plan and improve our balance sheet Work together effectively as one team -- leveraging our global assets Asia Pacific Africa Americas Europe Large Medium Small + + = Profits & Cash PROFITABLE GROWTH FOR ALL SLIDE 2


4 THE PLAN Great Products Strong Business Better World Serve all major markets Expand in BRIC markets Focus on the Ford and Lincoln brands Full line-up of vehicles Small, Medium and Large Cars, Utilities and Trucks Electrification strategy -- Power of Choice Commitment to product excellence Best-in-class vehicles Drive quality. Drive green. Drive safe. Drive smart. Best Value SLIDE 3

5 THE PLAN (CONT D) Improve time to market Freshest showroom Enhance customer experience Deliver the brand promise Fully competitive revenue Global platforms and scale Flexible and efficient production Fully competitive costs Maintain investment grade thru economic cycle Skilled and motivated team SLIDE 4


")
")
")
")


 Van")
6 SECRET GLOBAL CORE PLATFORMS B-Platform (Fiesta) C-Platform (Focus) C/D Platform (Fusion / Mondeo) Sports Car (Mustang) D-Platform (Explorer) Light Truck (Ranger) Full-Size Pickup (F-150) Over 8500 Pickup (Super Duty) Full-Size Van (Transit) SLIDE 5
7 NORTH AMERICA -- OVERVIEW $(5.9) Pre-Tax Results (Bils.) $(0.6) $5.4 $ $8.1 $ Significant transformation of Ford North America since 2008 Continuing to implement global product strategy and launch new products that our customers want and value Delivering significant improvements in fuel economy Driving quality improvements Controlling structural costs Aligning production capacity with demand Generating strong cash flow to support corporate balance sheet improvements Operating Margin (Neg.) (Neg.) 8.4% 8.3% 10.6% 10.2% North America Transformation Has Driven Higher Sequential Profits In Each Of The Last Five Years SLIDE 6


8 NORTH AMERICA -- KEY PRIORITIES Deliver profitable growth Accelerate quality improvements Develop and launch outstanding products Continue to revitalize the Lincoln brand Control costs as we grow the business SLIDE 7
9 U.S. INDUSTRY SALES RATES SAAR (Millions) April YTD Full Year Outlook Retail SAAR (Mils.) U.S. Industry Sales Are Projected To Continue To Grow With A 2014 Full Year Outlook Of Million Units SLIDE 8

10 U.S. INDUSTRY -- PICKUP SALES DRIVERS Housing Starts and Full-Size Pickup Sales Full-Size Pickup Sales (unit mils.) Housing Starts (unit mils.) Full-Size Pickup Sales Rebound Supported By Improved Housing Sector SLIDE 9
11 U.S. MARKET SHARE Total Ford / Lincoln Share (Pct.) 16.5% 15.2% 15.7% 15.2% April YTD 2014 B / (W) Prior Year 0.1 Pts. (1.3) Pts. 0.5 Pts. (0.8) Pts. U.S. Year-To-Date Market Share Is Down Reflecting Planned Reductions In Daily Rental Sales And Lower Small Car Retail Share SLIDE 10
12 NORTH AMERICA QUALITY IMPROVEMENT ACTIONS Ford U.S. First Quarter Things-Gone-Wrong At Three Months In Service Improved 17% Better Best -in- Class 1Q Q 2014 Source: Global Quality Research System (GQRS) Accelerated Quality Actions Are Driving Improvement And Closing Gap To Best-In-Class Competition SLIDE 11


13 2014 Launches Fiesta Fusion Focus Mustang F-150 Taurus Escape NORTH AMERICA Transit Flex Explorer Expedition Edge Transit Connect C-MAX Super Duty SLIDE 12


14 2015 FORD F-150 All-New Ford F-150 Is The Toughest, Smartest, Most Capable F-150 Ever SLIDE 13


15 2015 FORD MUSTANG All-New Ford Mustang Sets New Performance And Dynamic Benchmark For Brand SLIDE 14


16 2015 FORD TRANSIT All-New Ford Transit Offers Broadest Configuration Lineup With Best-In-Class Fuel Economy And Increased Capability And Durability SLIDE 15

17 2014 Launches SLIDE 16


18 2015 LINCOLN MKC All-New Lincoln MKC Is Lincoln s New Entry In The Fast Growing Small Premium Utility Segment SLIDE 17
19 NORTH AMERICA -- MARGIN OUTLOOK 2013 Operating Margin 10.2% 2014 Projected Changes Market Factors Material Cost Warranty Structural Cost / Other Unfavorable volume and mix including impact of new vehicle launches Efficiencies offset partially by added product costs Higher warranty costs for prior model year vehicles Higher costs to support new product introductions Projected 2014 Operating Margin 8-9% Strong Margins Projected To Continue During Key New Product Launch Year SLIDE 18
20 NORTH AMERICA -- KEY TAKEAWAYS Ford North America is focused on delivering key 2014 launches including Ford F-150, Mustang, Transit, and Lincoln MKC Accelerated quality actions are driving improvement and closing the gap to best-in-class Industry sales growth is forecasted to continue this year Strong margins projected to continue during key new product launch year Lean cost structure is key to maintaining / improving operating efficiency Continue To Focus On Driving Profitability, Launching Key Products, And Improving Quality SLIDE 19
21 SOUTH AMERICA -- OVERVIEW Pre-Tax Results (Bils.) $1.2 $0.8 $1.0 $ $0.2 $ - * Operating Margin 14.1% 9.7% 10.2% 7.8% 2.1% (0.3)% South America generated strong pre-tax profit and operating margins through A more challenging macroeconomic and political environment started in results reflect: Weakening industry Exchange weakness, high inflation, and capital controls Change in regional trade policies Transition to global products continuing in 2014 * 2013 Pre-tax results were $(33) million Results For 2013 Were Lower Than 2012 Reflecting Volatile Business Environment And Global Product Transition SLIDE 20


22 2014 Launches Fusion Focus Fiesta Mustang Ka Escape Edge SOUTH AMERICA EcoSport Explorer Heavy Duty Ranger Transit Cargo F-250 F-150 SLIDE 21

23 2015 FORD KA All-New Ka Will Have Leading Fuel Economy And Bring New Technology And Safety Features To The Emerging Consumer Class SLIDE 22
24 SOUTH AMERICA -- BUSINESS ENVIRONMENT South America macroeconomic and political challenges continue to escalate and include: Slowing GDP growth and weakening industry Increasing competition and excess capacity High inflation Capital controls and reduced foreign reserves Change in trade policies Contested tax incentives Political and social uncertainty in some countries South America Faces Numerous Macroeconomic And Political Challenges SLIDE 23
25 SOUTH AMERICA -- MARGIN OUTLOOK 2013 Operating Margin (0.3)% 2014 Projected Changes Market Factors Material Cost Structural Cost Exchange Projected 2014 Operating Margin Negative Favorable pricing and improved market share partially offset by lower industry sales Higher costs for economics and new products partially offset by efficiencies Higher costs to support new product creation including manufacturing and engineering and higher inflation Challenging currency controls and deteriorating exchange environment Operating Margin In 2014 Is Projected To Be Worse Than Prior Year SLIDE 24
26 SOUTH AMERICA -- KEY TAKEAWAYS Macroeconomic and political challenges are placing increasing pressure on the operating margin including: Increasing competition, excess capacity, and lower industry volumes Unfavorable exchange, high inflation, and limited availability of U.S. dollars Capital controls and import restrictions South America continues to expand its product lineup and replace legacy products with global ONE Ford offerings enabling higher sales, increased pricing, and improved favorable opinion as well as scale-related efficiencies South America is focused on actions to optimize its footprint and logistics, reduce material cost, accelerate incremental localization, and improve structural cost The environment in the region remains volatile. Longer term South America is viewed as an attractive business region that will return to profitability Operating Margin For 2014 Will Be Lower Than Prior Year Reflecting Macroeconomic And Political Challenges SLIDE 25
27 2014 KEY METRICS -- BUSINESS UNITS Business Unit Guidance Unchanged SLIDE 26
28 2014 PLANNING ASSUMPTIONS AND KEY METRICS Total Company Guidance Unchanged; 2014 Is The Next Step In Delivering Profitable Growth For All SLIDE 27
29 MID-DECADE OUTLOOK Mid-Decade Outlook* Assessment Wholesale Volumes About 8 Million On Track Revenue / Pricing Improving On Track Automotive Operating Margins North America 8% - 10% On Track Global 8% - 9% At Risk Ford Credit Return on Equity** High Single Digits On Track Capital Spending** About $7.5 Billion On Track Total Automotive Debt About $10 Billion On Track Investment Rating** Achieve Investment Grade In Near Term Achieved Remain Investment Grade Thru Economic Cycle On Track Dividends** Growing, Sustainable Dividends On Track * First presented June 2011; at trend economic assumptions and industry volume ** Updated from initial presentation SLIDE 28
30 QUESTIONS? SLIDE 29
31 RISK FACTORS Statements included or incorporated by reference herein may constitute "forward-looking statements" within the meaning of the Private Securities Litigation Reform Act of Forward-looking statements are based on expectations, forecasts, and assumptions by our management and involve a number of risks, uncertainties, and other factors that could cause actual results to differ materially from those stated, including, without limitation: Decline in industry sales volume, particularly in the United States or Europe, due to financial crisis, recession, geopolitical events, or other factors; Decline in Ford's market share or failure to achieve growth; Lower-than-anticipated market acceptance of Ford's new or existing products; Market shift away from sales of larger, more profitable vehicles beyond Ford's current planning assumption, particularly in the United States; An increase in or continued volatility of fuel prices, or reduced availability of fuel; Continued or increased price competition resulting from industry excess capacity, currency fluctuations, or other factors; Fluctuations in foreign currency exchange rates, commodity prices, and interest rates; Adverse effects resulting from economic, geopolitical, or other events; Economic distress of suppliers that may require Ford to provide substantial financial support or take other measures to ensure supplies of components or materials and could increase costs, affect liquidity, or cause production constraints or disruptions; Work stoppages at Ford or supplier facilities or other limitations on production (whether as a result of labor disputes, natural or man-made disasters, tight credit markets or other financial distress, production constraints or difficulties, or other factors); Single-source supply of components or materials; Labor or other constraints on Ford's ability to maintain competitive cost structure; Substantial pension and postretirement health care and life insurance liabilities impairing our liquidity or financial condition; Worse-than-assumed economic and demographic experience for postretirement benefit plans (e.g., discount rates or investment returns); Restriction on use of tax attributes from tax law "ownership change;" The discovery of defects in vehicles resulting in delays in new model launches, recall campaigns, or increased warranty costs; Increased safety, emissions, fuel economy, or other regulations resulting in higher costs, cash expenditures, and / or sales restrictions; Unusual or significant litigation, governmental investigations, or adverse publicity arising out of alleged defects in products, perceived environmental impacts, or otherwise; A change in requirements under long-term supply arrangements committing Ford to purchase minimum or fixed quantities of certain parts, or to pay a minimum amount to the seller ("take-orpay" contracts); Adverse effects on results from a decrease in or cessation or clawback of government incentives related to investments; Inherent limitations of internal controls impacting financial statements and safeguarding of assets; Cybersecurity risks to operational systems, security systems, or infrastructure owned by Ford, Ford Credit, or a third-party vendor or supplier; Failure of financial institutions to fulfill commitments under committed credit and liquidity facilities; Inability of Ford Credit to access debt, securitization, or derivative markets around the world at competitive rates or in sufficient amounts, due to credit rating downgrades, market volatility, market disruption, regulatory requirements, or other factors; Higher-than-expected credit losses, lower-than-anticipated residual values, or higher-than-expected return volumes for leased vehicles; Increased competition from banks or other financial institutions seeking to increase their share of financing Ford vehicles; and New or increased credit, consumer, or data protection or other regulations resulting in higher costs and / or additional financing restrictions. We cannot be certain that any expectation, forecast, or assumption made in preparing forward-looking statements will prove accurate, or that any projection will be realized. It is to be expected that there may be differences between projected and actual results. Our forward-looking statements speak only as of the date of their initial issuance, and we do not undertake any obligation to update or revise publicly any forward-looking statement, whether as a result of new information, future events, or otherwise. For additional discussion, see "Item 1A. Risk Factors" in our Annual Report on Form 10-K for the year ended December 31, 2013, as updated by our subsequent Quarterly Reports on Form 10-Q and Current Reports on Form 8-K. SLIDE 30
32 2014 INCOME FROM CONTINUING OPERATIONS Memo: First Quarter Full Year (Mils.) (Mils.) (Mils.) Automotive North America $ 2,392 $ 1,500 $ 8,809 South America (218) (510) (33) Europe (425) (194) (1,442) Middle East & Africa (69) Asia Pacific (28) Other Automotive (125) (222) (656) Total Automotive (excl. special items) $ 1,643 $ 919 $ 6,936 Special items -- Automotive (23) (122) (1,568) Total Automotive $ 1,620 $ 797 $ 5,368 Financial Services Ford Credit $ 507 $ 499 $ 1,756 Other Financial Services (4) (37) (84) Total Financial Services $ 503 $ 462 $ 1,672 Company Pre-tax results $ 2,123 $ 1,259 $ 7,040 (Provision for) / Benefit from income taxes (511) (270) 135 Net income $ 1,612 $ 989 $ 7,175 Less: Income attributable to non-controlling interests 1 - (7) Net income attributable to Ford $ 1,611 $ 989 $ 7,182 Memo: Excluding special items Pre-tax results $ 2,146 $ 1,381 $ 8,608 (Provision for) / Benefit from income taxes (503) (362) (2,022) Less: Income attributable to non-controlling interests 1 - (7) After-tax results $ 1,642 $ 1,019 $ 6,593 APPENDIX 1
33 SPECIAL ITEMS Personnel-Related Items First Quarter Full Year (Mils.) (Mils.) (Mils.) Separation-related actions* $ (8) $ (122) $ (856) Other Items U.S. pension lump sum program $ - $ - $ (594) FCTA -- subsidiary liquidation - - (103) Ford Romania consolidation loss (15) - (15) Total Other Items $ (15) $ - $ (712) Total Special Items $ (23) $ (122) $ (1,568) Tax Special Items $ (8) $ 92 $ 2,157 Memo: Special Items impact on earnings per share** $ (0.01) $ (0.01) $ 0.14 * Prim arily related to separation costs for personnel at the Genk and U.K. facilities ** Includes related tax effect on special items and tax special items APPENDIX 2
34 AUTOMOTIVE SECTOR NET INTEREST RECONCILIATION TO GAAP Full First Quarter Year (Mils.) (Mils.) (Mils.) Interest expense (GAAP) $ (206) $ (208) $ (829) Interest income (GAAP) Subtotal $ (162) $ (138) $ (666) Adjusted for items included / excluded from net interest Include: Gains / (Losses) on cash equiv. and marketable securities* (7) Include: Gains / (Losses) on extinguishment of debt (18) (5) (18) Other (23) (33) (110) Net Interest $ (189) $ (163) $ (801) * Excludes mark-to-market adjustments of our investment in Mazda APPENDIX 3
35 AUTOMOTIVE SECTOR OPERATING-RELATED CASH FLOWS RECONCILIATION TO GAAP APPENDIX 4
36 EMERGING MARKETS CURRENCY UPDATE Argentina Peso Per USD Brazil Real Per USD Venezuela Bolivar Per USD Russia Ruble Per Euro Turkey Lira Per Euro (41.8) (41.8) (36.0) Percent Change (18.5) (11.0) (18.5) (7.1) (21.8) (0.3) 3.5 India Rupee Per USD Thai Baht Per USD March 31, 2014 Compared With March 31, 2013 March 31, 2014 Compared With December 31, 2013 (9.5) (9.6) (Depreciation / Devaluation) / Appreciation Broad Based Weakening In Emerging Market Currencies APPENDIX 5
37 FURTHER INFORMATION Investor Relations Contact: Larry Heck Information on Ford: 10-K Annual Reports 10-Q Quarterly Reports 8-K Current Reports Ford University Information on Ford Motor Credit Company: 10-K Annual Reports 10-Q Quarterly Reports 8-K Current Reports Ford Credit University SLIDE 36
FORD APA INTRODUCTION
 FORD APA INTRODUCTION DEUTSCHE BANK INVESTOR CONFERENCE Joe Hinrichs President Ford Asia Pacific & Africa Chicago June 13, 2012 BLANK THE ONE FORD PLAN -- TO DELIVER PROFITABLE GROWTH FOR ALL Aggressively
Wholesales (000) 1,545 1,493 (52) 4,720 4, Revenue (Bils.) $ 35.8 $ 34.9 $ (0.9) $ $ $ (1.1)
 1,545 1,493 (52) 4,720 4, Revenue (Bils.) $ 35.8 $ 34.9 $ (0.9) $ $ $ (1.1)") Ford Posts Third Quarter 2014 Pre-Tax Profit of $1.2 Billion*; Net Income of $835 Million; Global Product Launches on Track, Including F-150 Third quarter pre-tax profit of $1.2 billion, a decrease of
Ford Posts Third Quarter 2014 Pre-Tax Profit of $1.2 Billion*; Net Income of $835 Million; Global Product Launches on Track, Including F-150 Third quarter pre-tax profit of $1.2 billion, a decrease of
2013 SECOND QUARTER EARNINGS REVIEW JULY 24, 2013 (PRELIMINARY RESULTS)
") 2013 SECOND QUARTER EARNINGS REVIEW JULY 24, 2013 (PRELIMINARY RESULTS) TOTAL COMPANY OUR PLAN -- Continue implementation of our global Plan: Aggressively restructure to operate profitably at the current
2013 SECOND QUARTER EARNINGS REVIEW JULY 24, 2013 (PRELIMINARY RESULTS) TOTAL COMPANY OUR PLAN -- Continue implementation of our global Plan: Aggressively restructure to operate profitably at the current
Ford s 2020 Vision: Improved Operating Margin, More Balanced Geographic Profitability, Strong Sales Growth
 NEWS www.facebook.com/ford www.twitter.com/ford Ford s 2020 Vision: Improved Operating Margin, More Balanced Geographic Profitability, Strong Sales Growth Ford continues aggressive implementation of its
PENSION AND OPEB UPDATE
 Go Further PENSION AND OPEB UPDATE JANUARY 7, 2016 PENSION DE-RISKING PROGRESS Limited the growth in pension obligations Closed plans to new entrants, e.g., U.S. plans closed since 2011 Settled $4.2 billion
2012 SECOND QUARTER EARNINGS REVIEW JULY 25, 2012 (PRELIMINARY RESULTS)
") 2012 SECOND QUARTER EARNINGS REVIEW JULY 25, 2012 (PRELIMINARY RESULTS) BUSINESS OVERVIEW Alan Mulally President and Chief Executive Officer SLIDE 1 TOTAL COMPANY AGENDA Business Overview of Financial
2012 SECOND QUARTER EARNINGS REVIEW JULY 25, 2012 (PRELIMINARY RESULTS) BUSINESS OVERVIEW Alan Mulally President and Chief Executive Officer SLIDE 1 TOTAL COMPANY AGENDA Business Overview of Financial
FORD EARNS SECOND QUARTER 2012 PRE-TAX OPERATING PROFIT OF $1.8 BILLION, NET INCOME OF $1 BILLION +
 NEWS FORD EARNS SECOND QUARTER 2012 PRE-TAX OPERATING PROFIT OF $1.8 BILLION, NET INCOME OF $1 BILLION + Second quarter pre-tax operating profit was $1.8 billion, or 30 cents per share, a decrease of $1
2012 FIRST QUARTER FIXED INCOME PRESENTATION APRIL 27, 2012 (PRELIMINARY RESULTS)
") 2012 FIRST QUARTER FIXED INCOME PRESENTATION APRIL 27, 2012 (PRELIMINARY RESULTS) AGENDA Ford Credit performance Ford Credit funding and liquidity Automotive cash, debt and liquidity Summary SLIDE 1 OPERATING
2012 FIRST QUARTER FIXED INCOME PRESENTATION APRIL 27, 2012 (PRELIMINARY RESULTS) AGENDA Ford Credit performance Ford Credit funding and liquidity Automotive cash, debt and liquidity Summary SLIDE 1 OPERATING
2012 SECOND QUARTER FIXED INCOME PRESENTATION JULY 25, 2012 (PRELIMINARY RESULTS)
") 2012 SECOND QUARTER FIXED INCOME PRESENTATION JULY 25, 2012 (PRELIMINARY RESULTS) AGENDA Ford Credit performance Ford Credit funding and liquidity Automotive cash, debt and liquidity Summary SLIDE 1 OPERATING
2012 SECOND QUARTER FIXED INCOME PRESENTATION JULY 25, 2012 (PRELIMINARY RESULTS) AGENDA Ford Credit performance Ford Credit funding and liquidity Automotive cash, debt and liquidity Summary SLIDE 1 OPERATING
Ford Achieves 2014 Pre-Tax Profit of $6.3 Billion, Net Income of $3.2 Billion; 2015 Outlook for Pre-Tax Profit at $8.5 Billion to $9.
 FORD MEDIA CENTER Ford Achieves 2014 Pre-Tax Profit of $6.3 Billion, Net Income of $3.2 Billion; 2015 Outlook for Pre-Tax Profit at $8.5 Billion to $9.5 Billion* Full year 2014 pre-tax profit of $6.3 billion,
2012/13 SUSTAINABILITY REPORT JUNE 14, 2013
 2012/13 SUSTAINABILITY REPORT JUNE 14, 2013 SUSTAINABILITY AT FORD Environmental Economic Sustainable Meeting the needs of the present without compromising the future Social 2 SUSTAINABILITY AT FORD Environmental
UNITED STATES SECURITIES AND EXCHANGE COMMISSION Washington, D. C FORM 8-K
 UNITED STATES SECURITIES AND EXCHANGE COMMISSION Washington, D. C. 20549 FORM 8-K CURRENT REPORT Pursuant to Section 13 or 15(d) of the Securities Exchange Act of 1934 Date of Report: December 18, 2013
2Q 2015 FIXED INCOME REVIEW
 Go Further 2Q 2015 FIXED INCOME REVIEW JULY 28, 2015 FORD CREDIT 2Q 2015 OPERATING HIGHLIGHTS* Another strong performance with pre-tax profit of $506 million and net income of $340 million Launched a car-sharing
John Fleming. Executive Vice President -- Global Manufacturing and Labor Affairs
 John Fleming Executive Vice President -- Global Manufacturing and Labor Affairs UBS Best of Americas Conference September 9, 2010 BUSINESS ENVIRONMENT The global economy expanded through the Second Quarter,
2011 FIRST QUARTER EARNINGS REVIEW APRIL 26, 2011 (PRELIMINARY RESULTS)
") 2011 FIRST QUARTER EARNINGS REVIEW APRIL 26, 2011 (PRELIMINARY RESULTS) BUSINESS OVERVIEW Alan Mulally President and Chief Executive Officer SLIDE 1 TOTAL COMPANY AGENDA Business Overview of Financial
2011 FIRST QUARTER EARNINGS REVIEW APRIL 26, 2011 (PRELIMINARY RESULTS) BUSINESS OVERVIEW Alan Mulally President and Chief Executive Officer SLIDE 1 TOTAL COMPANY AGENDA Business Overview of Financial
4Q 2015 AND FULL YEAR FIXED INCOME REVIEW AND 2016 OUTLOOK
 Go Further 4Q 2015 AND FULL YEAR FIXED INCOME REVIEW AND 2016 OUTLOOK JANUARY 28, 2016 (PRELIMINARY RESULTS) 4Q 2015 KEY METRICS COMPARED WITH 2014 Contract Volume (000) Managed Receivables* (Bils) Pre-Tax
2014 THIRD QUARTER FIXED INCOME PRESENTATION OCTOBER 24, 2014 (PRELIMINARY RESULTS)
") 2014 THIRD QUARTER FIXED INCOME PRESENTATION OCTOBER 24, 2014 (PRELIMINARY RESULTS) FORD CREDIT OPERATING HIGHLIGHTS* Another solid performance with Third Quarter pre-tax profit of $498 million and net
2014 THIRD QUARTER FIXED INCOME PRESENTATION OCTOBER 24, 2014 (PRELIMINARY RESULTS) FORD CREDIT OPERATING HIGHLIGHTS* Another solid performance with Third Quarter pre-tax profit of $498 million and net
ONE FORD PROFITABLE GROWTH
 ONE FORD PROFITABLE GROWTH John Fleming Executive Vice President, Global Manufacturing and Labor Affairs Goldman Sachs 2010 Autos Conference December 10, 2010 TOTAL COMPANY BUSINESS ENVIRONMENT Global
2010 FOURTH QUARTER AND FULL YEAR EARNINGS REVIEW AND 2011 OUTLOOK JANUARY 28, 2011 (PRELIMINARY RESULTS)
") 2010 FOURTH QUARTER AND FULL YEAR EARNINGS REVIEW AND 2011 OUTLOOK JANUARY 28, 2011 (PRELIMINARY RESULTS) BUSINESS OVERVIEW Alan Mulally President and Chief Executive Officer SLIDE 1 TOTAL COMPANY AGENDA
2010 FOURTH QUARTER AND FULL YEAR EARNINGS REVIEW AND 2011 OUTLOOK JANUARY 28, 2011 (PRELIMINARY RESULTS) BUSINESS OVERVIEW Alan Mulally President and Chief Executive Officer SLIDE 1 TOTAL COMPANY AGENDA
2014 SECOND QUARTER FIXED INCOME PRESENTATION JULY 24, 2014 (PRELIMINARY RESULTS)
") 2014 SECOND QUARTER FIXED INCOME PRESENTATION JULY 24, 2014 (PRELIMINARY RESULTS) FORD CREDIT OPERATING HIGHLIGHTS* Another solid performance with Second Quarter pre-tax profit of $434 million and net
2014 SECOND QUARTER FIXED INCOME PRESENTATION JULY 24, 2014 (PRELIMINARY RESULTS) FORD CREDIT OPERATING HIGHLIGHTS* Another solid performance with Second Quarter pre-tax profit of $434 million and net
FORD CREDIT EARNS $295 MILLION NET INCOME IN THE FIRST QUARTER OF 2012*
 FORD CREDIT EARNS $295 MILLION NET INCOME IN THE FIRST QUARTER OF 2012* DEARBORN, Mich., April 27, 2012 Ford Motor Credit Company reported net income of $295 million in the first quarter of 2012, compared
SECRET 2014 FOURTH QUARTER AND FULL YEAR FIXED INCOME PRESENTATION AND 2015 OUTLOOK JANUARY 29, 2015 (PRELIMINARY RESULTS)
") 2014 FOURTH QUARTER AND FULL YEAR FIXED INCOME PRESENTATION AND 2015 OUTLOOK JANUARY 29, 2015 (PRELIMINARY RESULTS) 2014 OPERATING HIGHLIGHTS* Another strong performance with Full Year pre-tax profit of
2014 FOURTH QUARTER AND FULL YEAR FIXED INCOME PRESENTATION AND 2015 OUTLOOK JANUARY 29, 2015 (PRELIMINARY RESULTS) 2014 OPERATING HIGHLIGHTS* Another strong performance with Full Year pre-tax profit of
FORD CREDIT EARNS $355 MILLION NET INCOME IN THE THIRD QUARTER OF 2012*
 FORD CREDIT EARNS $355 MILLION NET INCOME IN THE THIRD QUARTER OF 2012* DEARBORN, Mich., October 30, 2012 Ford Motor Credit Company reported net income of $355 million in the third quarter of 2012, compared
2013 FOURTH QUARTER AND FULL YEAR (PRELIMINARY RESULTS)
") 2013 FOURTH QUARTER AND FULL YEAR 2013 EARNINGS THIRD REVIEW QUARTER AND EARNINGS 2014 OUTLOOK REVIEW OCTOBER JANUARY 24, 28, 2013 2014 (PRELIMINARY RESULTS) TOTAL COMPANY OUR PLAN -- Continue implementation
2013 FOURTH QUARTER AND FULL YEAR 2013 EARNINGS THIRD REVIEW QUARTER AND EARNINGS 2014 OUTLOOK REVIEW OCTOBER JANUARY 24, 28, 2013 2014 (PRELIMINARY RESULTS) TOTAL COMPANY OUR PLAN -- Continue implementation
Ford Posts Third Quarter 2014 Pre-Tax Profit of $1.2 Billion*; Net Income of $835 Million; Global Product Launches on Track, Including F-150
 FORD MEDIA CENTER Ford Posts Third Quarter 2014 Pre-Tax Profit of $1.2 Billion*; Net Income of $835 Million; Global Product Launches on Track, Including F-150 Third quarter pre-tax profit of $1.2 billion,
2010 THIRD QUARTER EARNINGS REVIEW OCTOBER 26, 2010 (PRELIMINARY RESULTS)
") 2010 THIRD QUARTER EARNINGS REVIEW OCTOBER 26, 2010 (PRELIMINARY RESULTS) BUSINESS OVERVIEW Alan Mulally President and Chief Executive Officer SLIDE 1 TOTAL COMPANY AGENDA Business Overview of Financial
2010 THIRD QUARTER EARNINGS REVIEW OCTOBER 26, 2010 (PRELIMINARY RESULTS) BUSINESS OVERVIEW Alan Mulally President and Chief Executive Officer SLIDE 1 TOTAL COMPANY AGENDA Business Overview of Financial
2011 SECOND QUARTER EARNINGS REVIEW JULY 26, 2011 (PRELIMINARY RESULTS)
") 2011 SECOND QUARTER EARNINGS REVIEW JULY 26, 2011 (PRELIMINARY RESULTS) BUSINESS OVERVIEW Alan Mulally President and Chief Executive Officer SLIDE 1 TOTAL COMPANY AGENDA Business Overview of Financial
2011 SECOND QUARTER EARNINGS REVIEW JULY 26, 2011 (PRELIMINARY RESULTS) BUSINESS OVERVIEW Alan Mulally President and Chief Executive Officer SLIDE 1 TOTAL COMPANY AGENDA Business Overview of Financial
FCE BANK PLC 2012 FINANCIAL RESULTS SLIDE 0
 2012 FINANCIAL RESULTS SLIDE 0 WHO WE ARE FCE is a public limited company incorporated in the UK, wholly owned by Ford Motor Credit Company LLC FCE operates as a licensed bank regulated by the UK Financial
2010 SECOND QUARTER EARNINGS REVIEW JULY 23, 2010 (PRELIMINARY RESULTS)
") 2010 SECOND QUARTER EARNINGS REVIEW JULY 23, 2010 (PRELIMINARY RESULTS) BUSINESS OVERVIEW Alan Mulally President and Chief Executive Officer SLIDE 1 TOTAL COMPANY AGENDA Business Overview of Financial
2010 SECOND QUARTER EARNINGS REVIEW JULY 23, 2010 (PRELIMINARY RESULTS) BUSINESS OVERVIEW Alan Mulally President and Chief Executive Officer SLIDE 1 TOTAL COMPANY AGENDA Business Overview of Financial
Ford Delivers Third Quarter $1.0B Net Income; $1.7B Adj. EBIT; On Track to Achieve Full-Year Adjusted EPS Guidance in the Range of $1.30 to $1.
 Ford Delivers Third Quarter $1.0B Net Income; $1.7B Adj. EBIT; On Track to Achieve Full-Year Adjusted EPS Guidance in the Range of $1.30 to $1.50 Company revenue up 3 percent in the quarter, driven by
2011 FIRST QUARTER FIXED INCOME PRESENTATION APRIL 26, 2011 (PRELIMINARY RESULTS)
") 2011 FIRST QUARTER FIXED INCOME PRESENTATION APRIL 26, 2011 (PRELIMINARY RESULTS) TOTAL COMPANY 2011 FIRST QUARTER OVERVIEW Another quarter of growth, profitability, and positive Automotive operating-related
2011 FIRST QUARTER FIXED INCOME PRESENTATION APRIL 26, 2011 (PRELIMINARY RESULTS) TOTAL COMPANY 2011 FIRST QUARTER OVERVIEW Another quarter of growth, profitability, and positive Automotive operating-related
2010 FIRST QUARTER EARNINGS REVIEW APRIL 27, 2010 (PRELIMINARY RESULTS)
") 2010 FIRST QUARTER EARNINGS REVIEW APRIL 27, 2010 (PRELIMINARY RESULTS) BUSINESS OVERVIEW Alan Mulally President and Chief Executive Officer SLIDE 1 TOTAL COMPANY AGENDA Business Overview of Financial
2010 FIRST QUARTER EARNINGS REVIEW APRIL 27, 2010 (PRELIMINARY RESULTS) BUSINESS OVERVIEW Alan Mulally President and Chief Executive Officer SLIDE 1 TOTAL COMPANY AGENDA Business Overview of Financial
FORD UNIVERSITY. July 15, 2016
 FORD UNIVERSITY July 15, 2016 Agenda Ford Changes in Sector and Segment Reporting Use of Non-GAAP Financial Measures Variance Analysis Cash Flow and Working Capital Changes Warranty Reserves Ford Credit
CREDIT UNIVERSITY March 9, 2012
 CREDIT UNIVERSITY March 9, 2012 CREDIT UNIVERSITY Outline Overview, Virtuous Circle, and Scope of Operations Understanding the Drivers of the Business and Ford Credit Profit Reporting Ford Credit Business
FORD UNIVERSITY. Stuart Rowley Vice President and Controller
 FORD UNIVERSITY Stuart Rowley Vice President and Controller March 17, 2014 FORD UNIVERSITY Agenda for today s discussion Automotive Segment Reporting Production compared with Wholesales Automotive Segment
2011 THIRD QUARTER FIXED INCOME PRESENTATION OCTOBER 26, 2011 (PRELIMINARY RESULTS)
") 2011 THIRD QUARTER FIXED INCOME PRESENTATION OCTOBER 26, 2011 (PRELIMINARY RESULTS) TOTAL COMPANY 2011 THIRD QUARTER OVERVIEW Third Quarter business performance marked by Automotive growth, solid profitability,
2011 THIRD QUARTER FIXED INCOME PRESENTATION OCTOBER 26, 2011 (PRELIMINARY RESULTS) TOTAL COMPANY 2011 THIRD QUARTER OVERVIEW Third Quarter business performance marked by Automotive growth, solid profitability,
4Q 2017 And Full Year Earnings Review And 2018 Outlook
 4Q 2017 And Full Year Earnings Review And 2018 Outlook January 24, 2018 (Preliminary Results) FC1 Ford Credit Strategy ORIGINATE Support Ford and Lincoln sales Strong dealer relationships Full spread of
2010 THIRD QUARTER FIXED INCOME PRESENTATION OCTOBER 26, 2010 (PRELIMINARY RESULTS)
") 2010 THIRD QUARTER FIXED INCOME PRESENTATION OCTOBER 26, 2010 (PRELIMINARY RESULTS) TOTAL COMPANY 2010 THIRD QUARTER FINANCIAL RESULTS* Third Quarter First Nine Months B / (W) B / (W) 2010 2009** 2010
2010 THIRD QUARTER FIXED INCOME PRESENTATION OCTOBER 26, 2010 (PRELIMINARY RESULTS) TOTAL COMPANY 2010 THIRD QUARTER FINANCIAL RESULTS* Third Quarter First Nine Months B / (W) B / (W) 2010 2009** 2010
3Q Earnings Review. October 24, 2018
 3Q Earnings Review October 24, 2018 Key Takeaways 3Q EBT of $678 million the best quarter in more than 7 years Loss metrics reflect healthy consumer credit conditions Continued strong auction performance
1Q 2017 FORD CREDIT EARNINGS REVIEW
 1Q 2017 FORD CREDIT EARNINGS REVIEW April 27, 2017 FC1 FORD CREDIT STRATEGY ORIGINATE SERVICE FUND Support Ford and Lincoln sales Strong dealer relationships Full spread of business Consistent underwriting
Ford Motor Company Reports Fourth Quarter and Full Year 2018 Results
 Ford Motor Company Reports Fourth Quarter and Full Year 2018 Results Revenue up in the fourth quarter and full year; net income, adjusted EBIT and margin lower North America EBIT margin of 7.6% in the
1Q Earnings Review. April 25, 2018
 1Q Earnings Review April 25, 2018 1Q 2018 Highlights Strong first quarter EBT across all segments Achieved record quarterly EBT in China Receivables grew globally led by retail financing Credit loss metrics
4Q 2018 And Full Year Earnings Review. January 23, 2019 (Preliminary Results)
") 4Q 2018 And Full Year Earnings Review January 23, 2019 (Preliminary Results) Key Takeaways FY 2018 EBT of $2.6 billion the best result in 8 years Loss metrics reflect healthy consumer credit conditions
4Q 2018 And Full Year Earnings Review January 23, 2019 (Preliminary Results) Key Takeaways FY 2018 EBT of $2.6 billion the best result in 8 years Loss metrics reflect healthy consumer credit conditions
Deutsche Bank Global Automotive Conference. Ford Motor Company January 16, 2018
 Deutsche Bank Global Automotive Conference Ford Motor Company January 16, 2018 Important Notice Regarding This Presentation This presentation includes our preliminary view of 2017 results. Our actual results
CREDIT UNIVERSITY March 17, 2014
 CREDIT UNIVERSITY March 17, 2014 CREDIT UNIVERSITY Outline Ford Credit Strategic Value, Virtuous Circle and Value Proposition Scope of Operations Ford Credit Business Model and the Drivers of the Business
FORD POSTS FIRST QUARTER 2010 NET INCOME OF $2.1 BILLION AS STRONG NEW PRODUCTS FUEL PROFITABLE GROWTH +
 Contact: Media: John Stoll 1.313.594.1106 jstoll1@ford.com Equity Investment Community: Larry Heck 1.313.594.0613 fordir@ford.com Fixed Income Investment Community: Shawn Ryan 1.313.621.0881 fixedinc@ford.com
4Q 2018 And Full Year Earnings Review And 2019 Outlook. January 23, 2019 (Preliminary Results)
") 4Q 2018 And Full Year Earnings Review And 2019 Outlook January 23, 2019 (Preliminary Results) Creating Tomorrow, Together Our Belief Our Aspiration Our Plan for Value Creation Winning Portfolio Freedom
4Q 2018 And Full Year Earnings Review And 2019 Outlook January 23, 2019 (Preliminary Results) Creating Tomorrow, Together Our Belief Our Aspiration Our Plan for Value Creation Winning Portfolio Freedom
FORD UNIVERSITY Bob Shanks Vice President and Controller Neil Schloss Vice President and Treasurer
 FORD UNIVERSITY Bob Shanks Vice President and Controller Neil Schloss Vice President and Treasurer March 9, 2012 FORD UNIVERSITY Purpose of Ford University Review our 2012 key financial metrics and guidance
Deutsche Bank Global Automotive Conference. Ford Motor Company January 16, 2019
 Deutsche Bank Global Automotive Conference Ford Motor Company January 16, 2019 Important Notice Regarding This Presentation This presentation includes our preliminary view of 2018 results. Our actual results
Fixed Income Investor Presentation. October 2018
 Fixed Income Investor Presentation October 2018 Further Information Ford Investor Relations Contacts: Fixed Income Investors: Karen Rocoff Justin Fischer 313-621-0965 313-390-4189 krocoff@ford.com jfisch22@ford.com
2017 THIRD-QUARTER EARNINGS REVIEW October 24, 2017
 2017 THIRD-QUARTER EARNINGS REVIEW October 24, 2017 CAUTIONARY STATEMENT This presentation contains forward-looking statements about Whirlpool Corporation and its consolidated subsidiaries ( Whirlpool
Second Quarter 2011 Financial Results
 Second Quarter 2011 Financial Results August 4, 2011 Agenda Company Highlights and Second Quarter 2011 Production Second Quarter 2011 Financial Results, 2011 Outlook and Sales Backlog Update Summary Q
Second-Quarter Earnings Review
 Second-Quarter 2018 Earnings Review GLOBAL OVERVIEW Marc Bitzer President and Chief Executive Officer 2 2018 SECOND-QUARTER HIGHLIGHTS Ongoing EBIT margin expansion despite challenging cost environment
1Q Earnings Review. April 25, 2018
 1Q Earnings Review April 25, 2018 Quarter Highlights Revenue growth Solid Company EBIT Leadership in Trucks and SUVs NA launch of all-new Expedition and Lincoln Navigator; increasing production to meet
2016 THIRD-QUARTER EARNINGS REVIEW October 25, 2016
 2016 THIRD-QUARTER EARNINGS REVIEW October 25, 2016 0 THIRD-QUARTER EARNINGS PRESENTATION WHIRLPOOL CORPORATION ADDITIONAL INFORMATION This presentation contains forward-looking statements about Whirlpool
Washington,D.C FORM8-K CURRENTREPORT PursuanttoSection13or15(d)of. thesecuritiesexchangeactof1934 DateofReport:January16,2019 FORDMOTORCOMPANY
of. thesecuritiesexchangeactof1934 DateofReport:January16,2019 FORDMOTORCOMPANY") UNITEDSTATES SECURITIESANDEXCHANGECOMMISSION Washington,D.C.20549 FORM8-K CURRENTREPORT PursuanttoSection13or15(d)of thesecuritiesexchangeactof1934 DateofReport:January16,2019 (Date of earliest event reported)
UNITEDSTATES SECURITIESANDEXCHANGECOMMISSION Washington,D.C.20549 FORM8-K CURRENTREPORT PursuanttoSection13or15(d)of thesecuritiesexchangeactof1934 DateofReport:January16,2019 (Date of earliest event reported)
Fourth Quarter & Year End 2008 Conference Call
 1 Fourth Quarter & Year End 2008 Conference Call February 24, 2009 2 Agenda 2008 & Current Environment Q4 2008 Financial Highlights Q&A Don Walker Vince Galifi Don Walker Vince Galifi Louis Tonelli ALL
GLOBAL OVERVIEW. Marc Bitzer. President and Chief Executive Officer
 Third-Quarter Second-Quarter 2018 2018 Earnings Review GLOBAL OVERVIEW Marc Bitzer President and Chief Executive Officer 2 2018 THIRD-QUARTER HIGHLIGHTS All-time record ongoing EPS of $4.55 and EBIT margin
IN THE BLINK OF AN EYE. Second Quarter Financial Results Presentation WE PUT THE THINKING IN SAFETY COGNITIVE SAFETY SYSTEMS
 IN THE BLINK OF AN EYE Second Quarter 2014 Financial Results Presentation WE PUT THE THINKING IN SAFETY COGNITIVE SAFETY SYSTEMS July 29, 2014 Safe Harbor Statement This presentation contains statements
FOURTH-QUARTER 2017 EARNINGS REVIEW January 25, 2018
 FOURTH-QUARTER 2017 EARNINGS REVIEW January 25, 2018 GLOBAL OVERVIEW INSERT PHOTO HERE Marc Bitzer Chief Executive Officer 2 2017 FOURTH-QUARTER HIGHLIGHTS Ongoing EPS of $4.10 in Q4 and $13.74 for the
Financial Strategy for Increasing Shareholder Value Mats Wallin
 Financial Strategy for Increasing Shareholder Value Mats Wallin CFO Safe Harbor Statement* This presentation contains statements that are not historical facts but rather forward-looking statements within
Q3 and January-September 2011 Results
 Q3 and January-September 2011 Results October 27, 2011 2 Key developments in Q3 2011 Group unit sales increased in all divisions, revenue grew by 5% EBIT of 2.0 billion again at a high level Mercedes-Benz
Q Earnings Call Presentation
 Q2 2014 Earnings Call Presentation July 31, 2014 Forward-looking Statements Statements in this presentation that are not historical in nature constitute forward-looking statements. These forward-looking
Forward-Looking Statements
 Fourth Quarter 2014 Conference Call February 17, 2015 Forward-Looking Statements Certain information contained in this presentation constitutes forward-looking statements for purposes of the safe harbor
2006 Credit Suisse Conference
 2006 Credit Suisse Conference September 7, 2006 Our Three-Year Plan Restructure Improve Base Operations Grow the Business Action underperforming and non-strategic facilities Achieve competitive cost sourcing
Third Quarter 2016 Conference Call. October 28, 2016
 Third Quarter 2016 Conference Call October 28, 2016 Forward-Looking Statements Certain information contained in this presentation constitutes forward-looking statements for purposes of the safe harbor
Q Earnings Conference Call
 Q3 2016 Earnings Conference Call SAFE HARBOR FORWARD-LOOKING STATEMENTS All presentations contain certain forward-looking information within the meaning of the Private Securities Litigation Reform Act
Deutsche Bank Leveraged Finance Conference September 30, 2015
 Deutsche Bank Leveraged Finance Conference September 30, 2015 1 Forward-Looking Statements There are a number of risks and uncertainties that could cause our actual results to differ materially from the
Forward-Looking Statements
 Third Quarter 2014 Conference Call October 29, 2014 Forward-Looking Statements Certain information contained in this presentation constitutes forward-looking statements for purposes of the safe harbor
Fiscal Year 2018 and Fourth Quarter Results
 Fiscal Year 2018 and Fourth Quarter Results NOVEMBER 7, 2018 PAGE 1 Today s Agenda Highlights Market Review Financial Results & Outlook Q&A Don Guzzardo Tom Gendron Bob Weber PAGE 2 Cautionary Statement
Mondelēz International 2013 Results. February 12, 2014
 Mondelēz International 2013 Results February 12, 2014 1 Forward-looking statements This slide presentation contains a number of forward-looking statements. Words, and variations of words, such as will,
Third Quarter 2017 Earnings Conference Call
 Third Quarter 2017 Earnings Conference Call October 27, 2017 NYSE: TEN Agenda Third Quarter Highlights Segment Results and Financial Overview Outlook and Strategic Priorities Brian Kesseler Chief Executive
Jefferies Global Industrial and A&D Conference. Jay Craig, Senior VP & CFO Mary Lehmann, Senior VP, Treasury & Tax. August 9, 2011
 Jefferies Global Industrial and A&D Conference Jay Craig, Senior VP & CFO Mary Lehmann, Senior VP, Treasury & Tax August 9, 2011 1 Forward-Looking Statements This release contains statements relating to
Visteon Q4 and Full Year 2018 Earnings. February 21, 2019
 Visteon Q4 and Full Year 2018 Earnings February 21, 2019 2018 Highlights Financial Performance Sales of $2,984 million Adj. EBITDA of $330 million Adj. FCF of $107 million Outperforming in China Sales
2016 INVESTOR MEETINGS FIRST QUARTER 2016 WHIRLPOOL CORPORATION
 2016 INVESTOR MEETINGS FIRST QUARTER 0 FIRST-QUARTER INVESTOR MEETINGS WHIRLPOOL CORPORATION ADDITIONAL INFORMATION This Presentation contains forward-looking statements about Whirlpool Corporation and
Fiscal Year 2019 First Quarter Results
 Fiscal Year 2019 First Quarter Results JANUARY 28, 2019 PAGE 1 Today s Agenda Highlights Market Review Financial Results & Outlook Q&A Don Guzzardo Tom Gendron Bob Weber PAGE 2 Cautionary Statement Information
MAZDA MOTOR CORPORATION
 MAZDA MOTOR CORPORATION FY2004 FIRST HALF RESULTS FY2004 FULL YEAR PROJECTIONS MID-TERM PLAN November 9, 2004 1 FY2004 1 st Half Results / FY2004 Full Year Projections / Mid-term Plan INTRODUCTION FY2004
First Quarter 2018 Conference Call. April 25, 2018
 First Quarter 2018 Conference Call April 25, 2018 Forward-Looking Statements Certain information contained in this presentation constitutes forward-looking statements for purposes of the safe harbor provisions
J.P. Morgan Auto Conference
 J.P. Morgan Auto Conference August 11, 2015 Forward-Looking Statements Certain information contained in this presentation constitutes forward-looking statements for purposes of the safe harbor provisions
Forward-Looking Statements
 First Quarter 2016 Conference Call April 27, 2016 Forward-Looking Statements Certain information contained in this presentation constitutes forward-looking statements for purposes of the safe harbor provisions
Second Quarter 2018 Earnings I July 26, 2018
 Second Quarter 208 Earnings I July 26, 208 Forward-Looking Statements Certain statements in this presentation may be considered forward-looking statements. Words such as expects, anticipates, estimates,
PPG Industries, Inc. Third 2016 Financial Results Earnings Brief October 20, 2016
 PPG Industries, Inc. Third 2016 Financial Results Earnings Brief October 20, 2016 Third Quarter 2016 Financial Highlights PPG net sales for the third quarter 2016 were $3.8 billion, up almost 2 percent
Deutsche Bank Global Auto Industry Conference. January 13, 2015
 Deutsche Bank Global Auto Industry Conference January 13, 2015 Rodney O Neal Chief Executive Officer and President Forward-looking statements This presentation, as well as other statements made by Delphi
Q Conference Call. August 2, 2017
 Q2 2017 Conference Call August 2, 2017 Forward Looking Statements This presentation contains forward-looking information regarding future events or the Company s future financial performance based on the
Fourth Quarter 2018 Financial Results
 Fourth Quarter 2018 Financial Results Michael H. McGarry, Chairman and Chief Executive Officer Vincent J. Morales, Senior Vice President and Chief Financial Officer John Bruno, Director, Investor Relations
Forward-Looking Statements
 Second Quarter 2016 Conference Call July 27, 2016 Forward-Looking Statements Certain information contained in this presentation constitutes forward-looking statements for purposes of the safe harbor provisions
FY 2017 Third Quarter Earnings Call
 FY 2017 Third Quarter Earnings Call July 27, 2017 Improving the experience of a world in motion Forward Looking Statement Adient has made statements in this document that are forward-looking and, therefore,
PPG Industries, Inc. Fourth 2016 Financial Results Earnings Brief January 19, 2017
 PPG Industries, Inc. Fourth 2016 Financial Results Earnings Brief January 19, 2017 Fourth Quarter Financial Highlights PPG fourth quarter net sales from continuing operations of $3.5 billion were down
Fourth Quarter 2017 Conference Call. February 8, 2018
 Fourth Quarter 2017 Conference Call February 8, 2018 Forward-Looking Statements Certain information contained in this presentation constitutes forward-looking statements for purposes of the safe harbor
Forward-Looking Statements
 Goldman Sachs Industrials Conference November 12, 2014 Forward-Looking Statements Certain information contained in this presentation constitutes forward-looking statements for purposes of the safe harbor
Investor Presentation. February 2018
 Investor Presentation February 2018 1 Forward Looking Statements Important Information About Littelfuse, Inc. This presentation does not constitute or form part of, and should not be construed as, an offer
A X A L T A C O A T I N G S Y S T E M S. Q FINANCIAL RESULTS July 26, 2016
 A X A L T A C O A T I N G S Y S T E M S Q2 2016 FINANCIAL RESULTS July 26, 2016 Legal Notices Forward-Looking Statements This presentation and the oral remarks made in connection herewith may contain forward-looking
Goldman Sachs Industrials Conference 2015
 Goldman Sachs Industrials Conference 2015 November 3, 2015 Forward-Looking Statements Certain information contained in this presentation constitutes forward-looking statements for purposes of the safe
Zebra Technologies Third-Quarter 2018 Results. November 6, 2018
 Zebra Technologies Third-Quarter 2018 Results November 6, 2018 1 Safe Harbor Statement Statements made in this presentation which are not statements of historical fact are forward-looking statements and
PPG Industries, Inc. Fourth 2017 Financial Results Earnings Brief January 18, 2018
 PPG Industries, Inc. Fourth 2017 Financial Results Earnings Brief January 18, 2018 Fourth Quarter Financial Highlights PPG fourth quarter net sales from continuing operations were approximately $3.7 billion,
Second Quarter 2017 Earnings Conference Call
 Second Quarter 2017 Earnings Conference Call July 28, 2017 NYSE: TEN Agenda Second Quarter Highlights Segment Results and Financial Overview Outlook and Strategic Priorities Brian Kesseler Chief Executive
FISCAL YEAR 2018 FIRST QUARTER EARNINGS PRESENTATION
 FISCAL YEAR 2018 FIRST QUARTER EARNINGS PRESENTATION Jay Craig CEO & President Kevin Nowlan Senior Vice President & CFO January 31, 2018 Proprietary Meritor, Inc. 2017 Forward-Looking Statements This presentation
Q3 and January-September 2012 Results
 Q3 and January-September 2012 Results Bodo Uebber Member of the Board of Management Finance & Controlling and Daimler Financial Services October 24, 2012 Highlights in Q3 2012 Group sales Sales record
Q Results. Bodo Uebber Member of the Board of Management Finance & Controlling and Daimler Financial Services.
 Q1 2011 Results Bodo Uebber Member of the Board of Management Finance & Controlling and Daimler Financial Services April 29, 2011 Key developments in Q1 2011 Strong EBIT of 2 billion marks a further step
Third Quarter 2018 Results October 30, 2018
 Third Quarter 2018 Results October 30, 2018 This document, and in particular the section entitled 2018 guidance, contains forward-looking statements. In particular, these forward-looking statements include