Investor Presentation 2016
|
|
|
- Arron McLaughlin
- 5 years ago
- Views:
Transcription


1 Investor Presentation 2016


")
")


2 Control Group: 76% Float: 24% Market Cap: US$11.4 bn (1) 2016 Revenues (2) Countries Plants Routes Sales Centers POS Associates Brands Products US$13.5 Bn 5 YR CAGR: 4.7% ,000 1, million 130, ,000 North America Mexico Latin America Europe Asia U.S. Canada 1. As of June 11, 2014 in US$ at the FX rate of 13.0Ps./US$ Revenues in US$ at the average LTM FX rate 1. As of February 22, Expressed in US$ at the FX of $19.91 Ps./US 2. Converted to US$ with the average FX rate of that period 2 2


3 Where do we stand? A Global Consumer Products Company and the leader in the baking industry space Remarkable growth story with financial stability Investments on manufacturing and logistics capabilities targeted to foster productivity Unyielding discipline on a conservative financial policy Successful culture of business integration, recently in North America, Latin America and Europe Relentless effort on innovation and sustainability to increase brand equity 3 3
4 Successful growth story Long term view and a strict reinvestment policy Innovation and execution continue to drive organic growth Acquisitions have been a key component to gain global reach 2014 Frozen Argentina Leadership position in both, mature and high growth markets Accelerated international expansion during the last decade s s 60s 70s 80s 90s 4 4

5 OUR VISION 5 5


6 KEY CAPABILITIES
7 Seasoned management team and sound governance Daniel Servitje Chairman of the Board Management Positioned the Company as market leader in the products and countries where present Audit Committee and Corporate Practices (6 independent members) Results and Evaluation Committee (5 members, 2 independent) Finance & Planning Committee (7 members, 1 independent) Proven track record of stability and sustainable growth Successfully completed and integrated 48 acquisitions over the last 10 years Javier A. González Executive VP of Grupo Bimbo Guillermo Quiroz CFO Raul Arguelles Chief HR and Corporate Affairs 1. According to the Reputation Institute Daniel Servitje CEO Pablo Elizondo Executive VP of Grupo Bimbo Alfred Penny President of Bimbo Bakeries USA (BBU) Reynaldo Reyna Chief Global Services Gabino Gómez Executive VP of Grupo Bimbo Governance Corporate Governance aligned with shareholders interest 39% of board members are independent 3 corporate committees Social Responsibility GB ranks among the most respected companies of the world (1) Reputation built on a strong corporate identity and brand equity Key component of GB s corporate identity is its company-wide Social Responsibility Program Complies with WHO s Global Strategy on Diet and Physical Activity & Health 7 7

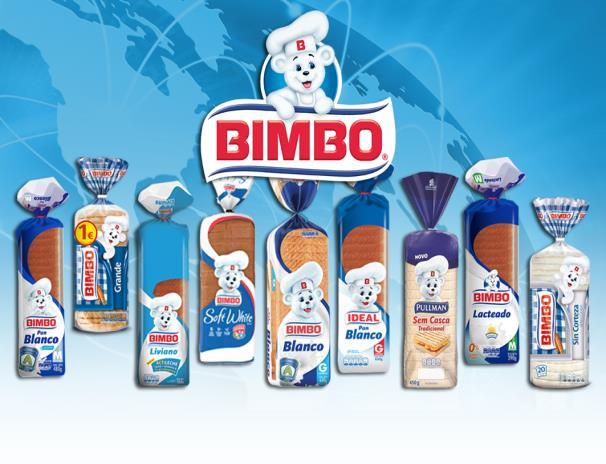
8 Strong Power Brands 4 Billion dollar brands 3 >$500 million dollar brands Source: IRI & Nielsen; Retail Sales Price 8 8


9 9 9


10 We are developing products and categories that lead new megatrends 10 10
11 A Well Balanced Business Revenue and Adj. EBITDA Breakdown (1) North America Sales: 53% EBITDA: 44% China (2) Mexico Sales: 32% EBITDA: 54% Latin America Sales: 11% EBITDA: 1% Europe Sales: 4% EBITDA: 1% Revenues and Adj. EBITDA converted to US$ with the average FX rate of the period 2. China s results included in Mexico 11 11
12 with a strong leadership position in each market North America U.S. Leader nationwide #1 in premium brands #1 in English muffins Strong regional brands Canada #1 in buns & rolls #1 in breakfast #2 in bread China (1) Pioneer in developing packaged baked goods in Beijing and Tianjing Mexico #1 in packaged baked goods #2 in cookies and crackers #2 in salty snacks #2 in confectionary Europe Portugal, Spain & U.K. #1 in bread & rolls in Spain #2 in bread & rolls in Portugal #1 in bagels in the U.K. Latin America #1 in packaged baked goods in 15 countries Source: Nielsen, Company filings 1. According to Company Research, included in Mexico s results 12 12

13 Exceptional manufacturing capabilities 40+ million pieces are produced daily State-of-the-art facilities in all of our markets Focus in low-cost manufacturing and efficiency 13 13


14 World Class Distribution 79+ Trips around the Earth Guarantees quality and freshness Exceptionally serves all of its distribution channels Commitment to local execution daily 14 14
 US$ millions 10,732 13,164 13,786 14,064 13,818 13,514 1,183 1,070 1,351 1,370 1,467 1,570 2011")
 + 2% + 0% 1.")
 North America 9.")
15 Strong Financial Performance Revenue Growth (1) US$ millions Adj. EBITDA Growth (1) US$ millions 10,732 13,164 13,786 14,064 13,818 13,514 1,183 1,070 1,351 1,370 1,467 1, Stock Performance (2) YTD return, % GB Mexico 11.0% 14.3% 8.1% 13.8% 9.8% 15.8% 9.8% 16.7% 10.2% 17.6% 11.6% 18.7% (3) + 2% + 0% 1.Figures converted to USD using the 12M average FX rate for each year, Figures after 2011 in IFRS 2. As of February 22 nd, Grupo BMV: Mexican IPC Index (Índice de Precios y Cotizaciones) North America 9.8% Latin America 1.7% Europe -18.6% 6.4% -1.1% -8.7% 7.3% 0.7% -3.8% 6.2% 3.9% -0.9% 8.3% 2.1% -4.4% 9.4% 1.0% 2.7% 15 15
16 Cash flow stability across time allows long term planning Margins Evolution, % EBIT Margin Adj. EBITDA Margin Gross Margin Integration/transformation efforts & IFRS Best-in-Class execution combined with a relentless focus on low cost operation in a resilient industry results in financial stability over time * Figures after 2011 in IFRS 16 16
17 Responsible Financial Policies Commitment to a strong Balance Sheet Ongoing financial flexibility through a US$2 billion multi-currency revolving credit facility, maturing on March 2019 Dividend History MXN millions Ordinary Dividends Extraordinary Dividends Reinvestment as the pillar of the company s long term view Conservative Risk Management policy aligned with the company s strategy Mitigate exposure to raw material cost fluctuation Conservative approach towards FX and interest rate risks ,646 (2) , Dividend yield calculated with the stock price of the day the dividends were paid. 2. Paid in advance for 2014 and 2015 *FX rates: 2007: 10.84; 2008:10.52; 2009:13.36; 2010:12.22; 2011:11.55; 2012: 13.11; Apr 2013:12.28; Dec 2013: 13.00; Apr 2016:
18 Conservative Approach Towards Leverage Debt Amortization Profile (1) US$ millions Currency Mix % Total Debt: US$3,858 mm Avg. Tenor: 8.3 yrs. Avg. Cost: 4.5% 4% 10% % % Local Bonds Bank Loans Foreign Bonds CAD EUR MXN USD 1. Debt amortization profile as of September 30, Figures converted to US$ at the FX rate of Ps./US$, Does not include subsidiaries debt of US $165 mm, includes only indebtness in Canada Bread 18 18
19 Conservative Approach Towards Leverage Track Record of Deleveraging Total Debt/ Adj. EBITDA BBB Rating 3.3x (1) 3.1x 3.0x 3.2x (2) 2.9x 2.9x 1.1x 0.9x 2.5x 1.9x 1.5x 1.2x 1.1x 0.7x 2.3x 2.2x 2.3x * Pro forma figures with Weston Foods acquisition 2. Pro forma figures with Canada Bread acquisition * Figures after 2011 in IFRS 19 19


 Expected to be")
20 Recent Acquisition Producer of sweet baked goods and buns & rolls in Spain and Portugal Revenue growth of 70% in the region Synergies of (40 50) million (1) Integration expenses: 70 million High single digit pro-forma EBITDA margin (1) Strong Brand Equity (1) Expected to be achieved in 30 months 20 20
21 Annex: Financial Results by Region 21
22 Grupo Bimbo Revenue Growth (1) MXN millions 4Q16 4Q15 % Change Net Sales % Change 68,862 59, Grupo Bimbo 252, , Higher sales in all regions Solid organic growth in Mexico FX benefit Donuts Iberia acquisition Adj. EBITDA MXN millions 4Q16 4Q15 % Change Adj. EBITDA % Change 8,618 6, Grupo Bimbo 29,297 23, Q16 4Q15 Change pp Adj. EBITDA (%) Change pp Grupo Bimbo Lower raw material costs in North America, Latam and Europe Lower restructuring expenses in the U.S. ZBB Higher generals expenses in Latam Integration expenses in Canada 22 22
23 Mexico Revenue Growth (1) MXN millions 4Q16 4Q15 % Change Net Sales % Change 21,670 19, Mexico 82,386 76, Adj. EBITDA MXN millions 4Q16 4Q15 % Change Adj. EBITDA % Change 4,857 4, Mexico 15,386 13, Q16 4Q15 Change pp Adj. EBITDA (%) Change pp Mexico Healthy performance across all channels and almost all categories Sweet baked goods category continued its positive trend Salty snacks business sales were exceptional Productivity efficiencies in distribution and manufacturing ZBB FX pressure on raw materials 23 23
24 North America Revenue Growth (1) MXN millions 4Q16 4Q15 % Change Net Sales % Change 36,965 32, North America 135, , Adj. EBITDA MXN millions 4Q16 4Q15 % Change Adj. EBITDA % Change 3,521 3, North America 12,735 9, Q16 4Q15 Change pp Adj. EBITDA (%) Change pp North America FX benefit Growth in strategic brands Pressure in non-branded Challenging competitive market environment Lower raw material costs Production efficiencies Lower restructuring expenses in the US Integration expenses in Canada Higher marketing expenses 24 24
25 Latin America Revenue Growth (1) MXN millions 4Q16 4Q15 % Change Net Sales % Change 8,020 6, Latin America 29,100 24, Adj. EBITDA MXN millions 4Q16 4Q15 % Change Adj. EBITDA % Change (28) 292 NA Latin America (46.2) 4Q16 4Q15 Change pp Adj. EBITDA (%) Change pp (0.4) 4.6 (5.0) Latin America (1.1) Notable performance in Chile, Peru and Latin Centro Division Challenging economic conditions and currency volatility in some markets Higher general expenses the opening of the Cordoba plant in Argentina Higher costs and integration expenses in Argentina and Brazil 25 25
26 Europe Revenue Growth (1) MXN millions 4Q16 4Q15 % Change Net Sales % Change 3,884 1,926 >100 Europe 11,676 7, Donuts Iberia acquisition FX rate benefit Improved volume trends Adj. EBITDA MXN millions 4Q16 4Q15 % Change Adj. EBITDA % Change 269 (166) NA Europe 312 (334) NA 4Q16 4Q15 Change pp Adj. EBITDA (%) Change pp Lower raw material costs Lower distribution expenses Integration expenses 6.9 (8.6) 15.5 Europe 2.7 (4.4)


27 THANK YOU! GRACIAS! #ConElCariñoDeSiempre 27

28 The information contained herein has been prepared by Grupo Bimbo, S.A.B. de C.V. (the Company") solely for use at this presentation. This presentation does not purport to contain all of the information that may be required to evaluate any investment in the Company or any of its securities and should not be relied upon to form the basis of, or be relied on in connection with, any contract or commitment or investment decision whatsoever. No representation or warranty, either express or implied, is made as to the accuracy, reliability or completeness of the information presented herein. This presentation has been prepared solely for informational purposes and should not be construed as containing any offer, invitation or recommendation to purchase, sell or subscribe for any securities in any jurisdiction and neither the issue of the information nor anything contained herein shall form the basis of or be relied upon in connection with, or act as an inducement to enter into, any investment activity. This presentation should not be regarded by recipients as a substitute for the exercise of their own judgment in connection with any investment activity. The merit and suitability of an investment in the Company should be independently evaluated and any person considering such an investment in the Company is advised to obtain independent advice as to the legal, tax, accounting, financial, credit and other related advice prior to making an investment. Any opinion expressed herein is subject to change without notice, and the Company is under no obligation to update or keep current the information herein. The Company accepts no liability whatsoever for any loss or damage of any kind arising out of the use of all or any part of this presentation. This presentation includes forward-looking statements. Such forward-looking statements are based on certain assumptions and current expectations and projections about future events and trends that may affect the Company s business and are not guarantees of future performance. Investors are cautioned that any such forward-looking statements are and will be, as the case may be, subject to many risks, uncertainties and other unknown factors, including those relating to the operations and business of the Company. These and various other factors may adversely affect the estimates and assumptions on which these forward-looking statements are based, many of which are beyond our control. Forward-looking statements speak only as of the date on which they are made. The Company expressly disclaims any obligation or undertaking to update or revise any forward-looking statement, whether as a result of new information, future events or otherwise. The Company s independent public auditors have neither examined nor compiled this presentation and, accordingly, do not provide any assurance with respect to any information included herein. In light of the risks and uncertainties described above, the future events and circumstances discussed in this presentation might not occur and are not guarantees of future performance. Neither this presentation nor anything contained herein shall form the basis of any contract or commitment whatsoever. The information included in this presentation may not be reproduced or redistributed, passed on, or the contents otherwise divulged, directly or indirectly, to any other person or published in whole or in part for any purpose or under any circumstances without the Company s prior written consent
Investor Presentation First Quarter 2017
 Investor Presentation First Quarter 2017 Control Group: 76% Float: 24% Market Cap: US$11.9 bn (1) LTM1Q 17 Revenues (2) Countries Plants Routes Sales Centers POS Associates Brands Products US$14.0 Bn 5
Investor Presentation First Quarter 2016
 Investor Presentation First Quarter 2016 Control Group: 77% Float: 23% Market Cap: US$14.2 bn (1) LTM 1Q 16 Revenues (2) Countries Plants Routes Sales Centers POS Associates Brands Products US$13.6 Bn
Investor Presentation 2015 Results. Forth Quarter 2015
 Investor Presentation 2015 Results Forth Quarter 2015 Control Group: 77% Float: 23% Market Cap: US$13.4 bn (1) 2015 Revenues (2) Countries Plants Routes Sales Centers POS Associates Brands Products US$13.8
I N V E S T O R PRESENTATION. Second Quarter 2018
 I N V E S T O R PRESENTATION Second Quarter 2018 Grupo Bimbo Today Control Group: 75% Float: 25% Market cap (1) Sales (2) Adj. EBITDA (2) Countries Plants Routes Points of sale Associates Products US$10
Investor Presentation Fourth Quarter 2017
 Investor Presentation Fourth Quarter 2017 A Global Consumer Food Company, Leader in the Baking Industry and a Relevant Participant in Snacks 2 2 2 Control Group: 75% Float: 25% Market Cap: US$11.5 bn (1)
Investor Presentation 1Q13
 Investor Presentation 1Q13 1 Grupo Bimbo Global leader in baking and one of the largest packaged food players LTM 1Q13 Sales: USD $13.3 Bn1 LTM 1Q13 EBITDA: USD $1.1 Bn1 Presence in 19 countries +10,000
P R E S E N T A T I O N. Third Quarter 2018
 INVESTOR P R E S E N T A T I O N Third Quarter 2018 Grupo Bimbo Today Control Group: 75% Float: 25% Market cap (1) Sales (2) Adj. EBITDA (2) Countries Plants Routes Points of sale Associates Products US$10.2
Investor Presentation 4Q13
 Investor Presentation 4Q13 Grupo Bimbo Global leader in baking and one of the largest packaged food players 2013 Sales: USD $13.8 Bn1 2013 EBITDA: USD $1.4 Bn1 Presence in 19 countries +10,000 products
EAST BALT BAKERIES July 2017 ACQUISITION
 EAST BALT BAKERIES July 2017 ACQUISITION E AST BA LT AT A G L A N C E Leading foodservice-focused company that supplies baked goods to Quick Service Restaurants ( QSR ) across the world Operates 21 bakeries
Investor Presentation 3Q12
 Investor Presentation 3Q12 1 Grupo Bimbo Global leader in baking and one of the largest packaged food players Presence in 19 countries +10,000 products and +100 brands Categories: packaged bread, salted
Canada Bread Acquisition February 12, 2014
 Canada Bread Acquisition February, 04 Transaction Overview A unique and sizable opportunity to enter the Canadian baking market - Annual Revenues: CAN$,439 million - Annual EBITDA: CAN$85 million (.9%
I N V E S T O R P R E S E N T A T I O N. First Quarter 2018
 I N V E S T O R P R E S E N T A T I O N First Quarter 2018 Resilient Industry with High Growth Potential Artisanal 31% Grupo Bimbo 4.2% Industry Fundamentals Resilience to economic downturns Non-discretionary
Investor Presentation 2Q12. January 2012
 Investor Presentation 2Q12 January 2012 1 Grupo Bimbo Leading Global Bakery Company Grupo Bimbo ( GB ) is one of the largest bakeries in the world and one of the largest packaged food players with presence
Let s give our soul, heart and being in everything we do. R.I.P. Don Lorenzo Servitje, founder of Grupo Bimbo
 GRUPO BIMBO REPORTS 2016 RESULTS MEXICO CITY, FEBRUARY 23, 2017 Grupo Bimbo, S.A.B. de C.V. ( Grupo Bimbo or the Company ) (BMV: BIMBO) today reported its results for the twelve months ended December 31,
GRUPO BIMBO REPORTS THIRD QUARTER 2018 RESULTS MEXICO CITY, OCTOBER 24, 2018
 GRUPO BIMBO REPORTS THIRD QUARTER 2018 RESULTS MEXICO CITY, OCTOBER 24, 2018 We delivered strong third quarter results. We continue to transform our Company to be highly competitive, productive and sustainable
GRUPO BIMBO REPORTS FIRST QUARTER 2018 RESULTS
 GRUPO BIMBO REPORTS FIRST QUARTER 2018 RESULTS MEXICO CITY, APRIL 26, 2018 Grupo Bimbo S.A.B. de C.V. ( Grupo Bimbo or the Company ) (BMV: BIMBO) today reported its results for the three months ended March
Grupo Bimbo, S.A.B. de C.V. ( Grupo Bimbo or the Company ) (BMV: BIMBO) today reported its results for the three months ended March 31, 2017.
 (BMV: BIMBO) today reported its results for the three months ended March 31, 2017.") GRUPO BIMBO REPORTS 17 RESULTS MEXICO CITY, APRIL, 26, 2017 Grupo Bimbo, S.A.B. de C.V. ( Grupo Bimbo or the Company ) (BMV: BIMBO) today reported its results for the three months ended March 31, 2017.
GRUPO BIMBO REPORTS 17 RESULTS MEXICO CITY, APRIL, 26, 2017 Grupo Bimbo, S.A.B. de C.V. ( Grupo Bimbo or the Company ) (BMV: BIMBO) today reported its results for the three months ended March 31, 2017.
GRUPO BIMBO REPORTS FIRST HALF 2017 RESULTS
 GRUPO BIMBO REPORTS FIRST HALF 2017 RESULTS MEXICO CITY, JULY 25, 2017 Grupo Bimbo, S.A.B. de C.V. ( Grupo Bimbo or the Company ) (BMV: BIMBO) today reported its results for the six months ended June 30,
GRUPO BIMBO REPORTS FIRST HALF 2016 RESULTS
 GRUPO BIMBO REPORTS FIRST HALF 2016 RESULTS MEXICO CITY, JULY 26, 2016 Grupo Bimbo S.A.B. de C.V. ( Grupo Bimbo or the Company ) (BMV: BIMBO) today reported its results for the six months ended June 30,
GRUPO BIMBO REPORTS FOURTH QUARTER AND FULL YEAR 2014 RESULTS
 Highlights from the quarter: Consolidated net sales rose 10.8%, mainly driven by the Canada Bread acquisition Profit before other income and expenses increased 34.1% reflecting a strong margin expansion
GRUPO BIMBO REPORTS 2017 RESULTS
 GRUPO BIMBO REPORTS 2017 RESULTS MEXICO CITY, FEBRUARY 22, 2018 Grupo Bimbo, S.A.B. de C.V. ( Grupo Bimbo or the Company ) (BMV: BIMBO) today reported its results for the twelve months ended December 31,
SECOND QUARTER 2015 RESULTS
 B SECOND QUARTER 2015 RESULTS MEXICO CITY, JULY 21, 2015 Grupo Bimbo S.A.B. de C.V. ( Grupo Bimbo or the Company ) (BMV: BIMBO) today reported results for the three months ended June 30, 2015.* HIGHLIGHTS
GRUPO BIMBO REPORTS FIRST NINE MONTHS 2017 RESULTS
 GRUPO BIMBO REPORTS FIRST NINE MONTHS 2017 RESULTS MEXICO CITY, OCTOBER 26, 2017 Grupo Bimbo, S.A.B. de C.V. ( Grupo Bimbo or the Company ) (BMV: BIMBO) today reported its results for the nine months ended
The information contained herein has been prepared by Grupo Bimbo, S.A.B. de C.V. (the Company") solely for use at presentations held in connection
 solely for use at presentations held in connection") 1 The information contained herein has been prepared by Grupo Bimbo, S.A.B. de C.V. (the Company") solely for use at presentations held in connection with the proposed offering of senior guaranteed notes
1 The information contained herein has been prepared by Grupo Bimbo, S.A.B. de C.V. (the Company") solely for use at presentations held in connection with the proposed offering of senior guaranteed notes
Transaction Overview. Purchase price: enterprise value of US$959 million
 Sara Lee North American Fresh Bakery Acquisition November 9, 2010 0 Transaction Overview Grupo Bimbo acquires: North American Fresh Bakery Division of Sara Lee Corporation ( Sara Lee NAFB ) Royalty-free
Grupo LALA, S.A.B. de C.V.
 Grupo LALA, S.A.B. de C.V. Investor Relations Presentation August, 2017 DISCLAIMER This material does not constitute an offering document. This material was prepared solely for informational purposes and
» Grupo LALA, S.A.B. de C.V.
 Investor Relations Presentation» Grupo LALA, S.A.B. de C.V. May, 2016 INVESTMENT HIGHLIGHTS» Scale and Leadership in Branded Healthy Foods» Second Most Recognized Consumer Brand in Mexico» Two Megabrands»
KION Q3 UPDATE CALL Gordon Riske, CEO Thomas Toepfer, CFO Wiesbaden, 14 November 2013
 KION Q3 UPDATE CALL 2013 Gordon Riske, CEO Thomas Toepfer, CFO Wiesbaden, 14 November 2013 AGENDA 1 Highlights 2013 Gordon Riske 2 Financial Update Thomas Toepfer 3 Outlook Gordon Riske 14 November 2013
Financial Targets through 2022: Focus on Value Creation
 Financial Targets through 2022: Focus on Value Creation /////////// Capital Markets Day London, December 5, 208 Wolfgang Nickl CFO Bayer AG Disclaimer Cautionary Statements Regarding Forward-Looking Information
Q Results. Lars Brorsen (CEO) Christoph Hobo (CFO) November 22, 2018
 Christoph Hobo (CFO) November 22, 2018") Q3 2018 Results Lars Brorsen (CEO) Christoph Hobo (CFO) November 22, 2018 Agenda 1. Highlights Q3 2018 2. Market outlook 3. Detailed results review 4. Company outlook 5. Q&A Appendix 1 Business summary
Q3 2018 Results Lars Brorsen (CEO) Christoph Hobo (CFO) November 22, 2018 Agenda 1. Highlights Q3 2018 2. Market outlook 3. Detailed results review 4. Company outlook 5. Q&A Appendix 1 Business summary
July 26, 2017 LafargeHolcim Ltd 2015
 Second Quarter 2017 Results Beat Hess, Chairman and Interim CEO Roland Köhler, Interim COO and Regional Head of Europe, Australia/NZ & Trading Ron Wirahadiraksa, CFO July 26, 2017 LafargeHolcim Ltd 2015
CAGNY Conference. February 22, 2018
 CAGNY Conference February 22, 2018 Disclaimer This presentation has been prepared and issued by Nomad Foods Limited (the "Company"). This Presentation has been provided solely for information and background.
BIMBO Food. Quarterly Report October 27, BIMBO Market Underperformer 2016 Price Target P$41.9
 Quarterly Report BIMBO Market Underperformer 2016 Price Target P$41.9 Price 51.51 12M Price Range 45.02 / 59.86 Shares Outstanding (Mill) 4,703.2 Market Cap (Mill) 242,262 Float 24.0% Net Debt (Mill) 72,562
Ezentis increases its EBITDA by 142,3% in the first nine months of the year up to 16,4 million Euros
 Results Presentation Ezentis increases its EBITDA by 142,3% in the first nine months of the year up to 16,4 million Euros The revenue of the Company increased by 30% up to 228,5 million Euros thanks to
Refresco world s largest independent bottler for retailers and A-brands
 Corporate story Refresco world s largest independent bottler for retailers and A-brands J.P. Morgan 2018 European High Yield & Leveraged Finance Conference I London, September 7, 2018 Presentation disclaimer
Investor Presentation. April 2018
 Investor Presentation April 2018 Disclaimer This presentation has been prepared and issued by Nomad Foods Limited (the "Company"). This Presentation has been provided solely for information and background.
MASISA OVERVIEW & HIGHLIGHTS STRATEGY FINANCIAL PROFILE
 October 2017 MASISA OVERVIEW & HIGHLIGHTS STRATEGY FINANCIAL PROFILE Overview Masisa is a leading integrated company focused on fiberboard and particleboard production and marketing for furniture and interior
Atento. Fiscal 2016 Fourth Quarter and Full Year Results. March 21, 2017
 Atento Fiscal 2016 Fourth Quarter and Full Year Results March 21, 2017 Lynn Antipas Tyson Vice President Investor Relations +1-914-485-1150 lynn.tyson@atento.com 1 Disclaimer This presentation has been
Continuous Improvement of Operating Performance Half Year Results 2014
 Continuous Improvement of Operating Performance Half Year Results 2014 Vernier, 17 July 2014 Gilles Andrier CEO Half Year Results 2014 Highlights Sales CHF 2.2 billion, up 4.5% on a like-for-like* basis
CIBC Annual Whistler Institutional Investor Conference January 25-28, 2017 Whistler, BC. parkland.ca
 CIBC Annual Whistler Institutional Investor Conference January 25-28, 2017 Whistler, BC parkland.ca FORWARD LOOKING STATEMENT DISCLAIMER & NOTE ON NON-GAAP MEASURES 2 Certain information included herein
Eng US. 14 July 2017
 Eng US 14 July 2017 Presentation 2017 Eng US Disclaimer This presentation has been prepared by Duni AB (the Company ) solely for use at this investor presentation and is furnished to you solely for your
Industry: Food Retail Current Stub Value: $3.84 Main Asset(s): Loblaws and Weston Foods
: Loblaws and Weston Foods") To: From: Queen s Capital Advisory Board Kelvin Li Date: July 28, 2015 Re: George Weston Ltd. (TSX:WN) [Weston Foods Stub] COMPANY PROFILE INVESTMENT PROFILE Industry: Food Retail Current Stub Value: $3.84
To: From: Queen s Capital Advisory Board Kelvin Li Date: July 28, 2015 Re: George Weston Ltd. (TSX:WN) [Weston Foods Stub] COMPANY PROFILE INVESTMENT PROFILE Industry: Food Retail Current Stub Value: $3.84
ELIOR GROUP FY RESULTS
 FY 2017-2018 RESULTS DISCLAIMER This document was prepared by Elior Group for the sole purpose of this presentation. This presentation includes only summary information and does not purport to be comprehensive.
H RESULTS PRESENTATION
 H1 2018 RESULTS PRESENTATION 03.09.2018 H1 2018 RESULTS PRESENTATION DISCLAIMER This presentation (the "Presentation") has been prepared and is issued by, and is the sole responsibility of Telepizza Group,
O&M in the Last Mile Ezentis manages, maintains and deploys infrastructure for telecommunications and utilities companies.
 1 O&M in the Last Mile Ezentis manages, maintains and deploys infrastructure for telecommunications and utilities companies. Focus on Latin America where Ezentis activity represents 91,3% of total Group
Agenda. 1. Highlights FY 2012 Results. 2. Operational Performance Priorities for Financials. 5. Conclusion
 1MARCH 2013 Legal Disclaimer Information in this presentation may involve guidance, expectations, beliefs, plans, intentions or strategies regarding the future. These forward-looking statements involve
Fourth-quarter and full-year 2017 RESULTS MARCH,
 Fourth-quarter and full-year 2017 RESULTS MARCH, 15 2018 DISCLAIMERS This presentation contains forward-looking statements. Such statements are not statements of historical fact, and reflect the beliefs
INVESTOR PRESENTATION - RBC CAPITAL MARKETS PAUL JEWER, EVP & CFO
 INVESTOR PRESENTATION - RBC CAPITAL MARKETS KEITH DECKER, PRESIDENT & CEO PAUL JEWER, EVP & CFO HEATHER KEELER-HURSHMAN, VP, IR November 2016 DISCLAIMER: Certain statements made in this presentation are
Third Quarter 2017 Results Jan Jenisch, CEO Ron Wirahadiraksa, CFO. October 27, 2017 LafargeHolcim Ltd 2015
 Third Quarter 2017 Results Jan Jenisch, CEO Ron Wirahadiraksa, CFO October 27, 2017 LafargeHolcim Ltd 2015 01 Initial views Q3 2017 and Outlook Jan Jenisch, Chief Executive Officer 2017 LafargeHolcim 2
CABOT CREDIT MANAGEMENT Financial Results. For the nine months ended 30 September 2018
 CABOT CREDIT MANAGEMENT Financial Results For the nine months ended 30 September 2018 8 November 2018 DISCLAIMER This presentation has been prepared by Cabot Credit Management ( the Company ) solely for
2016 INTEGRATED ANNUAL REPORT SUMMARY
 2016 INTEGRATED ANNUAL REPORT SUMMARY ABOUT GRUPO BIMBO Grupo Bimbo is the largest baking Company in the world 1, generating US$13.5 billion 2 in net sales in 2016. We produce and distribute fresh and
Investor Presentation. December 2018
 Investor Presentation December 2018 Disclaimer This Presentation has been prepared and issued by Nomad Foods Limited (the "Company"). This Presentation has been provided solely for information and background.
GIS Reports Second Quarter 2018 Results with Double-Digit Growth in Revenues and EBITDA
 Media Contact Tel: +52 (844) 411-1095 pr@gis.com.mx www.gis.com.mx Investor Relations Contact Tel: +52 (844) 411-1050 ir@gis.com.mx http://ri.gis.investorcloud.net/ GIS Reports Second Quarter 2018 Results
Third-quarter 2018 results November 9, 2018
 ` Third-quarter 018 results November 9, 018 ` 1 Disclaimer This presentation may contain forward-looking statements. Such statements are not statements of historical fact, and reflect the beliefs and expectations
9M 2018 RESULTS PRESENTATION
 9M 2018 RESULTS PRESENTATION 12.11.2018 9M 2018 RESULTS PRESENTATION DISCLAIMER This presentation (the "Presentation") has been prepared and is issued by, and is the sole responsibility of Telepizza Group,
2Q 2017 Earnings Results. September 12, 2017
 2Q 2017 Earnings Results September 12, 2017 Disclaimer This presentation (the "Presentation") has been prepared and is issued by, and is the sole responsibility of Codere, S.A. ( Codere" or "the Company").
Presentation of FY 2017 Results. February 26 th, 2018
 Presentation of FY 2017 Results February 26 th, 2018 Gestamp 2018 Disclaimer This presentation has been prepared solely for use at this presentation of our results as of and for the quarter ended December
FINANCIAL OVERVIEW AL MISTYSYN SENIOR VICE PRESIDENT, FINANCE & CHIEF FINANCIAL OFFICER FINANCIAL COMMUNITY PRESENTATION OCTOBER 3, 2017
 FINANCIAL OVERVIEW AL MISTYSYN SENIOR VICE PRESIDENT, FINANCE & CHIEF FINANCIAL OFFICER FINANCIAL COMMUNITY PRESENTATION OCTOBER 3, 2017 Forward Looking Statement The presentations today will contain certain
Siemens Gamesa Renewable Energy Q3 18 Results
 Siemens Gamesa Renewable Energy Q3 18 Results 27 July 2018 Disclaimer This material has been prepared by Siemens Gamesa Renewable Energy, and is disclosed solely for information purposes. This document
Grupo LALA, S.A.B. de C.V.
 Grupo LALA, S.A.B. de C.V. INVESTOR RELATIONS PRESENTATION December, 2016 1949 1980 1990 2000 2010 2015 ABOUT US WHO WE ARE LALA is a Mexican Company focused in the healthy and nutritious food industry
Q Results presentation
 Q1 2016 Results presentation 12 May 2016 1 Disclaimer This presentation (the "Presentation") has been prepared and is issued by, and is the sole responsibility of Telepizza Group, S.A. ( Telepizza" or
High Liner Foods RBC Capital Markets Consumer & Retail Conference. May 30, 2018
 High Liner Foods 2018 RBC Capital Markets Consumer & Retail Conference May 30, 2018 Rod Hepponstall, President & CEO Paul Jewer, EVP & CFO Heather Keeler-Hurshman, VP Investor Relations Disclaimer Certain
FY 2011 Results. February 28th, 2012
 FY 2011 Results February 28th, 2012 Disclaimer In addition to figures prepared in accordance with IFRS, PRISA presents non-gaap financial performance measures, e.g., EBITDA, EBITDA margin, adjusted EBITDA,
Siemens Gamesa Renewable Energy Q Results
 Siemens Gamesa Renewable Energy Q2 208 Results 04 May 208 Disclaimer This material has been prepared by Siemens Gamesa Renewable Energy, and is disclosed solely for information purposes. This document
CORPORATE PRESENTATION
 CORPORATE PRESENTATION 2017 InRetail Overview Multi-format retailer with exclusive focus in Peru Leading positions in its 3 segments #1 supermarket chain #1 pharmacy chain #1 shopping center operator Controlled
Strengthening the economic model
 Strengthening the economic model Cécile CABANIS Executive Vice President, Chief Financial Officer Strategy and Information Systems DISCLAIMER This document is presented by Danone. It contains certain forward-looking
16 May M FY 2017/18 FINANCIAL RESULTS
 16 May 2018 6M FY 2017/18 FINANCIAL RESULTS NOTICE TO RECIPIENTS This presentation and any materials distributed in connection herewith (together, the Presentation ) have been prepared by Douglas GmbH
CSCK 12. Credit Suisse Mexico Credit Opportunities Trust January Overview. Investment Performance
 CSCK 12 Credit Suisse Mexico Credit Opportunities Trust January 2019 This document is for information purposes only. The information contained herein is public, comes from public sources or is informative
1Q 2015 Results. May 8, 2015
 1Q 2015 Results May 8, 2015 Highlights of the period Good operating results: recurring EBITDA +4% Latam: confirmed positive trends, EBITDA +33% yoy and reorganization kicked -off Renewables: +0.2 GW capacity
STRATEGICALLY POSITIONED FOR GROWTH.
 STRATEGICALLY POSITIONED FOR GROWTH. ANNUAL REPORT 2017 SHOP APOTHEKE EUROPE N.V. DR. ULRICH WANDEL, CFO 12 MARCH 2018 DISCLAIMER. 2 THIS PRESENTATION AND ITS CONTENTS ARE NOT FOR RELEASE, PUBLICATION
Investor Presentation. May 2016
 Investor Presentation May 2016 Safe Harbor Statement During this presentation management may discuss certain forward-looking statements concerning FEMSA s future performance that should be considered as
FY18 RESULTS PRESENTATION. February 26 th, 2019
 FY18 RESULTS PRESENTATION February 26 th, 2019 0 Disclaimer The information contained in this presentation has not been independently verified and is, in any case, subject to negotiation, changes and modifications.
Q Results Investor Presentation. PLAY Communications 12 November 2018
 Q3 2018 Results Investor Presentation PLAY Communications 12 November 2018 Disclaimer This presentation has been prepared by Play Communications S.A. s and its subsidiaries (together the PLAY Group ).
An Inflexion Point in the Company 1H 2015 RESULTS PRESENTATION. Madrid, 22 nd July 2015
 An Inflexion Point in the Company 1H 2015 RESULTS PRESENTATION Madrid, 22 nd July 2015 Disclaimer In addition to figures prepared in accordance with IFRS, PRISA presents non-gaap financial performance
EARNINGS RELEASE 3Q17
 LOGISTICS INVESTMENT PLATFORM EARNINGS RELEASE 3Q17 1 Quarterly Results 3Q17 TRAXION S REVENUE AND EBITDA INCREASE 70% AND 56% DURING 3Q17 BOOSTED BY ACQUISITIONS CONSOLIDATION YTD 2017 REVENUE AND EBITDA
BAML Conference - Miami
 BAML Conference - Miami Francois Luscan, President & CEO Xavier Leclerc de Hauteclocque, CFO December 3, 2013 Forward Looking Statement This presentation may include forward-looking statements. Forward-looking
Corporate Presentation Investor Relations September 2012
 Corporate Presentation Investor Relations September 2012 Chilean Economy and Financial System Why invest in Chile? A low risk, open and diversified economy 3 Chile is the highest rated country in Latin
Stericycle Investor Presentation Q NASDAQ: SRCL
 Stericycle Investor Presentation Q3-2017 NASDAQ: SRCL Forward - Looking Statements Safe Harbor Statement: This press release may contain forward-looking statements that involve risks and uncertainties,
KCM today. Solid financial position. Market leader. Access to leading technology & brands. Above average profitability. Strong growth potential
 Presentation 3Q17 KCM today LTM 3Q 17 Sales: US$2.0bn (1) Market Cap of US$5.6bn (2) 10% 4% Diapers Bathroom Napkins Wet Wipes Tissue Feminine & Adult Care Bar & Liquid Soaps (3) 86% Consumer Products
Enel Green Power business plan. Rome - April 3 rd 2014
 Enel Green Power 20142018 business plan Rome April 3 rd 2014 EGP 20142018 business plan Agenda Snapshot on 2013 key achievements F. Starace, CEO Focus on geothermal R. Deambrogio, Head of Italy & Europe
Quality assets. Selective and profitable growth. Self-funding business model
 This presentation has been prepared by EDP Renováveis, S.A. (the "Company") solely for use at the presentation to be made on May 6 th, 2015. By attending the meeting where this presentation is made, or
3Q18 EARNINGS RELEASE. Earnings Release 3Q18 1 / 16
 EARNINGS RELEASE 3Q18 1 / 16 Monterrey, Mexico, October 25 th, 2018. Grupo Famsa, S.A.B. de C.V. (BMV: GFAMSA), a leading Mexican commercial conglomerate in the retail, consumer and savings sector, announced
Business & Operating Review
 Business & Operating Review 0 This presentation may contain financial or business projections regarding recent acquisitions, their financial or business impact, management expectations and objectives regarding
2018 First Quarter Results May 14, Samsonite International S.A. Stock Code 1910
 2018 First Quarter Results May 14, 2018 Samsonite International S.A. Stock Code 1910 Disclosure Statement Page 2 This presentation and the accompanying slides (the Presentation ) which have been prepared
Index. 01 Highlights 4 02 Financial review 6 03 Business review Closing remarks Appendix 17 / 3
 Q118 Results Legal disclaimer This document does not constitute or form part of any purchase, sales or Exchange offer, nor is it an invitation to draw up a purchase sales or exchange offer, or advice on
FY 2015 consolidated results. March 23, 2016
 FY 2015 consolidated results March 23, 2016 Agenda Delivery on strategic plan Financial results Business analysis Closing remarks 1 Delivery on strategic plan Opening remarks Operational efficiency delivering
CORPORATE PRESENTATION. March 2017
 CORPORATE PRESENTATION March 2017 InRetail Overview Multi-format retailer with exclusive focus in Peru Leading positions in its 3 segments #1 supermarket chain #1 pharmacy chain #1 shopping center operator
KION UPDATE CALL Q Gordon Riske, CEO Thomas Toepfer, CFO Wiesbaden, 7 May 2015
 KION UPDATE CALL 2015 Gordon Riske, CEO Thomas Toepfer, CFO Wiesbaden, 7 May 2015 AGENDA 1 Highlights Gordon Riske 2 Market update Gordon Riske 3 Financial update Thomas Toepfer 4 Outlook Gordon Riske
27 February 2012 Update on Recent T r T ansactions r
 27 February 2012 Update on Recent Transactions Recent Developments Atlantia to acquire interests in Autostrade Sud America (ASA) held by SIAS and Mediobanca ASA fully owns Grupo Costanera, holding company
THE GLOBAL CONTRARIAN
 November 8, 2011 Grupo Bimbo, SAB de CV (BUY) Price: MXN27.04 Ticker 2 : BIMBOA MM 52-Week Range: MXN22.88- MXN29.00 Dividend: MXN0.54 Shares Outstanding: 4,703.2 million Yield: 2.0% Market Capitalization:
CORPORATE PRESENTATION
 CORPORATE PRESENTATION 2018 InRetail Overview Peruvian multi-format retailer, with presence in the Andean region through the pharma business Leading positions in Peru in its 3 segments #1 food retail chain
CORPORATE PRESENTATION 3Q12 RESULTS
 CORPORATE PRESENTATION 3Q12 RESULTS November 2012 1 Disclaimer The information contained in this presentation concerning projections of Votorantim Industrial S.A. and its subsidiaries ( Votorantim ) may
GRUPO LALA, S.A.B. DE C.V. LALA TO ACQUIRE VIGOR ALIMENTOS, S.A.
 GRUPO LALA, S.A.B. DE C.V. LALA TO ACQUIRE VIGOR ALIMENTOS, S.A. DISCLAIMER This material does not constitute an offering document. This material was prepared solely for informational purposes and is not
Nilfisk Financial Results 2017 Webcast presentation - February 28
 Webcast presentation - February 28 Today s presenters Nilfisk CEO Hans Henrik Lund Nilfisk CFO Karina Deacon Page 2 Agenda 1 2 3 4 5 6 Highlights Business unit update Financials Nilfisk Next Outlook 2018
5 Q & A. Agenda. Introduction Ben Robinson Strategy Director. Strategy and Business update Guy Dubois CEO. Financial update David Arnott CFO
 Financial Results & Business Update Quarter and year ended 1 December 2011 Disclaimer NOT FOR RELEASE, PUBLICATION OR DISTRIBUTION IN WHOLE OR IN PART IN OR INTO OR FROM THE UNITED STATES OR ANY OTHER
Presentation to Investors. December 2013
 Presentation to Investors December 2013 Who we are Engineering contractor and greenfield developer Revenues 2012 > 38 bn Current Backlog 67 bn Civil Engineering Industrial Engineering Construction Environment
Hector Grisi. Country Head Mexico. Helping people and businesses prosper
 Hector Grisi Country Head Mexico Helping people and businesses prosper Banco Santander, S.A. ("Santander") cautions that this presentation contains statements that constitute forward-looking statements
Conference Call Transcript 4Q10 Results Grupo Bimbo (BIMBO) February 25 th, 2011
 February 25 th, 2011") Operator: Good morning, everyone and welcome to Grupo Bimbo's 4Q10 results conference call. If you need a copy of the press release issued yesterday, it is available on the Company's website at www.grupobimbo.com.
Operator: Good morning, everyone and welcome to Grupo Bimbo's 4Q10 results conference call. If you need a copy of the press release issued yesterday, it is available on the Company's website at www.grupobimbo.com.
HSBC Bank Canada Investor Presentation
 HSBC Bank Canada Investor Presentation Graham McIsaac Chief Financial Officer April 2009 Brad Meredith Executive Vice-President, Global Banking and Markets Nick Turnor Head of Debt Investor Relations,
Owens Corning. Investor Presentation. Week of January 15, 2007
 Owens Corning Investor Presentation Week of January 15, 2007 Forward-looking Statement and Non-GAAP Measures This presentation contains forward-looking statements within the meaning of Section 27A of the