AG Mortgage Investment Trust, Inc. Q Earnings Presentation
|
|
|
- Jeffery Ward
- 5 years ago
- Views:
Transcription


1 AG Mortgage Investment Trust, Inc. Q Earnings Presentation November 8, 2018
2 Forward Looking Statements and Non-GAAP Financial Information Forward Looking Statements: This presentation includes "forward-looking statements" within the meaning of the safe harbor provisions of the United States Private Securities Litigation Reform Act of 1995 related to dividends, book value, our investments and our investment and portfolio strategy, investment returns, return on equity, liquidity and financing, taxes, our assets, our interest rate sensitivity, and our views on certain macroeconomic trends, among others. Forward-looking statements are based on estimates, projections, beliefs and assumptions of management of the Company at the time of such statements and are not guarantees of future performance. Forward-looking statements involve risks and uncertainties in predicting future results and conditions. Actual results could differ materially from those projected in these forward-looking statements due to a variety of factors, including, without limitation, changes in interest rates, changes in the yield curve, changes in prepayment rates, the availability and terms of financing, changes in the market value of our assets, general economic conditions, conditions in the market for Agency RMBS, Non-Agency RMBS, ABS and CMBS securities and loans, our ability to integrate newly acquired rental assets into the investment portfolio, our ability to predict and control costs, conditions in the real estate market, and legislative and regulatory changes that could adversely affect the business of the Company. Additional information concerning these and other risk factors are contained in the Company's filings with the Securities and Exchange Commission ("SEC"), including its most recent Annual Report on Form 10-K and subsequent filings. Copies are available free of charge on the SEC's website, All information in this presentation is as of November 7, The Company undertakes no duty to update any forward-looking statements to reflect any change in its expectations or any change in events, conditions or circumstances on which any such statement is based. Non-GAAP Financial Information: In addition to the results presented in accordance with GAAP, this presentation includes certain non-gaap financial results and financial metrics derived therefrom, which are calculated by including or excluding unconsolidated investments in affiliates, TBAs, and U.S. Treasuries, or by allocating non-investment portfolio related items based on their respective characteristics, as described in the footnotes. Our management team believes that this non-gaap financial information, when considered with our GAAP financials, provide supplemental information useful for investors in evaluating our results of operations. This presentation also contains Core Earnings, a non-gaap financial measure. Our presentation of non-gaap financial information may not be comparable to similarly-titled measures of other companies, who may use different calculations. This non- GAAP financial information should not be considered a substitute for, or superior to, the financial measures calculated in accordance with GAAP. Our GAAP financial results and the reconciliations from these results should be carefully evaluated. 2
3 Q MITT Earnings Call Presenters David Roberts T.J. Durkin Brian Sigman Karen Werbel Chief Executive Officer Chief Investment Officer Chief Financial Officer Head of Investor Relations 3
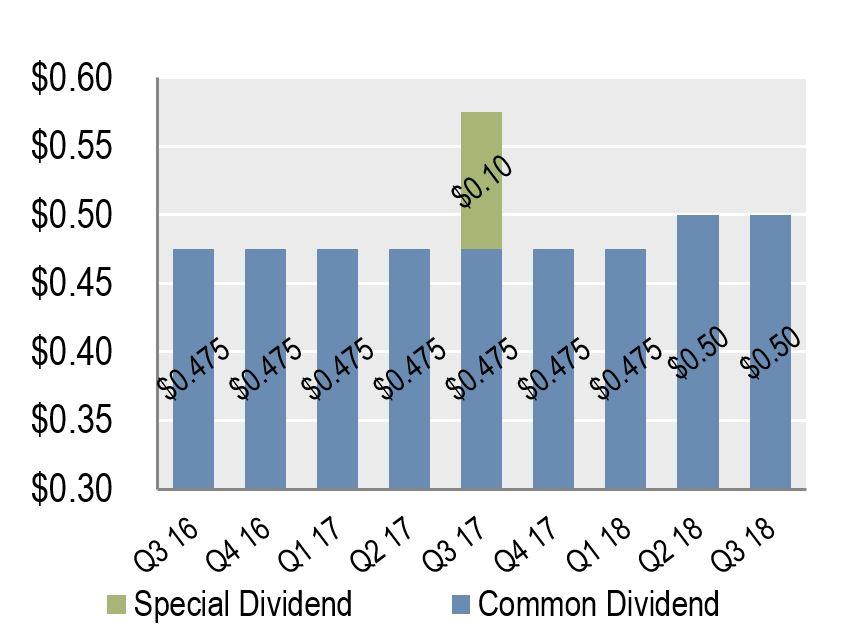
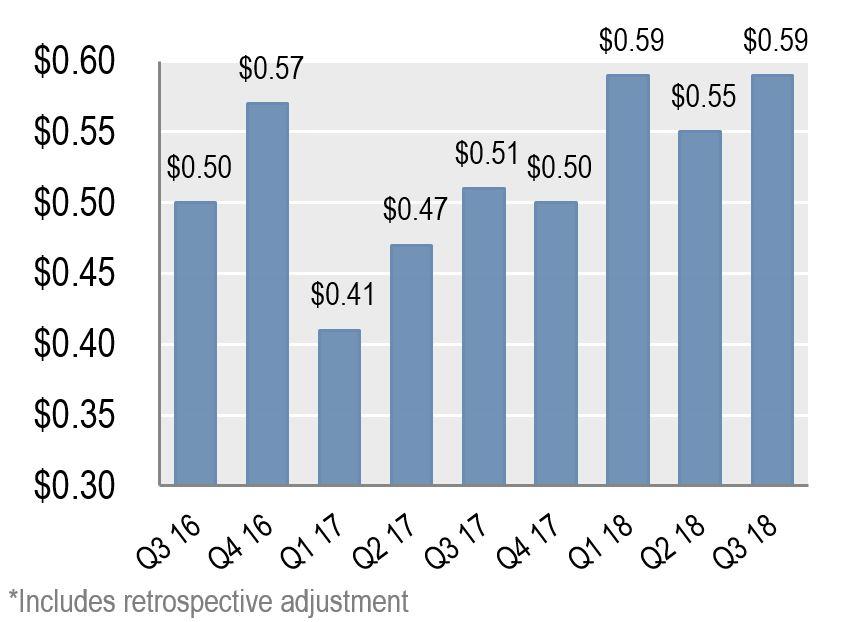
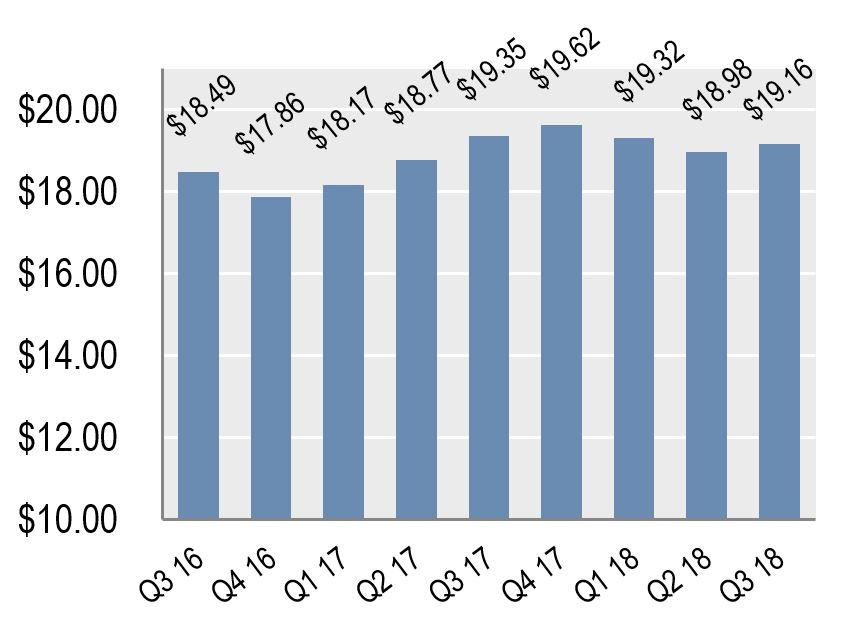
4 Q Performance and Highlights Third quarter 2018: $0.70 of Net Income/(Loss) per diluted common share 1 $0.59 of Core Earnings per diluted common share 1, 2 Includes $0.03 positive impact from payoffs of certain prime securities Includes $0.01 retrospective adjustment 3.6% economic return on equity for the quarter, 14.4% annualized 3 $19.16 book value per share 1 as of September 30, 2018, inclusive of our current quarter $0.50 common dividend Book value increased $0.18 or 0.9% from the prior quarter primarily due to: $0.36 or 1.9% due to our Credit Investments CRT and CMBS securities saw broad-based tightening during the quarter, while Legacy RMBS spreads remained at tight levels $(0.26) or (1.4)% due to our investments in Agency RMBS and associated derivative hedges Agency RMBS spreads widened modestly during the quarter due to increased interest rates and market technicals $0.09 or 0.5% due to core earnings above the $0.50 dividend Issued approximately 512,000 shares of common stock for net proceeds of $9.5 million through ATM Program 4
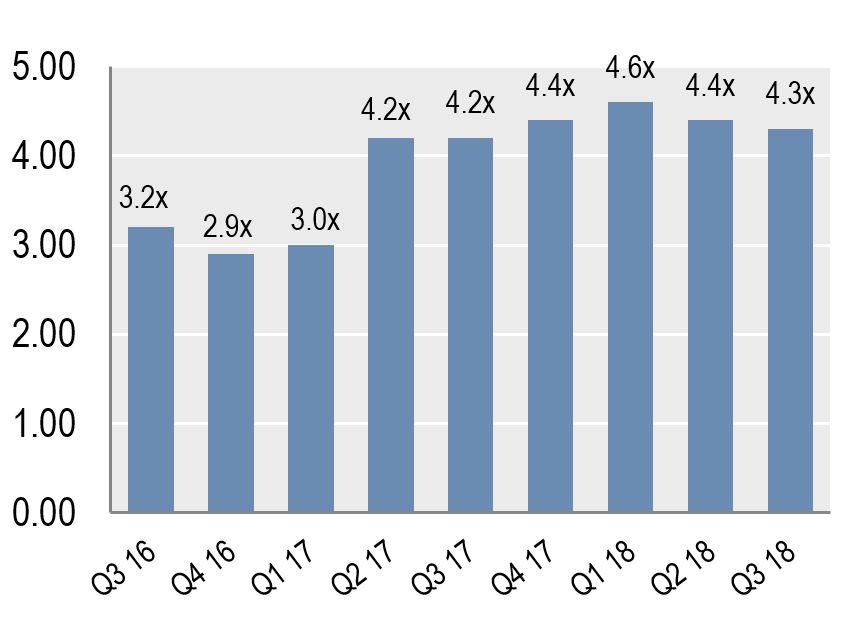
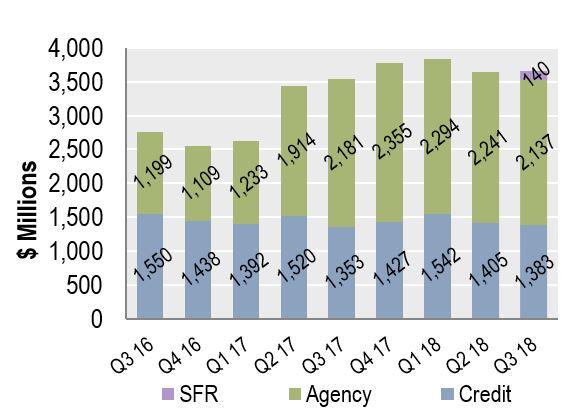
5 Q Performance and Highlights (cont d) $3.7 billion investment portfolio as of September 30, 2018 as compared to the $3.6 billion investment portfolio as of June 30, ,5 Increase in portfolio size primarily due to the acquisition of the Single-Family Rental portfolio (SFR) and the purchase of commercial real estate loans 2.5% Net Interest Margin ( NIM ) as of September 30, Net Interest Margin declined primarily due to the increase in cost of funds related to a 25 bps increase in the federal funds rate in September and the addition of the SFR portfolio 4.3x At Risk Leverage as of September 30, /30/ /31/2017 3/31/2018 6/30/2018 9/30/2018 Yield on Investment Portfolio 8 4.7% 4.6% 5.0% 5.1% 5.2% Cost of Funds 9 2.1% 2.2% 2.3% 2.4% 2.7% NIM 6 2.6% 2.4% 2.7% 2.7% 2.5% At Risk Leverage 7 4.2x 4.4x 4.6x 4.4x 4.3x 5
6 Q Activity ($ in millions) Purchased Sold/Payoff Net Activity Description 30 Year Fixed Rate $ $ (428.3) $ 51.1 Inverse Interest Only 11.1 (0.7) 10.4 Fixed Rate 30 Year TBA (588.8) (91.0) Total Agency RMBS (1,017.8) (29.5) Prime (69.9) (69.9) Alt-A/Subprime (6.9) (6.9) Credit Risk Transfer RPL/NPL Securities (5.5) (5.5) Re/Non-Performing Loans (4.0) (4.0) New Origination Loans Total Residential Investments 37.4 (86.3) (48.9) Freddie Mac K-Series CMBS Interest Only (0.7) (0.7) Commercial Loans Total Commercial Investments 54.0 (0.7) 53.3 Total Single-Family Rental Properties Total Q3 Activity $1,220.3 $(1,104.8) $115.5 Acquired portfolio of single-family rental properties Purchased two commercial real estate loans Purchased several Non-QM pools alongside other Angelo Gordon funds Sold and received payoffs of prime securities Note: The chart above is based on trade date. 6
7 Single-Family Rental Transaction Rationale and Benefits SFR is complementary to MITT s existing strategies Scalable market opportunity Conrex is a leader in the industry Attractive strategic financing The SFR acquisition strengthens MITT s position as a leader in investing in a wide range of housing and credit transactions The transaction leverages the Angelo Gordon platform, including the knowledge and expertise from our mortgage credit team and real estate groups This strategic product channel will provide consistent flow of investment opportunities for MITT and further allow MITT the ability to opportunistically allocate capital to drive long term stockholder value The SFR market continues to grow with expanded opportunities across geographies, quality classes and strategies Housing supply shortages, increased sales prices, and rising interest rates are keeping would-be buyers in rental housing Institutional investments in single-family assets have experienced significant growth since the last housing cycle Continued mortgage workouts create a potential pipeline for ongoing single-family rental properties Conrex has a deep understanding of its targeted MSAs, and has acquired 7,000+ homes to date, using a proprietary operating system to facilitate all aspects of management of SFR from renovation through rental Conrex s regional concentration results in operational efficiencies and their regional proximity improves execution, oversight, partner relationships, and sourcing opportunities In conjunction with the transaction, we financed the portfolio with $103 mm fiveyear, 4.625% fixed rate debt from an insurance company The financing is nonmark-to-market and non-recourse 7
8 Single-Family Rental Transaction Overview Background Acquired a stabilized portfolio of 1,225 single-family homes from funds affiliated with Conrex The properties are located in Alabama, Georgia, Indiana, North Carolina, Ohio, South Carolina and Tennessee The aggregate purchase price of the portfolio was approximately $140 million MITT entered into a property management services agreement with Conrex, whereby Conrex continues to provide property management services related to the leasing, management, maintenance and day-to-day operations of the properties Portfolio Benefits We expect targeted levered returns of approximately 10% with upside to increasing rents and continued operating efficiencies The stabilized portfolio provides MITT with strong initial cash flow stream in excess of our financing cost Conrex is incentivized to maximize the portfolio performance as the property manager, as it only receives a performance-based fee if certain hurdles are met Portfolio Statistics as of 9/30/18 Gross Carrying Value (a) $ Accumulated Depreciation and Amortization (a) (0.5) Net Carrying Value (a) $ Total Number of Homes 1,225 Occupancy 89.3% Average Square Footage 1,460 Average Monthly Rental Income per Home $ 1,007 Operating Margin 57.3% (a) $ in millions 8
9 Q Macro-Economic Conditions Macro Environment Housing Agency RMBS In September, the FOMC increased the federal funds rate by an additional 25 basis points Interest rates rose by 20 to 30 basis points across the yield curve Growth in the second quarter was robust in response to peak tax cut and deregulation impacts, and economic data shows that much of this strength carried over into the third quarter with GDP expansion of 3.5% Year-over-year core inflation has moved to the Fed s 2.0% goal Home price appreciation remains strong amid a lack of housing supply but there are indications of slower home price growth ahead due to slower housing activity and increased mortgage rates Agency RMBS spreads were marginally wider during the quarter, as bank and foreign investor demand remained muted, while the Federal Reserve reached peak portfolio runoff caps The spread widening was limited, however, as higher interest rates have kept organic supply manageable, interest rate volatility remains contained and valuations appear attractive to competing spread products Credit Fundamental mortgage residential collateral performance, as measured by delinquency and default rates, continues to approach pre-crisis levels 9
10 Investment Opportunity Set Agency RMBS Hypothetical Duration Hedged Levered ROE: 8-14% (a)(b) 30/20/15 Year Fixed Rate, Hybrid ARM, Fixed Rate CMO, Agency IO, Inverse IO, Excess MSRs Residential Investments Hypothetical Levered ROE: 8-14% (b) CRT, NPL, RPL, Non-QM, Legacy Commercial Investments Hypothetical Levered ROE: 10-16% (b) Conduit, Single Asset/Single Borrower, Freddie Mac K-series, Commercial Loans ABS Hypothetical Levered ROE: 8-14% (b) Consumer, auto backed debt, credit card, other non-residential ABS Single-Family Rental Properties Hypothetical Levered ROE: 8-12% (b) (a) Hypothetical levered returns on Agency RMBS are presented on a duration hedged basis, net of related costs. (b) ROE values are presented gross of management fee and other corporate expenses. Note: The above-listed investment opportunity set represents a subset of the types of assets that the Company can acquire. The hypothetical Levered Returns on Equity ( ROE ) depicted above are dependent on a variety of inputs and assumptions, which are assumed to be static, and do not reflect the impact of operating expenses. Actual returns could differ materially from those presented based on a number of factors, including changes in interest rates, spreads, prepayments, asset values, funding levels, risk positions, hedging costs, expenses, occupancy, rental rates and other factors. 10
 NIM (a) Leverage Ratio (b) Agency RMBS (c) $2,163.6 $2,136.8 58.4% $285.4 40.1% 3.9% 2.3% 1.6% 6.7x Residential Investments (c) 904.2 962.2 26.3% 251.3 35.3% 6.7% 3.6% 3.1% 3.0x Commercial Investments (c) 368.")
11 Q Investment Portfolio Composition 4,5 Amortized Cost (mm) Net Carrying Value (mm) Percent of Net Carrying Value Allocated Equity (mm) 10 Percent of Equity Weighted Average Yield 8 Funding Cost (a) NIM (a) Leverage Ratio (b) Agency RMBS (c) $2,163.6 $2, % $ % 3.9% 2.3% 1.6% 6.7x Residential Investments (c) % % 6.7% 3.6% 3.1% 3.0x Commercial Investments (c) % % 7.9% 3.7% 4.2% 2.3x ABS % % 9.4% 3.6% 5.8% 1.0x Single-Family Rental Properties % % 6.1% 4.8% 1.3% 2.7x Total Investment Portfolio $3,614.1 $3, % $ % 5.2% 2.7% 2.5% 4.3x (a) Funding cost and NIM shown in each investment category line exclude the costs of our interest rate hedges, however these costs are included in the total funding cost and NIM lines. The total funding cost and NIM lines excluding the cost of our interest rate hedges would be 2.8% and 2.4%, respectively. (b) The leverage ratio on Agency RMBS includes any net receivables on TBA. The leverage ratio by type of investment is calculated based on allocated equity. 10 (c) The table above includes fair value of $0.9 million of Agency RMBS, $159.6 million of Residential Investments and $3.1 million of Commercial Investments that are included in the Investments in debt and equity of affiliates line item on our consolidated balance sheet. As of Q3 2018, 58.4% Agency, 37.8% Credit, and 3.8% SFR As of Q3 2018, 40.1% Agency, 54.5% Credit and 5.4% SFR 11

 11 on the Agency RMBS investment portfolio for Q3 2018 (a) Loan Balance: Pools made up of loans with original balances less than $200,000 (b) Geography: Pools made")
12 Q Agency Portfolio Details Description Current Face (mm) Fair Value (mm) Percent of Fair Value Weighted Average Coupon 12 Weighted Average Yield 8 30 Year Fixed Rate $1,741.0 $1, % 4.0% 3.6% Fixed Rate CMO % 3.0% 2.8% ARM % 2.4% 2.9% Inverse Interest Only % 4.0% 8.3% Interest Only % 3.5% 7.3% Excess MSRs 3, % N/A 11.3% Fixed Rate 30 Year TBA % 4.0% N/A Total Agency RMBS $6,499.6 $2, % 3.8% 3.9% Quarterly CPR Total Agency Fixed Rate Pools (Fair Value) 6.0% constant prepayment rate ( CPR ) 11 on the Agency RMBS investment portfolio for Q (a) Loan Balance: Pools made up of loans with original balances less than $200,000 (b) Geography: Pools made up of loans originated in states that offer favorable prepayment profiles (c) Other: Pools made up of newly originated loans, loans on investor properties, loans with higher LTVs or loans taken out by borrowers with lower than average FICOs 12
 75.4 74.5 7.8% 3.4% 3.4% RMBS Interest Only and Excess MSR 358.4 4.1 0.4% 0.6% 26.")
 RPL/NPL securities whose deal structures contain an interest rate step-up feature.")
13 Q Residential Portfolio Details Description Current Face (mm) Fair Value (mm) Percent of Fair Value Weighted Average Coupon 12 Weighted Average Yield 8 Prime $402.2 $ % 4.8% 7.1% Alt-A/Subprime % 4.8% 6.2% Credit Risk Transfer % 5.8% 6.0% RPL/NPL securities (a) % 3.4% 3.4% RMBS Interest Only and Excess MSR % 0.6% 26.6% Re/Non-Performing Loans (b) % 4.3% 8.4% New Origination Loans % 6.3% 5.1% Total Residential Investments $1,510.8 $ % 4.2% 6.7% (a) RPL/NPL securities whose deal structures contain an interest rate step-up feature. (b) Consolidated whole loan positions as well as whole loans purchased from an affiliate or affiliates of our manager in securitized form. Percent of Fair Value in Floating Rate Coupon (c) vs. 3 Month LIBOR Residential Investments (Fair Value) 56% of our Residential Investments (c) are fixed rate coupon and 44% are floating rate coupon 12 (c) Excludes Re/Non-Performing Loans 13


14 Q Commercial and ABS Portfolio Details Description Current Face (mm) Fair Value (mm) Percent of Fair Value Weighted Average Coupon 12 Weighted Average Yield 8 CMBS $199.5 $ % 5.9% 6.4% Freddie Mac K-Series % 5.9% 12.2% Interest Only 3, % 0.3% 6.8% Commercial Loans % 7.2% 7.4% Total Commercial Investments 3, % 0.7% 7.9% ABS % 8.8% 9.4% Total Commercial and ABS $3,998.9 $ % 0.8% 8.1% CMBX.NA 8 BBB- Mid Spread Commercial and ABS (Fair Value) 24% of our Commercial and ABS Investments are fixed rate coupon and 76% are floating rate coupon 12 14
15 Financing Financing arrangements with 41 counterparties Currently financing investments with 31 counterparties Our weighted average days to maturity is 122 days and our weighted average original days to maturity is 162 days Financing counterparties remain stable Financing Arrangements (a) ($ in millions) Agency Credit SFR (b) Maturing Within Amount Outstanding WA Funding Cost Amount Outstanding WA Funding Cost Amount Outstanding WA Funding Cost Overnight $ % $ $ 30 Days or less 1, % % Days % % Days % days % Greater than 180 Days % % Total and WA $1, % $1, % $ % (a) Amounts do not include securitized debt of $11.5 million (b) Includes $1 million of deferred financing costs 15
16 Duration Gap 14 Duration gap was approximately 1.12 years as of September 30, 2018 Duration Years Agency 3.11 Hedges (3.03) Agency Gap Subtotal 0.08 Credit 1.04 Duration Gap 1.12 Duration gap was approximately 1.08 years as of June 30, 2018 Duration Years Agency 2.93 Hedges (2.95) Agency Gap Subtotal (0.02) Credit 1.10 Duration Gap
17 Hedging Hedge Portfolio Summary as of September 30, 2018 ($ in millions) Notional Duration 14 Interest Rate Swaps (2,143.0) (2.82) Swaptions (250.0) (0.11) Treasury Futures, net (50.0) (0.10) U.S. Treasuries, net (5.8) 0.00 Total $(2,448.8) (3.03) Maturity Notional Amount Interest Rate Swaps as of September 30, 2018 ($ in millions) Weighted Average Pay-Fixed Rate Weighted Average Receive Variable Rate (a) Weighted Average Years to Maturity 2019 $ % 2.3% % 2.3% % 2.3% % 2.3% % 2.4% % 2.3% % 2.4% % 2.3% % 2.3% % 2.3% 9.7 Total/Wtd Avg $2, % 2.3% 5.4 (a) 100% of our receive variable interest rate swap notional amount resets quarterly based on three-month LIBOR 17
18 Q Financial Metrics Key Statistics September 30, 2018 Weighted Average for the quarter-ended September 30, 2018 Investment portfolio 4,5 $3,660.4 $3,457.8 Financing agreements 5 3, ,851.3 Total Financing 7 3, ,020.9 Stockholders equity GAAP Leverage 4.0x 4.1x At Risk Leverage 7 4.3x 4.3x Yield on investment portfolio 8 5.2% 5.1% Cost of funds 9 2.7% 2.4% Net interest margin 6 2.5% 2.7% Management fees % 1.3% Other operating expenses % 2.0% Book value, per share 1 $19.16 Undistributed taxable income, per share (a) $1.58 Common Dividend, per share 1 $0.50 (a) Refer to slide 24 for further detail 18
19 Supplemental Information & Financial Statements 19

20 Quarter-Over-Quarter Snapshot Net Carrying Value of Investment Portfolio Book Value At Risk Leverage Core Earnings* Dividend Net Income (Loss) 20
21 Market Snapshot Interest Rates 9/30/17 12/31/17 3/31/18 6/30/18 9/30/2018 Treasuries 2-year year year Swaps 3 month LIBOR year year year Agency RMBS 9/30/17 12/31/17 3/31/18 6/30/18 9/30/2018 Fannie Mae Pass- Throughs 15 year 2.50% year 3.00% year 3.00% year 3.50% Mortgage Rates 15-year 3.13% 3.44% 3.90% 4.04% 4.16% 30-year 3.83% 3.99% 4.44% 4.55% 4.72% Credit Spreads 9/30/17 12/31/17 3/31/18 6/30/18 9/30/18 CDX IG CAS 2016 Vintage M CMBX.NA 8 BBB- Mid Spread Source: Bloomberg and Wall Street research. Data has not been independently validated. 21
22 Book Value Roll-Forward Amount (000 s) Per Share 1 6/30/18 Book Value $ 535,344 $ Common dividend (14,369) (0.50) Core earnings 16, Net proceeds and accretion/(dilution) from issuance of common stock and RSUs 9,508 (0.02) Equity based compensation Property depreciation and amortization (494) (0.02) Transaction related expenses and deal related performance fees (216) (0.01) Equity in earnings/(loss) from affiliates 11, Net realized gain/(loss) (14,204) (0.50) Net unrealized gain/(loss) 6, /30/18 Book Value $ 550,659 $ Change in Book Value 15,
23 Reconciliation of GAAP Net Income to Core Earnings 2 Three Months Ended September 30, 2018 Amount (000 s) Per Share 1 Net Income/(loss) available to common stockholders $ 20,010 $ 0.70 Add (Deduct): Net realized (gain)/loss 14, Dollar roll income Equity in (earnings)/loss from affiliates (13,960) (0.49) Net interest income and expenses from equity method investments 2, Transaction related expenses and deal related performance fees Property depreciation and amortization Unrealized (gain)/loss on real estate securities and loans, net (700) (0.02) Unrealized (gain)/loss on derivative and other instruments, net (6,589) (0.23) Core Earnings $ 16,714 $
24 Undistributed Taxable Income Roll-Forward Amount (000 s) Per Share 1 6/30/18 Undistributed Taxable Income $ 44,330 $ 1.57 Net Accretion/(dilution) from issuance of common stock and RSUs (0.03) Q3 Core Earnings 16, Q3 Recurring Core-Tax Differences (1,883) (0.07) Q3 Other Core-Tax Differences Q Ordinary Taxable Income, Net of Preferred Distribution 15, Q Common Distribution (14,369) (0.50) 9/30/18 Undistributed Taxable Income $ 45,493 $ 1.58 Note: This estimate of undistributed taxable income per share represents the total estimated undistributed taxable income as of quarter-end. Undistributed taxable income is based on current estimates and projections. The actual amount is not finalized until we file our annual tax return, typically in October of the following year. Figures may not foot due to rounding. 24
25 Condensed Consolidated Balance Sheet September 30, 2018 (Unaudited) Amount (000 s) Assets Liabilities Real estate securities, at fair value $ 3,070,163 Financing Arrangements $ 2,913,381 Residential mortgage loans, at fair value 87,600 Securitized debt, at fair value 11,481 Commercial loans, at fair value 94,618 Obligation to return securities borrowed under reverse repurchase agreements, at fair value 5,730 Single-family rental properties 140,059 Payable on unsettled trades 212,839 Investments in debt and equity of affiliates 79,698 Interest payable 5,294 Excess mortgage servicing rights, at fair value 28,625 Derivative liabilities, at fair value 1,030 Cash and cash equivalents 30,341 Dividend payable 14,369 Restricted cash 45,921 Due to affiliates 4,073 Interest receivable 12,823 Accrued expenses and other liabilities 14,720 Receivable on unsettled trades 285,041 Total Liabilities 3,182,917 Receivable under reverse repurchase agreements 5,750 Stockholders' Equity Derivative assets, at fair value 4,887 Preferred stock 161,214 Other assets 4,737 Common stock 287 Due from broker 4,526 Additional paid-in capital 595,310 Total Assets $ 3,894,789 Retained earnings (deficit) (44,939) Total Stockholders Equity 711,872 Total Liabilities & Stockholders Equity $ 3,894,789 25
26 Condensed Consolidated Statement of Operations Three Months Ended September 30, 2018 (Unaudited) Amount (000 s) Net Interest Income Earnings/(Loss) Per Share of Common Stock Interest income $ 39,703 Basic $ 0.70 Interest expense 18,692 Diluted $ 0.70 Total Net Interest Income 21,011 Other Income/(Loss) WA Shares of Common Stock Outstanding Net realized gain/(loss) (14,204) Basic 28,422 Net interest component of interest rate swaps 1,816 Diluted 28,438 Unrealized gain/(loss) on real estate securities and loans, net 700 Unrealized gain/(loss) on derivative and other instruments, net 6,589 Rental Income 794 Other Income 1 Total Other Income/(Loss) (4,304) Expenses Management fee to affiliate 2,384 Other operating expenses 3,503 Equity based compensation to affiliate 66 Excise tax 375 Servicing fees 148 Property depreciation and amortization 494 Property operating and maintenance expenses 232 Property management fee 88 Total Expenses 7,290 Income/(loss) before equity in earnings/(loss) from affiliates 9,417 Equity in earnings/(loss) from affiliates 13,960 Net Income/(Loss) 23,377 Dividends on preferred stock 3,367 Net Income/(Loss) Available to Common Stockholders $ 20,010 26
27 Footnotes 1. Diluted per share figures are calculated using weighted average outstanding shares in accordance with GAAP. Per share figures are calculated using a denominator of all outstanding common shares including all shares granted to our Manager and our independent directors under our equity incentive plans as of quarter-end. Book value uses stockholders equity less net proceeds of the Company s 8.25% Series A and 8.00% Series B Cumulative Redeemable Preferred Stock as the numerator. 2. Core Earnings are defined as Net Income/(loss) available to common stockholders excluding (i) unrealized and realized gains/(losses) on the sale or termination of securities, if any, on such sale or termination, loans, derivatives and other instruments, (ii) beginning with Q2 2018, any transaction related expenses incurred in connection with the acquisition or disposition of our investments, (iii) beginning with Q3 2018, any depreciation or amortization expense related to our SFR portfolio and, (iv) beginning with Q3 2018, accrued deal related performance fees payable to Arc Home and third party operators to the extent the primary component of the accrual relates to items that are excluded from core earnings, such as unrealized and realized gains/(losses). Items (i) through (iv) above include any amounts related to those items held in affiliated entities. Management considers the transaction related expenses referenced in (ii) above to be similar to realized losses incurred at acquisition or disposition and do not view them as being part of its core operations. Management also acknowledges that while deal related performance fees may be a material operating expense, they have been excluded from core because the primary component of the computation of the expense relates to items (such as gains or losses) that are excluded from core earnings. As defined, Core Earnings include the net interest income and other income earned on our investments on a yield adjusted basis, including TBA dollar roll income or any other investment activity that may earn or pay net interest or its economic equivalent. Core Earnings includes earnings from AG Arc LLC. Earnings from AG Arc LLC were $0.3 million in the third quarter of See page 23 for a reconciliation of GAAP net income to Core Earnings. See footnote 13 for further details on AG Arc LLC. 3. The economic return on equity for the quarter represents the change in book value per share from June 30, 2018 to September 30, 2018, plus the common dividends declared over that period, divided by book value per share as of June 30, The annualized economic return on equity is the quarterly return on equity multiplied by four. 4. The investment portfolio at period end is calculated by summing the net carrying value of our Agency RMBS, any long positions in TBAs, Residential Investments, Commercial Investments, ABS Investments, and our SFR portfolio, including securities and mortgage loans owned through investments in affiliates, exclusive of AG Arc LLC. Our Agency RMBS, Residential Investments, Commercial Investments, and ABS Investments are held at fair market value and our SFR portfolio is held at historical cost less depreciation and amortization and any adjustments related to impairment. Our Credit Investments refer to our Residential Investments, Commercial Investments, ABS Investments and Single-Family Rental. Refer to footnote 5 for more information on the GAAP accounting for certain items included in our investment portfolio. The percentage of net carrying value includes any net TBA positions and securities and mortgage loans owned through investments in affiliates and is exclusive of AG Arc LLC. Agency RMBS include fair value of $0.9 million of investment in debt and equity of affiliates related to Excess MSRs. Credit Investments 4 include fair value of $162.7 million of investment in debt and equity of affiliates comprised of $97.4 million of Re/Non-Performing Loans, $62.2 million of New Origination Loans, $0.4 mm of Interest Only and $2.7 million of Freddie Mac K-Series. These items, inclusive of our investment in AG Arc LLC 13 and other items, net to $79.7 million which is included in the Investments in debt and equity of affiliates line item on our GAAP Balance Sheet. See footnote 13 for further details on AG Arc LLC. 5. Generally, when we purchase an investment and employ leverage, the investment is included in our assets and the leverage is reflected in our liabilities on our consolidated balance sheet as either Financing arrangements or Securitized debt, at fair value. Throughout this presentation where we disclose our investment portfolio and the related financing, we have presented this information inclusive of (i) securities and mortgage loans owned through our investments in affiliates that are accounted for under GAAP using the equity method and (ii) long positions in TBAs, which are accounted for as derivatives under GAAP. This presentation excludes investments through AG Arc LLC unless otherwise noted. This presentation of our investment portfolio is consistent with how our management evaluates the business, and we believe this presentation, when considered with the GAAP presentation, provides supplemental information useful for investors in evaluating our investment portfolio and financial condition. See footnote 13 for further details on AG Arc LLC. 6. Net interest margin is calculated by subtracting the weighted average cost of funds from the weighted average yield for the Company s investment portfolio, which excludes cash held by the Company. Net interest margin also excludes any net TBA position. See footnotes 8 and 9 for further detail. 7. At Risk Leverage is calculated by dividing total financing, including any net TBA position, by our GAAP stockholders equity at quarter-end. Our net TBA position (at cost) was $75.2 million, $166.2 million, $143.7 million, $102.5 million, and $121.6 million for the periods ending September 30, 2018, June 30, 2018, March 31, 2018, December 31, 2017, and September 30, 2017, respectively. Total financing at quarter-end, and when shown, daily weighted average total financing, includes financing arrangements inclusive of financing arrangements through affiliated entities, exclusive of any financing utilized through AG Arc LLC, plus the payable on all unsettled buys less the financing on all unsettled sells, securitized debt, and any net TBA position (at cost). Total financing excludes any financing arrangements and unsettled trades on U.S. Treasuries. 8. The yield on our debt investments represents an effective interest rate, which utilizes all estimates of future cash flows and adjusts for actual prepayment and cash flow activity as of quarter-end. The yield on our SFR portfolio represents annualized net operating income for the quarter. This calculation excludes cash held by the Company and excludes any net TBA position. The calculation of weighted average yield is weighted based on net carrying value. 27
28 Footnotes (cont d) 9. The cost of funds during the quarter is calculated by annualizing the sum of our interest expense and net interest component on all derivative instruments and dividing that sum by our daily weighted average total financing for the period. Interest earning/paying derivative instruments may include interest rate swaps and U.S. Treasuries. The cost of funds at quarter-end is calculated as the sum of (i) the weighted average funding costs on total financing outstanding at quarter-end and (ii) the weighted average of the net pay rate on our interest rate swaps, the net receive rate on our Treasury long positions, the net pay rate on our Treasury short positions and the net receivable rate on our IO index derivatives, if any. Both elements of the cost of funds at quarter-end are weighted by the outstanding financing arrangements and securitized debt outstanding at quarter-end, excluding financing arrangements associated with U.S. Treasury positions. The cost of funds excludes any net TBA position. 10. The Company allocates its equity by investment using the net carrying value of its investment portfolio, less any associated leverage, inclusive of any long TBA position (at cost). The Company allocates all non-investment portfolio related items based on their respective characteristics in order to sum to the Company s stockholders equity per the consolidated balance sheets. The Company s equity allocation method is a non-gaap methodology and may not be comparable to similarly titled measures or concepts of other companies, who may use different calculations. 11. This represents the weighted average monthly CPRs published during the quarter for our in-place portfolio during the same period. Any net TBA position is excluded from the CPR calculation. 12. Equity residuals, excess MSRs and principal only securities with a zero coupon rate are excluded from this calculation. The calculation of weighted average coupon is weighted based on face value. 13. The Company invests in Arc Home LLC through AG Arc LLC, one of its indirect subsidiaries. 14. The Company estimates duration based on third-party models. Different models and methodologies can produce different effective duration estimates for the same securities. We allocate the net duration by asset type based on the interest rate sensitivity. Duration includes any net TBA position. Duration does not include our equity interest in AG Arc LLC or our investment in SFR. Duration related to financing agreements is netted within its respective agency and credit line items. 15. The management fee percentage during the quarter is calculated by annualizing the management fees recorded during the quarter and dividing by our weighted average stockholders equity for the quarter. The management fee percentage at quarter-end is calculated by annualizing management fees recorded during the quarter and dividing by quarter-end stockholders equity. 16. The other operating expenses percentage during the quarter is calculated by annualizing the other operating expenses recorded during the quarter and dividing by our weighted average stockholders equity for the quarter. The other operating expenses percentage at quarter-end is calculated by annualizing other operating expenses recorded during the quarter and dividing by quarter-end stockholders equity. 28

29
AG Mortgage Investment Trust, Inc. Q Earnings Presentation
 AG Mortgage Investment Trust, Inc. Q1 2018 Earnings Presentation May 3, 2018 Forward Looking Statements and Non-GAAP Financial Information Forward Looking Statements: This presentation includes "forward-looking
AG Mortgage Investment Trust, Inc. Q Earnings Presentation. August 7, 2018
 AG Mortgage Investment Trust, Inc. Q2 2018 Earnings Presentation August 7, 2018 Forward Looking Statements and Non-GAAP Financial Information Forward Looking Statements: This presentation includes "forward-looking
AG Mortgage Investment Trust, Inc. Investor Presentation
 AG Mortgage Investment Trust, Inc. Investor Presentation November 2018 Forward Looking Statements and Non-GAAP Financial Information Forward Looking Statements: This presentation includes "forward-looking
AG Mortgage Investment Trust, Inc. Investor Presentation NYSE: MITT NYSE: MITT
 AG Mortgage Investment Trust, Inc. Investor Presentation Forward Looking Statements This presentation includes "forward-looking statements" within the meaning of the safe harbor provisions of the United
AG Mortgage Investment Trust, Inc. Investor Presentation
 AG Mortgage Investment Trust, Inc. Investor Presentation August 2018 Forward Looking Statements and Non-GAAP Financial Information Forward Looking Statements: This presentation includes "forward-looking
Second Quarter 2018 Earnings Call AUGUST 8, 2018
 Second Quarter 2018 Earnings Call AUGUST 8, 2018 Safe Harbor Statement FORWARD-LOOKING STATEMENTS This presentation includes forward-looking statements within the meaning of the safe harbor provisions
First Quarter 2018 Financial Summary. May 2, 2018
 First Quarter 2018 Financial Summary May 2, 2018 Safe Harbor Notice This presentation, other written or oral communications, and our public documents to which we refer contain or incorporate by reference
First Quarter 2017 Earnings Call MAY 4, 2017
 First Quarter 2017 Earnings Call MAY 4, 2017 Safe Harbor Statement FORWARD-LOOKING STATEMENTS This presentation includes forward-looking statements within the meaning of the safe harbor provisions of the
Fourth Quarter 2018 Earnings Call FEBRUARY 7, 2019
 Fourth Quarter 2018 Earnings Call FEBRUARY 7, 2019 Safe Harbor Statement FORWARD-LOOKING STATEMENTS This presentation includes forward-looking statements within the meaning of the safe harbor provisions
Second Quarter 2017 Financial Summary. August 2, 2017
 Second Quarter 2017 Financial Summary August 2, 2017 Safe Harbor Notice This presentation, other written or oral communications, and our public documents to which we refer contain or incorporate by reference
1Q 2015 Stockholder Supplement
 1Q 2015 Stockholder Supplement May 6, 2015 Safe Harbor Notice This news release and our public documents to which we refer contain or incorporate by reference certain forward-looking statements which are
Third Quarter 2018 Financial Summary. October 31, 2018
 Third Quarter 2018 Financial Summary October 31, 2018 Safe Harbor Notice This presentation, other written or oral communications, and our public documents to which we refer contain or incorporate by reference
Second Quarter 2018 Investor Presentation
 Second Quarter 2018 Investor Presentation 1 Safe Harbor Statement FORWARD-LOOKING STATEMENTS This presentation includes forward-looking statements within the meaning of the safe harbor provisions of the
Third Quarter 2017 Financial Summary. November 1, 2017
 Third Quarter 2017 Financial Summary November 1, 2017 Safe Harbor Notice This presentation, other written or oral communications, and our public documents to which we refer contain or incorporate by reference
2Q 2014 Stockholder Supplement. August 6, 2014
 2Q 2014 Stockholder Supplement August 6, 2014 Safe Harbor Notice This news release and our public documents to which we refer contain or incorporate by reference certain forward-looking statements which
4Q 2013 Stockholder Supplement. February 25, 2014
 4Q 2013 Stockholder Supplement February 25, 2014 Safe Harbor Notice This presentation, other written or oral communications and our public documents to which we refer contain or incorporate by reference
KBW Mortgage Finance Conference. June 1, 2016
 KBW Mortgage Finance Conference June 1, 2016 Safe Harbor Statement F O R W A R D - L O O K I N G S T A T E M ENTS This presentation includes forward-looking statements within the meaning of the safe harbor
Invesco Mortgage Capital Inc Fourth Quarter Earnings Call February 22, 2017
 Invesco Mortgage Capital Inc. 2016 Fourth Quarter Earnings Call February 22, 2017 Richard King President & Chief Executive Officer John Anzalone Chief Investment Officer Rob Kuster Chief Operating Officer
First Quarter 2016 Supplemental Information
 First Quarter 2016 Supplemental Information May 4, 2016 Safe Harbor Notice This presentation, other written or oral communications and our public documents to which we refer contain or incorporate by reference
Investor Presentation. Third Quarter 2018
 Investor Presentation Third Quarter 2018 Information Related to Forward-Looking Statements Statements concerning interest rates, portfolio allocation, financing costs, portfolio hedging, prepayments, dividends,
3Q 2013 Stockholder Supplement. November 6, 2013
 3Q 2013 Stockholder Supplement November 6, 2013 Safe Harbor Notice This presentation, other written or oral communications and our public documents to which we refer contain or incorporate by reference
First Quarter 2018 Investor Presentation
 First Quarter 2018 Investor Presentation May 9, 2018 Legal Disclaimer FORWARD-LOOKING STATEMENTS. Certain statements in this presentation may constitute forward-looking statements within the meaning of
Fourth Quarter 2017 Investor Presentation
 Fourth Quarter 2017 Investor Presentation March 16, 2018 Legal Disclaimer FORWARD-LOOKING STATEMENTS. Certain statements in this presentation may constitute forward-looking statements within the meaning
Third Quarter 2018 Investor Presentation
 Third Quarter 2018 Investor Presentation November 7, 2018 Legal Disclaimer FORWARD-LOOKING STATEMENTS. Certain statements in this presentation may constitute forward-looking statements within the meaning
2Q 2013 Stockholder Supplement. August 7, 2013
 2Q 2013 Stockholder Supplement August 7, 2013 Safe Harbor Notice This presentation, other written or oral communications and our public documents to which we refer contain or incorporate by reference certain
Two Harbors Investment Corp. JMP Securities Financial Services and Real Estate Conference Investor Presentation
 Two Harbors Investment Corp. JMP Securities Financial Services and Real Estate Conference Investor Presentation Safe Harbor Statement Forward-Looking Statements This presentation includes forward-looking
New York Mortgage Trust Reports Fourth Quarter 2017 Results
 February 20, 2018 New York Mortgage Trust Reports Fourth Quarter Results NEW YORK, Feb. 20, 2018 (GLOBE NEWSWIRE) -- New York Mortgage Trust, Inc. (Nasdaq:NYMT) ("NYMT," the "Company," "we," "our" or "us")
Second Quarter 2018 Earnings Conference Call August 7, 2018
 Second Quarter 2018 Earnings Conference Call August 7, 2018 Important Notice Forward-Looking Statements This presentation contains forward-looking statements within the meaning of the safe harbor provisions
Q Supplemental Materials. July 27, 2018
 8 Q2 2018 Supplemental Materials July 27, 2018 Disclaimers Forward-Looking Information This presentation contains forward-looking statements and information. Statements that are not historical facts, including
Two Harbors Investment Corp. Reports First Quarter 2011 Financial Results
 Two Harbors Investment Corp. Reports First Quarter 2011 Financial Results NEW YORK, May 4, 2011 - Two Harbors Investment Corp. (NYSE: TWO; NYSE Amex: TWO.WS), a real estate investment trust that invests
Third Quarter 2018 Earnings Presentation. October 31, 2018
 Third Quarter 2018 Earnings Presentation October 31, 2018 Safe Harbor Statement NOTE: This presentation contains certain statements that are not historical facts and that constitute forward-looking statements
New York Mortgage Trust Reports First Quarter 2018 Results
 New York Mortgage Trust Reports First Quarter 2018 Results May 3, 2018 NEW YORK, May 03, 2018 (GLOBE NEWSWIRE) -- New York Mortgage Trust, Inc. (Nasdaq:NYMT) ( NYMT, the Company, we, our or us ) today
Investor Presentation Third Quarter 2018 ABCDE
 Investor Presentation Third Quarter 2018 Safe Harbor Statement - Private Securities Litigation Reform Act of 1995 Statement Concerning Forward-looking Statements This document contains forward-looking
ANNALY CAPITAL MANAGEMENT, INC. REPORTS 2nd QUARTER 2017 RESULTS
 ANNALY CAPITAL MANAGEMENT, INC. REPORTS 2nd QUARTER 2017 RESULTS NEW YORK (BUSINESS WIRE) August 2, 2017 -- Annaly Capital Management, Inc. (NYSE: NLY) (the Company or Annaly ) today announced its financial
Investor Presentation. Information as of December 31, 2017
 Investor Presentation Information as of December 31, 2017 Safe Harbor Statement - Private Securities Litigation Reform Act of 1995 Statement Concerning Forward-looking Statements This document contains
Investor Presentation. May 13, 2013
 Investor Presentation May 13, 2013 Information Related to Forward-Looking Statements This presentation contains forward-looking statements within the meaning of the Private Securities Litigation Reform
Investor Presentation. Information as of March 31, 2017
 Investor Presentation Information as of March 31, 2017 Safe Harbor Statement - Private Securities Litigation Reform Act of 1995 Statement Concerning Forward-looking Statements This document contains forward-looking
Third Quarter 2017 Earnings Conference Call November 7, 2017
 Third Quarter 2017 Earnings Conference Call November 7, 2017 Important Notice Forward-Looking Statements This presentation contains forward-looking statements within the meaning of the safe harbor provisions
Q Shareholder Presentation
 Q2 2008 Shareholder Presentation July 30, 2008 2008 American Capital Agency Corp. All Rights Reserved. Nasdaq: AGNC Safe Harbor Statement Safe Harbor Statement Under the Private Securities Litigation Reform
Bimini Capital Management Announces Fourth Quarter 2018 Results
 Bimini Capital Management Announces Fourth Quarter 2018 Results March 19, 2019 VERO BEACH, Fla., March 19, 2019 (GLOBE NEWSWIRE) -- Bimini Capital Management, Inc. (OTCBB:BMNM), ( Bimini Capital, Bimini,
Investor Presentation. Information as of March 31, 2018
 Investor Presentation Information as of March 31, 2018 Safe Harbor Statement - Private Securities Litigation Reform Act of 1995 Statement Concerning Forward-looking Statements This document contains forward-looking
Investor Presentation. February 11, 2014
 Investor Presentation February 11, 2014 Information Related to Forward-Looking Statements This presentation contains forward-looking statements within the meaning of the Private Securities Litigation Reform
Two Harbors Investment Corp.
 Two Harbors Investment Corp. Webinar Series October 2013 Fundamental Concepts in Hedging Welcoming Remarks William Roth Chief Investment Officer July Hugen Director of Investor Relations 2 Safe Harbor
INVESTOR PRESENTATION
 INVESTOR PRESENTATION NYSE: CIM 2nd Quarter 2018 DISCLAIMER This presentation includes forward-looking statements within the meaning of the safe harbor provisions of the United States Private Securities
Redwood Trust, Inc. JMP Securities Financial Services and Real Estate Conference September 27, 2016
 Redwood Trust, Inc. JMP Securities Financial Services and Real Estate Conference September 27, 2016 Cautionary Statements This presentation may contain forward-looking statements within the safe harbor
Q Supplemental Materials. April 27, 2017
 Q1 2017 Supplemental Materials April 27, 2017 Disclaimers FORWARD-LOOKING INFORMATION This presentation contains forward-looking statements and information. Statements that are not historical facts, including
UNITED STATES SECURITIES AND EXCHANGE COMMISSION Washington, D.C FORM 10-Q
 UNITED STATES SECURITIES AND EXCHANGE COMMISSION Washington, D.C. 20549 FORM 10-Q ý QUARTERLY REPORT PURSUANT TO SECTION 13 OR 15(d) OF THE SECURITIES EXCHANGE ACT OF 1934. For the quarterly period ended
Ellington Financial LLC (NYSE: EFC) Fourth Quarter 2016 Earnings Conference Call February 14, 2017
 Fourth Quarter 2016 Earnings Conference Call February 14, 2017") Ellington Financial LLC (NYSE: EFC) Fourth Quarter 2016 Earnings Conference Call February 14, 2017 Important Notice Forward-Looking Statements This presentation contains forward-looking statements within
Ellington Financial LLC (NYSE: EFC) Fourth Quarter 2016 Earnings Conference Call February 14, 2017 Important Notice Forward-Looking Statements This presentation contains forward-looking statements within
KeyCorp Beth E. Mooney Don Kimble
 KeyCorp Fourth Quarter 2017 Earnings Review January 18, 2018 Beth E. Mooney Chairman and Chief Executive Officer Don Kimble Chief Financial Officer FORWARD-LOOKING STATEMENTS AND ADDITIONAL INFORMATION
Credit Suisse Financial Services Forum. Februar y 9, 2016
 Credit Suisse Financial Services Forum Februar y 9, 2016 Safe Harbor Statement F O R W A R D - L O O K I N G S T A T E M EN T S This presentation includes forward-looking statements within the meaning
Angel Oak Capital Advisors, LLC
 Angel Oak Capital Advisors, LLC Angel Oak Multi-Strategy Income Fund Quarterly Review March 31, 2018 Quarter in Review Risk assets were weaker in the first quarter driven primarily by rising rates, expectations
KKR Real Estate Finance Trust Inc.
 KKR Real Estate Finance Trust Inc. 1 st Quarter 2018 Supplemental Information May 9, 2018 Legal Disclosures This presentation has been prepared for KKR Real Estate Finance Trust Inc. (NYSE: KREF) for the
KeyCorp. Third Quarter 2017 Earnings Review. Don Kimble Chief Financial Officer. Beth E. Mooney Chairman and Chief Executive Officer.
 KeyCorp Third Quarter 2017 Earnings Review October 19, 2017 Beth E. Mooney Chairman and Chief Executive Officer Don Kimble Chief Financial Officer FORWARD-LOOKING STATEMENTS AND ADDITIONAL INFORMATION
Third Quarter 2013 Presentation
 Third Quarter 2013 Presentation 3 rd Annual Credit Suisse Mor tgage REIT & Ser vicer Conference Safe Harbor Statement FORWARD-LOOKING STATEMENTS This presentation includes forward-looking statements within
Investment Materials. February 9, Genworth Financial, Inc. All rights reserved.
 Investment Materials February 9, 2009 2008 Genworth Financial, Inc. All rights reserved. Investment Portfolio Position $67.9B Investment Grade Fixed Maturity 44% High Quality Portfolio: 95% Of Fixed Maturities
Fourth quarter 2008 results. January 22, 2009
 Fourth quarter 2008 results January 22, 2009 Forward looking statements Please note that the following materials containing information regarding Capital One s financial performance speak only as of the
APOLLO COMMERCIAL REAL ESTATE FINANCE, INC. REPORTS THIRD QUARTER 2018 FINANCIAL RESULTS
 CONTACT: Hilary Ginsberg (212) 822-0767 APOLLO COMMERCIAL REAL ESTATE FINANCE, INC. REPORTS THIRD QUARTER 2018 FINANCIAL RESULTS New York, NY, October 24, 2018 - Apollo Commercial Real Estate Finance,
Contact: Emily Riley phone: ,
 Contact: Emily Riley phone: 215.231.1035, email: emily.riley@radian.biz Radian Announces Second Quarter 2015 Financial Results -- Reports net income of $50 million or $0.22 per diluted share -- Net income
Third Quarter 2018 Investor Presentation. October 31, 2018
 Third Quarter 2018 Investor Presentation October 31, 2018 Safe Harbor Notice Forward-Looking Statements This presentation, other written or oral communications, and our public documents to which we refer
Orchid Island Capital Announces First Quarter 2018 Results
 Orchid Island Capital Announces First Quarter 2018 Results April 26, 2018 VERO BEACH, Fla., April 26, 2018 (GLOBE NEWSWIRE) -- Orchid Island Capital, Inc. (NYSE:ORC) ("Orchid or the "Company"), a real
Supplemental Financial Report Second Quarter August 7, 2018
 Supplemental Financial Report Second Quarter 2018 August 7, 2018 1 CAUTIONARY STATEMENT REGARDING FORWARD-LOOKING STATEMENTS This presentation may contain forward-looking statements within the meaning
ChimeraARCover:ChimeraARCover 3/24/08 9:05 PM Page C Annual Report
 2007 Annual Report Letter from the CEO and President Dear Fellow Shareholders: It gives me great pleasure to write my first annual letter to the shareholders of Chimera Investment Corporation. Chimera
KKR Real Estate Finance Trust Inc.
 KKR Real Estate Finance Trust Inc. 4 th Quarter 2018 Supplemental Information February 20, 2019 NOTE: The accompanying presentation updates the presentation previously issued by the company on February
Starwood Waypoint Residential Trust ( SWAY )
") Fourth Quarter 2014 Supplemental Operating & Financial Data Starwood Waypoint Residential Trust ( SWAY ) acquires, renovates, leases, maintains and manages single family homes. We also invest in non-performing
Fourth Quarter 2014 Supplemental Operating & Financial Data Starwood Waypoint Residential Trust ( SWAY ) acquires, renovates, leases, maintains and manages single family homes. We also invest in non-performing
UNITED STATES SECURITIES AND EXCHANGE COMMISSION Washington, DC FORM 8-K
 UNITED STATES SECURITIES AND EXCHANGE COMMISSION Washington, DC 20549 FORM 8-K CURRENT REPORT PURSUANT TO SECTION 13 OR 15(d) OF THE SECURITIES EXCHANGE ACT OF 1934 Date of Report (Date of earliest event
Colony NorthStar Credit Real Estate, Inc. Supplemental Financial Report First Quarter 2018 May 8, 2018
 Colony NorthStar Credit Real Estate, Inc. Supplemental Financial Report First Quarter 2018 May 8, 2018 Cautionary Statement Regarding Forward-Looking Statements This presentation may contain forward-looking
CHIMERA INVESTMENT CORPORATION 520 Madison Avenue New York, New York CHIMERA INVESTMENT CORPORATION RELEASES 1st QUARTER 2016 EARNINGS
 PRESS RELEASE NYSE: CIM CHIMERA INVESTMENT CORPORATION 520 Madison Avenue New York, New York 10022 Investor Relations 866-315-9930 www.chimerareit.com FOR IMMEDIATE RELEASE CHIMERA INVESTMENT CORPORATION
News Release For Immediate Release // February 18, 2016
 News Release For Immediate Release // Freddie Mac Reports Net Income of $6.4 Billion for Full-Year 2015; Comprehensive Income of $5.8 Billion Company Returns an Additional $5.5 Billion to Taxpayers in
Supplemental Financial Information Q1 2018
 A P O L L O C O M M E R C I A L R E A L E S T A T E F I N A N C E, I N C. Supplemental Financial Information Q1 2018 May 2, 2018 Information is as of March 31, 2018, except as otherwise noted. It should
FINANCIAL SUPPLEMENT NYSE: CIM. 3rd Quarter 2018
 FINANCIAL SUPPLEMENT NYSE: CIM 3rd Quarter 2018 DISCLAIMER This presentation includes forward-looking statements within the meaning of the safe harbor provisions of the United States Private Securities
newstarfin.com Q Overview Focused on Middle Market Lending in the U.S.
 newstarfin.com Q2 2017 Overview Focused on Middle Market Lending in the U.S. August 2, 2017 Forward Looking Statements This presentation contains forward-looking statements within the meaning of the Private
Semper MBS Total Return Fund. Semper Short Duration Fund. Prospectus March 30, 2018
 Semper MBS Total Return Fund Class A Institutional Class Investor Class SEMOX SEMMX SEMPX Semper Short Duration Fund Institutional Class Investor Class SEMIX SEMRX (Each a Fund, together the Funds ) Each
Keefe, Bruyette & Woods Insurance Conference. September 7, 2005
 Keefe, Bruyette & Woods Insurance Conference September 7, 2005 What We Will Cover Radian: A legacy of innovation and success Facing new challenges and opportunities Focusing on creating value Well positioned
Fourth Quarter 2014 Financial Results Supplement
 Fourth Quarter 20 Financial Results Supplement February 19, 2015 Table of contents Financial Results Segment Business Information 2 - Annual Financial Results 12 - Single-Family New Funding Volume 3 -
Huntington Bancshares Incorporated
 UNITED STATES SECURITIES AND EXCHANGE COMMISSION Washington, D.C. 20549 FORM 10-Q QUARTERLY REPORT PURSUANT TO SECTION 13 OR 15(d) OF THE SECURITIES EXCHANGE ACT OF 1934 QUARTERLY PERIOD ENDED June 30,
Supplemental Financial Report Fourth Quarter February 28, 2019
 Supplemental Financial Report Fourth Quarter 2018 February 28, 2019 1 CAUTIONARY STATEMENT REGARDING FORWARD-LOOKING STATEMENTS This presentation may contain forward-looking statements within the meaning
News Release For Immediate Release // May 03, 2016
 News Release For Immediate Release // May 03, 2016 Freddie Mac Reports First Quarter 2016 Financial Results $354 Million Net Loss and $200 Million Comprehensive Loss; No Draw Needed from U.S. Treasury;
Strategic Mortgage Income Fund 3Q 2015 Presentation
 Strategic Mortgage Income Fund 3Q 2015 Presentation October 22 nd, 2015 Nothing presented herein is intended to constitute investment advice and no investment decision should be made based on any information
Bank of America Second Quarter 2009 Results
 Bank of America Second Quarter 2009 Results Ken Lewis CEO and President Joe Price Chief Financial Officer July 17, 2009 Forward Looking Statements Bank of America and its management may make certain statements
LINCOLN NATIONAL CORPORATION (Exact name of registrant as specified in its charter)
") UNITED STATES SECURITIES AND EXCHANGE COMMISSION WASHINGTON, D.C. 20549 FORM 10-Q (Mark One) Quarterly Report Pursuant to Section 13 or 15(d) of the Securities Exchange Act of 1934 For the quarterly period
UNITED STATES SECURITIES AND EXCHANGE COMMISSION WASHINGTON, D.C. 20549 FORM 10-Q (Mark One) Quarterly Report Pursuant to Section 13 or 15(d) of the Securities Exchange Act of 1934 For the quarterly period
Q Shareholder Presentation March 2, American Capital. All Rights Reserved. Nasdaq: ACAS
 Q4 2008 Shareholder Presentation March 2, 2009 2004 American Capital. All Rights Reserved. Nasdaq: ACAS Safe Harbor Statement Safe Harbor Statement Under the Private Securities Litigation Reform Act of
Corporate Capital Trust, Inc. Quarterly Earnings Presentation. Quarter Ended March 31, 2018
 Corporate Capital Trust, Inc. Quarterly Earnings Presentation Quarter Ended March 31, 2018 CCT Overview CCT The Basics CCT is a business development company focused on making originated, senior secured
Net (loss) income per diluted share $(11.69) Book value per share Adjusted book value per share
 income per diluted share $(11.69) Book value per share Adjusted book value per share") Share price $5.75 Market capitalization $1,649.3 million Net (loss) income $(1,660.3) million Net (loss) income per diluted share $(11.69) Book value per share $4.52 Adjusted book value per share $15.83
Share price $5.75 Market capitalization $1,649.3 million Net (loss) income $(1,660.3) million Net (loss) income per diluted share $(11.69) Book value per share $4.52 Adjusted book value per share $15.83
Subprime Bond Case Study Two Harbors Investment Corp. August 6, 2014
 Two Harbors Investment Corp. Two Harbors Investment Corp. is proud to present:. The company believes periodic webinars will provide an opportunity to share more in-depth insights on various topics which
Corporate Capital Trust, Inc. Quarterly Earnings Presentation. Quarter Ended December 31, 2017
 Corporate Capital Trust, Inc. Quarterly Earnings Presentation Quarter Ended December 31, 2017 CCT Overview CCT The Basics CCT is a business development company focused on making originated, senior secured
Two Harbors Investment Corp. Investor Call
 Two Harbors Investment Corp. Investor Call April 26, 2018 Safe Harbor Statement FORWARD-LOOKING STATEMENTS This presentation includes forward-looking statements within the meaning of the safe harbor provisions
FSA HOLDINGS FIRST QUARTER 2008 RESULTS STRONG FIRST QUARTER PRODUCTION DRIVEN BY U.S. MUNICIPAL ORIGINATIONS
 FOR IMMEDIATE RELEASE FSA HOLDINGS FIRST QUARTER 2008 RESULTS STRONG FIRST QUARTER PRODUCTION DRIVEN BY U.S. MUNICIPAL ORIGINATIONS FIRST-QUARTER NET LOSS OF $422 MILLION REFLECTS UNREALIZED NEGATIVE FAIR-VALUE
EARNINGS RELEASE FINANCIAL SUPPLEMENT SECOND QUARTER 2015
 EARNINGS RELEASE FINANCIAL SUPPLEMENT SECOND QUARTER 2015 TABLE OF CONTENTS Page(s) Consolidated Results Consolidated Financial Highlights 2 3 Consolidated Statements of Income 4 Consolidated Balance Sheets
FSA HOLDINGS THIRD QUARTER 2007 RESULTS FSA HAS RECORD QUARTERLY ORIGINATIONS
 FSA HOLDINGS THIRD QUARTER 2007 RESULTS FSA HAS RECORD QUARTERLY ORIGINATIONS UNREALIZED MARK-TO-MARKET LOSSES REDUCE NET INCOME AND EQUITY BUT HAVE NO MATERIAL ECONOMIC EFFECT NET INCOME (LOSS) $(121.8)
Investor Presentation
 A P O L L O C O M M E R C I A L R E A L E S T A T E F I N A N C E, I N C. Investor Presentation May 2018 Information is as of March 31, 2018, except as otherwise noted. It should not be assumed that investments
Invesco V.I. Government Securities Fund
 Quarterly Schedule of Portfolio Holdings March 31, 2018 invesco.com/us VIGOV-QTR-1 05/18 Invesco Advisers, Inc. Schedule of Investments March 31, 2018 (Unaudited) Principal Amount Value U.S. Government
Navient Investor Roadshow. April 2014
 Navient Investor Roadshow April 2014 Forward-Looking Statements; Non-GAAP Financial Measures The following information is current as of April 17, 2014 (unless otherwise noted) and should be read in connection
Starwood Property Trust Reports Results for the Quarter Ended June 30, 2016
 For Immediate Release Starwood Property Trust Reports Results for the Quarter Ended June 30, 2016 Quarterly GAAP Earnings of $0.47 and Core Earnings of $0.50 per Diluted Common Share Deploys $1.6 Billion
Fannie Mae K Investor Summary. August 16, 2007
 Fannie Mae 2006 10-K Investor Summary August 16, 2007 These materials present tables and other information about Fannie Mae, including information contained in Fannie Mae s Annual Report on Form 10-K for
UNITED STATES SECURITIES AND EXCHANGE COMMISSION Washington, DC FORM 8-K
 UNITED STATES SECURITIES AND EXCHANGE COMMISSION Washington, DC 20549 FORM 8-K CURRENT REPORT PURSUANT TO SECTION 13 OR 15(d) OF THE SECURITIES EXCHANGE ACT OF 1934 Date of Report (Date of earliest event
UNITED STATES SECURITIES AND EXCHANGE COMMISSION WASHINGTON, D.C FORM 10-Q
 (Mark One) UNITED STATES SECURITIES AND EXCHANGE COMMISSION WASHINGTON, D.C. 20549 FORM 10-Q QUARTERLY REPORT PURSUANT TO SECTION 13 OR 15(d) OF THE SECURITIES EXCHANGE ACT OF 1934 For the quarterly period
Supplemental Financial Information Package Q November 1, 2017
 Supplemental Financial Information Package Q3 2017 November 1, 2017 Information is as of September 30, 2017, except as otherwise noted. It should not be assumed that investments made in the future will
Supplemental Financial Information Package Q February 14, 2018
 Supplemental Financial Information Package Q4 2017 February 14, 2018 Information is as of December 31, 2017, except as otherwise noted. It should not be assumed that investments made in the future will
SECURITIES AND EXCHANGE COMMISSION WASHINGTON, D.C FORM 10-K
 SECURITIES AND EXCHANGE COMMISSION WASHINGTON, D.C. 20549 x o (MARK ONE) FORM 10-K ANNUAL REPORT PURSUANT TO SECTION 13 OR 15 (d) OF THE SECURITIES EXCHANGE ACT OF 1934 For the Fiscal Year Ended: December
Bank of America Fourth Quarter 2008 Results
 Bank of America Fourth Quarter 2008 Results Ken Lewis Chairman, CEO and President Joe Price Chief Financial Officer January 16, 2009 Forward Looking Statements Bank of America may make forward-looking