AG Mortgage Investment Trust, Inc. Investor Presentation
|
|
|
- Aron Doyle
- 5 years ago
- Views:
Transcription

1 AG Mortgage Investment Trust, Inc. Investor Presentation November 2018
2 Forward Looking Statements and Non-GAAP Financial Information Forward Looking Statements: This presentation includes "forward-looking statements" within the meaning of the safe harbor provisions of the United States Private Securities Litigation Reform Act of 1995 related to dividends, book value, our investments and our investment and portfolio strategy, investment returns, return on equity, liquidity and financing, taxes, our assets, our interest rate sensitivity, and our views on certain macroeconomic trends, among others. Forward-looking statements are based on estimates, projections, beliefs and assumptions of management of the Company at the time of such statements and are not guarantees of future performance. Forward-looking statements involve risks and uncertainties in predicting future results and conditions. Actual results could differ materially from those projected in these forward-looking statements due to a variety of factors, including, without limitation, changes in interest rates, changes in the yield curve, changes in prepayment rates, the availability and terms of financing, changes in the market value of our assets, general economic conditions, conditions in the market for Agency RMBS, Non-Agency RMBS, ABS and CMBS securities and loans, our ability to integrate newly acquired rental assets into the investment portfolio, our ability to predict and control costs, conditions in the real estate market, and legislative and regulatory changes that could adversely affect the business of the Company. Additional information concerning these and other risk factors are contained in the Company's filings with the Securities and Exchange Commission ("SEC"), including its most recent Annual Report on Form 10-K and subsequent filings. Copies are available free of charge on the SEC's website, All information in this presentation is as of November 7, The Company undertakes no duty to update any forward-looking statements to reflect any change in its expectations or any change in events, conditions or circumstances on which any such statement is based. Non-GAAP Financial Information: In addition to the results presented in accordance with GAAP, this presentation includes certain non-gaap financial results and financial metrics derived therefrom, which are calculated by including or excluding unconsolidated investments in affiliates, TBAs, and U.S. Treasuries, or by allocating non-investment portfolio related items based on their respective characteristics, as described in the footnotes. Our management team believes that this non-gaap financial information, when considered with our GAAP financials, provide supplemental information useful for investors in evaluating our results of operations. This presentation also contains Core Earnings, a non-gaap financial measure. Our presentation of non-gaap financial information may not be comparable to similarly-titled measures of other companies, who may use different calculations. This non-gaap financial information should not be considered a substitute for, or superior to, the financial measures calculated in accordance with GAAP. Our GAAP financial results and the reconciliations from these results should be carefully evaluated. 1

3 Who is Angelo Gordon? A leading privately held alternative investment firm with a focus on Credit and Real Estate strategies 1988 company founded 100% owned by AG founders and employees, and their related parties $32 billion Assets Under Management (a) 7 EUROPE OFFICES London Frankfurt Amsterdam Milan Investment Professionals 20 Staff 12 Over 450 employees (a) Headquartered in New York with offices globally Angelo Gordon and employees have approximately $1 billion of capital in our funds (b) U.S. OFFICES New York Los Angeles San Francisco Chicago Houston Washington, DC Investment Professionals 156 Staff 266 ASIA OFFICES Hong Kong Tokyo Seoul Singapore Investment Professionals 17 Staff 10 (a) As of September 30, 2018 (b) Approximate as of September 30, Includes GP, affiliate and employee related investments and accrued performance allocations. Includes committed, but uncalled capital. 2
4 MITT Builds Upon Angelo Gordon s Expansive Real Estate Platform MITT benefits from Angelo Gordon s real estate, residential mortgage and real estate debt team expertise 5 PMs, 60 investment professionals MITT David Roberts, CEO T.J. Durkin, CIO Brian Sigman, CFO Bottom-up idea selection Broad investment pipeline Fluid, daily interaction supplemented by ongoing investment and risk meetings Residential / Consumer Debt Commercial Real Estate Debt Private Equity Real Estate (U.S./EUR) Portfolio Manager(s) T.J. Durkin Yong Joe Jason Biegel Andrew Solomon Adam Schwartz Team Size Team Avg. Experience 13 years 16 years 11 years AG AUM (a) $3.9 bn $1.3 bn $8.2 bn (a) As of September 30, Figures represent assets across the firm including commingled multi-strategy funds and multi-strategy separate accounts. 3
5 Angelo Gordon Platform Provides MITT a Competitive Advantage in Sourcing Residential and Consumer Debt Opportunities Experienced Residential and Consumer Debt Team Prominent participant in the mortgage credit market as both a buyer and an issuer Angelo Gordon Platform includes Arc Home, a licensed residential mortgage servicer and originator, and Red Creek, a wholly-owned asset management affiliate Integrated mortgage credit team that has expanded to 22 professionals in order to meet the broadening opportunity set As one of the most active managers across the mortgage credit markets, Angelo Gordon has robust insight into market trends, fundamental performance and relative value Angelo Gordon has purchased approximately $63 billion (a) of residential credit and consumer ABS since the MITT IPO As a buyer, we are a top counterparty to sell-side firms resulting in proprietary and offmarket deal flow Angelo Gordon has issued 14 transactions totaling approximately $2.5 billion (a) under its GCAT program since the MITT IPO Angelo Gordon was selected as one of nine PPIP managers by the U.S. Treasury in 2009 Net IRR of 24.8% and Net Multiple of Paid in Capital of 1.69x (b) Arc Home and Red Creek offer additional insight into the U.S. residential mortgage market and the behavior of the U.S. consumer Arc Home gives MITT direct access to a captive, affiliated fully licensed mortgage originator for products such as Mortgage Servicing Rights, Non-QM whole loans and other residential mortgage credit Red Creek actively manages approximately 10,100 modified or distressed residential whole loans (a) that MITT and other Angelo Gordon Funds own, providing real time, on the ground information about local housing markets (a) As of 9/30/18 (b) Source: 4
6 Angelo Gordon Platform Provides MITT a Competitive Advantage in Sourcing Commercial Real Estate Opportunities Experienced Commercial Real Estate Debt team Experienced Private Equity Real Estate team Angelo Gordon s Real Estate groups provide MITT the ability to source Commercial Real Estate lending opportunities The team has purchased approximately $9 billion (a) of CMBS and Commercial Real Estate Debt since the MITT IPO 5 investment professionals with experience across all major segments of the real estate debt market including loan origination, special servicing, trading, CDO structuring, and private equity real estate investing The team has acquired over 160 properties at an aggregate purchase price of approximately $11 billion (b) since the MITT IPO 33 investment professionals Leveraging the resources of the Angelo Gordon platform, MITT acquired a stabilized portfolio of 1,225 Single-Family Rental properties from funds affiliated with Connorex-Lucinda, LLC ( Conrex ). The purchase price was approximately $140 million and the portfolio was financed with approximately $37 million of cash on hand and approximately $103 million of 5-year, fixed rate debt The depth of the Private Equity Real Estate platform allows for sharing of local market information across real estate strategies Real estate is a local business Angelo Gordon network includes 50 joint-venture operating partners with geographic and product type expertise Angelo Gordon s operating partner model offers critical and timely insight into local markets and sub-markets The Commercial Real Estate Debt investment team utilizes this local knowledge when analyzing individual loans in CMBS transactions CRE is an inefficient market and Angelo Gordon s broad relationships provide unique sourcing advantage to MITT (a) As of 9/30/18 (b) As of 6/30/18 5
7 Focus on Driving Strong Long-Term Returns 160% MITT Total Stockholder Return since IPO 140% 129% 120% 100% 80% 74% 60% 40% 20% 0% -20% MITT(a) BBG REIT MTG Index(b) Data as of September 30, a) MITT s total stockholder return is calculated for the period July 6, 2011 through September 30, Total stockholder return is defined as stock price appreciation including reinvestment of dividends. Source: Bloomberg. b) Bloomberg REIT Mortgage Index total stockholder return for the period July 6, 2011 through September 30, The Bloomberg REIT Mortgage Index tracks publicly traded REITs whose principal business consists of originating, servicing or investing in residential mortgage interests. The index uses a modified market capitalization weighted methodology, and components are reviewed quarterly for eligibility. Source: Bloomberg. 6
8 MITT Delivers Attractive Returns with Lower Risk MITT has the ability to opportunistically allocate capital to drive long term stockholder value The Angelo Gordon platform has enabled MITT to maintain lower leverage, higher asset yield, and higher or comparable dividend yield versus the peer group Leverage 13 Asset Yield 2,4 5.2x 5.4x 5.3x 5.5x 4.2x 4.0x 3.7x 3.2x 4.4x 5.9x YTD MITT Peer Average 6.0% 5.0% 4.0% 3.0% 2.0% 1.0% 0.0% Dividend Yield % 4.7% 4.9% 4.8% 3.6% 3.6% 3.5% 3.6% 5.1% 3.9% YTD MITT Peer Average MITT s diversified business model takes advantage of the evolving mortgage credit landscape 15.0% 10.0% 5.0% 0.0% 14.3% 13.2% 13.0% 12.3% 13.0% 11.8% 10.4% 11.4% 10.2% 10.8% YTD MITT Peer Average Note: Peers include MFA, IVR, WMC, DX, TWO, and NLY. MITT and peer financial data for Leverage and Asset Yield is based on available financial information in the company earnings presentation or as filed with the SEC and represents the average for all reportable quarters per respective fiscal year through September 30, Peer dividend data based on peer company press releases and Bloomberg data. 7
9 Quarterly Performance and Highlights 8
 Leverage Yield 4 Ratio (b) Agency RMBS (c) $2,163.6 $2,136.8 58.4% $285.4 40.1% 3.9% 2.3% 1.6% 6.7x Residential Investments (c) 904.2 962.2 26.3% 251.3 35.3% 6.7% 3.6% 3.1% 3.0x Commercial Investments (c) 368.")

10 Q Investment Portfolio Composition 1,2 Amortized Cost (mm) Net Carrying Value (mm) Percent of Net Carrying Value Allocated Equity (mm) 3 Percent of Equity Weighted Average Funding Cost (a) NIM (a) Leverage Yield 4 Ratio (b) Agency RMBS (c) $2,163.6 $2, % $ % 3.9% 2.3% 1.6% 6.7x Residential Investments (c) % % 6.7% 3.6% 3.1% 3.0x Commercial Investments (c) % % 7.9% 3.7% 4.2% 2.3x ABS % % 9.4% 3.6% 5.8% 1.0x Single-Family Rental Properties % % 6.1% 4.8% 1.3% 2.7x Total Investment Portfolio $3,614.1 $3, % $ % 5.2% 2.7% 2.5% 4.3x (a) Funding cost and NIM shown in each investment category line exclude the costs of our interest rate hedges, however these costs are included in the total funding cost and NIM lines. The total funding cost and NIM lines excluding the cost of our interest rate hedges would be 2.8% and 2.4%, respectively. (b) The leverage ratio on Agency RMBS includes any net receivables on TBA. The leverage ratio by type of investment is calculated based on allocated equity. 3 (c) The table above includes fair value of $0.9 million of Agency RMBS, $159.6 million of Residential Investments and $3.1 million of Commercial Investments that are included in the Investments in debt and equity of affiliates line item on our consolidated balance sheet. As of Q3 2018, 58.4% Agency, 37.8% Credit, and 3.8% SFR As of Q3 2018, 40.1% Agency, 54.5% Credit and 5.4% SFR 9
11 Q Performance and Highlights Third quarter 2018: $0.70 of Net Income/(Loss) per diluted common share 5 $0.59 of Core Earnings per diluted common share 5,6 Includes $0.03 positive impact from payoffs of certain prime securities Includes $0.01 retrospective adjustment 3.6% economic return on equity for the quarter, 14.4% annualized 7 $19.16 book value per share 5 as of September 30, 2018, inclusive of our current quarter $0.50 common dividend Book value increased $0.18 or 0.9% from the prior quarter primarily due to: $0.36 or 1.9% due to our Credit Investments CRT and CMBS securities saw broad-based tightening during the quarter, while Legacy RMBS spreads remained at tight levels $(0.26) or (1.4)% due to our investments in Agency RMBS and associated derivative hedges Agency RMBS spreads widened modestly during the quarter due to increased interest rates and market technical $0.09 or 0.5% due to core earnings above the $0.50 dividend Issued approximately 512,000 shares of common stock for net proceeds of $9.5 million through ATM Program 10
12 Q Performance and Highlights 2 (cont d) $3.7 billion investment portfolio as of September 30, 2018 as compared to the $3.6 billion investment portfolio as of June 30, Increase in portfolio size primarily due to the acquisition of the Single-Family Rental portfolio (SFR) and the purchase of commercial real estate loans 2.5% Net Interest Margin ( NIM ) as of September 30, Net Interest Margin declined primarily due to the increase in cost of funds related to a 25 bps increase in the federal funds rate in September and the addition of the SFR portfolio 4.3x At Risk Leverage as of September 30, /30/ /31/2017 3/31/2018 6/30/2018 9/30/2018 Yield on Investment Portfolio 4 4.7% 4.6% 5.0% 5.1% 5.2% Cost of Funds % 2.2% 2.3% 2.4% 2.7% NIM 8 2.6% 2.4% 2.7% 2.7% 2.5% At Risk Leverage 9 4.2x 4.4x 4.6x 4.4x 4.3x 11

13 Q Activity Acquired portfolio of single-family rental properties Purchased two commercial real estate loans Purchased several Non-QM pools alongside other Angelo Gordon funds Sold and received payoffs of prime securities Note: The chart above is based on trade date. 12
14 Single-Family Rental Transaction Overview Background Acquired a stabilized portfolio of 1,225 single-family homes from funds affiliated with Conrex The properties are located in Alabama, Georgia, Indiana, North Carolina, Ohio, South Carolina and Tennessee The aggregate purchase price of the portfolio was approximately $140 million MITT entered into a property management services agreement with Conrex, whereby Conrex continues to provide property management services related to the leasing, management, maintenance and day-to-day operations of the properties Portfolio Benefits We expect targeted levered returns of approximately 10% with upside to increasing rents and continued operating efficiencies The stabilized portfolio provides MITT with strong initial cash flow stream in excess of our financing cost Conrex is incentivized to maximize the portfolio performance as the property manager, as it only receives a performance-based fee if certain hurdles are met Portfolio Statistics as of 9/30/18 Gross Carrying Value (a) $ Accumulated Depreciation and Amortization (a) (0.5) Net Carrying Value (a) $ Total Number of Homes 1,225 Occupancy 89.3% Average Square Footage 1,460 Average Monthly Rental Income per Home $ 1,007 Operating Margin 57.3% (a) $ in millions 13
15 Duration Gap 11 Duration gap was approximately 1.12 years as of September 30, 2018 Duration Years Agency 3.11 Hedges (3.03) Agency Gap Subtotal 0.08 Credit 1.04 Duration Gap 1.12 Duration gap was approximately 1.08 years as of June 30, 2018 Duration Years Agency 2.93 Hedges (2.95) Agency Gap Subtotal (0.02) Credit 1.10 Duration Gap
16 Investment Opportunity Set Agency RMBS Hypothetical Duration Hedged Levered ROE: 8-14% (a)(b) 30/20/15 Year Fixed Rate, Hybrid ARM, Fixed Rate CMO, Agency IO, Inverse IO, Excess MSRs Residential Investments Hypothetical Levered ROE: 8-14% (b) CRT, NPL, RPL, Non-QM, Legacy Commercial Investments Hypothetical Levered ROE: 10-16% (b) Conduit, Single Asset/Single Borrower, Freddie Mac K-series, Commercial Loans ABS Hypothetical Levered ROE: 8-14% (b) Consumer, auto backed debt, credit card, other non-residential ABS Single-Family Rental Properties Hypothetical Levered ROE: 8-12% (b) (a) Hypothetical levered returns on Agency RMBS are presented on a duration hedged basis, net of related costs. (b) ROE values are presented gross of management fee and other corporate expenses. Note: The above-listed investment opportunity set represents a subset of the types of assets that the Company can acquire. The hypothetical Levered Returns on Equity ( ROE ) depicted above are dependent on a variety of inputs and assumptions, which are assumed to be static, and do not reflect the impact of operating expenses. Actual returns could differ materially from those presented based on a number of factors, including changes in interest rates, spreads, prepayments, asset values, funding levels, risk positions, hedging costs, expenses, occupancy, rental rates and other factors. 15
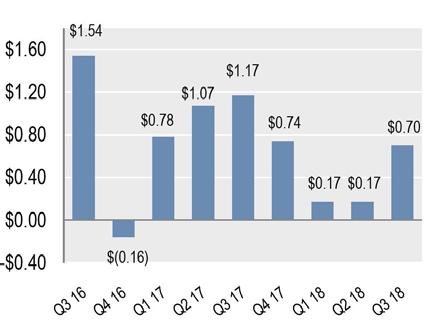
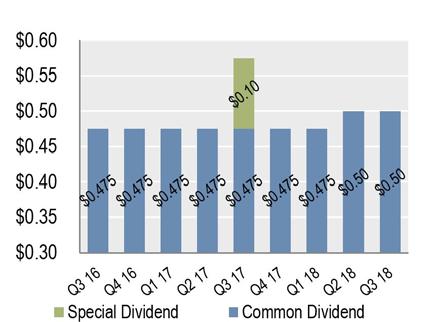
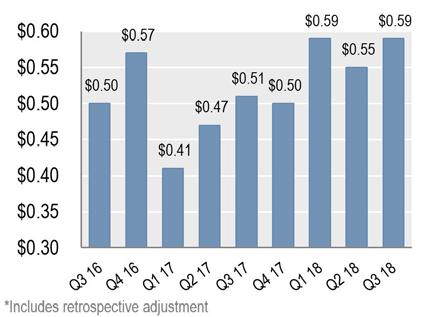
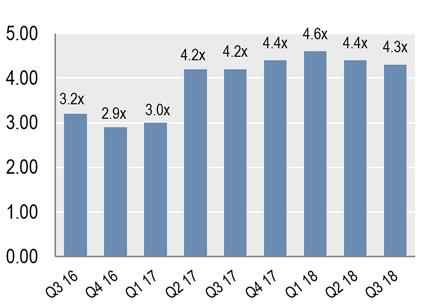
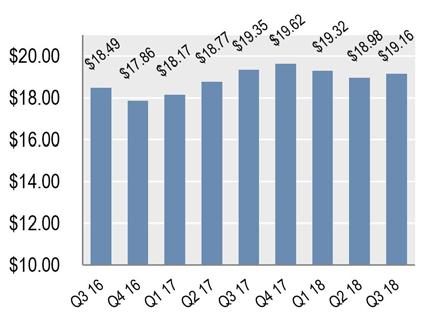

17 Quarter-Over-Quarter Snapshot Net Carrying Value of Investment Portfolio Book Value At Risk Leverage Core Earnings* Dividend Net Income (Loss) 16
18 Footnotes 1. The investment portfolio at period end is calculated by summing the net carrying value of our Agency RMBS, any long positions in TBAs, Residential Investments, Commercial Investments, ABS Investments, and our SFR portfolio, including securities and mortgage loans owned through investments in affiliates, exclusive of AG Arc LLC. Our Agency RMBS, Residential Investments, Commercial Investments, and ABS Investments are held at fair market value and our SFR portfolio is held at historical cost less depreciation and amortization and any adjustments related to impairment. Our Credit Investments refer to our Residential Investments, Commercial Investments, ABS Investments and Single-Family Rental. Refer to footnote 2 for more information on the GAAP accounting for certain items included in our investment portfolio. The percentage of net carrying value includes any net TBA positions and securities and mortgage loans owned through investments in affiliates and is exclusive of AG Arc LLC. Agency RMBS include fair value of $0.9 million of investment in debt and equity of affiliates related to Excess MSRs. Credit Investments include fair value of $162.7 million of investment in debt and equity of affiliates comprised of $97.4 million of Re/Non-Performing Loans, $62.2 million of New Origination Loans, $0.4 mm of Interest Only and $2.7 million of Freddie Mac K-Series. These items, inclusive of our investment in AG Arc LLC and other items, net to $79.7 million which is included in the Investments in debt and equity of affiliates line item on our GAAP Balance Sheet. See footnote 12 for further details on AG Arc LLC. 2. Generally, when we purchase an investment and employ leverage, the investment is included in our assets and the leverage is reflected in our liabilities on our consolidated balance sheet as either Financing arrangements or Securitized debt, at fair value. Throughout this presentation where we disclose our investment portfolio and the related financing, we have presented this information inclusive of (i) securities and mortgage loans owned through our investments in affiliates that are accounted for under GAAP using the equity method and (ii) long positions in TBAs, which are accounted for as derivatives under GAAP. This presentation excludes investments through AG Arc LLC unless otherwise noted. This presentation of our investment portfolio is consistent with how our management evaluates the business, and we believe this presentation, when considered with the GAAP presentation, provides supplemental information useful for investors in evaluating our investment portfolio and financial condition. See footnote 12 for further details on AG Arc LLC. 3. The Company allocates its equity by investment using the net carrying value of its investment portfolio, less any associated leverage, inclusive of any long TBA position (at cost). The Company allocates all noninvestment portfolio related items based on their respective characteristics in order to sum to the Company s stockholders equity per the consolidated balance sheets. The Company s equity allocation method is a non-gaap methodology and may not be comparable to similarly titled measuresor conceptsof other companies, who may use different calculations. 4. The yield on our debt investments represents an effective interest rate, which utilizes all estimates of future cash flows and adjusts for actual prepayment and cash flow activity as of quarter-end. The yield on our SFR portfolio represents annualized net operating income for the quarter. This calculation excludes cash held by the Company and excludes any net TBA position. The calculation of weighted average yield is weighted basedonnetcarrying value. 5. Diluted per share figures are calculated using weighted average outstanding shares in accordance with GAAP. Per share figures are calculated using a denominator of all outstanding common shares including all shares granted to our Manager and our independent directors under our equity incentive plans as of quarter-end. Book value uses stockholders equity less net proceeds of the Company s 8.25% Series A and 8.00% Series B Cumulative Redeemable Preferred Stock as the numerator. 6. Core Earnings are defined as Net Income/(loss) available to common stockholders excluding (i) unrealized and realized gains/(losses) on the sale or termination of securities, if any, on such sale or termination, loans, derivatives and other instruments, (ii) beginning with Q2 2018, any transaction related expenses incurred in connection with the acquisition or disposition of our investments, (iii) beginning with Q3 2018, any depreciation or amortization expense related to our SFR portfolio and, (iv) beginning with Q3 2018, accrued deal related performance fees payable to Arc Home and third party operators to the extent the primary component of the accrual relates to items that are excluded from core earnings, such as unrealized and realized gains/(losses). Items (i) through (iv) above include any amounts related to those items held in affiliated entities. Management considers the transaction related expenses referenced in (ii) above to be similar to realized losses incurred at acquisition or disposition and do not view them as being part of its core operations. Management also acknowledges that while deal related performance fees may be a material operating expense, they have been excluded from core because the primary component of the computation of the expense relates to items (such as gains or losses) that are excluded from core earnings. As defined, Core Earnings include the net interest income and other income earned on our investments on a yield adjusted basis, including TBA dollar roll income or any other investment activity that may earn or pay net interest or its economic equivalent. Core Earnings includes earnings from AG Arc LLC. Earnings from AG Arc LLC were $0.3 million in the third quarter of See footnote 12 for further details on AG Arc LLC. 7. The economic return on equity for the quarter represents the change in book value per share from June 30, 2018 to September 30, 2018, plus the common dividends declared over that period, divided by book value per share as of June 30, The annualized economic return on equity is the quarterly return on equity multiplied by four. 17
19 Footnotes (cont.) 8. Net interest margin is calculated by subtracting the weighted average cost of funds from the weighted average yield for the Company s investment portfolio, which excludes cash held by the Company. Net interest margin also excludes any net TBA position. See footnotes 4 and 10 for further detail. 9. At Risk Leverage is calculated by dividing total financing, including any net TBA position, by our GAAP stockholders equity at quarter-end. Our net TBA position (at cost) was $75.2 million, $166.2 million, $143.7 million, $102.5 million, and $121.6 million for the periods ending September 30, 2018, June 30, 2018, March 31, 2018, December 31, 2017, and September 30, 2017, respectively. Total financing at quarter-end, and when shown, daily weighted average total financing, includes financing arrangements inclusive of financing arrangements through affiliated entities, exclusive of any financing utilized through AG Arc LLC, plus the payable on all unsettled buys less the financing on all unsettled sells, securitized debt, and any net TBA position (at cost). Total financing excludes any financing arrangements and unsettled trades on U.S. Treasuries. 10. The cost of funds during the quarter is calculated by annualizing the sum of our interest expense and net interest component on all derivative instruments and dividing that sum by our daily weighted average total financing for the period. Interest earning/paying derivative instruments may include interest rate swaps and U.S. Treasuries. The cost of funds at quarter-end is calculated as the sum of (i) the weighted average funding costs on total financing outstanding at quarter-end and (ii) the weighted average of the net pay rate on our interest rate swaps, the net receive rate on our Treasury long positions, the net pay rate on our Treasury short positions and the net receivable rate on our IO index derivatives, if any. Both elements of the cost of funds at quarter-end are weighted by the outstanding financing arrangements and securitized debt outstanding at quarter-end, excluding financing arrangements associated with U.S. Treasury positions. The cost of funds excludes any net TBA position. 11. The Company estimates duration based on third-party models. Different models and methodologies can produce different effective duration estimates for the same securities. We allocate the net duration by asset type based on the interest rate sensitivity. Duration includes any net TBA position. Duration does not include our equity interest in AG Arc LLC or our investment in SFR. Duration related to financing agreements is netted within its respective agency and credit line items. 12. The Company invests in Arc Home LLC through AG Arc LLC, one of its indirect subsidiaries. 13. Leverage in the heading of the chart on slide 7 for us refers to our At Risk Leverage. See footnote 9 for a description of our At Risk Leverage. For our peers, Leverage refers to the most comparable disclosed leverage for each peer for each period based on available financial information in the company earnings presentation or as filed with the SEC. 14. Each quarter s dividend yield is calculated by annualizing such quarter s dividend and dividing by that quarter end stock price. Dividend yield represents the average for all reported quarters per respective fiscal year. 18

20
AG Mortgage Investment Trust, Inc. Investor Presentation
 AG Mortgage Investment Trust, Inc. Investor Presentation August 2018 Forward Looking Statements and Non-GAAP Financial Information Forward Looking Statements: This presentation includes "forward-looking
AG Mortgage Investment Trust, Inc. Investor Presentation NYSE: MITT NYSE: MITT
 AG Mortgage Investment Trust, Inc. Investor Presentation Forward Looking Statements This presentation includes "forward-looking statements" within the meaning of the safe harbor provisions of the United
AG Mortgage Investment Trust, Inc. Q Earnings Presentation
 AG Mortgage Investment Trust, Inc. Q3 2018 Earnings Presentation November 8, 2018 Forward Looking Statements and Non-GAAP Financial Information Forward Looking Statements: This presentation includes "forward-looking
AG Mortgage Investment Trust, Inc. Q Earnings Presentation
 AG Mortgage Investment Trust, Inc. Q1 2018 Earnings Presentation May 3, 2018 Forward Looking Statements and Non-GAAP Financial Information Forward Looking Statements: This presentation includes "forward-looking
AG Mortgage Investment Trust, Inc. Q Earnings Presentation. August 7, 2018
 AG Mortgage Investment Trust, Inc. Q2 2018 Earnings Presentation August 7, 2018 Forward Looking Statements and Non-GAAP Financial Information Forward Looking Statements: This presentation includes "forward-looking
Second Quarter 2018 Investor Presentation
 Second Quarter 2018 Investor Presentation 1 Safe Harbor Statement FORWARD-LOOKING STATEMENTS This presentation includes forward-looking statements within the meaning of the safe harbor provisions of the
KBW Mortgage Finance Conference. June 1, 2016
 KBW Mortgage Finance Conference June 1, 2016 Safe Harbor Statement F O R W A R D - L O O K I N G S T A T E M ENTS This presentation includes forward-looking statements within the meaning of the safe harbor
Second Quarter 2018 Earnings Call AUGUST 8, 2018
 Second Quarter 2018 Earnings Call AUGUST 8, 2018 Safe Harbor Statement FORWARD-LOOKING STATEMENTS This presentation includes forward-looking statements within the meaning of the safe harbor provisions
First Quarter 2017 Earnings Call MAY 4, 2017
 First Quarter 2017 Earnings Call MAY 4, 2017 Safe Harbor Statement FORWARD-LOOKING STATEMENTS This presentation includes forward-looking statements within the meaning of the safe harbor provisions of the
Invesco Mortgage Capital Inc Fourth Quarter Earnings Call February 22, 2017
 Invesco Mortgage Capital Inc. 2016 Fourth Quarter Earnings Call February 22, 2017 Richard King President & Chief Executive Officer John Anzalone Chief Investment Officer Rob Kuster Chief Operating Officer
ANNALY CAPITAL MANAGEMENT, INC. REPORTS 2nd QUARTER 2017 RESULTS
 ANNALY CAPITAL MANAGEMENT, INC. REPORTS 2nd QUARTER 2017 RESULTS NEW YORK (BUSINESS WIRE) August 2, 2017 -- Annaly Capital Management, Inc. (NYSE: NLY) (the Company or Annaly ) today announced its financial
First Quarter 2018 Financial Summary. May 2, 2018
 First Quarter 2018 Financial Summary May 2, 2018 Safe Harbor Notice This presentation, other written or oral communications, and our public documents to which we refer contain or incorporate by reference
1Q 2015 Stockholder Supplement
 1Q 2015 Stockholder Supplement May 6, 2015 Safe Harbor Notice This news release and our public documents to which we refer contain or incorporate by reference certain forward-looking statements which are
Third Quarter 2018 Earnings Presentation. October 31, 2018
 Third Quarter 2018 Earnings Presentation October 31, 2018 Safe Harbor Statement NOTE: This presentation contains certain statements that are not historical facts and that constitute forward-looking statements
New York Mortgage Trust Reports Fourth Quarter 2017 Results
 February 20, 2018 New York Mortgage Trust Reports Fourth Quarter Results NEW YORK, Feb. 20, 2018 (GLOBE NEWSWIRE) -- New York Mortgage Trust, Inc. (Nasdaq:NYMT) ("NYMT," the "Company," "we," "our" or "us")
Third Quarter 2018 Financial Summary. October 31, 2018
 Third Quarter 2018 Financial Summary October 31, 2018 Safe Harbor Notice This presentation, other written or oral communications, and our public documents to which we refer contain or incorporate by reference
Q Supplemental Materials. July 27, 2018
 8 Q2 2018 Supplemental Materials July 27, 2018 Disclaimers Forward-Looking Information This presentation contains forward-looking statements and information. Statements that are not historical facts, including
Second Quarter 2017 Financial Summary. August 2, 2017
 Second Quarter 2017 Financial Summary August 2, 2017 Safe Harbor Notice This presentation, other written or oral communications, and our public documents to which we refer contain or incorporate by reference
2Q 2014 Stockholder Supplement. August 6, 2014
 2Q 2014 Stockholder Supplement August 6, 2014 Safe Harbor Notice This news release and our public documents to which we refer contain or incorporate by reference certain forward-looking statements which
Investor Presentation. Third Quarter 2018
 Investor Presentation Third Quarter 2018 Information Related to Forward-Looking Statements Statements concerning interest rates, portfolio allocation, financing costs, portfolio hedging, prepayments, dividends,
Investor Presentation Third Quarter 2018 ABCDE
 Investor Presentation Third Quarter 2018 Safe Harbor Statement - Private Securities Litigation Reform Act of 1995 Statement Concerning Forward-looking Statements This document contains forward-looking
Third Quarter 2017 Financial Summary. November 1, 2017
 Third Quarter 2017 Financial Summary November 1, 2017 Safe Harbor Notice This presentation, other written or oral communications, and our public documents to which we refer contain or incorporate by reference
Redwood Trust, Inc. JMP Securities Financial Services and Real Estate Conference September 27, 2016
 Redwood Trust, Inc. JMP Securities Financial Services and Real Estate Conference September 27, 2016 Cautionary Statements This presentation may contain forward-looking statements within the safe harbor
Investor Presentation. Information as of March 31, 2017
 Investor Presentation Information as of March 31, 2017 Safe Harbor Statement - Private Securities Litigation Reform Act of 1995 Statement Concerning Forward-looking Statements This document contains forward-looking
Fourth Quarter 2018 Earnings Call FEBRUARY 7, 2019
 Fourth Quarter 2018 Earnings Call FEBRUARY 7, 2019 Safe Harbor Statement FORWARD-LOOKING STATEMENTS This presentation includes forward-looking statements within the meaning of the safe harbor provisions
Two Harbors Investment Corp. Investor Call
 Two Harbors Investment Corp. Investor Call April 26, 2018 Safe Harbor Statement FORWARD-LOOKING STATEMENTS This presentation includes forward-looking statements within the meaning of the safe harbor provisions
Investor Presentation. Information as of March 31, 2018
 Investor Presentation Information as of March 31, 2018 Safe Harbor Statement - Private Securities Litigation Reform Act of 1995 Statement Concerning Forward-looking Statements This document contains forward-looking
4Q 2013 Stockholder Supplement. February 25, 2014
 4Q 2013 Stockholder Supplement February 25, 2014 Safe Harbor Notice This presentation, other written or oral communications and our public documents to which we refer contain or incorporate by reference
Third Quarter 2013 Presentation
 Third Quarter 2013 Presentation 3 rd Annual Credit Suisse Mor tgage REIT & Ser vicer Conference Safe Harbor Statement FORWARD-LOOKING STATEMENTS This presentation includes forward-looking statements within
Two Harbors Investment Corp. Reports First Quarter 2011 Financial Results
 Two Harbors Investment Corp. Reports First Quarter 2011 Financial Results NEW YORK, May 4, 2011 - Two Harbors Investment Corp. (NYSE: TWO; NYSE Amex: TWO.WS), a real estate investment trust that invests
First Quarter 2016 Supplemental Information
 First Quarter 2016 Supplemental Information May 4, 2016 Safe Harbor Notice This presentation, other written or oral communications and our public documents to which we refer contain or incorporate by reference
Third Quarter 2017 Earnings Conference Call November 7, 2017
 Third Quarter 2017 Earnings Conference Call November 7, 2017 Important Notice Forward-Looking Statements This presentation contains forward-looking statements within the meaning of the safe harbor provisions
Investor Presentation
 A P O L L O C O M M E R C I A L R E A L E S T A T E F I N A N C E, I N C. Investor Presentation May 2018 Information is as of March 31, 2018, except as otherwise noted. It should not be assumed that investments
Second Quarter 2018 Earnings Conference Call August 7, 2018
 Second Quarter 2018 Earnings Conference Call August 7, 2018 Important Notice Forward-Looking Statements This presentation contains forward-looking statements within the meaning of the safe harbor provisions
3Q 2013 Stockholder Supplement. November 6, 2013
 3Q 2013 Stockholder Supplement November 6, 2013 Safe Harbor Notice This presentation, other written or oral communications and our public documents to which we refer contain or incorporate by reference
AP Alternative Assets, L.P. Annual Unitholder Meeting. December 15, 2015
 AP Alternative Assets, L.P. Annual Unitholder Meeting December 15, 2015 AP Alternative Assets 2014/2015 Annual Unitholder Meeting Chris Weidler Chief Financial Officer of AP Alternative Assets, L.P. Rick
New York Mortgage Trust Reports First Quarter 2018 Results
 New York Mortgage Trust Reports First Quarter 2018 Results May 3, 2018 NEW YORK, May 03, 2018 (GLOBE NEWSWIRE) -- New York Mortgage Trust, Inc. (Nasdaq:NYMT) ( NYMT, the Company, we, our or us ) today
Fourth Quarter 2017 Investor Presentation
 Fourth Quarter 2017 Investor Presentation March 16, 2018 Legal Disclaimer FORWARD-LOOKING STATEMENTS. Certain statements in this presentation may constitute forward-looking statements within the meaning
Two Harbors Investment Corp. JMP Securities Financial Services and Real Estate Conference Investor Presentation
 Two Harbors Investment Corp. JMP Securities Financial Services and Real Estate Conference Investor Presentation Safe Harbor Statement Forward-Looking Statements This presentation includes forward-looking
Third Quarter 2018 Investor Presentation
 Third Quarter 2018 Investor Presentation November 7, 2018 Legal Disclaimer FORWARD-LOOKING STATEMENTS. Certain statements in this presentation may constitute forward-looking statements within the meaning
Keefe, Bruyette & Woods 2017 Mortgage Finance & Asset Management Conference. June 1, 2017
 Keefe, Bruyette & Woods 2017 Mortgage Finance & Asset Management Conference June 1, 2017 Forward Looking Statements This presentation contains forward-looking statements within the meaning of the safe
First Quarter 2018 Investor Presentation
 First Quarter 2018 Investor Presentation May 9, 2018 Legal Disclaimer FORWARD-LOOKING STATEMENTS. Certain statements in this presentation may constitute forward-looking statements within the meaning of
Third Quarter 2018 Investor Presentation. October 31, 2018
 Third Quarter 2018 Investor Presentation October 31, 2018 Safe Harbor Notice Forward-Looking Statements This presentation, other written or oral communications, and our public documents to which we refer
OAKTREE CAPITAL MANAGEMENT, L.P. BAML Future of Financial Services Conference
 OAKTREE CAPITAL MANAGEMENT, L.P. BAML Future of Financial Services Conference November 2017 Forward-Looking Statements & Safe Harbor This presentation contains forward-looking statements within the meaning
Supplemental Financial Report Second Quarter August 7, 2018
 Supplemental Financial Report Second Quarter 2018 August 7, 2018 1 CAUTIONARY STATEMENT REGARDING FORWARD-LOOKING STATEMENTS This presentation may contain forward-looking statements within the meaning
2Q 2013 Stockholder Supplement. August 7, 2013
 2Q 2013 Stockholder Supplement August 7, 2013 Safe Harbor Notice This presentation, other written or oral communications and our public documents to which we refer contain or incorporate by reference certain
Investor Presentation. Information as of December 31, 2017
 Investor Presentation Information as of December 31, 2017 Safe Harbor Statement - Private Securities Litigation Reform Act of 1995 Statement Concerning Forward-looking Statements This document contains
Supplemental Financial Information Three Months Ended March 31, 2016
 Supplemental Financial Information Three Months Ended March 31, 2016 Forward Looking Statement Certain information set forth in this release contains forward-looking statements within the meaning of the
INVESTOR PRESENTATION. March 2018
 INVESTOR PRESENTATION March 2018 Forward Looking Statements This presentation contains certain forward-looking statements, including, without limitation, statements concerning our operations, economic
Colony NorthStar Credit Real Estate, Inc. Supplemental Financial Report First Quarter 2018 May 8, 2018
 Colony NorthStar Credit Real Estate, Inc. Supplemental Financial Report First Quarter 2018 May 8, 2018 Cautionary Statement Regarding Forward-Looking Statements This presentation may contain forward-looking
Supplemental Financial Information Q1 2018
 A P O L L O C O M M E R C I A L R E A L E S T A T E F I N A N C E, I N C. Supplemental Financial Information Q1 2018 May 2, 2018 Information is as of March 31, 2018, except as otherwise noted. It should
Two Harbors Investment Corp.
 Two Harbors Investment Corp. Mini Webinar Series March 2013 Mortgage REIT Primer Welcoming Remarks July Hugen Director of Investor Relations 2 Safe Harbor Statement Forward-Looking Statements This presentation
Investor Presentation
 A P O L L O C O M M E R C I A L R E A L E S T A T E F I N A N C E, I N C. Investor Presentation May 2018 Information is as of March 31, 2018, except as otherwise noted. It should not be assumed that investments
I N V E S TO R P R E S E N TAT I O N M AY
 I N V E S TO R P R E S E N TAT I O N M AY 2 0 1 5 Forward Looking Statements This presentation contains certain forward-looking statements, including without limitation, statements concerning our operations,
Q Shareholder Presentation March 2, American Capital. All Rights Reserved. Nasdaq: ACAS
 Q4 2008 Shareholder Presentation March 2, 2009 2004 American Capital. All Rights Reserved. Nasdaq: ACAS Safe Harbor Statement Safe Harbor Statement Under the Private Securities Litigation Reform Act of
Investor Presentation. May 13, 2013
 Investor Presentation May 13, 2013 Information Related to Forward-Looking Statements This presentation contains forward-looking statements within the meaning of the Private Securities Litigation Reform
newstarfin.com Q Overview Focused on Middle Market Lending in the U.S.
 newstarfin.com Q2 2017 Overview Focused on Middle Market Lending in the U.S. August 2, 2017 Forward Looking Statements This presentation contains forward-looking statements within the meaning of the Private
Supplemental Financial Information Q3 2018
 A P O L L O C O M M E R C I A L R E A L E S T A T E F I N A N C E, I N C. Supplemental Financial Information Q3 2018 October 24, 2018 Information is as of September 30, 2018, except as otherwise noted.
2017 Annual Meeting. May 25, 2017
 2017 Annual Meeting May 25, 2017 Safe Harbor Notice This presentation, other written or oral communications, and our public documents to which we refer contain or incorporate by reference certain forward-looking
Supplemental Financial Report Fourth Quarter February 28, 2019
 Supplemental Financial Report Fourth Quarter 2018 February 28, 2019 1 CAUTIONARY STATEMENT REGARDING FORWARD-LOOKING STATEMENTS This presentation may contain forward-looking statements within the meaning
Supplemental Financial Information Package Q November 1, 2017
 Supplemental Financial Information Package Q3 2017 November 1, 2017 Information is as of September 30, 2017, except as otherwise noted. It should not be assumed that investments made in the future will
Keefe, Bruyette & Woods Insurance Conference. September 7, 2005
 Keefe, Bruyette & Woods Insurance Conference September 7, 2005 What We Will Cover Radian: A legacy of innovation and success Facing new challenges and opportunities Focusing on creating value Well positioned
Ellington Financial LLC (NYSE: EFC) Fourth Quarter 2016 Earnings Conference Call February 14, 2017
 Fourth Quarter 2016 Earnings Conference Call February 14, 2017") Ellington Financial LLC (NYSE: EFC) Fourth Quarter 2016 Earnings Conference Call February 14, 2017 Important Notice Forward-Looking Statements This presentation contains forward-looking statements within
Ellington Financial LLC (NYSE: EFC) Fourth Quarter 2016 Earnings Conference Call February 14, 2017 Important Notice Forward-Looking Statements This presentation contains forward-looking statements within
Strategic Mortgage Income Fund 3Q 2015 Presentation
 Strategic Mortgage Income Fund 3Q 2015 Presentation October 22 nd, 2015 Nothing presented herein is intended to constitute investment advice and no investment decision should be made based on any information
Schedule 5 - Summarized Information for Unconsolidated Real Estate Venture 18
 Table of Contents Page 1 Earnings Release 7 Consolidated Statements of Operations 8 Consolidated Balance Sheets 9 Schedule 1 - Funds From Operations and Core Funds From Operations 11 Schedule 2 - Other
UNITED STATES SECURITIES AND EXCHANGE COMMISSION Washington, D.C FORM 10-Q
 UNITED STATES SECURITIES AND EXCHANGE COMMISSION Washington, D.C. 20549 FORM 10-Q ý QUARTERLY REPORT PURSUANT TO SECTION 13 OR 15(d) OF THE SECURITIES EXCHANGE ACT OF 1934. For the quarterly period ended
Supplemental Financial Information Three Months & Year Ended December 31, 2018
 Supplemental Financial Information Three Months & Year Ended 2018 Forward Looking Statement Certain information set forth in this release contains forward-looking statements within the meaning of the federal
Credit Suisse Financial Services Forum. Tim Sloan Chief Financial Officer
 Credit Suisse Financial Services Forum Tim Sloan Chief Financial Officer February 12, 2014 Wells Fargo vision Wells Fargo Vision We want to satisfy all our customers financial needs and help them succeed
Supplemental Financial Information Q4 2018
 A P O L L O C O M M E R C I A L R E A L E S T A T E F I N A N C E, I N C. Supplemental Financial Information Q4 2018 February 13, 2019 Information is as of December 31, 2018, except as otherwise noted.
Q Shareholder Presentation
 Q2 2008 Shareholder Presentation July 30, 2008 2008 American Capital Agency Corp. All Rights Reserved. Nasdaq: AGNC Safe Harbor Statement Safe Harbor Statement Under the Private Securities Litigation Reform
LINCOLN NATIONAL CORPORATION (Exact name of registrant as specified in its charter)
") UNITED STATES SECURITIES AND EXCHANGE COMMISSION WASHINGTON, D.C. 20549 FORM 10-Q (Mark One) Quarterly Report Pursuant to Section 13 or 15(d) of the Securities Exchange Act of 1934 For the quarterly period
UNITED STATES SECURITIES AND EXCHANGE COMMISSION WASHINGTON, D.C. 20549 FORM 10-Q (Mark One) Quarterly Report Pursuant to Section 13 or 15(d) of the Securities Exchange Act of 1934 For the quarterly period
Supplemental Financial Information Package Q February 14, 2018
 Supplemental Financial Information Package Q4 2017 February 14, 2018 Information is as of December 31, 2017, except as otherwise noted. It should not be assumed that investments made in the future will
2018 Annual Meeting. May 23, 2018
 2018 Annual Meeting May 23, 2018 Safe Harbor Forward-Looking Statements This presentation includes forward-looking statements. These forward-looking statements generally can be identified by phrases such
Fortress Investment Group LLC 2014 Credit Suisse Financial Services Forum February 2014
 Fortress Investment Group LLC 2014 Credit Suisse Financial Services Forum February 2014 All information contained herein is qualified in its entirety by the disclaimer on the next page of this document.
UDR Definitions and Reconciliations
 UDR Definitions and Reconciliations View 34 New York, NY A 2 Acquired Communities: The Company defines Acquired Communities as those communities acquired by the Company, other than development and redevelopment
Starwood Waypoint Residential Trust ( SWAY )
") Fourth Quarter 2014 Supplemental Operating & Financial Data Starwood Waypoint Residential Trust ( SWAY ) acquires, renovates, leases, maintains and manages single family homes. We also invest in non-performing
Fourth Quarter 2014 Supplemental Operating & Financial Data Starwood Waypoint Residential Trust ( SWAY ) acquires, renovates, leases, maintains and manages single family homes. We also invest in non-performing
Supplemental Financial Information Q2 2018
 A P O L L O C O M M E R C I A L R E A L E S T A T E F I N A N C E, I N C. Supplemental Financial Information Q2 2018 July 25, 2018 Information is as of June 30, 2018, except as otherwise noted. It should
View printer-friendly version << Back
 1 of 8 22/04/2014 15:17 Print Page Close Window Press Release View printer-friendly version
APOLLO COMMERCIAL REAL ESTATE FINANCE, INC. REPORTS THIRD QUARTER 2018 FINANCIAL RESULTS
 CONTACT: Hilary Ginsberg (212) 822-0767 APOLLO COMMERCIAL REAL ESTATE FINANCE, INC. REPORTS THIRD QUARTER 2018 FINANCIAL RESULTS New York, NY, October 24, 2018 - Apollo Commercial Real Estate Finance,
OPPENHEIMER HOLDINGS INC. SEPTEMBER 2015
 OPPENHEIMER HOLDINGS INC. SEPTEMBER 2015 Presented by: Robert Lowenthal Senior Managing Director, Chairman of Management Committee Jeffrey Alfano Executive Vice President & Chief Financial Officer SAFE
Granite Point Mortgage Trust Inc. Reports Fourth Quarter 2017 Financial Results and Post-Quarter End Business Update
 Granite Point Mortgage Trust Inc. Reports Fourth Quarter 2017 Financial Results and Post-Quarter End Business Update NEW YORK, February 7, 2018 Granite Point Mortgage Trust Inc. (NYSE: GPMT), a commercial
SLM CORPORATION EARNINGS PRESENTATION THIRD QUARTER October 19, 2017
 SLM CORPORATION EARNINGS PRESENTATION THIRD QUARTER 2017 October 19, 2017 2 Forward-Looking Statements and Disclaimer Cautionary Note Regarding Forward-Looking Statements The following information is current
SLM CORPORATION EARNINGS PRESENTATION THIRD QUARTER October 20, 2016
 SLM CORPORATION EARNINGS PRESENTATION THIRD QUARTER 2016 October 20, 2016 2 Forward-Looking Statements and Disclaimer Cautionary Note Regarding Forward-Looking Statements The following information is current
Starwood Property Trust Reports Results for the Quarter Ended June 30, 2016
 For Immediate Release Starwood Property Trust Reports Results for the Quarter Ended June 30, 2016 Quarterly GAAP Earnings of $0.47 and Core Earnings of $0.50 per Diluted Common Share Deploys $1.6 Billion
Bimini Capital Management Announces Fourth Quarter 2018 Results
 Bimini Capital Management Announces Fourth Quarter 2018 Results March 19, 2019 VERO BEACH, Fla., March 19, 2019 (GLOBE NEWSWIRE) -- Bimini Capital Management, Inc. (OTCBB:BMNM), ( Bimini Capital, Bimini,
Morgan Stanley Credit Suisse J.P. Morgan
 13,900,000 Shares COMMON STOCK Apollo Residential Mortgage, Inc. is a residential real estate finance company that invests in, finances and manages mortgagebacked securities, residential mortgage loans
SLM CORPORATION EARNINGS PRESENTATION SECOND QUARTER July 25, 2018
 SLM CORPORATION EARNINGS PRESENTATION SECOND QUARTER 2018 July 25, 2018 Forward-Looking Statements and Disclaimer 2 Cautionary Note Regarding Forward-Looking Statements The following information is current
Two Harbors Investment Corp.
 Two Harbors Investment Corp. Webinar Series October 2013 Fundamental Concepts in Hedging Welcoming Remarks William Roth Chief Investment Officer July Hugen Director of Investor Relations 2 Safe Harbor
Second Quarter 2018 Earnings Conference Call July 19, 2018
 Second Quarter 2018 Earnings Conference Call July 19, 2018 WBS 2Q18 Earnings Highlights ($ in millions, except EPS data) Significant progress on our key strategic initiatives: 35 consecutive quarters of
Full Year and Fourth Quarter 2018 Earnings Results Presentation. January 16, 2019
 Full Year and Fourth Quarter 2018 Earnings Results Presentation January 16, 2019 Earnings Call Agenda 1 David M. Solomon, Chairman and Chief Executive Officer Strategic priorities Macro perspectives and
EARNINGS PRESENTATION Third Quarter 2018
 EARNINGS PRESENTATION Third Quarter 2018 DISCLAIMER 2 Discussion of Forward-Looking Statements by Newmark Group, Inc. and BGC Partners, Inc. Statements in this document regarding BGC and Newmark that are
NorthStar Realty Europe Announces Fourth Quarter 2015 Results
 NorthStar Realty Europe Announces Fourth Quarter 2015 Results March 22, 2016 NEW YORK, March 22, 2016 /PRNewswire/ -- NorthStar Realty Europe Corp. (NYSE: NRE) ("NorthStar Realty Europe" or "NRE") today
CHIMERA INVESTMENT CORPORATION 520 Madison Avenue New York, New York CHIMERA INVESTMENT CORPORATION RELEASES 1st QUARTER 2016 EARNINGS
 PRESS RELEASE NYSE: CIM CHIMERA INVESTMENT CORPORATION 520 Madison Avenue New York, New York 10022 Investor Relations 866-315-9930 www.chimerareit.com FOR IMMEDIATE RELEASE CHIMERA INVESTMENT CORPORATION
OMEGA HEALTHCARE INVESTORS, INC. FUNDS FROM OPERATIONS Unaudited (In thousands, except per share amounts)
") FUNDS FROM OPERATIONS (In thousands, except per share amounts) Net income available to common stockholders. $ 14,753 Deduct gain from real estate dispositions.. (477) Sub-total... $ 14,276 Elimination
FUNDS FROM OPERATIONS (In thousands, except per share amounts) Net income available to common stockholders. $ 14,753 Deduct gain from real estate dispositions.. (477) Sub-total... $ 14,276 Elimination
Prologis Reports Fourth Quarter and Full Year 2017 Earnings Results
 News Release Archive Prologis Reports Fourth Quarter and Full Year 2017 Earnings Results SAN FRANCISCO, Jan. 23, 2018 /PRNewswire/ -- Prologis, Inc. (NYSE: PLD), the global leader in logistics real estate,
SLM CORPORATION EARNINGS PRESENTATION FOURTH QUARTER January 18, 2018
 SLM CORPORATION EARNINGS PRESENTATION FOURTH QUARTER 2017 January 18, 2018 2 Forward-Looking Statements and Disclaimer Cautionary Note Regarding Forward-Looking Statements The following information is
SLM CORPORATION EARNINGS PRESENTATION SECOND QUARTER July 20, 2017
 SLM CORPORATION EARNINGS PRESENTATION SECOND QUARTER 2017 July 20, 2017 2 Forward-Looking Statements and Disclaimer Cautionary Note Regarding Forward-Looking Statements The following information is current
FIFTH THIRD ANNOUNCES SECOND QUARTER 2017 NET INCOME TO COMMON SHAREHOLDERS OF $344 MILLION, OR $0.45 PER DILUTED SHARE
 CONTACTS: Sameer Gokhale (Investors) News Release (513) 534-2219 Larry Magnesen (Media) FOR IMMEDIATE RELEASE (513) 534-8055 July 21, 2017 FIFTH THIRD ANNOUNCES SECOND QUARTER 2017 NET INCOME TO COMMON
FIFTH THIRD ANNOUNCES SECOND QUARTER 2018 NET INCOME TO COMMON SHAREHOLDERS OF $563 MILLION, OR $0.80 PER DILUTED SHARE
 CONTACTS: Sameer Gokhale (Investors) News Release (513) 534-2219 Larry Magnesen (Media) FOR IMMEDIATE RELEASE (513) 534-8055 July 19, 2018 FIFTH THIRD ANNOUNCES SECOND QUARTER 2018 NET INCOME TO COMMON
Investor Day March 29, 2007 Fixed Income Overview
 Investor Day March 29, 2007 Fixed Income Overview Jeff Mayer Co-Head of Global Fixed Income Tom Marano Global Head of Mortgages and Asset Backed Securities Net Revenues have Doubled Since 2002 CAGR = 22%