|
|
|
- Gladys Gardner
- 5 years ago
- Views:
Transcription
1
2
3
4
5
6
7
8 Industrial and Commercial Bank of China Limited - Pakistan Branches Notes to the Financial Statements For the year ended December 31, STATUS AND NATURE OF BUSINESS The Pakistan branches of Industrial and Commercial Bank of China Limited ("the branches") have commenced their operations in Pakistan with effect from August 18, Industrial and Commercial Bank of China Limited is incorporated in the People's Republic of China. The Bank presently operates through two branches (December 31, 2012: two branches) and one service centre in Pakistan and is engaged in banking activities permissible under the Banking Companies Ordinance, The registered office of the Bank is located at Parsa Tower, P.E.C.H.S, Main Shahrah -e-faisal, Karachi. The credit rating of the Bank is disclosed in note 26 to these financial statements. 2 BASIS OF PRESENTATION 2.1 These financial statements have been prepared in conformity with the format of financial statements prescribed by SBP vide BSD circular No. 04, dated 17 February In accordance with the directives of the Federal Government regarding the shifting of the banking system to Islamic modes, the State Bank of Pakistan has issued various circulars from time to time. Permissible form of trade-related modes of financing includes purchase of goods by banks from their customers and immediate resale to them at appropriate mark-up in price on deferred payment basis. The purchases and sales arising under these arrangements are not reflected in these financial statements as such, but are restricted to the amount of facility actually utilised and the appropriate portion of mark-up thereon. 3 STATEMENT OF COMPLIANCE 3.1 These financial statements have been prepared in accordance with approved accounting standards as applicable in Pakistan. Approved accounting standards comprise of International Financial Reporting Standards (IFRS) issued by the International Accounting Standard Board (IASB) as are notified under the Companies Ordinance, 1984, provisions of and directives issued under Companies Ordinance, 1984, the Banking Companies Ordinance, 1962 and regulations/ directives issued by the Securities and Exchange Commission of Pakistan (SECP) and SBP. Wherever the requirements of Companies Ordinance, 1984, Banking Companies Ordinance, 1962 or regulations / directives issued by the SECP and the SBP differ with the requirements of IFRS, the requirements of the Companies Ordinance, 1984, Banking Companies Ordinance, 1962 or the requirements of the said regulations/ directives shall prevail. 3.2 The State Bank of Pakistan has deferred the applicability of International Accounting Standard (IAS) 39, 'Financial Instruments: Recognition and Measurement' and International Accounting Standard (IAS) 40, 'Investment Property' for banking companies through BSD Circular Letter No. 10 dated August 26, 2002 till further instructions. Further, the Securities and Exchange Commission of Pakistan has deferred the applicability of International Financial Reporting Standard (IFRS) 7, 'Financial Instruments: Disclosures' on banks through its notification S.R.O 411(I)/2008 dated April 28, Accordingly, the requirements of these standards have not been considered in the preparation of these financial statements. However, investments have been classified and valued in accordance with the requirements prescribed by the State Bank of Pakistan through various circulars.
9 3.3 New disclosure requirements Minimum Capital Requirement In the current year, the State Bank of Pakistan, vide BPRD Circular No. 06 of 2013 dated August 15, 2013 issued Basel III guidelines pertaining to eligible capital and related disclosures. The Bank in accordance with the said guidelines calculated/presented the eligible capital and related disclosures. Credit risk, Market risk and Operational risk were calculated in accordance with the provisions of Basel II as Basel III guidelines for Credit Risk, Market Risk and Operational Risk are expected to be issued in the year Accordingly, eligible capital and related disclosures of the comparative period were represented for better comparison. 3.4 Standards, interpretations and amendments to Approved Accounting Standards that are not yet effective The following standards, amendments and interpretations of approved accounting standards will be effective for accounting periods beginning on or after January 01, 2014: - IFRIC 21- Levies an Interpretation on the accounting for levies imposed by governments (effective for annual periods beginning on or after January 01, 2014). IFRIC 21 is an interpretation of IAS 37 Provisions, Contingent Liabilities and Contingent Assets. IAS 37 sets out criteria for the recognition of a liability, one of which is the requirement for the entity to have a present obligation as a result of a past event (known as an obligating event). The interpretation clarifies that the obligating event that gives rise to a liability to pay a levy is the activity described in the relevant legislation that triggers the payment of the levy. The amendment is not likely to have an impact on the financial statements of the Bank. - Amendment to IAS 36 Impairment of Assets Recoverable Amount Disclosures for Non- Financial Assets (effective for annual periods beginning on or after January 01, 2014). These narrow-scope amendments to IAS 36 Impairment of Assets address the disclosure of information about the recoverable amount of impaired assets if that amount is based on fair value less costs of disposal. The amendment is not likely to have an impact on the financial statements of the Bank. - Amendments to IAS 19 Employee Benefits Employee contributions a practical approach (effective for annual periods beginning on or after July 01, 2014). The practical expedient addresses an issue that arose when amendments were made in 2011 to the previous pension accounting requirements. The amendments introduce a relief that will reduce the complexity and burden of accounting for certain contributions from employees or third parties. The amendments are relevant only to defined benefit plans that involve contributions from employees or third parties meeting certain criteria. The amendment is not likely to have an impact on the financial statements of the Bank. - Annual Improvements and cycles (most amendments will apply prospectively for annual period beginning on or after July 01, 2014). The new cycle of improvements contain amendments to the following standards: - IFRS 2 Share-based Payment. IFRS 2 has been amended to clarify the definition of vesting condition by separately defining performance condition and service condition. The amendment also clarifies both: how to distinguish between a market condition and a non-market performance condition and the basis on which a performance condition can be differentiated from a vesting condition. - IFRS 3 Business Combinations. These amendments clarify the classification and measurement of contingent consideration in a business combination. Further, IFRS 3 has also been amended to clarify that the standard does not apply to the accounting for the formation of all types of joint arrangements including joint operations in the financial statements of the joint
10 arrangement themselves. - IFRS 8 Operating Segments has been amended to explicitly require the disclosure of judgments made by management in applying the aggregation criteria. In addition, this amendment clarifies that a reconciliation of the total of the reportable segment s assets to the entity assets is required only if this information is regularly provided to the entity s chief operating decision maker. This change aligns the disclosure requirements with those for segment liabilities. - Amendments to IAS 16 Property, plant and equipment and IAS 38 Intangible Assets. The amendments clarify the requirements of the revaluation model in IAS 16 and IAS 38, recognizing that the restatement of accumulated depreciation (amortization) is not always proportionate to the change in the gross carrying amount of the asset. - IAS 24 Related Party Disclosure. The definition of related party is extended to include a management entity that provides key management personnel services to the reporting entity, either directly or through a group entity. The above amendments are not likely to have an impact on the financial statements of the Bank other than additional disclosures. 4 BASIS OF MEASUREMENT 4.1 Accounting convention These financial statements have been prepared under the historical cost convention except that available for sale investments are measured at fair value. 4.2 Functional and Presentation Currency These financial statements are presented in Pakistani Rupees, which is the branches' functional and presentation currency. The amounts are rounded off to the nearest thousand rupees except as stated otherwise. 4.3 Critical accounting estimates and judgments The preparation of financial statements in conformity with approved accounting standards requires management to make judgments, estimates and assumptions that effect the application of policies and reported amounts of assets and liabilities, income and expenses. The estimates and associated assumptions are based on historical experience and various other factors that are believed to be reasonable under the circumstances, the results of which form the basis of making the judgments about carrying values of assets and liabilities that are not readily apparent from other sources. Actual results may differ from these estimates. The estimates and underlying assumptions are reviewed on an ongoing basis. Revisions to accounting estimates are recognised in the period in which the estimate is revised if the revision affects only that period, or in the period of the revision and future periods if the revision affects both current and future periods.
11 S Significant accounting estimates and areas where judgments were made by the management in the application of accounting policies are as follows: - classification of investments (note 5.4) - income taxes (note 5.8) - depreciation of operating fixed assets (note 5.6) 5 SUMMARY OF SIGNIFICANT ACCOUNTING POLICIES The principal accounting policies applied in the preparation of these financial statements are set out below. These have been consistently applied to all years presented, except for the changes mentioned in note 5.1 to these financial statements. 5.1 Change in accounting policy Presentation of items of other comprehensive income As a result of the amendments to IAS 1, the Bank has modified the presentation of items of other comprehensive income in its statement of comprehensive income, to present separately items that would be reclassified to profit or loss in the future from those that would never be. The adoption of the amendment to IAS 1 has no impact on the recognised assets, liabilities and comprehensive income of the Bank. 5.2 Cash and cash equivalents Cash and cash equivalents comprise of cash in hand, balances with treasury banks, balances with other banks in current and deposit accounts and lendings and borrowings having original maturity of three months or less. 5.3 Lendings to / borrowings from financial institutions The Bank enters into transactions of repos and reverse repos at contracted rates for a specified period of time. These are recorded as under: Sale of securities under repurchase agreements Securities sold subject to a repurchase agreement (repo) are retained in the financial statements as investments and the counter party liability is included in borrowings. The difference between the sale and contracted repurchase price is accrued on a time proportion basis over the period of the contract and recorded as an expense. Purchase of securities under resale agreements Securities purchased under agreement to resell (reverse repo) are not recognised in the financial statements as investments and the amount extended to the counter party is included in lendings. The difference between the purchase and contracted resale price is accrued on a time proportion basis over the period of the contract and recorded as income. 5.4 Investments Classification The Bank classifies its investments as follows: Held for trading These are investments, which are either acquired for generating a profit from short-term fluctuations in market prices, interest rate movements, dealers margin or are securities included in a portfolio in which a pattern of short-term profit taking exists.
12 Available for sale These are investments which do not fall under the 'held for trading' and 'held to maturity' categories. Held to maturity These are investments with fixed or determinable payments and fixed maturities and the Bank has the positive intent and ability to hold them till maturity Regular way contracts All purchases and sales of investments that require delivery within the time frame established by regulation or market convention are recognised at settlement date, which is the date at which the Bank agrees to settle the purchase or sale of investments Initial recognition and measurement Investments other than those categorized as 'held for trading' are initially recognised at fair value. Transaction costs associated with the investment are included in cost of investments Subsequent measurement In accordance with the requirements of State Bank of Pakistan, quoted securities other than those classified as 'held to maturity' are subsequently remeasured to market value. Surplus / (deficit) arising on revaluation of securities classified as 'held for trading' is taken to profit and loss account and for securities classified as 'Available for sale' is taken to a separate account shown in the statement of financial position below equity. Investments classified as 'Held to maturity' are carried at amortised cost Impairment Provision for diminution in the values of securities is made after considering impairment, if any, in the value. Provision for impairment against debt securities is made as per the aging criteria prescribed by the Prudential Regulations of SBP. 5.5 Loans and advances Loans and advances are stated net off provisions against non-performing advances. Specific and general provisions are made in accordance with the requirements of the Prudential Regulations issued by the State Bank of Pakistan from time to time. The net provision made / reversed during the year is charged to profit and loss account and accumulated provision is netted-off against advances. Advances are written off when there are no realistic prospects of recovery. 5.6 Operating fixed assets Operating fixed assets except capital work-in-progress are stated at historical cost less accumulated depreciation and accumulated impairment losses, if any. Historical cost includes expenditures that are directly attributable to the acquisition of the items. Depreciation is charged to income by applying the straight-line method using the rates specified in note 11.1 to these financial statements. The depreciation charge for the year is calculated after taking into account residual value, if any. The residual values, useful lives and depreciation method are reviewed and adjusted, if appropriate, at each reporting date. Depreciation on additions is charged from the date on which the assets are available for use and ceases on the date on which they are disposed off.
13 Maintenance and normal repairs are charged to income as and when incurred. Subsequent costs are included in the asset's carrying amount or are recognised as a separate asset, as appropriate, only when it is probable that future economic benefits associated with the item will flow to the Bank and the cost of the item can be measured reliably. 5.7 Capital work-in-progress Capital work-in-progress is stated at cost less accumulated impairment losses, if any. All expenditure connected with specific assets incurred during installation and construction period are carried under this head. These are transferred to specific assets as and when assets become available for use. 5.8 Taxation Income tax expense comprises current and deferred tax. Income tax expense is recognised in the profit and loss account except to the extent that it relates to items recognised directly in other comprehensive income or surplus on revaluation of investments in which case it is recognised in other comprehensive income or surplus on revaluation of investments. Current Provision for current taxation is based on taxable income at the current rates of taxation after taking into consideration available tax credit and rebates, if any. The charge for current tax also includes adjustments, where considered necessary relating to prior years, which arise from assessments / developments made during the year. Deferred Deferred tax is recognised using the balance sheet liability method on all temporary differences arising between the carrying amounts of assets and liabilities for financial reporting purposes and amounts used for the taxation purposes. The amount of deferred tax provided is based on the expected manner of realisation or settlement of the carrying amounts of assets and liabilities using the tax rates enacted or substantially enacted at the reporting date. A deferred tax asset is recognised only to the extent that it is probable that future taxable profits will be available and the credits can be utilised. Deferred tax asset is reduced to the extent that it is no longer probable that the related tax benefits will be realised. 5.9 Employee benefits Defined benefit plan The branches operate an approved funded gratuity scheme covering eligible employees whose period of employment with branches is five years or more. Gratuity is payable to staff on completion of the prescribed qualifying period of service under the scheme. Defined contribution plan The branches operate an approved provident fund for all of its local permanent employees in respect of which contributions are made to discharge liability under the respective rules of the schemes Borrowings / deposits and their cost a) Borrowings / deposits are recorded at the proceeds received. b) Borrowing costs are recognised as an expense in the period in which these are incurred using effective mark-up / interest rate method to the extent that they are not directly attributable to the acquisition of or construction of qualifying assets. Borrowing costs that are directly attributable to the acquisition, construction or production of a qualifying asset (one that takes a substantial period of time to get ready for use or sale) are capitalized as part of the cost of that asset.
14 5.11 Provisions Provisions are recognised when the branches have a present, legal or constructive, obligation as a result of past events, it is probable that an outflow of resources will be required to settle the obligation and a reliable estimate of the amount can be made. Provisions are reviewed at each reporting date and are adjusted to reflect the current best estimate Acceptances Acceptances comprise undertakings by the branches to pay bills of exchange drawn on customers. The branches expect most acceptances to be simultaneously settled with the reimbursement from the customers. Acceptances are accounted for as off balance sheet transactions and are disclosed as contingent liabilities and commitments Revenue recognition Advances and investments Mark-up income on loans and advances and debt securities is recognised on a time proportion basis. Where debt securities are purchased at a premium or discount, those premiums / discounts are amortised through the profit and loss account over the remaining maturity, using the effective yield method. Fee, commission and brokerage Fee, commission and brokerage income except income from guarantees are accounted for on receipt basis. Commission on guarantees is recognised on time proportion basis. Other income is recognised on accrual basis Foreign currency translation Transactions in foreign currencies are translated into Pakistani rupees at the exchange rates prevailing on the transaction date. Monetary assets and liabilities denominated in foreign currencies are translated into Pakistan Rupees at the exchange rates prevailing at the reporting date. Forward contracts are valued at forward rates applicable to the respective maturities of the relevant foreign exchange contract. Exchange gains and losses are included in income. Commitments for outstanding forward foreign exchange contracts are disclosed at contracted rates Off-setting Financial assets and financial liabilities are off-set and the net amount is reported in the financial statements only when there is a legally enforceable right to set-off the recognised amount and the branches intend either to settle on a net basis, or to realize the assets and to settle the liabilities simultaneously. Income and expense items of such assets and liabilities are also off-set and the net amount is reported in the financial statements.
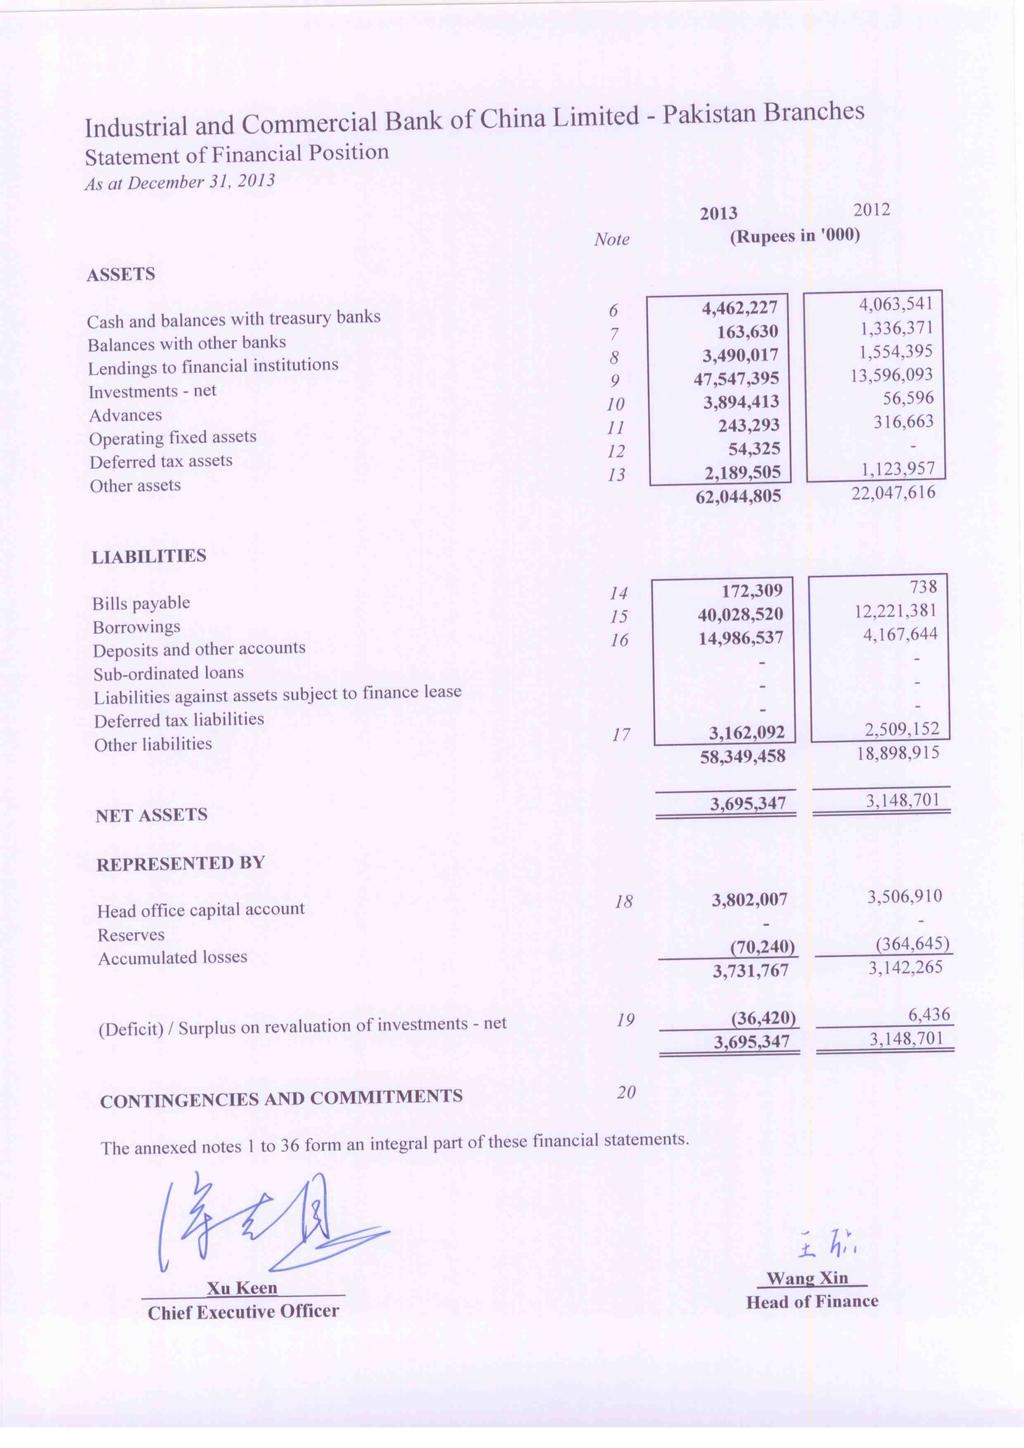
15 5.16 Segment reporting A segment is a distinguishable component of the branches that is engaged either in providing product or services (business segment), or in providing products or services within a particular economic environment (geographical segment), which is subject to risks and rewards that are different from those of other segments. The branches' primary format of reporting is based on business segments. Business segments Trading and sales It includes fixed income, equity, foreign exchanges, commodities, credit, funding, own position securities, lending and repos, brokerage debt and prime brokerage. Corporate finance This represents provision of banking services including treasury and international trade activities to large corporate customers, multinational companies, government and semi government departments and institutions and SMEs treated as corporate under Prudential Regulations. 6 CASH AND BALANCES WITH TREASURY BANKS Note (Rupees in '000) In hand: Local currency 24,164 6,770 Foreign currencies 24,964 42,369 49,128 49,139 With State Bank of Pakistan in: Local currency current account , ,280 Foreign currency current accounts ,486 34,452 Foreign currency deposit accounts 6.3 3,970,527 3,753,670 4,462,227 4,063, This includes statutory liquidity reserve maintained with the SBP under Section 22 of the Banking Companies Ordinance, As per BSD Circular No. 9 dated December 3, 2007, cash reserve of 5% is required to be maintained with the State Bank of Pakistan on deposits held under the New Foreign Currency Accounts Scheme (FE-25 deposits). 6.3 This includes special cash reserve of 15% required to be maintained with the State Bank of Pakistan on FE-25 deposits as specified in BSD Circular No. 14 dated June 21, Profit rates on these deposits are fixed by SBP on a monthly basis. The State Bank of Pakistan has not remunerated these deposit accounts during the year. It also includes capital maintained with SBP in accordance with the requirements of Section 13 of Banking Companies Ordinance 1962 amounting to USD million (December 31, 2012: USD million).
16 7 BALANCES WITH OTHER BANKS Note (Rupees in '000) In Pakistan On current accounts Outside Pakistan On current accounts - 23,834 On deposit accounts 163,248 1,312, ,630 1,336,371 8 LENDINGS TO FINANCIAL INSTITUTIONS Call money lendings 8.1 2,500,932 1,554,395 Repurchase agreement lendings (Reverse repo) ,085-3,490,017 1,554, These represent call lendings to financial institutions and other branches of ICBC at mark-up rates ranging from 0.1% to 10.3% per annum (December 31, 2012: 1.0% to 1.55% per annum) with maturities up to April 2014 (December 31, 2012: June 2013). 8.2 This carries mark-up at 9.50% per annum (2012: NIL) with maturity in January Particulars of lending (Rupees in '000) In local currency 1,889,085 - In foreign currencies 1,600,932 1,554,395 3,490,017 1,554, Securities held as collateral against lending to financial institutions Held by Further Total Held by Further Total bank given as bank given as collateral collateral (Rupees in '000) (Rupees in '000) Market Treasury Bills 909,288 79, , ,288 79, , The market value of securities held as collateral against lendings to financial institutions as at December 31, 2013 amounts to Rs. 994 million (2012: Nil). 9 INVESTMENTS - NET 9.1 Investments by type December 31, 2013 December 31, 2012 Held by Given as Held by Given as Bank Collateral Total Bank Collateral Total Note (Rupees in '000) (Rupees in '000) Available-for-sale securities Market Treasury Bills ,523,629 79,797 47,603,426 13,019, ,726 13,589,657 Investments at cost 47,523,629 79,797 47,603,426 13,019, ,726 13,589,657 (Deficit) / surplus on revaluation of available for sale securities 19 (55,937) (94) (56,031) 6, ,436 Total investments at market value 47,467,692 79,703 47,547,395 13,026, ,996 13,596, These Market Treasury Bills will mature upto May 2014 (December 31, 2012: upto July 2013) and carry interest at 8.93% to 10.30% per annum (December 31, 2012: from 9.2% to 11.85% ). 9.2 Investments by segments (Rupees in '000) Federal Government Securities Market treasury bills 47,603,426 13,589,657 Total investments at cost 47,603,426 13,589,657 (Deficit) / surplus on revaluation of available for sale securities -56,031 6,436 Total investments at market value 47,547,395 13,596, Quality of available for sale securities Market value Cost Market Treasury Bills 47,547,395 13,596,093 47,603,426 13,433,609 (Unrated-Government Securities)
17 10 ADVANCES Note (Rupees in '000) Loans, cash credits, running finances, etc. In Pakistan 830,000 - Bills discounted and purchased (excluding market treasury bills) Payable in Pakistan 3,064,413 56, Particulars of advances 3,894,413 56,596 In local currency 980,000 - In foreign currencies 2,914,413 56,596 3,894,413 56,596 Short-term for upto one year 3,894,413 56,596 Long-term for over one year - - 3,894,413 56, No advances have been placed under non-performing status (December 31, 2012: Nil). 11 OPERATING FIXED ASSETS Property and equipment , , , , Property and equipment As at January 01, 2013 Cost Additions As at December 31, Accumulated Depreciation As at January 01, 2013 Charge for the year As at December 31, 2013 Book value As at December 31, Rate of 2013 Depreciation (Rupees in '000) % Leasehold improvements 277,664 4, ,190 11,243 55,918 67, ,029 20% Furniture and fixture 14,575 1,805 16,380 3,918 3,057 6,975 9,405 20% Electrical, office and computer equipment 69,548 2,675 72,223 29,963 23,401 53,364 18,859 33% 361,787 9, ,793 45,124 82, , ,293 As at January 01, 2012 Cost Additions As at December 31, Accumulated Depreciation As at January 01, Charge for the 2012 year As at December 31, 2012 Book value As at December 31, Rate of 2012 Depreciation (Rupees in '000) % Leasehold improvements - 277, ,664-11,243 11, ,421 20% Furniture and fixture 13, ,575 1,014 2,904 3,918 10,657 20% Electrical, office and computer equipment 66,124 3,424 69,548 7,239 22,724 29,963 39,585 33% 79, , ,787 8,253 36,871 45, ,663
18 12 DEFERRED TAX ASSETS (Rupees in '000) Deferred debits arising in respect of - Unabsorbed tax losses and depreciation 57, ,040 - Investments - available for sale 19,611 (2,253) 77, ,787 Deferred credits arising due to - Operating fixed assets (23,026) (18,415) 54, ,372 Deferred tax asset not recognised - (125,372) 54, Movement in deferred tax balances As at January 01, 2013 Recognised in profit or loss Recognised in revaluation surplus As at December 31, (Rupees in '000) Operating fixed assets - (23,026) - (23,026) Investments - available for sale ,611 19,611 Unabsorbed tax losses - 57,740-57,740-34,714 19,611 54, OTHER ASSETS (Rupees in '000) Income / Mark-up accrued in local currency 20,484 - Income / Mark-up accrued in foreign currencies 17,497 1,612 Advances, deposits, advance rent and other prepayments 37,672 34,146 Unrealized gain on forward foreign exchange contracts 2,076,914 1,087,199 Others 36,938 1,000 2,189,505 1,123, BILLS PAYABLE In Pakistan 119, Outside Pakistan 52, , BORROWINGS In Pakistan 79, ,726 Outside Pakistan 39,948,723 11,651,655 40,028,520 12,221, Particulars of borrowings with respect to currencies In local currency 79, ,726 In foreign currencies 39,948,723 11,651,655 40,028,520 12,221,381
19 15.2 Details of borrowings Secured / Unsecured Note (Rupees in '000) Secured Repurchase agreement borrowings (Repo) , ,726 Unsecured Call borrowings ,948,723 11,651, This represents repurchase agreement borrowings from other banks at the rate of 10% per annum (2012: 7% to 11.9% per annum) maturing by January 2014 (2012: April 2013) This represents borrowings from financial institutions and other ICBC branches at mark-up rates ranging from 0.55% to 1.1% per annum (2012: 0.1% to 11.90%) maturing by May 2014 (2012: March 2013). 16 DEPOSITS AND OTHER ACCOUNTS Note (Rupees in '000) Customers Fixed deposits 11,260,149 2,937,759 Savings deposits 1,090, ,053 Current accounts - Non-remunerative 2,625, ,832 14,977,031 4,167,644 Financial institutions Non-remunerative deposits 9,506-14,986,537 4,167, Particulars of deposits In local currency 8,469,614 3,111,010 In foreign currencies 6,516,923 1,056,634 14,986,537 4,167, OTHER LIABILITIES Mark-up / Return / Interest payable in local currency 152,624 25,894 Mark-up / Return / Interest payable in foreign currencies 98,014 2,743 Staff performance bonus payable 95,849 48,957 Payable to head office ,464,223 1,350,575 Unrealized loss on forward foreign exchange contracts 985, ,873 Commission received in advance against unfunded exposure 305,754 - Payable to employee benefit plans 907 1,090 Provision for WWF 5,300 - Others 54, ,020 3,162,092 2,509, This represents interest free advance of USD 13.9 million (December 31, 2012: USD 13.9 million) provided by the head office for the purpose of initial set up of branches' operations. The terms of repayment have not yet been agreed.
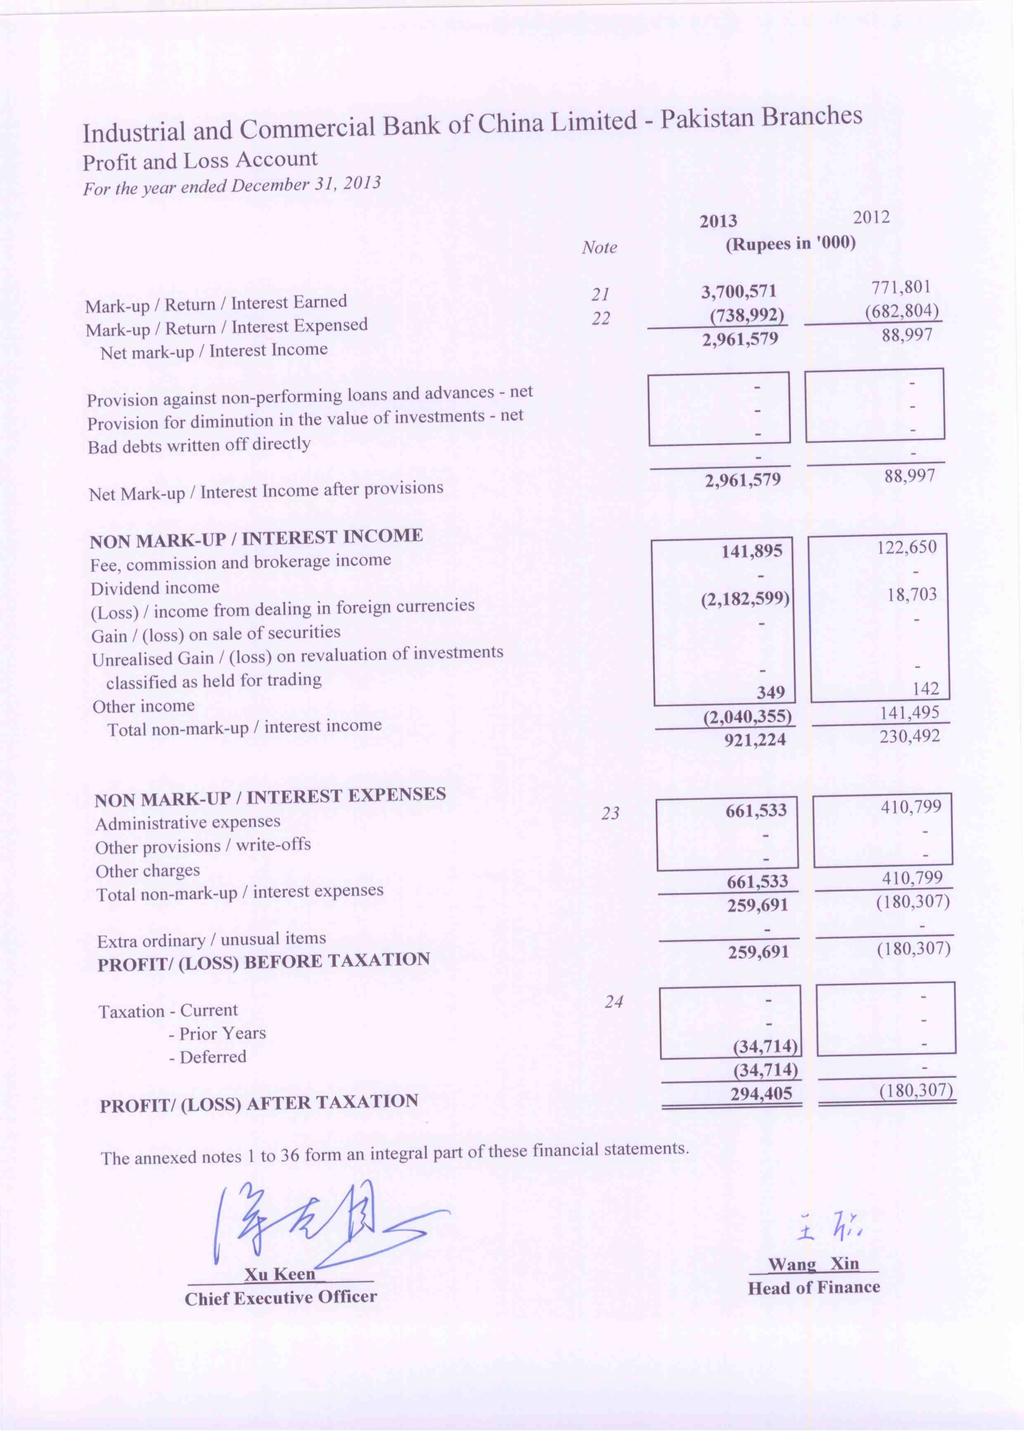
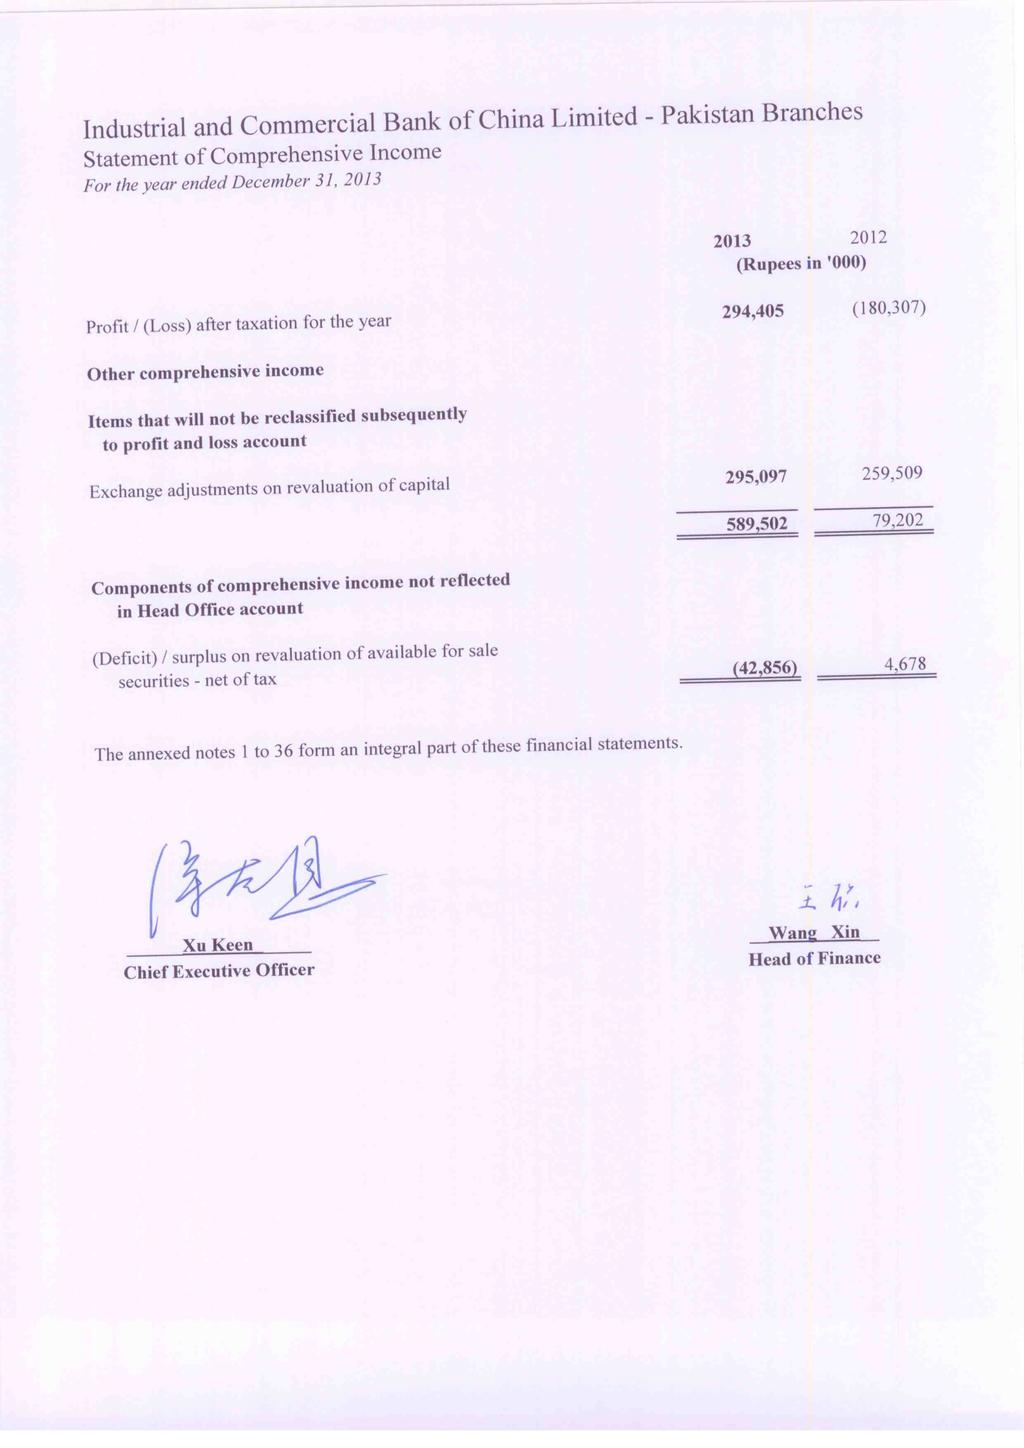
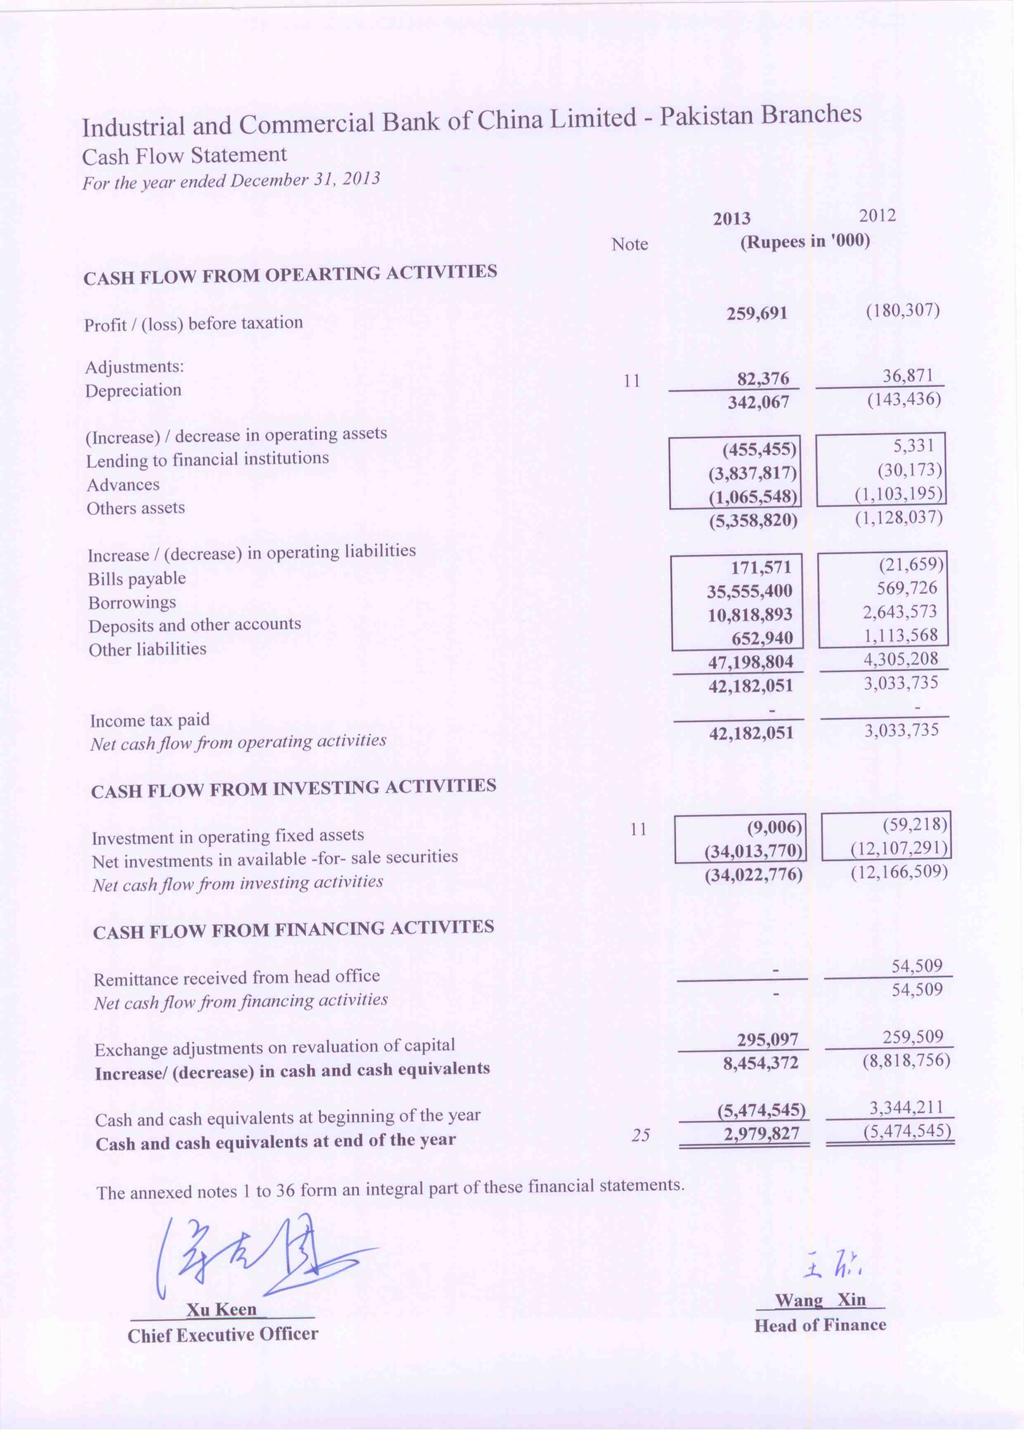
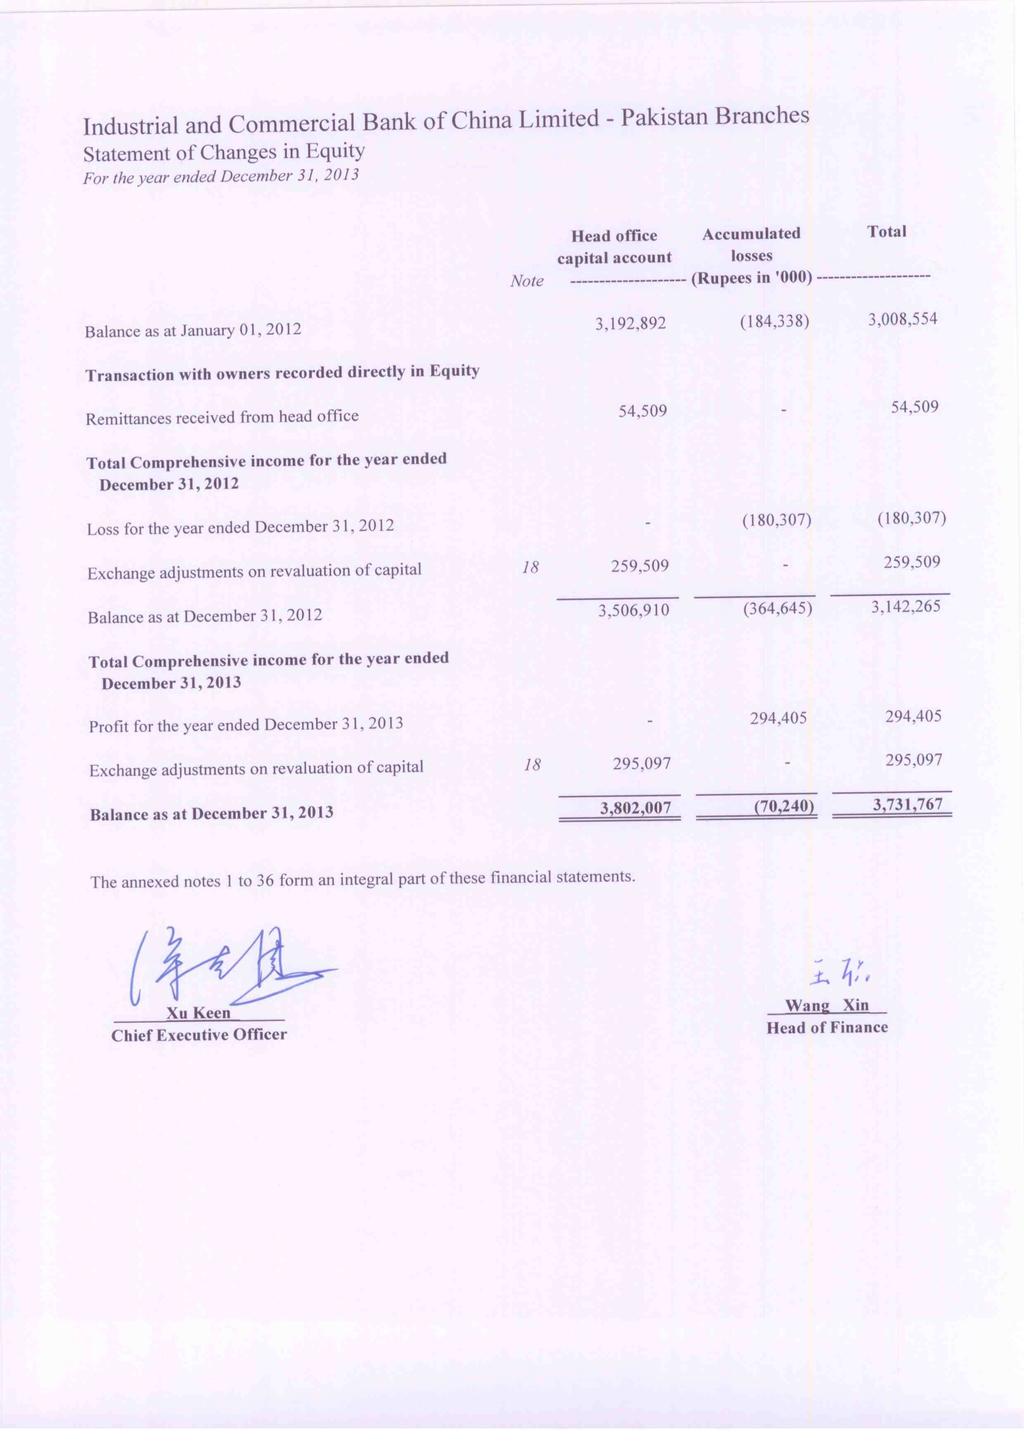
20 18 HEAD OFFICE CAPITAL ACCOUNT (Rupees in '000) Capital held as interest free deposit in approved foreign exchange USD million (2012: USD million) Balance at beginning of the year 3,506,910 3,247,401 Revaluation advised by the State Bank of Pakistan during the year 295, ,509 3,802,007 3,506, (DEFICIT) / SURPLUS ON REVALUATION OF INVESTMENTS - AVAILABLE FOR SALE (Deficit)/ Surplus on revaluation of Government securities (56,031) 6,436 Related deferred tax asset 19,611 - (36,420) 6, CONTINGENCIES AND COMMITMENTS 20.1 Transaction related contingent liabilities Government 20,514,530 8,756,228 Others 20,313,722 7,387,444 40,828,252 16,143, Trade related contingent liabilities Letters of credit 162,078 26, Commitments in respect of forward foreign and local exchange contracts Purchase 128,520,658 55,170,660 Sale 127,786,139 45,939, Commitments in respect of repo transactions Repurchase 79, ,726 Resale 989, Commitments to extend credit - syndicated loan 500, MARK-UP/ RETURN/ INTEREST EARNED Loans and advances 113,777 3,082 Investments in available for sale securities 3,360, ,684 Deposits with financial institutions 8,481 - Securities purchased under resale agreements 102,988 - Call money lendings 114, ,035 3,700, ,801
21 22 MARK-UP/ RETURN/ INTEREST EXPENSED Note (Rupees in '000) Deposits 492, ,054 Securities sold under repurchase agreements 24,209 - Other short term borrowings 222,242 32, , , ADMINISTRATIVE EXPENSES Salaries, allowances, etc. 397, ,268 Charge for defined benefit plan 23.1 & Contribution to defined contribution plan 23.1 & Charge for Workers' Welfare Fund 5,300 - Rent, taxes, insurance, electricity, etc. 82,751 48,171 Legal and professional charges 3, Communications 16,874 17,106 Stationery and printing 3, Advertisement and publicity 3,439 5,391 Depreciation ,376 36,871 Travelling and entertainment 47,987 17,178 Auditors' remuneration Others 17,291 13, , , During the year, the Bank has registered an approved defined benefit and defined contribution plan. The Bank was previously operating an unapproved contribution plan which was discontinued and the contribution pertaining to it was paid to the employees Auditors' remuneration (Rupees in '000) Audit fee TAXATION For the year - Current - Deferred - - (34,714) - (34,714) Relationship between tax expense and accounting profit Profit before taxation 259,691 (180,307) Tax at the applicable rate of 35% (2012: 35%) 90,892 (63,107) Effect of: - Recognition of previously unrecognised deferred tax assets (125,372) - - Unrecognised deferred tax asset - 63,107 - Others (234) - Tax expense for the year (34,714) - 25 CASH AND CASH EQUIVALENTS Cash and balances with treasury banks 4,462,227 4,063,541 Balance with other banks 163,630 1,336,371 Short term lending 2,257, ,198 Short term borrowings (3,903,394) (11,651,655) 2,979,827 (5,474,545)
22 26 CREDIT RATING Moody's Investor Services Inc. has assigned a long term credit rating of A1 and a short term credit rating of P-1 to the head office of the Bank. 27 STAFF STRENGTH (Number of employees) Permanent Temporary/on contractual basis 6 6 Bank's own staff strength at the end of the year Outsourced 2 1 Total Staff Strength EMPLOYEES RETIREMENT BENEFITS The branches operate an approved gratuity fund registered in October 2013 w.e.f July 2013 for all its local permanent employees. During the year, the Bank has contributed an amount of Rs. 459,151 (2012: Nil) to the fund which has been charged to profit and loss account. Gratuity is payable to the staff on completion of the prescribed qualifying period under the scheme. The Bank contributed an amount of Rs. 760,800 against an unrecognised Provident Fund upto 30 June 2013 which was returned to the employees and further, Rs. 440,044 were contributed during the year. 29 COMPENSATION OF CHIEF EXECUTIVE AND EXECUTIVES Chief Executive Executives (Rupees in '000) (Rupees in '000) Managerial remuneration 39,384 27, , ,901 Charge for defined benefit plan Contribution to defined contribution plan Rent and house maintenance Utilities Medical Conveyance Others ,384 27, , ,852 Number of persons The chief executive and certain executives have been provided with free use of branches' rented and maintained cars in accordance with the terms of their employment and are also entitled to branches' rented and maintained accommodation and medical benefits. In addition, the chief executive and certain executives are also provided with drivers, security arrangements and payment of travel bills in accordance with their terms of employment. 30 FAIR VALUE OF FINANCIAL INSTRUMENTS Fair value is the amount for which an asset could be exchanged, or a liability settled, between knowledgeable willing parties in an arm's length transaction. The fair value of government securities is based on market prices available from reuters and is disclosed in the relevant note 9. The re-pricing profile, effective rates and maturity are stated in note 34 to these financial statements. In the opinion of the management, the fair value of the remaining financial assets and liabilities are not significantly different from their carrying values since assets and liabilities are either short term in nature or are frequently re-priced.
23 31 SEGMENT DETAILS WITH RESPECT TO BUSINESS ACTIVITIES 2013 Corporate Trading & Finance Sales Others Total (Rupees in '000) Total income 255,672 2,848,151-3,103,823 Total expenses (90,335) (2,671,421) (82,376) (2,844,132) Net income 165, ,730 (82,376) 259,691 Segment assets 3,894,413 55,663,269 2,487,123 62,044,805 Segment liabilities 3,597,376 51,417,681 3,334,401 58,349,458 Segment return on assets (ROA) (%) 6.57% 5.12% 0.00% Segment cost of funds (%) 2.51% 5.20% 2.47% 2012 Corporate Trading & Finance Sales Others Total Total income 3, , ,296 Total expenses (3,566) (1,053,166) (36,871) (1,093,603) Net income (484) (142,952) (36,871) (180,307) Segment assets (Gross) 56,596 20,550,400 1,440,620 22,047,616 Segment liabilities 45,012 16,344,013 2,509,890 18,898,915 Segment return on assets (ROA) (%) 5.45% 4.43% 0.00% Segment cost of funds (%) 7.92% 6.44% 1.47% 32 RELATED PARTY TRANSACTIONS Parties are considered to be related if one party has the ability to control the other party or exercise significant influence over the other party in making financial or operational decisions and includes head office, other branches of the Bank and Key Management personnel and staff retirement benefit funds. The transactions with related parties are conducted under normal course of business substantially on the same terms as those prevailing at the time for comparable transactions with unrelated parties and do not involve more than a normal risk. Pakistan branches of the Bank also provide advances to employees in accordance with their terms of employment. Details of the transactions with related parties during the year and balances with them as at year end are as follows: Note Staff retirement Benefits Key Management Personnel Other ICBC branches Head Office (Rupees in '000) Balance Sheet Balances with other banks , ,248 Lendings to financial institutions - - 1,600,932-1,600,932 Borrowings - - 5,930,089 34,018,634 39,948,723 Other liabilities ,464,223 1,465,495 Profit and Loss Interest / other income ,021 2,099 54,120 Interest / other expense ,498 16, , ,646 Key Management Personnel December 31,2013 December 31, 2012 Other ICBC branches Head Office (Rupees in '000) Balance Sheet Balances with other banks - 1,312,158 23,834 1,335,992 Lendings to financial institutions - 11,651,655-11,651,655 Borrowings 35,548 23,131-58,679 Other liabilities 97-1,350,575 1,350,672 Profit and Loss Interest / other income Interest / other expense ,778 1, , Key Management Personnel (Rupees in '000) Managerial remuneration (including allowances) 349, ,358 Contribution to provident and benevolent fund Medical , ,778 Number of persons Total Total
24 33 Capital Adequacy Ratio (CAR) as at 31 December 2013 CAPITAL STRUCTURE Note ** Amounts subject to Pre - Basel III treatment* (Rupees in '000) Rows # Common Equity Tier 1 capital (CET1): Instruments and reserves 1 Capital deposited with SBP 3,802,007 3,506,910 2 Balance in Share Premium Account 3 Reserve for issue of Bonus Shares 4 General/ Statutory Reserves 5 Gain/(Losses) on derivatives held as Cash Flow Hedge 6 Accumulated losses (70,240) (364,645) 7 Minority Interests arising from CET1 capital instruments issued to third party by consolidated bank subsidiaries (amount allowed in CET1 capital of the consolidation group) 8 CET 1 before Regulatory Adjustments 3,731,767 3,142,265 Common Equity Tier 1 capital: Regulatory adjustments 9 Goodwill (net of related deferred tax liability) 10 All other intangibles (net of any associated deferred tax liability) 11 Shortfall of provisions against classified assets 12 Deferred tax assets that rely on future profitability excluding those arising from temporary differences (net of related tax liability) - 54, Defined-benefit pension fund net assets 14 Reciprocal cross holdings in CET1 capital instruments 15 Cash flow hedge reserve 16 Investment in own shares/ CET1 instruments 17 Securitization gain on sale 18 Capital shortfall of regulated subsidiaries 19 Deficit on account of revaluation from Bank's holdings of AFS 36, Investments in the capital instruments of banking, financial and insurance entities that are outside the scope of regulatory consolidation, where the bank does not own more than 10% of the issued share capital (amount above 10% threshold) 21 Significant investments in the capital instruments issued by banking, financial and insurance entities that are outside the scope of regulatory consolidation (amount above 10% threshold) 22 Deferred Tax Assets arising from temporary differences (amount above 10% threshold, net of related tax liability) 23 Amount exceeding 15% threshold 24 of which: significant investments in the common stocks of financial entities 25 of which: deferred tax assets arising from temporary differences 26 National specific regulatory adjustments applied to CET1 capital 27 Investment in TFCs of other banks exceeding the prescribed limit 28 Any other deduction specified by SBP (mention details) 29 Regulatory adjustment applied to CET1 due to insufficient AT1 and Tier 2 to cover deductions 30 Total regulatory adjustments applied to CET1 (sum of 9 to 25) 36,420 - Common Equity Tier 1 (a) 3,695,347 3,142,265 Additional Tier 1 (AT 1) Capital 31 Qualifying Additional Tier-1 instruments plus any related share premium of which: Classified as equity of which: Classified as liabilities Additional Tier-1 capital instruments issued by consolidated subsidiaries and held by third parties (amount allowed in group AT 1) of which: instrument issued by subsidiaries subject to phase out AT1 before regulatory adjustments - - Additional Tier 1 Capital: regulatory adjustments 37 Investment in mutual funds exceeding the prescribed limit (SBP specific adjustment) Investment in own AT1 capital instruments Reciprocal cross holdings in Additional Tier 1 capital instruments Investments in the capital instruments of banking, financial and insurance entities that are outside the scope of regulatory consolidation, where the bank does not own more than 10% of the issued share capital (amount above 10% threshold) Significant investments in the capital instruments issued by banking, financial and insurance entities that are outside the scope of regulatory consolidation Portion of deduction applied 50:50 to core capital and supplementary capital based on pre-basel III treatment which, during transitional period, remain subject to deduction from tier-1 capital Regulatory adjustments applied to Additional Tier 1 due to insufficient Tier 2 to cover deductions Total of Regulatory Adjustment applied to AT1 capital Additional Tier 1 capital Additional Tier 1 capital recognised for capital adequacy (b) - - Tier 1 Capital (CET1 + admissible AT1) (c=a+b) 3,695,347 3,142,265 Tier 2 Capital 47 Qualifying Tier 2 capital instruments under Basel III Capital instruments subject to phase out arrangement from tier 2 (Pre-Basel III instruments) Tier 2 capital instruments issued to third party by consolidated subsidiaries (amount allowed in group tier 2) of which: instruments issued by subsidiaries subject to phase out General Provisions or general reserves for loan losses-up to maximum of 1.25% of Credit Risk Weighted Assets Revaluation Reserves - 2, of which: Revaluation reserves on Property of which: Unrealized Gains/Losses on AFS - 2, Foreign Exchange Translation Reserves Undisclosed/Other Reserves (if any) T2 before regulatory adjustments - - Tier 2 Capital: regulatory adjustments - 2, Portion of deduction applied 50:50 to core capital and supplementary capital based on pre-basel III treatment which, during transitional period, remain subject to deduction from tier-2 capital Reciprocal cross holdings in Tier 2 instruments Investment in own Tier 2 capital instrument Investments in the capital instruments of banking, financial and insurance entities that are outside the scope of regulatory consolidation, where the bank does not own more than 10% of the issued share capital (amount above 10% threshold) - -
25 CAPITAL STRUCTURE Note ** Amounts subject to Pre - Basel III treatment* 62 Significant investments in the capital instruments issued by banking, financial and insurance entities that are outside the scope of regulatory consolidation Amount of Regulatory Adjustment applied to T2 capital Tier 2 capital (T2) Tier 2 capital recognised for capital adequacy Excess Additional Tier 1 capital recognised in Tier 2 capital Total Tier 2 capital admissible for capital adequacy (d) - - TOTAL CAPITAL (T1 + admissible T2) (e=c+d) 3,695,347 3,145,161 Total Risk Weighted Assets (i=f+g+h) 17,059,844 4,432, Total Credit Risk Weighted Assets (f) 14,041,906 3,841, Risk weighted assets in respect of amounts subject to Pre-Basel III Treatment 70 of which: recognised portion of investment in capital of banking, financial and insurance entities where holding is more than 10% of the issued common share capital of the entity 71 of which: deferred tax assets 72 of which: Defined-benefit pension fund net assets 73 of which: [insert name of adjustment] 74 Total Market Risk Weighted Assets (g) 2,291, , Total Operational Risk Weighted Assets (h) 726, ,058 Capital Ratios and buffers (in percentage of risk weighted assets) 76 CET1 to total RWA (a/i) 21.66% 70.89% 77 Tier-1 capital to total RWA (c/i) 21.66% 70.89% 78 Total capital to RWA (e/i) 21.66% 70.95% 79 Bank specific buffer requirement (minimum CET1 requirement plus capital conservation buffer plus any other buffer requirement) 80 of which: capital conservation buffer requirement 81 of which: countercyclical buffer requirement 82 of which: D-SIB or G-SIB buffer requirement 83 CET1 available to meet buffers (as a percentage of risk weighted assets) National minimum capital requirements prescribed by SBP 84 CET1 minimum ratio 5.0% 5.0% 85 Tier 1 minimum ratio 6.5% 6.5% 86 Total capital minimum ratio 10.0% 10.0% Amounts below the thresholds for deduction (before risk weighting) 87 Non-significant investments in the capital of other financial entities 88 Significant investments in the common stock of financial entities 89 Deferred tax assets arising from temporary differences (net of related tax liability) Applicable caps on the inclusion of provisions in Tier 2 90 Provisions eligible for inclusion in Tier 2 in respect of exposures subject to standardized approach (prior to application of cap) 91 Cap on inclusion of provisions in Tier 2 under standardized approach 92 Provisions eligible for inclusion in Tier 2 in respect of exposures subject to internal ratings-based approach (prior to application of cap) 93 Cap for inclusion of provisions in Tier 2 under internal ratings-based approach * The amount represents regulatory deductions that are still subject to pre- Basel III treatment during the transitional period. ** 2012 amounts are based on Basel II framework Risk-Weighted Exposures Book Value of Risk Weighted assets Risk Adjusted Value Book Value of Risk Weighted assets Risk Adjusted Value (Rupees in '000) Credit Risk Balance Sheet Items:- Cash and other liquid Assets 6,725, ,898 6,177, ,713 Money at call 1,390, , , ,440 Investments 47,547,395-13,596,093 - Loans and Advances 3,894,413 2,141,065 56,596 11,319 Fixed Assets 243, , , ,663 Other Assets 166, ,856 1,123,957 1,123,957 59,967,891 3,316,169 22,047,616 2,030,092 Off Balance Sheet items Loan Repayment Guarantees 40,828,251 9,269,224 16,143,672 1,614,367 Stand By Letters of Credit 162,078 21,450 26,945 1,081 Outstanding Foreign Exchange Contracts -Purchase 128,520, ,132 55,170, ,051 -Sale 127,786, ,931 45,939,105 91, ,297,126 10,725, ,280,382 1,811,377 Credit risk-weighted exposures 14,041,906 3,841,469 Market Risk General market risk 2,291, ,308 Specific market Risk - - Market risk-weighted exposures 2,291, ,308 Operational Risk 726, ,058 Total Risk-Weighted Exposures 17,059,844 4,432,835
26 33.2 Capital Structure Reconciliation Table: Balance sheet as in published financial statements Under regulatory scope of consolidation (Rupees in '000) Assets Cash and balances with treasury banks 4,462,227 4,462,227 Balanced with other banks 163, ,630 Lending to financial institutions 3,490,017 3,490,017 Investments 47,547,395 47,547,395 Advances 3,894,413 3,894,413 Operating fixed assets 243, ,293 Deferred tax assets 54,325 54,325 Other assets 2,189,505 2,189,505 Total assets 62,044,805 62,044,805 Liabilities & Equity Bills payable 172, ,309 Borrowings 40,028,520 40,028,520 Deposits and other accounts 14,986,537 14,986,537 Sub-ordinated loans - - Liabilities against assets subject to finance lease - - Deferred tax liabilities - - Other liabilities 3,162,092 3,162,092 Total liabilities 58,349,458 58,349,458 Head office capital account 3,802,007 3,802,007 Reserves - - Accumulated losses (70,240) (70,240) Surplus on revaluation of assets (36,420) (36,420) Total liabilities & equity 3,695,347 3,695,347 Table: Balance sheet as in published financial statements Under regulatory scope of consolidation (Rupees in '000) Assets Cash and balances with treasury banks 4,462,227 4,462,227 Balanced with other banks 163, ,630 Lending to financial institutions 3,490,017 3,490,017 Investments 47,547,395 47,547,395 of which: Non-significant capital investments in capital of other financial institutions exceeding 10% threshold - - a of which: significant capital investments in financial sector entities exceeding regulatory threshold - - b of which: Mutual Funds exceeding regulatory threshold - - c of which: reciprocal crossholding of capital instrument - - d of which: others (mention details) - - e Advances 3,894,413 3,894,413 shortfall in provisions/ excess of total EL amount over eligible provisions under IRB - - f general provisions reflected in Tier 2 capital - - g Fixed Assets 243, ,293 Deferred Tax Assets 54,325 54,325 of which: DTAs excluding those arising from temporary differences - - h of which: DTAs arising from temporary differences exceeding regulatory threshold - - i Other assets 2,189,505 2,189,505 of which: Goodwill - - j of which: Intangibles - - k of which: Defined-benefit pension fund net assets - - l Total assets 62,044,805 62,044,805 Reference
27 Table: Balance sheet as in published financial statements Under regulatory scope of consolidation Reference (Rupees in '000) Liabilities & Equity Bills payable 172, ,309 Borrowings 40,028,520 40,028,520 Deposits and other accounts 14,986,537 14,986,537 Sub-ordinated loans - - of which: eligible for inclusion in AT1 - - m of which: eligible for inclusion in Tier n Liabilities against assets subject to finance lease - - Deferred tax liabilities - - of which: DTLs related to goodwill - - o of which: DTLs related to intangible assets - - p of which: DTLs related to defined pension fund net assets - - q of which: other deferred tax liabilities - - r Other liabilities 3,162,092 3,162,092 Total liabilities 58,349,458 58,349,458 Share capital 3,802,007 3,802,007 of which: amount eligible for CET1 3,802,007 3,802,007 s of which: amount eligible for AT1 - - t Reserves - - of which: portion eligible for inclusion in CET1(provide breakup) - - u of which: portion eligible for inclusion in Tier v Unappropriated profit/ (losses) (70,240) (70,240) w Minority Interest - - of which: portion eligible for inclusion in CET1 - - x of which: portion eligible for inclusion in AT1 - - y of which: portion eligible for inclusion in Tier z Surplus on revaluation of assets (36,420) (36,420) of which: Revaluation reserves on Property - - of which: Unrealized Gains/Losses on AFS (36,420) (36,420) aa In case of Deficit on revaluation (deduction from CET1) - - ab Total liabilities & Equity 3,695,347 3,695,347 Table: Component of regulatory capital reported by Bank ('Rupees in '000) Source based on reference number from step 2 Common Equity Tier 1 capital (CET1): Instruments and reserves 1 Capital deposited with SBP 3,802,007 2 Balance in Share Premium Account - (s) 3 Reserve for issue of Bonus Shares - 4 General/ Statutory Reserves - 5 Gain/(Losses) on derivatives held as Cash Flow Hedge - (u) 6 Accumulated losses (70,240) (w) 7 Minority Interests arising from CET1 capital instruments issued to third party by (x) consolidated bank subsidiaries (amount allowed in CET1 capital of the consolidation group) - 8 CET 1 before Regulatory Adjustments 3,731,767 Common Equity Tier 1 capital: Regulatory adjustments 9 Goodwill (net of related deferred tax liability) - (j) - (o) 10 All other intangibles (net of any associated deferred tax liability) - (k) - (p) 11 Shortfall of provisions against classified assets - (f) 12 Deferred tax assets that rely on future profitability excluding those arising from temporary differences (net of related tax liability) - {(h) - (r} * x% 13 Defined-benefit pension fund net assets - {(l) - (q)} * x% 14 Reciprocal cross holdings in CET1 capital instruments - (d) 15 Cash flow hedge reserve - 16 Investment in own shares/ CET1 instruments - 17 Securitization gain on sale - 18 Capital shortfall of regulated subsidiaries - 19 Deficit on account of revaluation from bank's holdings of property/ AFS 36,420 (ab) 20 Investments in the capital instruments of banking, financial and insurance entities that are outside the scope of regulatory consolidation, where the bank does not own more than 10% of (a) - (ac) - (ae) the issued share capital (amount above 10% threshold) - 21 Significant investments in the capital instruments issued by banking, financial and insurance entities that are outside the scope of regulatory consolidation (amount above 10% threshold) (b) - (ad) - (af) - 22 Deferred Tax Assets arising from temporary differences (amount above 10% threshold, net of related tax liability) - (i) 23 Amount exceeding 15% threshold -
28 Table: Component of regulatory capital reported by Bank 24 of which: significant investments in the common stocks of financial entities - 25 of which: deferred tax assets arising from temporary differences - 26 National specific regulatory adjustments applied to CET1 capital - 27 Investment in TFCs of other banks exceeding the prescribed limit - 28 Any other deduction specified by SBP (mention details) - 29 Regulatory adjustment applied to CET1 due to insufficient AT1 and Tier 2 to cover deductions - 30 Total regulatory adjustments applied to CET1 (sum of 9 to 25) 36,420 Common Equity Tier 1 3,695,347 Source based on reference number from step 2 Additional Tier 1 (AT 1) Capital 31 Qualifying Additional Tier-1 instruments plus any related share premium - 32 of which: Classified as equity - (t) 33 of which: Classified as liabilities - (m) 34 Additional Tier-1 capital instruments issued by consolidated subsidiaries and held by third parties (amount allowed in group AT 1) - (y) 35 of which: instrument issued by subsidiaries subject to phase out - 36 AT1 before regulatory adjustments - Additional Tier 1 Capital: regulatory adjustments 37 Investment in mutual funds exceeding the prescribed limit (SBP specific adjustment) - 38 Investment in own AT1 capital instruments - 39 Reciprocal cross holdings in Additional Tier 1 capital instruments - 40 Investments in the capital instruments of banking, financial and insurance entities that are outside the scope of regulatory consolidation, where the bank does not own more than 10% of the issued share capital (amount above 10% threshold) - (ac) 41 Significant investments in the capital instruments issued by banking, financial and insurance entities that are outside the scope of regulatory consolidation - (ad) 42 Portion of deduction applied 50:50 to core capital and supplementary capital based on pre- Basel III treatment which, during transitional period, remain subject to deduction from tier-1 capital - 43 Regulatory adjustments applied to Additional Tier 1 due to insufficient Tier 2 to cover deductions 44 Total of Regulatory Adjustment applied to AT1 capital - 45 Additional Tier 1 capital - 46 Additional Tier 1 capital recognised for capital adequacy - Tier 1 Capital (CET1 + admissible AT1) 3,695,347 ('Rupees in '000) Tier 2 Capital 47 Qualifying Tier 2 capital instruments under Basel III - 48 Capital instruments subject to phase out arrangement from tier 2 (Pre-Basel III instruments) - (n) 49 Tier 2 capital instruments issued to third party by consolidated subsidiaries (amount allowed in group tier 2) - (z) 50 of which: instruments issued by subsidiaries subject to phase out - 51 General Provisions or general reserves for loan losses-up to maximum of 1.25% of Credit Risk Weighted Assets - (g) 52 Revaluation Reserves eligible for Tier 2-53 of which: portion pertaining to Property - 54 of which: portion pertaining to AFS securities - portion of (aa) 55 Foreign Exchange Translation Reserves - (v) 56 Undisclosed/Other Reserves (if any) - 57 T2 before regulatory adjustments - Tier 2 Capital: regulatory adjustments 58 Portion of deduction applied 50:50 to core capital and supplementary capital based on pre- Basel III treatment which, during transitional period, remain subject to deduction from tier-2 capital - 59 Reciprocal cross holdings in Tier 2 instruments - 60 Investment in own Tier 2 capital instrument - 61 Investments in the capital instruments of banking, financial and insurance entities that are outside the scope of regulatory consolidation, where the bank does not own more than 10% of the issued share capital (amount above 10% threshold) - (ae) 62 Significant investments in the capital instruments issued by banking, financial and insurance entities that are outside the scope of regulatory consolidation - (af) 63 Amount of Regulatory Adjustment applied to T2 capital - 64 Tier 2 capital (T2) - 65 Tier 2 capital recognised for capital adequacy - 66 Excess Additional Tier 1 capital recognised in Tier 2 capital - 67 Total Tier 2 capital admissible for capital adequacy - TOTAL CAPITAL (T1 + admissible T2) 3,695,347
29 33.3 Main Features Template of Regulatory Capital Instruments Disclosure template for main features of regulatory capital instruments Main Features Common Shares 1 Issuer NA 2 Unique identifier (eg KSE Symbol or Bloomberg identifier etc.) NA 3 Governing law(s) of the instrument NA Regulatory treatment NA 4 Transitional Basel III rules NA 5 Post-transitional Basel III rules NA 6 Eligible at solo/ group/ group&solo NA 7 Instrument type NA 8 Amount recognised in regulatory capital (Currency in PKR thousands, as of reporting date) NA 9 Par value of instrument NA 10 Accounting classification NA 11 Original date of issuance NA 12 Perpetual or dated NA 13 Original maturity date NA 14 Issuer call subject to prior supervisory approval NA 15 Optional call date, contingent call dates and redemption amount NA 16 Subsequent call dates, if applicable NA Coupons / dividends NA 17 Fixed or floating dividend/ coupon NA 18 coupon rate and any related index/ benchmark NA 19 Existence of a dividend stopper NA 20 Fully discretionary, partially discretionary or mandatory NA 21 Existence of step up or other incentive to redeem NA 22 Noncumulative or cumulative NA 23 Convertible or non-convertible NA 24 If convertible, conversion trigger (s) NA 25 If convertible, fully or partially NA 26 If convertible, conversion rate NA 27 If convertible, mandatory or optional conversion NA 28 If convertible, specify instrument type convertible into NA 29 If convertible, specify issuer of instrument it converts into NA 30 Write-down feature NA 31 If write-down, write-down trigger(s) NA 32 If write-down, full or partial NA 33 If write-down, permanent or temporary NA 34 If temporary write-down, description of write-up mechanism NA 35 Position in subordination hierarchy in liquidation (specify instrument type immediately senior to NA instrument 36 Non-compliant transitioned features NA 37 If yes, specify non-compliant features NA
30 33.4 CAPITAL-ASSESSMENT AND ADEQUACY BASEL III SPECIFIC Scope of Applications According to BSD Circular No. 7 dated April 15, 2009 of SBP, the branches of foreign banks operating with 1 to 5 branches are required to raise their assigned capital (free of losses) to Rs.3 billion latest by December 31, 2013 subject to the condition that their head offices have paid-up capital (free of losses) amounting to at least USD 300 million and have a Capital Adequacy Ratio (CAR) of at least 8% or minimum prescribed by their home regulators, whichever is higher. Further, the SBP requires that banks in Pakistan should maintain regulatory capital for credit, market, and operational risks, the amount of which should at least be equal to 10% of their risk weighted assets. The Bank calculates capital requirement as per Basel III regulatory framework, using the following approaches: Risk Type Credit Market Operational Approach Standardised approach Standardised approach Basic Indicator approach Total regulatory capital should be at least 10 % of risk-weighted assets and the Bank's capital adequacy ratio is 21.90%. Credit Risk Capital Requirements Risk Weighted Assets (Rupees in '000) Portfolios subject to standardized approach (Simple or Comprehensive) Banks 29,439 5,895 2,943, ,473 All other assets 3,722 14, ,228 1,440,621 Off balance sheet - non-market related exposure 92,907 16,154 9,290,694 1,615,447 Off balance sheet - market related exposure 14,351 1,959 1,435, ,929 Market Risk Capital Requirement for portfolios subject to Standardized Approach Foreign exchange risk 22,916 3,493 2,291, ,308 Operational Risk Capital Requirement for operational risks 7,264 2, , ,057 TOTAL 170,598 44,328 17,059,844 4,432,835 Capital Adequacy Ratio (Rupees in '000) Total eligible regulatory capital held (Note: 33) (e) 3,695,347 3,145,161 Total Risk Weighted Assets (Note: 33.1) (i) 17,059,844 4,432,835 Capital Adequacy Ratio (e) / (i) 21.66% 70.95%
31 34 RISK MANAGEMENT The primary objective of the Risk Management System is to safeguard the branches capital, its financial resources and profitability from various risks. The branches risk management policies are designed to identify and analyse all risks, to set appropriate risk limits and controls, to measure and monitor the same through reliable Management Information System. This section presents information about the branches exposure to, and its management and control of, risks, in particular the primary risks associated with its use of financial instruments. Most of the functions specified below have been performed at head office level Credit risk Credit Risk Management processes encompass identification, assessment, measurement, monitoring and control of the credit exposures. In the Bank's experience, a key to effective credit risk management is a well thought out business strategy. The branches focus over the coming years will be to further enhance risk models, processes and systems infrastructure, in line with its ambition to bring maximum sophistication to the risk management function. The branches, as per State Bank of Pakistan Guidelines, calculated its Capital Adequacy Ratio (CAR) based on the SBP Guidelines on Basel III. Processes have been set for fine-tuning the systems & procedures, information technology capabilities and risk governance structure to meet the requirements of the advanced approaches as well. The Head Office has delegated responsibility for the management of credit risk to the credit committee which is responsible for the oversight of the branches' credit risk in respect of: - Formulating credit policies - Establishing the authorisation structure - Reviewing and assessing credit risk - Limiting concentration of exposure to counterparties - Developing and maintaining the Bank's risk grading - Reviewing compliance of business units - Providing advice, guidance and specialist skills to promote best practice in the management of credit risk. The branches have built-up and maintained a sound loan portfolio in terms of well-defined Credit Policy. Its credit evaluation system comprises of well-designed credit appraisal, sanctioning and review procedures for the purpose of emphasizing prudence in lending activities and ensuring the high quality of asset portfolio. As part of prudent practices, the management conducts pre-fact validation of major cases from integrated risk point of view. The Bank manages its portfolio of loan assets with a view to limit concentrations in terms of risk quality, geography, industry, maturity and large exposure Credit Risk - General Disclosures Basel II Specific The branches are using The Standardised Approach (TSA) of SBP Basel II accord for the purpose of estimating Credit Risk Weighted Assets. Under TSA, banks are allowed to take into consideration external rating(s) of counter-party(s) for the purpose of calculating Risk Weighted Assets Disclosures for portfolio subject to the Standardised Approach & Supervisory risk weights in the IRB Approach-Basel II specific External ratings SBP Basel II guidelines require banks to use ratings assigned by specified External Credit Assessment Agencies (ECAIs) namely PACRA, JCR-VIS, Moodys, Fitch and Standard & Poors. The branches use external ratings for the purposes of computing the risk weights as per the Basel II framework. For exposures with a contractual maturity of less than or equal to one year, short-term rating given by approved Rating Agencies is used, whereas for long-term exposure with maturity of greater than one year, long-term rating is used. Where there are two ratings available, the lower rating is considered and where there are three or more ratings the second - lowest rating is considered Disclosures with respect to Credit Risk Mitigation for Standardised and IRB approaches-basel II specific Credit risk mitigation policy The branches define collateral as the assets or rights provided to the Bank by the borrower or a third party in order to secure a credit facility. The branches would have the rights of secured creditor in respect of the assets / contracts offered as security for the obligations of the borrower / obligor Collateral valuation and management As stipulated in the SBP Basel II guidelines, the branches use the comprehensive approach for collateral valuation. Under this approach, the Bank reduces its credit exposure to a counterparty when calculating its capital requirements to the extent of risk mitigation provided by the eligible financial collateral as specified in the Basel II guidelines. In line with Basel II guidelines, the branches make adjustments in eligible collaterals received for possible future fluctuations in the value of the collateral in line with the requirements specified by SBP guidelines. These adjustments, also referred to as haircuts, to produce volatility-adjusted amounts for collateral, are reduced from the exposure to compute the capital charge based on the applicable risk weights Types of collateral taken by the branches The branches determine the appropriate collateral for each facility based on the type of product and counterparty. In case of corporate and small and medium enterprises financing, fixed assets are generally taken as security for long tenor loans and current assets for working capital finance usually backed by mortgage or hypothecation. For project finance, security of the assets of the borrower and assignment of the underlying project contracts is generally obtained. Additional security such as pledge of shares, cash collateral, TDRs, SSC/DSCs, charge on receivables may also be taken. Moreover, in order to cover the entire exposure Personal Guarantees of Directors / Borrowers are also obtained by the Bank. The decision on the type and quantum of collateral for each transaction is taken by the credit approving authority as per the approved credit approval authorisation. For facilities provided as per approved product policies, collateral is taken in line with the policy Types of eligible financial collateral For credit risk mitigation purposes, the branches consider all types of financial collaterals that are eligible under SBP Basel II accord. This includes Cash / TDRs, Gold, securities issued by Government of Pakistan such as T-Bills and PIBs, National Savings Certificates, certain debt securities rated by a recognised credit rating agency, mutual fund units where daily Net Asset Value (NAV) is available in public domain and guarantees from certain specified entities. In general, for Capital calculation purposes, in line with the SBP Basel II requirements, the Bank recognises only eligible collaterals as mentioned in the SBP Basel II accord Credit concentration risk Credit concentration risk arises mainly due to concentration of exposures under various categories viz. industry, geography, and single/group borrower. Within credit portfolio, as a prudential measure aimed at better risk management and avoidance of concentration of risks, the SBP has prescribed regulatory limits on banks maximum exposure to single borrower and group borrowers.
32 34.2 Segments by class of business 2013 *Contingencies and Advances Deposits Commitments (Rupees Percent (Rupees Percent (Rupees Percent in '000) in '000) in '000) Mining and Quarrying , Textile 387, , Electronics and electrical appliances 923, , ,127, Construction - - 1,450, ,946, Comunication - - 3,851, ,653, Power (electricity), Gas, Water, Sanitary 2,000, ,839, Wholesale and Retail Trade 539, , Exports/Imports ,485, Transport, Storage and Communication , Financial , Individuals , Others 44, ,201, ,771, ,894, ,986, ,990, *Contingencies and Advances Deposits Commitments (Rupees Percent (Rupees Percent (Rupees Percent in '000) in '000) in '000) Mining and Quarrying 42, , Construction , , Power (electricity), Gas, Water, Sanitary , , Wholesale and Retail Trade , Transport, Storage and Communication , Services , ,564, Individuals , Others 13, ,675, ,701, , ,167, ,143, * Contingent liabilities for the purpose of this note are presented at cost and include transaction and trade related contingent liabilities Segment by sector 2013 *Contingencies and Advances Deposits Commitments (Rupees Percent (Rupees Percent (Rupees Percent in '000) in '000) in '000) Public/ Government 2,000, Private 1,894, ,986, ,990, ,894, ,986, ,990, *Contingencies and Advances Deposits Commitments (Rupees Percent (Rupees Percent (Rupees Percent in '000) in '000) in '000) Public/ Government ,756, Private 56, ,167, ,387, , ,167, ,143, GEOGRAPHICAL SEGMENT ANALYSIS (Loss) / Profit before taxation Total assets employed 2013 Net assets employed (Rupees in '000) *Contingencies and commitments Pakistan 259,691 62,044,805 3,695,347 42,990, (Loss) / Profit before taxation Total assets employed Net assets employed *Contingencies and commitments (Rupees in '000) Pakistan (180,307) 3,279,813 3,148,701 16,143,672
33 34.5 Market risk Market risk is the risk of loss arising from movement in market variables including observable variables such as interest rates, exchange rates and equity indices, and others which may be only indirectly observable such as volatilities and correlations. The branches' policy is that all market risk taking activity is undertaken within approved market risk limits, and that the branches' standards/ guiding principles are upheld at all times. Market Risk Management is an independent control function with clear segregation of duty and reporting line with the business-line. Its main responsibility is to ensure that the risk-taking units manage the Bank's market risk exposure within a robust market risk framework and within the Bank's risk appetite. The Bank's standard systems are used to furnish senior trading and Market Risk staff with risk exposures. All trading activities and any business proposal that commit or may commit the Bank (legally or morally) to deliver risk sensitive products require approval by independent authorised risk professionals or committees, prior to commitment Foreign exchange risk Foreign exchange risk arises from the fluctuation in the value of financial instruments consequent to the changes in foreign exchange rates. The Bank manages this risk by setting and monitoring dealer, currency and counter-party limits for on and off-balance sheet financial instruments. FX risk is mainly managed through matched positions. Unmatched positions are covered substantially through derivative instruments such as Forwards and Swaps. The currency risk is regulated and monitored against the regulatory/statutory limits enforced by the State Bank of Pakistan. The foreign exchange exposure limits in respective currencies are managed against the prescribed limits. The analysis below represents the concentration of the Bank's foreign currency risk for on and off balance sheet financial instruments: 2013 Assets Liabilities Off-balance Net foreign sheet items currency exposure (Rupees in '000) Pakistan Rupee 55,309,947 6,464,450 (44,545,669) 4,299,828 United States Dollar 5,323,231 17,299,162 11,127,305 (848,626) Great Britain Pound Japanese Yen Euro 2,707 34,108,630 34,018,634 (87,289) Chinese Yuan 1,408, ,216 (600,270) 331,349 Total foreign currency exposure 6,734,858 51,885,008 44,545,669 (604,481) Total currency exposure 62,044,805 58,349,458-3,695, Assets Liabilities Off-balance Net foreign sheet items currency exposure (Rupees in '000) Pakistan Rupee 14,678,497 6,208,848 (9,523,080) 8,469,649 United States Dollar 7,360,896 1,968,651 (1,247,503) 5,392,245 Great Britain Pound Japanese Yen Euro 60 10,254,344 10,623,560 (10,254,284) Chinese Yuan 8, , ,023 (458,909) Total foreign currency exposure 7,369,119 12,690,067 9,523,080 (5,320,948) Total currency exposure 22,047,616 18,898,915-3,148, Interest rate risk The interest rate risk arises from the fluctuation in the value of financial instruments consequent to changes in market interest rates. The branches are exposed to interest rate risk as a result of mismatches or gaps in the amounts of assets and liabilities and off-balance sheet instruments that mature or are re-priced in a given period. In order to ensure that this risk is managed within acceptable limits, branches' Asset and Liability Management Committee (ALCO) monitors various gap limits and re-pricing of the assets and liabilities on a regular basis.
34 Mismatch of interest rate sensitive financial assets and financial liabilities Effective Yield / Interest rate On-balance sheet financial instruments % Total 2013 Exposed to yield Interest Risk Over 1 Over 3 Over 6 Over 1 Over 2 Over 3 Over 5 Up to 1 to 3 to 6 Months to 2 to 3 to 5 to 10 Above Month Months Months to 1 Year Years Years Years Years 10 Years Non-interest bearing financial instruments Assets Cash and balances with treasury banks - 4,462, ,462,227 Balances with other banks , , Lendings to financial institutions ,490,017 2,559, , , Investments - net ,547,395 25,101,430 5,382,069 17,063, Advances - net ,894, ,430 2,674, , , Other assets - 2,114, ,114,895 61,672,577 27,980,731 8,743,389 17,541, , ,577,122 Liabilities Bills payable - 172, ,309 Borrowings ,028,520 23,128,004-16,900, Deposits and other accounts ,986,537 8,374,566 3,865, , ,625,997 Other liabilities - 3,101,540 2,608, , , , ,288,906 34,110,628 4,038,863 17,169, , ,798,306 On-balance sheet gap 3,383,671 (6,129,897) 4,704, , , ,778,816 Off-balance sheet financial instruments Forward exchange contracts - purchase 128,520,658 62,526,741 33,680,954 2,420,705 29,892, Forward exchange contracts - sale 127,786,139 61,800,509 33,678,953 2,419,952 29,886, Off-balance sheet gap 734, ,232 2, , Total Yield / Interest Risk Sensitivity Gap (5,403,665) 4,706, , ,869 Cumulative Yield / Interest Risk Sensitivity gap (5,403,665) (697,138) (324,495) 339,374
35 Exposed to yield Interest Risk Over 1 Over 3 Over 6 Over 1 Over 2 Over 3 Over 5 Up to 1 to 3 to 6 Months to 2 to 3 to 5 to 10 Above Month Months Months to 1 Year Years Years Years Years 10 Years % On-balance sheet financial instruments Assets Cash and balances with treasury banks - 4,063, , ,506,910 Balances with other banks ,336,371 1,336, Lendings to financial institutions ,554, , , Investments - net ,596,093 7,261,158 1,337,631 4,997, Advances - net ,596 7,573 42,013 7, Other assets - 1,088, ,996 46, ,274 21,695,807 9,161,733 2,967,837 5,828,053 3,738,184 Liabilities Bills payable Borrowings ,221,381 1,967,037-10,254, Deposits and other accounts ,167,644 3,294, ,832 Other liabilities - 2,393,042 2,059, , , ,782,805 7,320, ,974 10,381, ,570 On-balance sheet gap 2,913,002 1,840,862 2,760,863 (4,553,337) ,864,614 Off-balance sheet financial instruments Effective Yield / Interest rate Total Forward exchange contracts - purchase 55,170,660 4,211,327 10,258,298 35,435,683 5,265, Forward exchange contracts - sale 45,939,105 3,954,761 9,782,406 26,830,892 5,371, Off-balance sheet gap 9,231, , ,892 8,604,791 (105,694) Total Yield / Interest Risk Sensitivity Gap 2,097,428 3,236,755 4,051,454 (105,694) Cumulative Yield / Interest Risk Sensitivity gap 2,097,428 5,334,183 9,385,637 9,279, Reconciliation of Assets and Liabilities exposed to yield / interest rate risk with Total Assets and Liabilities (Rupees '000) Total financial assets as per note ,672,577 21,695,807 Add: Non financial assets Operating fixed assets 243, ,663 Deferred tax assets 54,325 - Other Assets 74,610 35,146 Total assets as per statement of financial position 62,044,805 22,047,616 Total liabilities as per note ,288,906 18,782,805 Add: Non financial liabilities Other liabilities 60, ,110 Total liabilities as per statement of financial position 58,349,458 18,898, Non-interest bearing financial instruments
36 34.8 Liquidity risk Liquidity risk is the risk that the branches will be unable to meet their net funding requirements. Liquidity risk can be caused by market destruction of credit downgrades, which may cause certain sources of fundings to become unavailable. To guard against this risk the branches' assets are managed with liquidity in mind, maintaining a healthy balance of cash, cash equivalents and readily marketable securities. The maturity profile is monitored to ensure adequate liquidity is maintained. The table below summarises the maturity profile of the branches assets and liabilities. The contractual maturities of assets and liabilities at the year end have been determined on the basis of the remaining period at the balance sheet date to the contractual maturity date and do not take account of the effective maturities as indicated by the branches deposit retention history and the availability of liquid funds. Assets and liabilities not having a contractual maturity are assumed to mature on the expected date on which the assets /liabilities will be realised / settled Maturities of assets and liabilities - based contractual maturity of the branches Total Up to 1 month Over 1 to 3 Months Over 3 to 6 Months 2013 Over 6 Months to 1 Year Over 1 to 2 Years Over 2 to 3 Years Over 3 to 5 Years Over 5 to 10 Years Above 10 Years Assets (Rupees in '000) Cash and balances with treasury banks 4,462,227 49, ,413,099 Balances with other banks 163, , Lendings to financial institutions 3,490,017 2,559, , , Investments - net 47,547,395 25,101,430 5,382,069 17,063, Advances - net 3,894, ,430 2,674, , , Operating fixed assets 243, , Deferred tax assets 54, , Other assets 2,189,505 1,879,058 5,402 22, , ,044,805 29,908,917 8,748,791 17,563,538 1,167, , ,413,099 Liabilities Bills payable 172, , Borrowings 40,028,520 23,128,004-16,900, Deposits and other accounts 14,986,537 11,000,563 3,865, , Other liabilities 3,162, , , ,929 2,509, ,349,458 34,631,978 4,038,863 17,169,445 2,509, Net assets 3,695,347 (4,723,061) 4,709, ,093 (1,342,005) - 243, ,413,099 Head Office-capital account 3,802,007 Accumulated loss (70,240) Surplus on revaluation of asset - net -36,420 3,695,347
37 2012 Total Up to 1 month Over 1 to 3 Over 3 to 6 Over 6 Months Over 1 to 2 Over 2 to 3 Months Months to 1 Year Years Years Over 3 to 5 Years Over 5 to 10 Years Above 10 Years Assets (Rupees in '000) Cash and balances with treasury banks 4,063, , ,506,910 Balances with other banks 1,336,371 1,336, Lending to financial institutions 1,554, , , Investments - net 13,596,093 7,261,158 1,337,631 4,997, Advances - net 56,596 7,573 42,013 7, Operating fixed assets 316, ,663 Deferred tax assets Other assets 1,123, ,996 46, ,420 22,047,616 9,161,733 2,967,837 5,828, ,089,993 Liabilities Bills payable Borrowings 12,221,381 1,967,037-10,254, Deposits and other accounts 4,167, , ,289 2,725, Sub-ordinated loans Liabilities against assets subject to finance lease Other liabilities 2,509, , , , ,350,400 18,898,915 3,650, ,974 10,965,679 2,725, ,350,400 Net assets 3,148,701 5,511,076 2,760,863 (5,137,626) (2,725,205) ,739,593 Head Office-capital account 3,506,910 Accumulated loss (364,645) Surplus on revaluation of asset - net 6,436 3,148,701

38
39
CONTINGENCIES AND COMMITMENTS 24. The annexed notes 1 to 48 and Annexures I to IV form an integral part of these financial statements.
 FAYSAL BANK LIMITED STATEMENT OF FINANCIAL POSITION AS AT DECEMBER 31, 2014 Note 2014 2013 -------------- Rupees '000 ------------- ASSETS Cash and balances with treasury banks 8 20,285,851 28,422,497
MCB Bank Limited Financial Statements For the year ended December 31, 2017
 MCB Bank Limited Financial Statements For the year ended December 31, 2017 MCB BANK LIMITED UNCONSOLIDATED STATEMENT OF FINANCIAL POSITION AS AT DECEMBER 31, 2017 Note 2017 2016 ASSETS Cash and balances
MCB Bank Limited Financial Statements For the year ended December 31, 2012
 MCB Bank Limited Financial Statements For the year ended December 31, 2012 MCB BANK LIMITED STATEMENT OF FINANCIAL POSITION AS AT DECEMBER 31, 2012 ASSETS Note 2012 2011 Cash and balances with treasury
UNCONSOLIDATED FINANCIAL STATEMENTS FOR THE YEAR ENDED DECEMBER 31, 2016.
 UNCONSOLIDATED FINANCIAL STATEMENTS FOR THE YEAR ENDED DECEMBER 31, 2016. UNCONSOLIDATED STATEMENT OF FINANCIAL POSITION AS AT DECEMBER 31, 2016 ASSETS Note 2016 2015 Cash and balances with treasury banks
Bank AL Habib Limited
 Consolidated Financial Statements Bank AL Habib Limited and Subsidiary Companies 89 Bank AL Habib Limited and its Subsidiary Companies Directors Report on Audited Consolidated Financial Statements The
Note (Restated) ASSETS (Restated)
 ASSETS (Restated)") HABIB BANK LIMITED CONSOLIDATED STATEMENT OF FINANCIAL POSITION AS AT DECEMBER 31, 2013 2013 2012 Note 2013 2012 (US $ in '000) (Rupees in '000) (Restated) ASSETS (Restated) 1,286,278 1,492,809 Cash and
HABIB BANK LIMITED CONSOLIDATED STATEMENT OF FINANCIAL POSITION AS AT DECEMBER 31, 2013 2013 2012 Note 2013 2012 (US $ in '000) (Rupees in '000) (Restated) ASSETS (Restated) 1,286,278 1,492,809 Cash and
NET ASSETS 8,681,209 8,991,586
 CITIBANK, N.A. - PAKISTAN BRANCHES (INCORPORATED IN THE U.S.A. THE LIABILITY OF MEMBERS BEING LIMITED) CONDENSED INTERIM STATEMENT OF FINANCIAL POSITION AS AT JUNE 30, 2013 ASSETS Note 31, 2013 2012 Cash
Home Remittances NBP. Home Remittance Services. NBP Foree Cash
 NBP Home Remittances Home Remittance Services Free of Charge remittance services NBP Foree Remittance services available in all over 1280 branches across Pakistan One of the largest overseas correspondent
7,875,278 9,583,676 46,707,366 76,204,631 NET ASSETS 9,441,115 8,991,586
 CITIBANK, N.A. - PAKISTAN BRANCHES (INCORPORATED IN THE U.S.A. THE LIABILITY OF MEMBERS BEING LIMITED) CONDENSED INTERIM STATEMENT OF FINANCIAL POSITION AS AT MARCH 31, 2013 Note March 31, December 31,
Auditors Report to the Members
 Auditors Report to the Members We have audited the annexed consolidated financial statements comprising consolidated statement of financial position of Habib Bank Limited as at December 31, 2010 and the
Auditors Report to the Members
 Auditors Report to the Members We have audited the annexed unconsolidated balance sheet of Habib Bank Limited as at December 31, 2008 and the related unconsolidated profit and loss account, unconsolidated
Bank AL Habib Limited
 Consolidated Financial Statements Bank AL Habib Limited and Subsidiary Companies 90 Bank AL Habib Limited and its Subsidiary Companies Directors Report on Audited Consolidated Financial Statements The
(Un-audited) (Audited) Note June 30, December 31, (Rupees in '000) ASSETS
 (Audited) Note June 30, December 31, (Rupees in '000) ASSETS") CITIBANK, N.A. - PAKISTAN BRANCHES (INCORPORATED IN THE U.S.A. THE LIABILITY OF MEMBERS BEING LIMITED) CONDENSED INTERIM STATEMENT OF FINANCIAL POSITION AS AT JUNE 30, 2011 ASSETS Note June 30, December
CITIBANK, N.A. - PAKISTAN BRANCHES (INCORPORATED IN THE U.S.A. THE LIABILITY OF MEMBERS BEING LIMITED) CONDENSED INTERIM STATEMENT OF FINANCIAL POSITION AS AT JUNE 30, 2011 ASSETS Note June 30, December
Gazipura Securities & Services (Private) Ltd Financial Statements For the year ended June 30, 2017
 Ltd Financial Statements For the year ended June 30, 2017") Gazipura Securities & Services (Private) Ltd Financial Statements For the year ended June 30, 2017 Financial Statements Contents Page No. Directors' Report 1 Auditor's Report 2-3 Balance Sheet 4 Profit
Gazipura Securities & Services (Private) Ltd Financial Statements For the year ended June 30, 2017 Financial Statements Contents Page No. Directors' Report 1 Auditor's Report 2-3 Balance Sheet 4 Profit
INDUSTRIAL AND COMMERCIAL BANK OF CHINA LIMITED - PAKISTAN BRANCHES CONDENSED INTERIM STATEMENT OF FINANCIAL POSITION AS AT 30 SEPTEMBER 2012
 1 CONDENSED INTERIM STATEMENT OF FINANCIAL POSITION AS AT 30 SEPTEMBER 2012 ASSETS 31 Dec Note 2012 2011 (Un-Audited) (Audited) Cash and balances with treasury banks 4,197,760 3,279,813 Balances with other
AUDITORS REPORT TO THE MEMBERS
 CONSOLIDATED ACCOUNTS 113 AUDITORS REPORT TO THE MEMBERS FOR THE YEAR ENDED 31 DECEMBER 2012 We have audited the annexed consolidated financial statements comprising consolidated statement of financial
the expenditure incurred during the year was for the purpose of the Bank s business; and
 A.F. FERGUSON & CO CHARTERED ACCOUNTANTS State Life Building No.1-C, I.I. Chundrigar Road, Karachi KPMG TASEER HADI & CO. CHARTERED ACCOUNTANTS Sheikh Sultan Trust Building No. 2, Beaumont Road, Karachi
ZTBL UNCONSOLIDATED FINANCIAL STATEMENTS
 UNCONSOLIDATED FINANCIAL STATEMENTS BDO Ebrahim & Co. Chartered Accountants 3 rd Floor, Saeed Plaza 22-East Blue Area Islamabad -44000 Pakistan Riaz Ahmad & Company Chartered Accountants 2-A, ATS Centre,
AUDITORS REPORT TO THE MEMBERS
 A. F. FERGUSON & CO. Chartered Accountants State Life Building 1-C I. I. Chundrigar Road Karachi KPMG TASEER HADI & CO. Chartered Accountants Sheikh Sultan Trust Building No. 2 Beaumont Road Karachi AUDITORS
ALBARAKA BANK (PAKISTAN) LIMITED STATEMENT OF FINANCIAL POSITION AS AT 31 DECEMBER 2011
 LIMITED STATEMENT OF FINANCIAL POSITION AS AT 31 DECEMBER 2011") STATEMENT OF FINANCIAL POSITION AS AT 31 DECEMBER 2011 Note 2011 2010 ----------(Rupees '000)---------- 6 Restated ASSETS Cash and balances with treasury banks 7 3,945,481 4,460,257 Balances with other
STATEMENT OF FINANCIAL POSITION AS AT 31 DECEMBER 2011 Note 2011 2010 ----------(Rupees '000)---------- 6 Restated ASSETS Cash and balances with treasury banks 7 3,945,481 4,460,257 Balances with other
NET ASSETS 985,018, ,847,755
 BALANCE SHEET AS AT 31 DECEMBER 2012 Note 2012 2011 ASSETS Cash and balances with SBP and NBP 6 375,433,751 355,511,274 Balances with other banks/nbfis/mfbs 7 945,582,061 729,156,395 Lending to financial
For the main features of capital structure of the Company, please refer to Annex Note1.2.1
 1 CAPITAL ADEQUACY 1.1 Scope of application The Basel III framework has been applied in accordance with BPRD Circular No. 6, dated 15 August, 2013. The Standardized Approach is used for calculating the
IGI Income Fund. Financial Statements for the year ended 30 June 2011
 IGI Income Fund Financial Statements for the year ended 30 June 2011 IGI Income Fund Statement of Assets and Liabilities As at 30 June 2011 Note 2011 2010 Assets Bank balances 4 69,355,569 385,846,626
 Unconsolidated Balance Sheet As at December 31, 2009 2009 2008 Note 2009 2008 (US $ in '000) ASSETS 944,037 669,021 Cash and balances with treasury banks 5 79,527,191 56,359,367 350,899 388,411 Balances
MCB Bank Limited Un-consolidated Condensed Interim Financial Information for the nine months period ended September 30, 2016
 MCB Bank Limited Un-consolidated Condensed Interim Financial Information for the nine months period 30, 2016 MCB Bank Limited Unconsolidated Condensed Interim Statement of Financial Position As at 30,
Auditors Report to the Members
 Auditors Report to the Members We have audited the annexed unconsolidated statement of financial position of Habib Bank Limited as at December 31, 2010 and the related unconsolidated profit and loss account,
AUDITORS REPORT TO THE MEMBERS
 A.F. FERGUSON & CO CHARTERED ACCOUNTANTS State Life Building No.1-C, I.I. Chundrigar Road, Karachi KPMG TASEER HADI & CO. CHARTERED ACCOUNTANTS Sheikh Sultan Trust Building No. 2, Beaumont Road, Karachi
Habib Metropolitan Bank (Subsidiary of Habib Bank AG Zurich)
") Habib Metropolitan Bank (Subsidiary of Habib Bank AG Zurich) CONSOLIDATED ACCOUNTS 68 AUDITORS REPORT TO THE MEMBERS We have audited the annexed consolidated financial statements comprising consolidated
Habib Metropolitan Bank (Subsidiary of Habib Bank AG Zurich) CONSOLIDATED ACCOUNTS 68 AUDITORS REPORT TO THE MEMBERS We have audited the annexed consolidated financial statements comprising consolidated
MCB Bank Limited Financial Statements For the year ended December 31, 2014
 MCB Bank Limited Financial Statements For the year ended December 31, 2014 MCB BANK LIMITED UNCONSOLIDATED STATEMENT OF FINANCIAL POSITION AS AT DECEMBER 31, 2014 Note 2014 2013 ASSETS (Rupees in thousand)
GAPCO KENYA LIMITED. Gapco Kenya Limited
 297 Gapco Kenya Limited 298 GAPCO KENYA LIMITED Independent Auditor s Report INDEPENDENT AUDITORS REPORT TO THE MEMBERS OF GAPCO KENYA LIMITED Report on the Financial Statements We have audited the accompanying
CONDENSED INTERIM UNCONSOLIDATED FINANCIAL STATEMENTS. For the nine months ended September 30, 2018
 CONDENSED INTERIM UNCONSOLIDATED FINANCIAL STATEMENTS For the nine months ended September 30, 2018 HABIB BANK LIMITED CONDENSED INTERIM UNCONSOLIDATED STATEMENT OF FINANCIAL POSITION AS AT SEPTEMBER 30,
Saudi ORIX Leasing Company (Closed Joint Stock Company)
") Saudi ORIX Leasing Company (Closed Joint Stock Company) FINANCIAL STATEMENTS 31 DECEMBER 2014 Together with Independent Auditor s Report 1. CORPORATE INFORMATION Saudi ORIX Leasing Company (the
Saudi ORIX Leasing Company (Closed Joint Stock Company) FINANCIAL STATEMENTS 31 DECEMBER 2014 Together with Independent Auditor s Report 1. CORPORATE INFORMATION Saudi ORIX Leasing Company (the
CONDENSED INTERIM CONSOLIDATED FINANCIAL STATEMENTS. For the nine months ended September 30, 2018
 CONDENSED INTERIM CONSOLIDATED FINANCIAL STATEMENTS For the nine months ended HABIB BANK LIMITED CONDENSED INTERIM CONSOLIDATED STATEMENT OF FINANCIAL POSITION AS AT SEPTEMBER 30, 2018 ASSETS (Unaudited)
SAMBA FINANCIAL GROUP
 SAMBA FINANCIAL GROUP CONSOLIDATED FINANCIAL STATEMENTS AND AUDITORS REPORT FOR THE YEAR ENDED DECEMBER 31, STATEMENTS OF CONSOLIDATED COMPREHENSIVE INCOME For the years ended December 31, and
UNITED BANK FOR AFRICA PLC. Consolidated Financial Statements for the Quarter Ended 31 March 2014 (Un-audited )
") Consolidated Financial Statements for the Quarter Ended 31 March 2014 (Un-audited ) NOTES TO THE FINANCIAL STATEMENTS UNITED BANK FOR AFRICA PLC SIGNIFICANT ACCOUNTING POLICIES 1 (i) Basis of preparation
Consolidated Financial Statements for the Quarter Ended 31 March 2014 (Un-audited ) NOTES TO THE FINANCIAL STATEMENTS UNITED BANK FOR AFRICA PLC SIGNIFICANT ACCOUNTING POLICIES 1 (i) Basis of preparation
UNITED BANK FOR AFRICA PLC
 UNITED BANK FOR AFRICA PLC Consolidated Financial Statements for the nine months ended 30 September 2015 UNITED BANK FOR AFRICA PLC NOTES TO THE FINANCIAL STATEMENTS UNITED BANK FOR AFRICA PLC SIGNIFICANT
BANK VTB (AZERBAIJAN) OPEN JOINT STOCK COMPANY
 OPEN JOINT STOCK COMPANY") BANK VTB (AZERBAIJAN) OPEN JOINT STOCK COMPANY The International Financial Reporting Standards Financial Statements and Independent Auditors Report For the Year Ended 2010 TABLE OF CONTENTS Page STATEMENT
BANK VTB (AZERBAIJAN) OPEN JOINT STOCK COMPANY The International Financial Reporting Standards Financial Statements and Independent Auditors Report For the Year Ended 2010 TABLE OF CONTENTS Page STATEMENT
SAMBA FINANCIAL GROUP
 SAMBA FINANCIAL GROUP CONSOLIDATED FINANCIAL STATEMENTS AND AUDITORS REPORT FOR THE YEAR ENDED DECEMBER 31, 7778z7878 STATEMENTS OF CONSOLIDATED COMPREHENSIVE INCOME For the years ended December 31,
KPMG Taseer Hadi & Co. Chartered Accountants Sheikh Sultan Trust Building No. 2 Beaumont Road Karachi, Pakistan
 KPMG Taseer Hadi & Co. Chartered Accountants Sheikh Sultan Trust Building No. 2 Beaumont Road Karachi, 75530 Pakistan Auditors' Report to the Directors Telephone + 92 (21) 3568 5847 Fax + 92 (21) 3568
GAPCO UGANDA LIMITED. Gapco Uganda Limited
 GAPCO UGANDA LIMITED 357 Gapco Uganda Limited 358 GAPCO UGANDA LIMITED Independent Auditors Report TO THE MEMBERS OF GAPCO UGANDA LIMITED Report on the Financial Statements We have audited the accompanying
UNITED BANK FOR AFRICA PLC
 Consolidated Financial Statements for the three months ended 31 March 2015 NOTES TO THE FINANCIAL STATEMENTS UNITED BANK FOR AFRICA PLC SIGNIFICANT ACCOUNTING POLICIES 1 Reporting entity United Bank for
ZAO Bank Credit Suisse (Moscow) Financial Statements for the year ended 31 December 2010
 Financial Statements for the year ended 31 December 2010") Financial Statements for the year ended 31 December 2010 Contents Independent Auditors Report... 3 Statement of Comprehensive Income... 4 Statement of Financial Position... 5 Statement of Cash Flows...
Financial Statements for the year ended 31 December 2010 Contents Independent Auditors Report... 3 Statement of Comprehensive Income... 4 Statement of Financial Position... 5 Statement of Cash Flows...
MCB Bank Limited Unconsolidated Condensed Interim Balance Sheet As at June 30, 2007
 MCB Bank Limited Unconsolidated Condensed Interim Balance Sheet As at 2007 Assets Unaudited Audited Note December 31, Cash and balances with treasury banks 36,581,502 32,465,976 Balances with other banks
UNITED BANK FOR AFRICA PLC. Consolidated and Separate Financial Statements for the 6 months ended 30 June 2013 (Un-audited)
") UNITED BANK FOR AFRICA PLC Consolidated and Separate Financial Statements for the 6 months ended 30 June 2013 (Un-audited) UNITED BANK FOR AFRICA PLC SIGNIFICANT ACCOUNTING POLICIES 1 Reporting entity
UNITED BANK FOR AFRICA PLC Consolidated and Separate Financial Statements for the 6 months ended 30 June 2013 (Un-audited) UNITED BANK FOR AFRICA PLC SIGNIFICANT ACCOUNTING POLICIES 1 Reporting entity
Condensed interim statement of financial position As at September 30, 2015
 Condensed interim statement of financial position As at September 30, Note Sep. 30, June 30, Rupees in '000 Rupees in '000 Assets Cash and balances with treasury banks 402,471 866,698 Balances with other
OJSC Kapital Bank Financial Statements. Year ended 31 December 2012 Together with Independent Auditors Report
 Financial Statements Year ended 31 December Together with Independent Auditors Report financial statements CONTENTS Independent auditors report Statement of financial position... 1 Income statement...
Annual Report ARIF HABIB RUPALI BANK the bank for everyone
 Annual Report 2006 ARIF HABIB RUPALI BANK the bank for everyone 17 ANNUAL REPORT 2006 Arif Habib Rupali Bank Balance Sheet as at December 31, 2006 Note Rupees in '000' ASSETS Cash and
NIB Bank Limited Financial Information For the Half year ended June 30, 2017
 Financial Information For the Half year ended 2017 Condensed Interim Statement of Financial Position As at 2017 ASSETS Unaudited Audited Note Cash and balances with treasury banks 8,377,261 8,766,811 Balances
Yapi Kredi Bank Azerbaijan CJSC Consolidated financial statements
 Yapi Kredi Bank Azerbaijan CJSC Consolidated financial statements Year ended 31 December 2014 together with independent auditors report 2014 Consolidated financial statements Contents Independent auditors
United Bank Limited CONSOLIDATED FINANCIAL STATEMENTS FOR THE HALF YEAR ENDED JUNE 30, 2009 (UNAUDITED)
") United Bank Limited CONSOLIDATED FINANCIAL STATEMENTS (UNAUDITED) CONSOLIDATED CONDENSED INTERIM BALANCE SHEET AS AT JUNE 30, 2009 (Un audited) (Audited) Note June 30, 2009 December 31, 2008 ASSETS Cash
United Bank Limited CONSOLIDATED FINANCIAL STATEMENTS (UNAUDITED) CONSOLIDATED CONDENSED INTERIM BALANCE SHEET AS AT JUNE 30, 2009 (Un audited) (Audited) Note June 30, 2009 December 31, 2008 ASSETS Cash
Profit before income tax , ,366 Income tax 20 97,809 12,871 Profit for the year 209, ,237
 4 CITIBANK, N.A. JAMAICA BRANCH Statement of Profit or Loss and Other Comprehensive Income Year ended Notes $ 000 $ 000 Interest income: Interest on loans 304,394 279,843 Interest on deposits with banks
Audited Accounts Financial Year ended 31 December 2011
 Audited Accounts Financial Year ended 31 December Chief Executive Officer Commentary I am pleased to present our financial results for the year ended 31 December. The past year presented its fair share
PASHA YATIRIM BANKASI A.Ş. FINANCIAL STATEMENTS AS AT 31 DECEMBER 2017 TOGETHER WITH INDEPENDENT AUDITOR S REPORT
 FINANCIAL STATEMENTS AS AT 31 DECEMBER 2017 TOGETHER WITH INDEPENDENT AUDITOR S REPORT CONTENTS Independent auditors review report Statement of financial position... 1 Statement of income... 2 Statement
JSC VTB Bank (Georgia) Consolidated financial statements
 Consolidated financial statements") Consolidated financial statements For the year ended 31 December 2017 together with independent auditor s report 2017 consolidated financial statements Contents Independent auditor s report Consolidated
Consolidated financial statements For the year ended 31 December 2017 together with independent auditor s report 2017 consolidated financial statements Contents Independent auditor s report Consolidated
May & Baker Nig Plc RC. UNAUDITED CONSOLIDATED FINANCIAL STATEMENTS 31 MARCH 2017
 ` May & Baker Nig Plc RC. 558 UNAUDITED CONSOLIDATED FINANCIAL STATEMENTS 31 MARCH 2017 UNAUDITED CONSOLIDATED STATEMENT OF PROFIT OR LOSS AND OTHER COMPREHENSIVE INCOME Note Continuing operations Revenue
INDEX TO UNAUDITED CONDENSED CONSOLIDATED INTERIM FINANCIAL STATEMENTS
 INDEX TO UNAUDITED CONDENSED CONSOLIDATED INTERIM FINANCIAL STATEMENTS Unaudited Condensed Consolidated Interim Financial Statements of Tata Consultancy Services Limited Unaudited Condensed Consolidated
(Continued) ~3~ March 31, 2017 December 31, 2016 March 31, 2016 Assets Notes AMOUNT % AMOUNT % AMOUNT % Current assets
 ~3~ March 31, 2017 December 31, 2016 March 31, 2016 Assets Notes AMOUNT % AMOUNT % AMOUNT % Current assets") Current assets DAVICOM SEMICONDUCTOR, INC. AND SUBSIDIARIES CONSOLIDATED BALANCE SHEETS (Expressed in thousands of New Taiwan dollars) (The consolidated balance sheets as of March 31,2017 and 2016 are
Current assets DAVICOM SEMICONDUCTOR, INC. AND SUBSIDIARIES CONSOLIDATED BALANCE SHEETS (Expressed in thousands of New Taiwan dollars) (The consolidated balance sheets as of March 31,2017 and 2016 are
Reliance Weaving Mills Limited Balance Sheet As at 30 June 2010
 Reliance Weaving Mills Limited Balance Sheet As at 30 June 2010 EQUITY AND LIABILITIES Note 2010 2009 Note 2010 2009 ASSETS Share capital and reserves Non-current assets Authorized capital Property, plant
CASERA CREDIT UNION LIMITED. Financial Statements For the year ended December 31, 2015
 Financial Statements Financial Statements Contents Independent Auditor's Report 2 Financial Statements Balance Sheet 3 Statement of Comprehensive Income 4 Statement of Changes in Members' Equity 5 Statement
Annual Report for the year ended June 30, 2014 FINANCIAL STATEMENTS
 Annual Report FINANCIAL STATEMENTS 33 34 Mughal Iron & Steel Industries Limited Annual Report 35 AUDITORS REPORT TO THE MEMBERS We have audited the annexed balance sheet of MUGHAL IRON & STEEL INDUSTRIES
Tekstil Bankası Anonim Şirketi and Its Subsidiary
 TABLE OF CONTENTS Independent Auditors Report Consolidated Statement of Financial Position 1 Consolidated Income Statement 2 Consolidated Statement of Comprehensive Income 3 Consolidated Statement of Changes
ISP FINANCE SERVICES LIMITED FINANCIAL STATEMENTS YEAR ENDED DECEMBER 31, 2017
 FINANCIAL STATEMENTS FINANCIAL STATEMENTS CONTENTS Page (s) Independent Auditor's Report 1-6 Statement of Financial Position 7 Statement of Comprehensive Income 8 Statement of Changes in Equity 9 Statement
PUBLIC JOINT STOCK COMPANY JOINT STOCK BANK UKRGASBANK Financial Statements. Year ended 31 December 2011 Together with Independent Auditors Report
 PUBLIC JOINT STOCK COMPANY JOINT STOCK BANK UKRGASBANK Financial Statements Year ended 31 December 2011 Together with Independent Auditors Report Contents Independent Auditors Report Statement of financial
Abu Dhabi Commercial Bank P.J.S.C. Consolidated financial statements For the year ended December 31, 2013
 Consolidated financial statements For the year ended Consolidated financial statements are also available at: www.adcb.com Table of Contents Report of the independent auditor on the consolidated financial
CREDIT BANK OF MOSCOW (open joint-stock company) Consolidated Financial Statements for the year ended 31 December 2010
 Consolidated Financial Statements for the year ended 31 December 2010") CREDIT BANK OF MOSCOW (open joint-stock company) Consolidated Financial Statements Contents Independent Auditor s Report... 3 Consolidated Statement of Comprehensive Income... 4 Consolidated Statement
CREDIT BANK OF MOSCOW (open joint-stock company) Consolidated Financial Statements Contents Independent Auditor s Report... 3 Consolidated Statement of Comprehensive Income... 4 Consolidated Statement
Crescent Steel and Allied Products Limited Unconsolidated Financial Statements For the year ended 30 June 2014
 Crescent Steel and Allied Products Limited Unconsolidated Financial Statements Financial Statements of this Annual Report are printed on 100% recycled paper. REVIEW REPORT TO THE MEMBERS on Statement of
Abu Dhabi Commercial Bank PJSC Consolidated financial statements For the year ended December 31, 2014
 Consolidated financial statements For the year ended Consolidated financial statements are also available at: www.adcb.com Table of Contents Report of the independent auditor on the consolidated financial
Financial Statements. First Nations Bank of Canada October 31, 2017
 Financial Statements First Nations Bank of Canada Independent auditors report To the Shareholders of First Nations Bank of Canada We have audited the accompanying financial statements of First Nations
INDEX TO UNAUDITED CONDENSED CONSOLIDATED FINANCIAL STATEMENTS
 INDEX TO UNAUDITED CONDENSED CONSOLIDATED FINANCIAL STATEMENTS Unaudited Condensed Consolidated Financial Statements of Tata Consultancy Services Limited Unaudited Condensed Consolidated Statements of
The Hongkong and Shanghai Banking Corporation Limited, Bangkok Branch
 The Hongkong and Shanghai Banking Corporation Limited, Bangkok Branch Financial statements for the year ended 31 December 2013 and Independent Auditor s Report Note Contents 1 General information
MUGHAL IRON & STEEL INDUSTRIES LIMITED FINANCIAL STATEMENTS. for the year ended June 30, Annual Report for the year ended June 30, 2015 /
 MUGHAL IRON & STEEL INDUSTRIES LIMITED FINANCIAL STATEMENTS for the year ended June 30, 2015 Annual Report for the year ended June 30, 2015 / 69 GLOBAL PRESENCE LOCAL EXCELLENCE FAZAL MAHMOOD & COMPANY
Joint Stock Company The State Export-Import Bank of Ukraine Consolidated Financial Statements
 Joint Stock Company The State Export-Import Bank of Ukraine Consolidated Financial Statements Year ended 31 December 2004 Together with Independent Auditors Report 2004 Consolidated Financial Statements
SAMBA FINANCIAL GROUP CONSOLIDATED FINANCIAL STATEMENTS AND AUDITORS REPORT FOR THE YEAR ENDED DECEMBER 31, 2011
 SAMBA FINANCIAL GROUP CONSOLIDATED FINANCIAL STATEMENTS AND AUDITORS REPORT FOR THE YEAR ENDED DECEMBER 31, 8 STATEMENTS OF CONSOLIDATED FINANCIAL POSITION As at December 31, and ASSETS Notes SAR 000
Ameriabank cjsc. Financial Statements for the Year Ended 31 December 2009
 Financial Statements for the Year Ended 31 December Contents Independent Auditors Report... 3 Statement of comprehensive income... 4 Statement of financial position... 5 Statement of cash flows... 6 Statement
Bank Caspian JSC Consolidated Financial Statements
 Consolidated Financial Statements Years ended December 31, 2003 and 2002 Together with Report of Independent Auditors CONTENTS 2003 Consolidated Financial Statements REPORT OF INDEPENDENT AUDITORS Consolidated
CONTENTS Consolidated Financial Statements INDEPENDENT AUDITORS REPORT
 2007 Consolidated Financial Statements CONTENTS INDEPENDENT AUDITORS REPORT Consolidated balance sheet...1 Consolidated income statement...2 Consolidated statement of changes in equity...3 Consolidated
Tekstil Bankası Anonim Şirketi and Its Subsidiary
 TABLE OF CONTENTS Independent Auditors Report Consolidated Statement of Financial Position 1 Consolidated Income Statement 2 Consolidated Statement of Comprehensive Income 3 Consolidated Statement of Changes
OJSC Belarusky Narodny Bank Consolidated Financial Statements. Year ended 31 December 2010 Together with Independent Auditors Report
 OJSC Belarusky Narodny Bank Consolidated Financial Statements Year ended 31 December 2010 Together with Independent Auditors Report CONTENTS Independent auditors report Consolidated statement of financial
MAYBERRY INVESTMENTS LIMITED FINANCIAL STATEMENTS 31 DECEMBER 2006
 FINANCIAL STATEMENTS FINANCIAL STATEMENTS I N D E X PAGE Independent auditors report to the members 1 FINANCIAL STATEMENTS Consolidated statement of revenues and expenses 2 Consolidated balance sheet 3
The accompanying notes form an integral part of the financial statements.
 5 Statement of Profit or Loss and Other Comprehensive Income Year ended Notes $ 000 $ 000 Interest income: Interest on loans 185,459 158,179 Interest on deposits with banks 186,987 84,929 Interest on investment
 PAK OMAN INVESTMENT COMPANY LIMITED NOTES TO THE UNCONSOLIDATED CONDENSED INTERIM FINANCIAL INFORMATION (UN-AUDITED) FOR THE SIX MONTHS ENDED JUNE 30, 2012 1. LEGAL STATUS AND NATURE OF BUSINESS Pak Oman
JSC ASIAСREDIT BANK (АЗИЯКРЕДИТ БАНК) Financial Statements for the year ended 31 December 2012
 Financial Statements for the year ended 31 December 2012") JSC ASIAСREDIT BANK (АЗИЯКРЕДИТ БАНК) Financial Statements for the year ended 31 December CONTENTS STATEMENT OF MANAGEMENT S RESPONSIBILITIES FOR THE PREPARATION AND APPROVAL OF THE FINANCIAL STATEMENTS
JSC ASIAСREDIT BANK (АЗИЯКРЕДИТ БАНК) Financial Statements for the year ended 31 December CONTENTS STATEMENT OF MANAGEMENT S RESPONSIBILITIES FOR THE PREPARATION AND APPROVAL OF THE FINANCIAL STATEMENTS
 STATEMENT OF PROFIT OR LOSS For the year ended 31 December 2014 Financial statements Note 2014 2013 Interest income Cash and cash equivalents 893,744 506,424 Loans to customers 1,020,693 440,642 Amounts
FINANCIAL STATEMENTS 2015
 Financial Statements 2015 FINANCIAL STATEMENTS 2015 CONTENT Consolidated income statement 94 Consolidated statement of comprehensive income 95 Consolidated statement of financial position 96 Consolidated
 9 Income Statement Year ended Company Notes 2017 2016 2017 2016 $ 000 $ 000 $ 000 $ 000 Interest income 19 735,665 732,747 25,623 2,798 Interest expenses 19 (488,676) (481,991) ( 16,493) - Net interest
Unaudited consolidated interim financial statements and independent auditor s review report BORETS INTERNATIONAL LIMITED 30 June 2015
 Unaudited consolidated interim financial statements and independent auditor s review report BORETS INTERNATIONAL LIMITED 30 June 2015 Contents Independent Auditor s Review Report Unaudited Consolidated
VTB Bank (Armenia) cjsc. Financial Statements For the year ended 31 December 2008
 cjsc. Financial Statements For the year ended 31 December 2008") Financial Statements For the year ended 31 December Contents Independent Auditors Report...3 Income Statement...4 Balance Sheet...5 Statement of Cash Flows...6 Statement of Changes in Shareholders Equity...7
Financial Statements For the year ended 31 December Contents Independent Auditors Report...3 Income Statement...4 Balance Sheet...5 Statement of Cash Flows...6 Statement of Changes in Shareholders Equity...7
Open Joint Stock Company Raiffeisen Bank Aval Consolidated Financial Statements
 Open Joint Stock Company Raiffeisen Bank Aval Consolidated Financial Statements For the year ended 31 December Together with Independent Auditors Report Consolidated Financial Statements CONTENTS INDEPENDENT
Bank Muscat (SAOG) NOTES TO THE CONSOLIDATED FINANCIAL STATEMENTS YEAR ENDED 31 DECEMBER 2012
 NOTES TO THE CONSOLIDATED FINANCIAL STATEMENTS YEAR ENDED 31 DECEMBER 2012") YEAR ENDED 1 LEGAL STATUS AND PRINCIPAL ACTIVITIES Bank Muscat (SAOG) (the Bank or the Parent Company) is a joint stock company incorporated in the Sultanate of Oman and is engaged in commercial and investment
YEAR ENDED 1 LEGAL STATUS AND PRINCIPAL ACTIVITIES Bank Muscat (SAOG) (the Bank or the Parent Company) is a joint stock company incorporated in the Sultanate of Oman and is engaged in commercial and investment
AL JABR FINANCING COMPANY (A SAUDI CLOSED JOINT STOCK COMPANY) FINANCIAL STATEMENTS AND INDEPENDENT AUDITOR S REPORT
 FINANCIAL STATEMENTS AND INDEPENDENT AUDITOR S REPORT") FINANCIAL STATEMENTS AND INDEPENDENT AUDITOR S REPORT FINANCIAL STATEMENTS WITH INDEPENDENT AUDITOR S REPORT INDEX PAGE Independent auditor s audit report 1-2 Statement of financial position 3 Statement
FINANCIAL STATEMENTS AND INDEPENDENT AUDITOR S REPORT FINANCIAL STATEMENTS WITH INDEPENDENT AUDITOR S REPORT INDEX PAGE Independent auditor s audit report 1-2 Statement of financial position 3 Statement
UNITED BANK FOR AFRICA PLC
 UNITED BANK FOR AFRICA PLC Condensed Consolidated Financial Statements for the nine months ended 30 September 2017 Condensed Consolidated Statements of Comprehensive Income For the nine months ended 30
Separate Financial Statements
 Separate Financial Statements December - 2016 www.cibeg.com Dec. 31, 2016 Assets 10,522,040 58,011,034 39,177,184 2,445,134 159,651 85,991,914 269,269 Financial investments 5,447,291 53,924,936 10,500
Financial statements and Independent Auditor's Report. Ohridska Banka A.D., Ohrid. 31 December 2009
 Financial statements and Independent Auditor's Report Ohridska Banka A.D., Ohrid 31 December 2009 Contents Page Independent Auditors Report 1 Income statement 3 Statement of comprehensive income 4 Statement
JAMAICAN TEAS LIMITED CONSOLIDATED FINANCIAL STATEMENTS 30 SEPTEMBER 2015
 CONSOLIDATED FINANCIAL STATEMENTS CONSOLIDATED FINANCIAL STATEMENTS I N D E X PAGE Independent Auditors' Report to the Members 1-2 FINANCIAL STATEMENTS Consolidated Statement of Profit or Loss and Other
Notes to the Accounts
 Notes to the Accounts 1. Accounting Policies Statement of compliance The Group financial statements consolidate those of the Company and its subsidiaries (together referred to as the Group ), equity account
Barita Unit Trusts Management Company Limited. Financial Statements 30 September 2014
 Barita Unit Trusts Management Company Limited Financial Statements Barita Unit Trusts Management Company Limited Index Independent Auditors Report to the Members Page Financial Statements Statement of
Prospera Credit Union. Consolidated Financial Statements December 31, 2012 (expressed in thousands of dollars)
") Consolidated Financial Statements February 19, 2013 Independent Auditor s Report To the Members of Prospera Credit Union We have audited the accompanying consolidated financial statements of Prospera Credit
Consolidated Financial Statements February 19, 2013 Independent Auditor s Report To the Members of Prospera Credit Union We have audited the accompanying consolidated financial statements of Prospera Credit
PAK OMAN INVESTMENT COMPANY LIMITED CONSOLIDATED CONDENSED INTERIM FINANCIAL INFORMATION (UN-AUDITED)
") PAK OMAN INVESTMENT COMPANY LIMITED CONSOLIDATED CONDENSED INTERIM FINANCIAL INFORMATION (UN-AUDITED) FOR THE HALF YEAR ENDED JUNE 30, 2014 PAK OMAN INVESTMENT COMPANY LIMITED NOTES TO THE CONSOLIDATED
PAK OMAN INVESTMENT COMPANY LIMITED CONSOLIDATED CONDENSED INTERIM FINANCIAL INFORMATION (UN-AUDITED) FOR THE HALF YEAR ENDED JUNE 30, 2014 PAK OMAN INVESTMENT COMPANY LIMITED NOTES TO THE CONSOLIDATED
ING Bank (Eurasia) ZAO Financial Statements
 ZAO Financial Statements") Financial Statements Year ended 31 December 2008 Together with Independent Auditors Report CONTENTS INDEPENDENT AUDITORS REPORT Balance sheet... 1 Income statement... 2 Statement of changes in equity...
Financial Statements Year ended 31 December 2008 Together with Independent Auditors Report CONTENTS INDEPENDENT AUDITORS REPORT Balance sheet... 1 Income statement... 2 Statement of changes in equity...