MCB Bank Limited Investors Briefing Financial Performance Analysis For the year ended December 31, 2015
|
|
|
- Piers Lambert
- 6 years ago
- Views:
Transcription
1 Investors Briefing Financial Performance Analysis For the year ended December 31, 2015 Presented by: Hammad Khalid Head Investor Relations, Financial Reporting and Taxation

2 Disclaimer THIS PRESENTATION IS BEING PRESENTED TO YOU SOLELY FOR YOUR INFORMATION AND MAY NOT BE REPRODUCED, REDISTRIBUTED OR PASSED ON, DIRECTLY OR INDIRECTLY, TO ANY OTHER PERSON OR PUBLISHED, IN WHOLE OR IN PART, FOR ANY PURPOSE. This presentation might contain certain forward looking statements. These forward looking statements that include words or phrases such as the Company or its management believes, expects, anticipates, intends, plans, foresees, or other words or phrases of similar import. Similarly, statements that describe the Company's objectives, plans or goals also are forward-looking statements. All such forward looking statements are subject to certain risks and uncertainties that could cause actual results to differ materially from those contemplated by the relevant forward-looking statement. Such forward looking statements are made based on management's current expectations or beliefs as well as assumptions made by, and information currently available to, management. The Company, nor any of their respective affiliates, shareholders, directors, employees, agents or advisers, makes expressed or implied representations or warranties as to the accuracy and completeness of the information contained herein and none of them shall accept any responsibility or liability (including any third party liability) for any loss or damage, whether or not arising from any error or omission in compiling such information or as a result of any party's reliance or use of such information. The information and opinions in this presentation are subject to change without notice. No representation or warranty, express or implied, is made as to the accuracy, completeness or fairness of the information and opinions contained in this presentation. By participating in this presentation or by accepting any copy of the slides presented, you agree to be bound by the foregoing limitations. Please Note Certain prior period financial numbers have been restated to conform to current period results presentation All numbers are presented on the basis of unconsolidated financial results, unless stated otherwise The figures are presented in millions, rounded, and as percentages, unless otherwise stated in 000s, billions and bps.
3 Key Achievements MCB Bank carries the highest CASA base of over 93%; Financial strength depicted by asset base of over PKR 1 Trillion; MCB Bank has maintained one of the highest spreads in the industry over the last many years; MCB Bank has the highest return on assets of 2.62% as at December 31, 2015; One of the highest Return on Equity of 23.25% in the industry; One of the Lowest Infection Ratio of 6.12% in the industry; One of the Lowest Cost to Income Ratio of 35.23%; One of the highest market capitalization in the equity markets; Highest Dividend payout ratio in the industry; Winner of Best Presented Annual Accounts Award by SAFA being the 1 st Pakistani Bank to win this accolade; Winner of Best Corporate Awards (by ICAP/ICMAP) 5 times in past 6 years.
4 Statement of Financial Position Increase of 6% in Equity Unconsolidated Consolidated Rs. in mln YTD % YTD % Assets 1,016, ,631 81,998 9% 1,020, ,606 79,373 8% Advances - net 314, ,559 10, % 315, ,001 11,310 4% Investments 568, ,137 57, % 564, ,898 47,401 9% Cash and Balances with Banks & Lending to Financial Institutions 70,023 51,188 18,836 37% 76,457 51,236 25,221 49% Other Assets(including Fixed Assets) 63,679 68,747 (5,068) -7% 64,912 69,472 (4,560) -7% Liabilities 878, ,527 74,302 9% 878, ,337 73,465 9% Deposits 708, ,330 19,762 3% 706, ,270 17,970 3% Borrowings 118,459 59,543 58,917 99% 118,615 59,777 58,838 98% Bills Payable 11,975 16,628 (4,652) -28% 11,975 16,628 (4,652) -28% Other Liabilities(including Deferred Tax) 40,303 40, % 41,972 40,663 1,309 3% Net Assets 137, ,104 7,696 6% 142, ,269 5,908 4% Equity without surplus (incl. M.I) 112, ,908 5,995 6% 115, ,607 5,158 5%
 (387) (483) (224) (17) QoQ % variance -2% -2% -2% -1% 0% Substandard - 254 299 215 234 QoQ (254)")
5 Non Performing Loans (NPLs) Coverage ratio* at 90.83% (YE14: 85.62%), NPLs ratio improved to 6.12% (YE14: 6.80 %) Rs. In mln Dec 15 Sep 15 June 15 Mar 15 Dec 14 Total NPLs 20,369 20,814 21,201 21,684 21,908 QoQ (444) (387) (483) (224) (17) QoQ % variance -2% -2% -2% -1% 0% Substandard QoQ (254) (45) 84 (19) (90) QoQ % variance -100% -15% 39% -8% -28% Doubtful QoQ (632) (187) (107) 99 (46) QoQ % variance -93% -22% -11% 11% -5% Loss 20,323 19,830 19,984 20,467 20,749 QoQ 493 (154) (483) (282) 153 QoQ % variance 2% -1% -2% -1% 1% OAEM QoQ (52) (1) 23 (21) (35) QoQ % variance -100% -1% 79% -42% -41% YTD (Dec 15 vs. Dec 14) Var. % Total NPLs (1,539) -7% Substandard (234) -100% Doubtful (828) -95% Loss (426) -2% OAEM (50) -100% Concentration of Category of NPLs Dec 15 Sep 15 June 15 Mar 15 Dec 14 Substandard 0.00% 1.2% 1.4% 1.0% 1.1% Doubtful 0.23% 3.3% 4.1% 4.5% 4.0% Loss 99.77% 95.3% 94.3% 94.4% 94.7% OAEM 0.00% 0.2% 0.2% 0.1% 0.2% * Coverage ratio = Specific plus General Provision
6 Investments Increase of Rs B in Market Treasury Bills & decrease of Rs B in Pakistan Investment Bonds. Rs. In mln Dec 2015 Dec 2014 Var. % var. Sep 2015 Var. % var. Treasury Bills 227, ,538 85,670 61% 270,804 (43,596) -16% Pakistan Investment Bonds 280, ,987 (48,945) -15% 282,211 (2,169) -1% TFCs, Debentures, Bonds and PTCs 7,055 4,448 2,608 59% 5,384 1,671 31% Euro Bonds 3,699 2,284 1,415 62% 2,415 1,284 53% Shares in Listed, Unlisted Co.s & Mutual funds 17,063 12,151 4,912 40% 15,662 1,401 9% Sukuks Bonds 3,260 3,960 (700) -18% 5,620 (2,361) -42% Subsidiaries & Associated Undertakings 11,792 1,573 10, % 11, % Investments at cost 550, ,940 55,180 11% 593,881 (43,762) -7% Prov for diminution in value of investments (2,534) (1,703) (831) -49% (1,347) (1,187) 88% Surplus on revaluation of securities 21,217 17,900 3,317 19% 22,966 (1,749) -8% Investments at revalued amount - net of provision 568, ,137 57,665 11% 615,500 (46,697) -8% Composition of Investments Dec 2015 Dec 2014 T-Bills 41.30% 29% PIBs 50.91% 66% Equity securities 5.25% 3% Debt instruments 2.55% 2%
7 Deposits CASA reported at 93%, Increase recorded in Current Deposits +10%, Saving Deposits +2% Q4 15 Q3 15 Q2 15 Q1 15 Q4 14 Rs. In mln Volume Mix Volume Mix Volume Mix Volume Mix Volume Mix Deposits - Volume 708, , , , ,330 Current deposits 259,818 37% 260,294 37% 303,474 40% 258,949 35% 236,427 34% Savings deposits 398,492 56% 404,564 57% 408,359 53% 413,424 56% 389,685 57% Term Deposits 49,782 7% 47,338 7% 53,958 7% 63,784 9% 62,218 9% CASA 658, % 664, % 711, % 672, % 626, % Variance YoY QoQ YoY QoQ YoY QoQ YoY QoQ YoY QoQ Current deposits 10% 0% 15% -14% 15% 17% 22% 10% 10% 5% Savings deposits 2% -2% 6% -1% 12% -1% 15% 6% 10% 2% CASA 5% -1% 10% -7% 13% 6% 17% 7% 10% 3% Term Deposits -20% 5% -21% -12% -7% -15% 17% 3% -4% 4% Total Deposits 3% -1% 7% -7% 12% 4% 17% 7% 9% 3% Market Share (Domestic) QoQ QoQ QoQ QoQ QoQ Industry 9,675, % 9,060, % 9,141,126 7% 8,508,337 2% 8,342,172 4% MCB 692,751-1% 700,454-7% 755,448 4% 727,415 7% 679,977 3% Share 7.16% 7.73% 8.26% 8.55% 8.15% Source: System Deposits, State Bank of Pakistan. In the absence of domestic numbers of peer banks, total deposits base has been used in the computation.
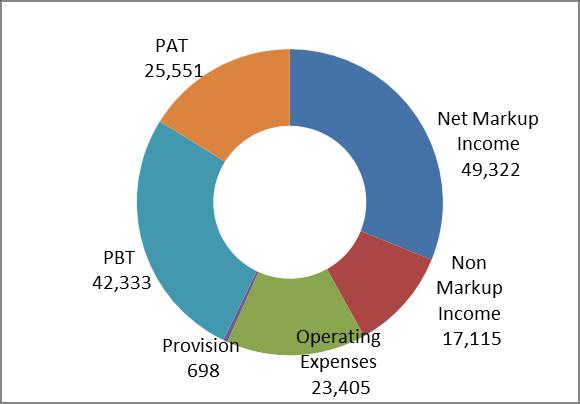
8 Profit and Loss Statement Standalone PBT increased by 15% and PAT increased by 5% Rs. In mln Unconsolidated Consolidated /- % /- % Mark-up Income 80,532 77,269 3,263 4% 80,726 77,411 3,315 4% Mark-up Expense 31,210 33,757 (2,546) -8% 31,172 33,770 (2,598) -8% Net Mark-up Income 49,322 43,512 5,810 13% 49,554 43,641 5,913 14% Non Interest Income 17,115 12,944 4,171 32% 17,063 13,261 3,802 29% Total Income 66,437 56,456 9,981 18% 66,617 56,902 9,715 17% Non Mark-up Expense 23,560 21,668 1,892 9% 24,078 22,071 2,007 9% admin expenses 23,252 21,443 1,809 8% 23,762 21,846 1,916 9% PF reversal (776) (832) 56-7% (776) (832) 56-7% other charges 1,084 1, % 1,091 1, % Share of Undertaking % Profit before Provisions 42,877 34,788 8,088 23% 43,335 35,413 7,922 22% Provisions 543 (1,941) 2, % 545 (1,941) 2, % against Investments 831 (847) 1, % 831 (847) 1, % against loans & advances (288) (1,094) % (286) (1,094) % Profit before Tax 42,333 36,729 5,604 15% 42,789 37,354 5,436 15% Taxation 16,782 12,405 4,378 35% 17,754 12,580 5,175 41% Profit after Tax 25,551 24,325 1,226 5% 25,035 24, %
9 Non- Markup Income Rs. In mln Dec 2015 Dec 2014 Var. % var. Budgeted Dec 2015 Var. % var. NON MARKUP INCOME 17,115 12,944 4,171 32% 13,248 3,867 29% Fee, Commission & Brokerage 8,383 7,225 1,158 16% 8,417 (34) 0% Dividend Income 1,267 1, % 1, % Income from dealing in Foreign Currencies 950 1,443 (493) -34% 1,684 (735) -44% Capital Gains 4,428 1,648 2, % 1,260 3, % Other Income 2,088 1, % 786 1, % Capital Gains Dec 2015 Dec 2014 Var. % var. Federal Government Securities -Market Treasury Bills 172 (60) % -Pakistan Investment Bonds 2, , % Listed Shares / Units 2,121 1, % 4,428 1,648 2, %

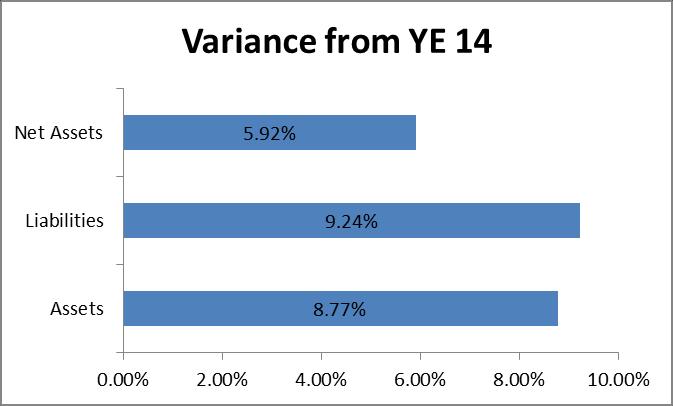
10 Financial Statements Variance Analysis Rs. In mln
11 Key Ratios BV ROA ROE EPS (annualised) CAR ADR Infection ratio Coverage ratio* Coverage (incl. benefit of liquid sec)** Nonmarkup/Total Rev Dec % 23.25% % 46.98% 6.12% 90.83% 99.82% 25.76% Sep % 24.55% % 45.67% 6.40% 85.16% 94.08% 26.76% June % 24.92% % 43.52% 6.36% 84.98% 93.59% 27.52% Mar % 29.13% % 43.76% 6.73% 85.36% 93.87% 30.45% Dec % 23.83% % 46.83% 6.80% 85.62% 94.00% 22.93% Sep % 23.93% % 46.24% 7.12% 84.62% 95.11% 22.98% June % 23.53% % 44.19% 7.29% 85.60% 94.15% 20.29% Mar % 22.44% % 43.45% 8.26% 85.66% 94.23% 21.49% Dec % 23.09% % 42.41% 8.68% 85.74% 94.66% 22.78% Sep % 24.70% % 41.98% 10.17% 84.28% 92.65% 23.09% June % 25.91% % 40.08% 10.12% 86.92% 95.42% 23.70% Mar % 25.51% % 46.37% 9.41% 88.97% 97.22% 19.47% Dec % 24.59% % 48.14% 9.74% 89.23% 87.55% 18.30% Sep % 26.87% % 46.29% 10.41% 85.79% 93.58% 18.17% June % 27.38% % 49.81% 10.00% 86.12% 94.30% 19.91% Mar % 27.73% % 49.37% 10.39% 85.00% 95.87% 18.41% Dec % 26.17% % 50.88% 10.67% 83.76% 94.74% 15.41% * Coverage ratio is based on specific plus general provision ** Coverage ratio based on specific provision (excld. GP) plus benefit of liquid securities Net revenue= net markup income + non-markup income


12 International Recognition Awards / Accolades Winner -Best Corporate Report Award 2014 Banking Sector Winner - Best Corporate Report Award 2013 Winner - Best Corporate Report Award 2012 Runner-up Best Corporate Report Award 2011 Winner - Best Corporate Report Award 2010 Winner - Best Corporate Report Award 2009 Best bank in Pakistan PCR Corporate Philanthropy Survey 2011: Certificate of Philanthropy Ranked 25 th out of 490 PLCs (by volume of donations) Ranked among the Top 25 Companies in Pakistan Winner Best Presented Annual Accounts st Runner Up Best Presented Annual Report Awards 2013 Category Private Sector Banks 2 nd Runner Up Best Presented Annual Report Awards 2012 Category Private Sector Banks Joint 2nd runner-up in the banking sector - Best Presented Accounts and Corporate Governance Disclosure Awards 2010 Euromoney Awards for Excellence 2012: Best Bank in Pakistan Best Bank in Pakistan 2011, 2008, , 2001, 2000 Best Bank in Asia 2008 Most Stable Bank of the year 2014 Best Bank of the year 2013 Large Bank Most Stable Bank of the year 2013 Investor Relations Award 2011: Runner-up Best Bank of the Year 2011 Most Stable Bank of the Year 2011 Best Commercial Bank Pakistan 2012 Strongest Bank in Pakistan 2014 Strongest Bank in Pakistan 2010 Best Bank Led Mobile Money Transfer Program 2010 Best Domestic Bank in Pakistan: 2014; 2009, 2008, 2006, 2005 & : Ranked 624, 2011: Ranked 606, 2010: 621 Country Ranking: 3 rd highest among the local Top 5 CSR Business Excellence Award 2012: Best Media Coverage Triple A Country Awards Best Domestic Bank Pakistan 2014: 2013: 2012: Best Bank Pakistan 2014 The QFC Asian Banker Leadership Achievement Award 2010
13 Thankyou For further details on MCB Bank Limited, please visit For any query/comments/feedback, please
MCB Bank Limited Investors Briefing Financial Performance Analysis September 30, 2016
 Investors Briefing Financial Performance Analysis September 30, 2016 Presented by: Hammad Khalid Head, Financial Reporting and Taxation One of the largest Commercial Bank in Pakistan Financial Strength
MCB Bank Limited Investors Briefing Financial Performance Analysis June 30, 2017
 Investors Briefing Financial Performance Analysis June 30, 2017 Presented by: Hammad Khalid Head, Financial Reporting & Taxation Group Structure in MCB is one of the oldest banks of Pakistan, incorporated
MCB Bank Limited Investors Briefing September 30, Presented by: Hammad Khalid Chief Financial Officer
 Investors Briefing September 30, 2018 Presented by: Hammad Khalid Chief Financial Officer Group Structure MCB is one of the oldest banks of Pakistan, incorporated in 1947. It was privatized in 1991. To
MCB Bank Limited Investors Briefing March 31, Presented by: Hammad Khalid Head Investor Relations, Financial Reporting & Taxation
 Investors Briefing March 31, 2018 Presented by: Hammad Khalid Head, Financial Reporting & Taxation Group Structure MCB is one of the oldest banks of Pakistan, incorporated in 1947. It was privatized in
MCB Bank Limited Investors Briefing Financial Performance Analysis September 30, 2017
 Investors Briefing Financial Performance Analysis September 30, 2017 Presented by: Hammad Khalid Head, Financial Reporting & Taxation Group Structure in MCB is one of the oldest banks of Pakistan, incorporated
MCB Bank Limited Investors Briefing December 31, Presented by: Hammad Khalid Head Investor Relations, Financial Reporting & Taxation
 Investors Briefing December 31, 2017 Presented by: Hammad Khalid Head, Financial Reporting & Taxation Group Structure MCB is one of the oldest banks of Pakistan, incorporated in 1947. It was privatized
InvestorsPresentation
 InvestorsPresentation Results for the nine months ended SEPTEMBER 30, 2010 Presented by: Investor Relations, MCB Bank Limited Disclaimer THIS PRESENTATION IS BEING PRESENTED TO YOU SOLELY FOR YOUR INFORMATIONAND
InvestorsPresentation
 InvestorsPresentation Results for the first half ended JUNE 30,2010 Presented by: Investor Relations Dpt. MCB Disclaimer THIS PRESENTATION IS BEING PRESENTEDTOYOU SOLELYFOR YOUR INFORMATIONAND MAYNOT BE
MCB Bank Limited FIRST QUARTER 2009
 MCB Bank Limited FIRST QUARTER 2009 April 2009 Disclaimer THIS PRESENTATION IS BEING PRESENTED TO YOU SOLELY FOR YOUR INFORMATION AND MAY NOT BE REPRODUCED, REDISTRIBUTED OR PASSED ON, DIRECTLY OR INDIRECTLY,
MCB Bank Limited FULL YEAR AND FOURTH QUARTER th February 2009
 MCB Bank Limited FULL YEAR AND FOURTH QUARTER 2008 24 th February 2009 Disclaimer THIS PRESENTATION IS BEING PRESENTED TO YOU SOLELY FOR YOUR INFORMATION AND MAY NOT BE REPRODUCED, REDISTRIBUTED OR PASSED
MCB Bank Limited SECOND QUARTER th August 2008
 MCB Bank Limited SECOND QUARTER 2008 27 th August 2008 Disclaimer THIS PRESENTATION IS BEING PRESENTED TO YOU SOLELY FOR YOUR INFORMATION AND MAY NOT BE REPRODUCED, REDISTRIBUTED OR PASSED ON, DIRECTLY
Financial Results December Investor Presentation
 Financial Results December 2016 Investor Presentation 0 Key Highlights Consolidated PAT is Rs 34.2 Bn, 3% lower than 2015 PBT is Rs 56.5 Bn, 6% lower than 2015 due to one-off capital gains realized last
Financial Results Q Investor Presentation
 Financial Results Q1 2016 Investor Presentation 0 Key Highlights Consolidated PBT is down 9% YoY to Rs 13.9 Bn. PAT is Rs 9.0 Bn, down 9% YoY PBT is down primarily due to exceptional capital gains of Rs
Performance Highlights - 31 Dec 2016
 Performance Highlights - 31 Dec 2016 Investor Relations Conference Call February 28 th, 2017 Speakers: Mr. Aameer Karachiwalla - Chief Financial Officer Mr. Arif Saifie, CFA - Financial Controller and
Financial Results September Investor Presentation
 Financial Results September 2017 Investor Presentation 0 Key Highlights Reported Consolidated PBT for 9M 17 is Rs 18.8 Bn vs Rs 43.5 Bn for 9M 16. PAT for 9M 17 is Rs 1.6 Bn against Rs 25.8 Bn in 9M 16
FINANCIAL HIGHLIGHTS
 FINANCIAL HIGHLIGHTS HIGHLIGHTS 22.75 23.03 1% up Profit after Tax 23.03 Total Assets 2,370 Profit after Tax Profit & Loss Account Net Interest Income 54.3 NonInterest Income 31.1 2,369.9 1,975.7 20% up
Financial Results March Investor Presentation
 Financial Results March 2017 Investor Presentation 0 Key Highlights Consolidated PAT is Rs 9.1 Bn, marginally higher than in Q1 16 PBT is Rs 14.1 Bn, 1% higher than Q1 16 Net interest income of Rs 20.13
Financial Results March Investor Presentation
 Financial Results March 2018 Investor Presentation 0 Key Highlights Consolidated PBT for Q1 18 is Rs 7.4 bn compared to Rs 14.1 bn in Q1 17 Domestic PBT is Rs 3.6 bn lower YoY at Rs 9.7 Bn, mainly due
Financial Results December Investor Presentation
 Financial Results December 2018 Investor Presentation 0 Key Highlights PAT for 2018 is Rs 12.4 bn vs Rs 8.8 bn in 2017. PBT is Rs 21.6 bn for 2018 compared to Rs 29.5 bn in 2017 Ex settlement payment,
Financial Results December Investor Presentation
 Financial Results December 2017 Investor Presentation 0 Key Highlights Consolidated PBT for 2017 is Rs 28.8 Bn compared to Rs 56.5 Bn in 2016. PAT is Rs 8.2 Bn compared to Rs 34.2 Bn in 2016 Profit numbers
Investor Presentation. July 10, 2018
 Investor Presentation July 10, 2018 Q1 FY19 Performance Highlights FY 18-19 tracking well towards PC4 targets Q1 FY19 marked by strong QoQ growth in headline numbers Q1 PAT growth up by 24% ; Core PAT
Earnings Presentation Q2 12
 AbuDhabi Commercial Bank PJSC Earnings Presentation Q2 12 1 Disclaimer This document has been prepared by Abu Dhabi Commercial Bank PJSC ( ADCB ) for information purposes only. The information, statements
Investor Presentation Q October 15, 2018
 Investor Presentation Q2-2018-19 October 15, 2018 Q2 FY19 Performance Highlights FY 18-19 tracking towards PC4 targets Q2 FY19 marked by strong QoQ growth in headline numbers Core fee up by 20% YoY; 5%
MCB Bank Limited. MCB - Expanding its wings. WE Detailed Report
 1 KEY DATA KATS Code MCB Reuters Code MCB.KA Current Price (Rs) 280.71 Year High, Low (Rs) 299, 260.65 Market Cap (Rs' bn) 284 Market Cap (US$ mn) 2,840 Shares Outstanding (mn) 1,012 Free Float (%) 40%
Commercial Banking. Sector Overview
 Commercial Banking Sector Overview June 2018 Banking Snapshot Key Figures Deposit Share Dec17 Dec16 Scheduled Banks 34 100% 100% Commercial Banks 30 99.4% 99.4% Domestic Banks 25 98.1% 98.2% Local Private
Commercial Banking. Sector Overview
 Commercial Banking Sector Overview June 2017 Banking Snapshot Key Figures Deposit Share Dec16 Dec15 Scheduled Banks 34 100% 100% Commercial Banks 30 99.4% 99.6% Domestic Banks 26 98.2% 98.5% Local Private
United Bank Limited Performance Review September 2014
 United Bank Limited Performance Review September 2014 1 Key Highlights Standalone PAT up 23% YoY to Rs 15.8B. Consolidated PAT up 22% YoY to Rs 17.2B Net Interest income up by 17% YoY to Rs 32B Core deposits
Investor Presentation
 Investor Presentation January 11, 2018 Q3 FY18 Performance Highlights Key performance indicators remained stable NII up 20% ; Core Fee growth at 22 % YoY YoY PAT growth up by 25 % NIM remained steady at
Investor Presentation
 Investor Presentation April 16, 2015 Q4 FY15 Performance Highlights Key performance vectors remained stable Q-o-Q PAT growth ramps up to 11 per cent Non-Interest Income to revenue remains healthy at 42%
Habib Bank Limited. HBL: Giant Getting Ginormous. 1 WE Detailed Report
 1 Habib Bank Limited HBL: Giant Getting Ginormous KEY DATA KATS Code HBL Reuters Code HBL.KA Current Price (PkR) 181.32 Year High, Low (Rs) 221.90, 167.48 Market Cap (Rs bn) 277 Market Cap (US$ bn) 2.74
Earnings presentation Financial year 2011 results
 AbuDhabiCommercial BankPJSC Earnings presentation Financial year 2011 results 1 Disclaimer This document has been prepared by Abu Dhabi Commercial Bank PJSC ( ADCB ) for information purposes only. The
Hatton National Bank. Investor Presentation 1Q 2018
 Hatton National Bank Investor Presentation 1Q 2018 1Q 2018 (Rs Bn) 1Q (Rs Bn) Growth % Interest 24.9 22.6 10.5% Interest Expenses (14.3) (13.3) 7.2% Net Operating NII 10.7 9.3 15.1% Net Fee 2.2 2.0 11.6%
Abu Dhabi Commercial Bank PJSC Earnings presentation
 Abu Dhabi Commercial Bank PJSC 2017 Earnings presentation January 2018 Disclaimer THIS PRESENTATION IS NOT AN OFFER OR SOLICITATION OF AN OFFER TO BUY OR SELL SECURITIES. IT IS SOLELY FOR USE AS AN INVESTOR
Statistics of the Banking System
 Quarterly Compendium: Statistics of the Banking System [June 2018] Financial Stability Department State Bank of Pakistan CONTENTS Data Conventions... 1 1. Banking System... 2 Table 1.1: Financial Soundness
Investor Presentation
 Investor Presentation October 12, 2017 Q2-FY18 Results 2 Q2 FY18 Performance Highlights Key performance indicators remained stable NII up 25% ; Core Fee growth at 23 % YoY; YoY PAT growth up by 25 % NIM
Punjab National Bank
 Nov-14 Dec-14 Jan-15 Mar-15 Apr-15 May-15 Jul-15 Aug-15 Sep-15 Nov-15 India Research Banking November 09, 2015 QUARTERLY REVIEW Bloomberg: PNB IN Reuters: PNBK.BO SELL Asset quality improves but recovery
Samba Bank Limited (SBL)
") Rating Report RATING REPORT REPORT DATE: June 27, 2018 RATING ANALYSTS: Jazib Ahmed - CFA jazib.ahmed@jcrvis.com.pk RATING DETAILS Latest Rating Previous Rating Rating Category Long-term Short-term Long-term
Rating Report RATING REPORT REPORT DATE: June 27, 2018 RATING ANALYSTS: Jazib Ahmed - CFA jazib.ahmed@jcrvis.com.pk RATING DETAILS Latest Rating Previous Rating Rating Category Long-term Short-term Long-term
Samba Bank Limited RATING REPORT. RATING DETAILS Latest Rating Previous Rating COMPANY INFORMATION
 Rating Report RATING REPORT Samba Bank Limited REPORT DATE: June 29, 2017 RATING ANALYSTS: Muniba Khan muniba.khan@jcrvis.com.pk Muhammad Ibad Desmukh ibad.deshmukh@jcrvis.com.pk RATING DETAILS Latest
UOB - Premier Regional Bank
 UOB - Premier Regional Bank First Half / Second Quarter 2004 Group Results Briefing Address by Mr Kuek Tong Au Executive Vice President Corporate Services 30 July 2004 Disclaimer : This material that follows
Hatton National Bank. 1H 2018 Performance
 Hatton National Bank 1H 2018 Performance 1H 2018 (Rs Bn) 1H 2017 (Rs Bn) Growth % Interest 51.0 46.5 9.6% Interest Expenses (29.0) (27.4) 5.6% Net Operating NII 22.0 19.1 15.3% Net Fee 4.4 4.1 8.8% Net
MCB Bank Limited FULL YEAR 2008 RESULTS PRESENTATION. 5 th March 2009
 MCB Bank Limited FULL YEAR 2008 RESULTS PRESENTATION 5 th March 2009 2008 Financial Highlights Consolidated O (U) PKR O (U) % PKR mm 2008 2007 2007 Net mark-up interest income 28,457 4,524 19% Non-interest
Federal Bank BUY. Performance Highlights. Target Price. 1QFY2018 Result Update Banking. Stock Info Sector
 1QFY218 Result Update Banking August 2, 217 Federal Bank Performance Highlights Particulars (` cr) 1QFY18 4QFY17 % chg (qoq) 1QFY17 % chg (yoy) NII 8.7 842.4 (5.) 692.7 15.6 Pre-prov. profit 557.9 549.2
National Bank of Pakistan
 Rating Report RATING REPORT REPORT DATE: July 5, 2017 RATING ANALYSTS: Muniba Khan muniba.khan@jcrvis.com.pk Muhammad Ibad Desmukh ibad.deshmukh@jcrvis.com.pk RATING DETAILS Latest Rating Previous Rating
Sohail Halai Alpesh Mehta
 BSE Sensex S&P CNX 20,039 6,064 Bloomberg IDBI IN Equity Shares (m) 1,278.4 M.Cap. (INR b)/(usd b) 144.9/2.7 52-Week Range (INR) 122/82 1,6,12 Rel.Perf.(%) -1/6/2 Financials & Valuation (INR b) Y/E March
PTC India Financial Services
 India I Equities BFSI Result Update Change in Estimates Target Reco 2 January 215 PTC India Financial Services Improving sanctions, high NIM, stable asset quality; Buy Key takeaways Strong loan growth,
HDFC Bank BUY. Performance Highlights. CMP `2,145 Target Price `2,500. Q3FY2019 Result Update Banking. 3-year price chart. Key financials (Standalone)
") Jan-16 May-16 Sep-16 Jan-17 May-17 Sep-17 Jan-18 May-18 Sep-18 Jan-19 Q3FY2019 Result Update Banking Jan 22, 2019 HDFC Bank Performance Highlights BUY CMP `2,145 Target Price `2,500 Particulars (` cr)
Jan-16 May-16 Sep-16 Jan-17 May-17 Sep-17 Jan-18 May-18 Sep-18 Jan-19 Q3FY2019 Result Update Banking Jan 22, 2019 HDFC Bank Performance Highlights BUY CMP `2,145 Target Price `2,500 Particulars (` cr)
ICICI Group: Strategy & Performance. February 2010
 ICICI Group: Strategy & Performance February 2010 Certain statements in these slides are forward-looking statements. These statements are based on management's current expectations and are subject to uncertainty
KKP Analyst Meeting 1Q16
 KKP Analyst Meeting 1Q16 April 28, 2016 1Q16 Financial Performance Kiatnakin Phatra April 2016 1 Table of Contents Performance Highlights Commercial Banking Business Capital Market Business Appendix 1Q16
RATING REPORT. Summit Bank Limited
 Rating Report RATING REPORT REPORT DATE: July 4, 2016 RATING ANALYSTS: Talha Iqbal talha.iqbal@jcrvis.com.pk Moiz Badshah moiz.badshah@jcrvis.com.pk RATING DETAILS Latest Rating Previous Rating Rating
ABU DHABI COMMERCIAL BANK PJSC REPORTS FIRST HALF 2018 NET PROFIT OF AED BILLION, SECOND QUARTER 2018 NET PROFIT OF AED 1.
 Abu Dhabi Commercial Bank Sheikh Zayed Bin Sultan Street P. O. Box: 939, Abu Dhabi http://www.adcb.com ABU DHABI COMMERCIAL BANK PJSC REPORTS FIRST HALF 2018 NET PROFIT OF AED 2.332 BILLION, SECOND QUARTER
HDFC Bank BUY. Operating performance strong; improved NIM. CMP `2,268 Target Price `2,500. Q4FY2019 Result Update Banking. 3-year price chart
 Apr-16 Sep-16 Feb-17 Jul-17 Dec-17 May-18 Oct-18 Mar-19 Q4FY2019 Result Update Banking Apr 22, 2019 HDFC Bank Operating performance strong; improved NIM Particulars (` cr) Q4FY19 Q3FY19 % chg (qoq) Q4FY18
Canara Bank. CMP: INR464 TP: INR645 Buy
 BSE SENSEX S&P CNX 17,234 5,205 Bloomberg CBK IN Equity Shares (m) 443.0 52-Week Range (INR) 672/349 1,6, 12 Rel.Perf.(%) 22/2/-13 M.Cap. (INR b) 205.6 M.Cap. (USD b) 4.1 31 January 2012 3QFY12 Results
BUY. State Bank of India (SBI) Banking RETAIL EQUITY RESEARCH. GEOJIT BNP PARIBAS Research. CMP Rs259 TARGET Rs284 RETURN 10% 22 nd August 2016
 Banking RETAIL EQUITY RESEARCH. GEOJIT BNP PARIBAS Research. CMP Rs259 TARGET Rs284 RETURN 10% 22 nd August 2016") Aug-15 Sep-15 Oct-15 Nov-15 Dec-15 Jan-16 Feb-16 Mar-16 Apr-16 May-16 Jun-16 Jul-16 Aug-16 Q1FY17 RESULT UPDATE GEOJIT BNP PARIBAS Research RETAIL EQUITY RESEARCH State Bank of India (SBI) Banking BSE
Aug-15 Sep-15 Oct-15 Nov-15 Dec-15 Jan-16 Feb-16 Mar-16 Apr-16 May-16 Jun-16 Jul-16 Aug-16 Q1FY17 RESULT UPDATE GEOJIT BNP PARIBAS Research RETAIL EQUITY RESEARCH State Bank of India (SBI) Banking BSE
Key estimate revision. Financial summary. Year FY14 391,088 45,198 34, FY15E 354,262 35,426 23,
 : price: EPS: How does our one year outlook change? We retain our negative stance on the stock. We expect s revenue to de-grow by 9% y-o-y on the back of muted execution (client side and clearance delays)
KEB Operating Results for 1H 2009
 KEB Operating Results for 1H 2009 August 2009 The information contained in this presentation material has not yet been audited by a third-party independent auditor and is subject to change during the accounting
Q1 FY19 FINANCIALS JUNE 30, 2018
 Q1 FY19 FINANCIALS JUNE 30, 2018 Key Highlights: Q1 FY19 (In lacs) 16.0 10.1 No. of Customers (Total: 30.8 lacs IBL customers: 13.4 lacs) 19.4 11.1 23.3 12.2 5.9 8.3 11.0 27.0 30.8 12.9 14.1 13.4 17.4
Punjab National Bank. CMP:INR1,103 TP:INR1,500 Buy
 BSE SENSEX S&P CNX 18,210 5,488 28 July 2011 1QFY12 Results Update Sector: Banking Punjab National Bank CMP:INR1,103 TP:INR1,500 Buy Bloomberg PNB IN Equity Shares (m) 316.8 52-Week Range (INR) 1,395/971
BUY. Weak P&L performance, good b/s show POWER FINANCE CORP. Target Price: Rs 135. Financial summary (Standalone) Y/E March FY17 FY18E FY19E FY20E
 Y/E March FY17 FY18E FY19E FY20E") Weak P&L performance, good b/s show PFC reported a disappointing P&L performance with Q3 PAT at Rs 16 bn (down 17.7% YoY; our est. Rs 18.6 bn), primarily led by sharp decline in NIM (down 35 bps QoQ at
Weak P&L performance, good b/s show PFC reported a disappointing P&L performance with Q3 PAT at Rs 16 bn (down 17.7% YoY; our est. Rs 18.6 bn), primarily led by sharp decline in NIM (down 35 bps QoQ at
ABU DHABI COMMERCIAL BANK PJSC REPORTS FIRST QUARTER 2018 NET PROFIT OF AED BILLION, AN INCREASE OF 13% QUARTER ON QUARTER, AND 9% YEAR ON YEAR
 Abu Dhabi Commercial Bank Sheikh Zayed Bin Sultan Street P. O. Box: 939, Abu Dhabi http://www.adcb.com ABU DHABI COMMERCIAL BANK PJSC REPORTS FIRST QUARTER 2018 NET PROFIT OF AED 1.207 BILLION, AN INCREASE
Financial summary. Year
 : price: ABV: How does our one year outlook change? We retain our positive outlook on KVB, led by an improving margin profile and cost containment kicking in, while our key thesis - a proven sole banking
ABU DHABI COMMERCIAL BANK PJSC REPORTS NINE MONTH 2018 NET PROFIT OF AED BILLION THIRD QUARTER 2018 NET PROFIT OF AED 1.
 Abu Dhabi Commercial Bank Sheikh Zayed Street P. O. Box: 939, Abu Dhabi http://www.adcb.com ABU DHABI COMMERCIAL BANK PJSC REPORTS NINE MONTH 2018 NET PROFIT OF AED 3.483 BILLION THIRD QUARTER 2018 NET
Pak China Investment Company Limited (PCICL)
") Rating Report RATING REPORT REPORT DATE: June 25, 2015 RATING ANALYSTS: Waqas Munir, FRM waqas.munir@jcrvis.com.pk Maham Qasim maham.qasim@jcrvis.com.pk RATING DETAILS Latest Rating Previous Rating Rating
Rating Report RATING REPORT REPORT DATE: June 25, 2015 RATING ANALYSTS: Waqas Munir, FRM waqas.munir@jcrvis.com.pk Maham Qasim maham.qasim@jcrvis.com.pk RATING DETAILS Latest Rating Previous Rating Rating
Faysal Bank Limited RATING REPORT. External auditors: A.F. Ferguson & Co. Chartered Accountants Chairman of the Board: Mr. Farooq Rahmatullah
 Faysal Bank Limited RATING REPORT REPORT DATE: July 3, 2015 RATING ANALYSTS: Talha Iqbal talha.iqbal@jcrvis.com.pk Mohammad Arsal Ayub arsal.ayub@jcrvis.com.pk RATING DETAILS Latest Rating Previous Rating
MCB Bank Limited Unconsolidated Condensed Interim Balance Sheet As at June 30, 2007
 MCB Bank Limited Unconsolidated Condensed Interim Balance Sheet As at 2007 Assets Unaudited Audited Note December 31, Cash and balances with treasury banks 36,581,502 32,465,976 Balances with other banks
BANK AL HABIB LIMITED (BAHL)
") The Pakistan Credit Rating Agency Limited (BAHL) ENTITY & INSTRUMENT RATINGS REPORT NEW [JUN-15] PREVIOUS [JUN-14] REPORT CONTENTS 1. RATING ANALYSES Long-Term AA+ AA+ 2. FINANCIAL INFORMATION Short-Term
The Pakistan Credit Rating Agency Limited (BAHL) ENTITY & INSTRUMENT RATINGS REPORT NEW [JUN-15] PREVIOUS [JUN-14] REPORT CONTENTS 1. RATING ANALYSES Long-Term AA+ AA+ 2. FINANCIAL INFORMATION Short-Term
ABU DHABI COMMERCIAL BANK PJSC REPORTS FIRST QUARTER 2015 NET PROFIT OF AED BN, AN INCREASE OF 13% YEAR ON YEAR, AND 22% QUARTER ON QUARTER
 Abu Dhabi Commercial Bank Sheikh Zayed Street P. O. Box: 939, Abu Dhabi http://www.adcb.com Press Release: Immediate Release ABU DHABI COMMERCIAL BANK PJSC REPORTS FIRST QUARTER 2015 NET PROFIT OF AED
RATING REPORT. Summit Bank Limited RATING DETAILS
 JCR-VIS Credit Rating Company Limited Technical Partner IIRA, Bahrain JV Partner CRISL, Bangladesh Rating Report RATING REPORT Summit Bank Limited REPORT DATE: July 3, 2015 RATING ANALYSTS: Talha Iqbal
Earnings Presentation
 Earnings Presentation June 30, 2016 BRSA Consolidated Financials ROBUST PROFITABILITY Net Income: TL2,605mn ROAE 1 : 16.0% ROAA 1 : 1.8% Net Income (TL million) 29% YoY 2,605 CORE OPERATING INCOME DEFINED
INVESTOR WEBINAR Q National Development Bank PLC NDB:N November 2017 : 1115 hrs : Colombo Sri Lanka
 INVESTOR WEBINAR Q3 2017 National Development Bank PLC NDB:N0000 01 November 2017 : 1115 hrs : Colombo Sri Lanka December - 2016 Corporate Participants Presented by Dimantha Seneviratne Director/ Chief
1Q18 EARNINGS PRESENTATION. Based on BRSA Consolidated Financials April 26 th 2018
 1Q18 EARNINGS PRESENTATION Based on BRSA Consolidated Financials April 26 th 2018 ROBUST EARNINGS PERFORMANCE NET INCOME (TL million) 2.2% ROAA vs. 1.9% in 2017 31% 2,011 1,537 1,702 18% 18.3% ROAE vs.
Joint Venture Financial Institutions (JVFIs)
") Joint Venture Financial Institutions (JVFIs) June 2017 JVFIs Universe Sr. # Joint Venture Financial Institution Incorporation Latest Rating Outlook Rating Agency 1 Pakistan Kuwait Investment Company (Private)
Joint Venture Financial Institutions (JVFIs) June 2017 JVFIs Universe Sr. # Joint Venture Financial Institution Incorporation Latest Rating Outlook Rating Agency 1 Pakistan Kuwait Investment Company (Private)
HFC NEUTRAL. Performance Highlights CMP. `678 Target Price - 1QFY2013 Result Update HFC. Investment Period - Key financials
 1QFY2013 Result Update HFC July 11, 2012 HDFC Performance Highlights Particulars (` cr) 1QFY13 4QFY12 % chg (qoq) 1QFY12 % chg (yoy) NII 1,258 1,681 (25.1) 998 26.0 Preprov. profit 1,420 1,849 (23.2) 1194
Habib Bank Limited RATING REPORT RATING DETAILS. Rating Category
 Rating Report RATING REPORT REPORT DATE: July 18, 2016 RATING ANALYSTS: Muniba Khan muniba.khan@jcrvis.com.pk Narendar Shankar Lal narendar.shankar@jcrvis.com.pk RATING DETAILS Latest Rating Previous Rating
Key estimate revision. Financial summary. Year
 : price: ABV: How does our one year outlook change? Retain our positive view on the stock. We continue to believe that SUF is a multi-year compounding opportunity in the asset and home financing segments.
Punjab National Bank ACCUMULATE. Performance Highlights. CMP `1,115 Target Price `1,259. 3QFY2011 Result Update Banking.
 3QFY2011 Result Update Banking January 21, 2011 Punjab National Bank Performance Highlights Particulars (` cr) 3QFY11 2QFY11 % chg (qoq) 3QFY10 % chg (yoy) NII 3,203 2,977 7.6 2,329 37.5 Pre-prov. profit
Canara Bank. CMP: INR419 TP: INR525 Buy
 BSE SENSEX S&P CNX 18,817 5,724 Bloomberg CBK IN Equity Shares (m) 443.0 52-Week Range (INR) 566/349 1,6, 12 Rel.Perf.(%) -7/-18/-17 M.Cap. (INR b) 170.3 M.Cap. (USD b) 3.0 7 November 2012 2QFY13 Results
Saudi Pak Industrial and Agricultural Investment Company Limited
 Rating Report Saudi Pak Industrial and Agricultural Investment Company Limited REPORT DATE: June 19, 2018 RATING ANALYSTS: Maimoon Rasheed maimoon@jcrvis.com.pk Maham Qasim maham.qasim@jcrvis.com.pk RATING
HDFC Bank. BUY CMP (Rs.) 1,807 Target (Rs.) 2,000 Potential Upside 11%
 1,807 Target (Rs.) 2,000 Potential Upside 11%") Oct-16 Nov-16 Dec-16 Jan-17 Feb-17 Mar-17 Apr-17 May-17 Jun-17 Jul-17 Aug-17 Sep-17 Oct-17. Volume No.. I Issue No. 147 HDFC Bank Oct. 31, 2017 BSE Code: 500180 NSE Code: HDFCBANK Reuters Code: HDBK.NS
Oct-16 Nov-16 Dec-16 Jan-17 Feb-17 Mar-17 Apr-17 May-17 Jun-17 Jul-17 Aug-17 Sep-17 Oct-17. Volume No.. I Issue No. 147 HDFC Bank Oct. 31, 2017 BSE Code: 500180 NSE Code: HDFCBANK Reuters Code: HDBK.NS
9M17. IFRS Financials 30 September IFRS Earnings Presentation 9M17
 9M17 Earnings Presentation IFRS Financials 30 September 2017 ROBUST & HIGH QUALITY EARNINGS PERFORMANCE Net Income (TL million) Cumulative 37% Quarterly ROAE 18.3% 14.8% @2016YE ROAA 2.2% 1.8% @2016YE
Banking Sector Report Q u a r t e r : D e c
 Banking Sector Report Q u a r t e r : D e c 2 0 1 5 by BoJay F r o n t i e r I n s i g h t s Performance Summary Credit growth accelerated in the December quarter Growth in Net Loans and Advances in Private
HDFC Bank BUY. Performance Highlights. CMP `1,965 Target Price `2,350. Q2FY2019 Result Update Banking. 3-year price chart. Exhibit 1: Key Financials
 Oct-15 Feb-16 Jun-16 Oct-16 Feb-17 Jun-17 Oct-17 Feb-18 Jun-18 Oct-18 Q2FY2019 Result Update Banking Oct 20, 2018 HDFC Bank Performance Highlights Particulars (` cr) Q2FY19 Q1FY19 % chg (qoq) Q2FY18 %
Kalpataru Power. Rating: Target price: EPS: Rating CMP. Target BUY. Rs Rs.256
 : price: EPS: How does our one year outlook change? We expect KPP s revenue (standalone) to grow by 21% y-o-y in FY17E backed by an order book of Rs. 91bn (1.7x FY17E book-to-bill). Both Transmission line
Equity Research
 Equity Research research@armsecurities.com.ng +234 1 270 1652 29 April 2016 Access Bank Plc. Earnings Report 3 months ended 31 st March, 2016 Benign funding costs and provisioning drive strong Q1 (STRONG
BUY. State Bank of India (SBI) Banking RETAIL EQUITY RESEARCH. Outlook getting better. CMP Rs278 TARGET Rs310 RETURN 12% 17 th November 2016
 Banking RETAIL EQUITY RESEARCH. Outlook getting better. CMP Rs278 TARGET Rs310 RETURN 12% 17 th November 2016") Q2FY17 RESULT UPDATE GEOJIT BNP PARIBAS Research RETAIL EQUITY RESEARCH State Bank of India (SBI) Banking BSE CODE: 500112 NSE CODE: SBIN Bloomberg CODE: SBIN:IN SENSEX: 26,228 BUY Rating as per Large
Q2FY17 RESULT UPDATE GEOJIT BNP PARIBAS Research RETAIL EQUITY RESEARCH State Bank of India (SBI) Banking BSE CODE: 500112 NSE CODE: SBIN Bloomberg CODE: SBIN:IN SENSEX: 26,228 BUY Rating as per Large
Axis Bank Ltd. For private circulation only. Volume No.. III Issue No October 08, 2018
 Oct-17 Nov-17 Dec-17 Jan-18 Feb-18 Mar-18 Apr-18 May-18 Jun-18 Jul-18 Aug-18 Sep-18 Oct-18 Volume No.. III Issue No. 188. Axis Bank Ltd. October 08, 2018 BSE Code: 532215 NSE Code: AXISBANK Reuters Code:
Investor Presentation First half June 2018
 Investor Presentation First half June 2018 Robin Fleming Group Chief Executive Officer 28 August 2018 Disclaimer NOT FOR PUBLICATION OR DISTRIBUTION, DIRECTLY OR INDIRECTLY This presentation has been prepared
Reduce. Punjab National Bank Banking RETAIL EQUITY RESEARCH. Not out of the woods. GEOJIT BNP PARIBAS Research. 10 th August 2016 Q1FY17 RESULT UPDATE
 Q1FY17 RESULT UPDATE Aug-15 Sep-15 Oct-15 GEOJIT BNP PARIBAS Research Nov-15 Dec-15 Jan-16 Feb-16 Mar-16 Apr-16 May-16 Jun-16 Jul-16 Aug-16 RETAIL EQUITY RESEARCH Punjab National Bank Banking BSE CODE:
NIIT Technologies. 3QFY19 Result Update. Robust revenue visibility, Outlook robust
 NIIT Technologies 3QFY19 Result Update Robust revenue visibility, Outlook robust Sector: Technology CMP: `1227 Recommendation: Buy Market statistics Current stock price (`) 1,227 Shares O/S (cr.) 6.1 Mcap
Soneri Bank Limited TFC II Jul-15
 Powered by TCPDF (www.tcpdf.org) The Pakistan Credit Rating Agency Limited Rating Report Soneri Bank Limited TFC II Jul-15 Report Contents 1. Rating Analysis 2. Financial Information 3. Rating Scale 4.
ABU DHABI COMMERCIAL BANK PJSC REPORTS NINE MONTH 2015 NET PROFIT OF AED BN, UP 18% YEAR ON YEAR
 Abu Dhabi Commercial Bank Sheikh Zayed Street P. O. Box: 939, Abu Dhabi http://www.adcb.com Press Release: Immediate Release ABU DHABI COMMERCIAL BANK PJSC REPORTS NINE MONTH 2015 NET PROFIT OF AED 3.736
Habib Bank Limited RATING REPORT. External auditors: Ernst & Young Ford Rhodes Sidat Hyder Chartered Accountants
 Rating Report RATING REPORT REPORT DATE: December 17, 2015 RATING ANALYSTS: Talha Iqbal talha.iqbal@jcrvis.com.pk MohammadArsal Ayub arsal.ayub@jcrvis.com.pk RATING DETAILS Latest Rating Previous Rating
ICICI Bank BUY. Performance Highlights. CMP Target Price `328 `416. 3QFY2018 Result Update Banking. 3-year price chart. Key financials (Standalone)
") Feb-15 Jun-15 Oct-15 Feb-16 Jun-16 Oct-16 Feb-17 Jun-17 Oct-17 Feb-18 3QFY2018 Result Update Banking February 15, 2018 ICICI Bank Performance Highlights Particulars (` cr) 3QFY18 2QFY18 % chg (qoq) 3QFY17
Feb-15 Jun-15 Oct-15 Feb-16 Jun-16 Oct-16 Feb-17 Jun-17 Oct-17 Feb-18 3QFY2018 Result Update Banking February 15, 2018 ICICI Bank Performance Highlights Particulars (` cr) 3QFY18 2QFY18 % chg (qoq) 3QFY17
United Overseas Bank Limited
 United Overseas Bank Limited Incorporated in the Republic of Singapore Company Registration Number: 193500026Z GROUP FINANCIAL PERFORMANCE FOR THE NINE MONTHS / THIRD QUARTER 2005 28 OCTOBER 2005 Contents
Equitas Holdings Limited Investor Presentation Q1FY19 Quarter ended 30 June 2018
 Equitas Holdings Limited Investor Presentation Q1FY19 Quarter ended 30 June 2018 1 MISSION Empowering through Financial Inclusion VISION To Serve 5% of Indian Households by 2025 VALUES Fair and Transparent
Axis Bank BUY. CMP Target Price `620 `750. Update Bank. Earnings to normalize with stabilizing credit costs. 3-year price chart.
 Jan-15 May-15 Sep-15 Jan-16 May-16 Sep-16 Jan-17 May-17 Sep-17 Jan-18 May-18 Sep-18 Jan-19 Update Bank Jan 02, 2019 Axis Bank Earnings to normalize with stabilizing credit costs Axis is the third-largest
Equitas Holdings Limited Investor Presentation Q3FY17
 Equitas Holdings Limited Investor Presentation Q3FY17 1 Mission Empowering through Financial Inclusion Vision To Serve 5% of Indian Households by 2025 Values Fair and Transparent 2 Highlights Q3FY17 Rs.7,181
FY17 FY18 FY19E FY20E
 102015 012016 042016 072016 102016 012017 042017 072017 102017 012018 042018 072018 Q2FY19 Result Update Institutional Research October 25, 2018 Kotak Mahindra Bank Q2FY19 Result Update Strong growth in
Investor Presentation 2nd Quarter Results : FY th Nov, 2018
 Investor Presentation 2nd Quarter Results : FY 18-19 13 th Nov, 218 Contents 1 Quarterly Financial Performance Page # 3 2 Quarterly Business Secured and Order Book 12 3 Annual Performance Summary 18 2
Key estimate revision. Financial summary. Year
 : price: ABV: How does our one year outlook change? While we continue to believe that SUF is a multi-year compounding opportunity in the asset and home financing segments, we take note of the under-performance
Adani Ports & SEZ Rating: Target price: EPS:
 Adani Ports & SEZ : price: EPS: Volume traction continues in a seasonally good quarter; maintain Adani Ports & SEZ reported a good quarter with total operating revenues (standalone) of Rs. 8.02bn and PAT