IN THIS LECTURE, YOU WILL LEARN:
|
|
|
- Dennis Norman
- 5 years ago
- Views:
Transcription
1 IN THIS LECTURE, YOU WILL LEARN: Am simple perfect competition production medium-run model view of what determines the economy s total output/income how the prices of the factors of production are determined according to this model how total income is distributed what determines the demand for goods and services how equilibrium in the goods market is achieved 2 theories of consumption 0
2 Outline of model A closed economy, market-clearing model Supply side factor markets (supply, demand, price) determination of output/income Demand side determinants of C, I, and G Equilibrium goods market loanable funds market 1
3 Production Model Vast oversimplifications of the real world in a model can still allow it to provide important insights. Consider the following model Single, closed economy One consumption good 2
4 Factors of production K = capital: tools, machines, and structures used in production L = labor: the physical and mental efforts of workers 3
5 The production function: Y = F(K,L) shows how much output (Y) the economy can produce from K units of capital and L units of labor reflects the economy s level of technology We assume that the production function for the economy as a whole exhibits constant returns to scale 4
6 Returns to scale: a review Initially Y 1 = F (K 1, L 1 ) Scale all inputs by the same factor z: K 2 = zk 1 and L 2 = zl 1 (e.g., if z = 1.2, then all inputs are increased by 20%) What happens to output, Y 2 = F (K 2, L 2 )? If constant returns to scale, Y 2 = zy 1 If increasing returns to scale, Y 2 > zy 1 If decreasing returns to scale, Y 2 < zy 1 5
7 Returns to scale: Example 1 F( K, L) KL F( zk, zl) ( zk)( zl) 2 z KL z 2 KL z KL z F( K, L) constant returns to scale for any z > 0 6
8 Returns to scale: Example 2 F( K, L) K L F( zk, zl) zk zl z K z L z K L z F( K, L) decreasing returns to scale for any z > 1 7
9 Returns to scale: Example 3 F( K, L) K L 2 2 F( zk, zl) ( zk) ( zl) 2 2 z K L z F( K, L) 2 increasing returns to scale for any z > 1 8
10 NOW YOU TRY Returns to scale Determine whether each of these production functions has constant, decreasing, or increasing returns to scale: (a) F( K, L) K L 2 (b) F( K, L) K L 9
11 ANSWERS Returns to scale, part (a) F( K, L) K L 2 F( zk, zl) ( zk) zl 2 zk zl 2 2 K z L 2 z F( K, L) constant returns to scale for any z > 0 CHAPTER 1 The Science of Macroeconomics 10
 constant returns to scale for any z > 0 CHAPTER 1 The Science of Macroeconomics")
12 ANSWERS Returns to scale, part (b) F( K, L) K L F( zk, zl) zk zl z( K L) z F( K, L) constant returns to scale for any z > 0 CHAPTER 1 The Science of Macroeconomics 11
13 Assumptions 1. Technology is fixed. 2. The economy s supplies of capital and labor are fixed at K K and L L 12
14 Determining GDP Output is determined by the fixed factor supplies and the fixed state of technology: Y F( K, L) 13
15 The distribution of national income determined by factor prices, the prices per unit firms pay for the factors of production wage = price of L rental rate = price of K 14
 R /P = real rental")
16 Notation W R P W /P = nominal wage = nominal rental rate = price of output = real wage (measured in units of output) R /P = real rental rate 15
17 How factor prices are determined Factor prices determined by supply and demand in factor markets. Recall: Supply of each factor is fixed. What about demand? 16
18 Demand for labor Assume markets are competitive: each firm takes W, R, and P as given. Basic idea: A firm hires each unit of labor if the cost does not exceed the benefit. cost = real wage benefit = marginal product of labor 17
19 Marginal product of labor (MPL) definition: The extra output the firm can produce using an additional unit of labor (holding other inputs fixed): MPL = F(K, L+1) F(K,L) 18
20 NOW YOU TRY Compute & graph MPL a. Determine MPL at each value of L. b. Graph the production function. c. Graph the MPL curve with MPL on the vertical axis and L on the horizontal axis. L Y MPL 0 0 n.a. 1 10? 2 19? ? 5 40? 6 45? 7 49? 8 52? 9 54? 10 55? 19


21 ANSWERS Compute & graph MPL Marginal Product of Labor MPL (units of output) Labor (L) 20
 1 MPL Slope of the production function equals MPL L labor")
22 MPL and the production function Y output As more labor is added, MPL 1 MPL 1 MPL F ( K, L) 1 MPL Slope of the production function equals MPL L labor 21
23 Diminishing marginal returns As an input is increased, its marginal product falls (other things equal). Intuition: Suppose L while holding K fixed fewer machines per worker lower worker productivity 22
24 NOW YOU TRY Identifying Diminishing Returns Which of these production functions have diminishing marginal returns to labor? a) F( K, L) 2K 15L b) F( K, L) KL c) F( K, L) 2 K 15 L 23
25 ANSWERS Identifying Diminishing Returns a) F( K, L) 2K 15L No, MPL = 15 for all L b) F( K, L) KL Yes, MPL falls as L rises c) F( K, L) 2 K 15 L Yes, MPL falls as L rises CHAPTER 1 The Science of Macroeconomics 24
26 NOW YOU TRY MPL and labor demand Suppose W/P = 6. If L = 3, should firm hire more or less labor? Why? If L = 7, should firm hire more or less labor? Why? L Y MPL 0 0 n.a CHAPTER 1 The Science of Macroeconomics 25
27 ANSWERS MPL and labor demand If L = 3, should firm hire more or less labor? Answer: YES, because the benefit of the 4th worker (MPL = 7) exceeds its cost (W/P = 6) If L = 7, should firm hire more or less labor? Answer: NO, the firm should reduce labor. The 7th worker adds MPL = 4 units of output but costs the firm W/P = CHAPTER 1 The Science of Macroeconomics L Y MPL 0 0 n.a

28 MPL and the demand for labor Units of output Real wage Each firm hires labor up to the point where MPL = W/P. Quantity of labor demanded MPL, Labor demand Units of labor, L 27
29 The equilibrium real wage Units of output Labor supply The real wage adjusts to equate labor demand with supply. equilibrium real wage L MPL, Labor demand Units of labor, L 28
30 Determining the rental rate We have just seen that MPL = W/P. The same logic shows that MPK = R/P: diminishing returns to capital: MPK as K The MPK curve is the firm s demand curve for renting capital. Firms maximize profits by choosing K such that MPK = R/P. 29

31 The equilibrium real rental rate Units of output Supply of capital The real rental rate adjusts to equate demand for capital with supply. equilibrium R/P K MPK, demand for capital Units of capital, K 30
32 The Neoclassical Theory of Distribution states that each factor input is paid its marginal product a good starting point for thinking about income distribution 31
33 How income is distributed to L and K total labor income = W L P total capital income = R K P MPL L MPK K If production function has constant returns to scale, then Y MPL L MPK K national income labor income capital income 32
 However, over the last 40 years or so it has been falling somewhat.")
34 The ratio of labor income to total income in the U.S., Labor s share of total income Labor s share of income has historically been fairly constant over time. (Thus, capital s share is, too.) However, over the last 40 years or so it has been falling somewhat

35 Share of Labor Income by Sector 34
36 The Cobb-Douglas Production Function The Cobb-Douglas production function has constant factor shares: = capital s share of total income: capital income = MPK K = Y labor income = MPL L = (1 )Y The Cobb-Douglas production function is: Y 1 AK L where A represents the level of technology. 35
37 The Cobb-Douglas Production Function Each factor s marginal product is proportional to its average product: MPK AK L MPL 1 1 Y (1 ) AK L K (1 ) Y L 36
38 Labor productivity and wages Theory: wages depend on labor productivity U.S. data: period productivity growth real wage growth % 1.9% % 2.8% % 1.2% % 2.2% 37
39 Analyzing the Production Model Per capita = per person Per worker = per member of the labor force. In this model, the two are equal. We can perform a change of variables to define output per capita (y) and capital per person (k). 38
40 Output per person equals the productivity parameter times capital per person raised to the one-third power. Output per person Productivity parameter Capital per person 39
41 What makes a country rich or poor? Output per person is higher if the productivity parameter is higher or if the amount of capital per person is higher. What can you infer about the value of the productivity parameter or the amount of capital in poor countries? 40
42 Diminishing returns to capital implies that: Countries with low K will have a high MPK Countries with a lot of K will have a low MPK, and cannot raise GDP per capita by much through more capital accumulation If the productivity parameter is 1, the model overpredicts GDP per capita. 41
43 42
44 43
45 44
46 Case Study: Why Doesn t Capital Flow from Rich to Poor Countries? If MPK is higher in poor countries with low K, why doesn t capital flow to those countries? Short Answer: Simple production model with no difference in productivity across countries is misguided. We must also consider the productivity parameter. 45
47 Productivity Differences: Improving the Fit of the Model The productivity parameter measures how efficiently countries are using their factor inputs. Often called total factor productivity (TFP) If TFP is no longer equal to 1, we can obtain a better fit of the model. 46
48 However, data on TFP is not collected. It can be calculated because we have data on output and capital per person. TFP is referred to as the residual. A lower level of TFP Implies that workers produce less output for any given level of capital per person 47
49 48
50 49
51 50
52 Output differences between the richest and poorest countries? Differences in capital per person explain about one-quarter of the difference. TFP explains the remaining three-quarters. Thus, rich countries are rich because: They have more capital per person. More importantly, they use labor and capital more efficiently. 51
53 Outline of model A closed economy, market-clearing model Supply side DONE factor markets (supply, demand, price) DONE determination of output/income Demand side Next determinants of C, I, and G Equilibrium goods market loanable funds market 52
54 Demand for goods and services Components of aggregate demand: C = consumer demand for g & s I = demand for investment goods G = government demand for g & s (closed economy: no NX) 53
55 Consumption, C def: Disposable income is total income minus total taxes: Y T. Consumption function: C = C (Y T ) Shows that (Y T ) C def: Marginal propensity to consume (MPC) is the change in C when disposable income increases by one dollar. 54
56 The consumption function C C (Y T ) 1 MPC The slope of the consumption function is the MPC. Y T 55
57 Investment, I The investment function is I = I(r) where r denotes the real interest rate, the nominal interest rate corrected for inflation. The real interest rate is the cost of borrowing the opportunity cost of using one s own funds to finance investment spending So, r I 56
58 The investment function r Spending on investment goods depends negatively on the real interest rate. I (r ) I 57
59 Government spending, G G = govt spending on goods and services G excludes transfer payments (e.g., Social Security benefits, unemployment insurance benefits) Assume government spending and total taxes are exogenous: G G and T T 58
60 The market for goods & services Aggregate demand: C ( Y T ) I ( r ) G Aggregate supply: Y F ( K, L) Equilibrium: Y = C ( Y T ) I ( r ) G The real interest rate adjusts to equate demand with supply. 59
61 The loanable funds market A simple supply demand model of the financial system. One asset: loanable funds demand for funds: investment supply of funds: price of funds: saving real interest rate 60
62 Demand for funds: Investment The demand for loanable funds comes from investment: Firms borrow to finance spending on plant & equipment, new office buildings, etc. Consumers borrow to buy new houses. depends negatively on r, the price of loanable funds (cost of borrowing). 61
63 Loanable funds demand curve r The investment curve is also the demand curve for loanable funds. I (r ) I 62
64 Supply of funds: Saving The supply of loanable funds comes from saving: Households use their saving to make bank deposits, purchase bonds and other assets. These funds become available to firms to borrow to finance investment spending. The government may also contribute to saving if it does not spend all the tax revenue it receives. 63
65 Types of saving private saving = (Y T) C public saving = T G national saving, S = private saving + public saving = (Y T ) C + T G = Y C G 64
66 Notation: = change in a variable For any variable X, X = change in X is the Greek (uppercase) letter Delta Examples: If L = 1 and K = 0, then Y = MPL. Y More generally, if K = 0, then MPL. L (Y T ) = Y T, so C = MPC ( Y T ) = MPC Y MPC T 65
67 NOW YOU TRY Calculate the change in saving Suppose MPC = 0.8 and MPL = 20. For each of the following, compute S : a. G = 100 b. T = 100 c. Y = 100 d. L = 10 66

68 NOW YOU TRY Answers S Y C G Y 0.8( Y T ) G 0.2 Y 0.8 T G a. S 100 b. S c. S d. Y MPL L , CHAPTER 1 S 0.2 Y The Science of Macroeconomics 67
69 Budget surpluses and deficits If T > G, budget surplus = (T G) = public saving. If T < G, budget deficit = (G T) and public saving is negative. If T = G, balanced budget, public saving = 0. The U.S. government finances its deficit by issuing Treasury bonds i.e., borrowing. 68
70 percent of GDP U.S. Federal Government Surplus/Deficit,
71 percent of GDP U.S. Federal Government Debt,

72 Loanable funds supply curve r S Y C ( Y T ) G For now, we assume that national saving does not depend on r, so the supply curve is vertical. S, I 71
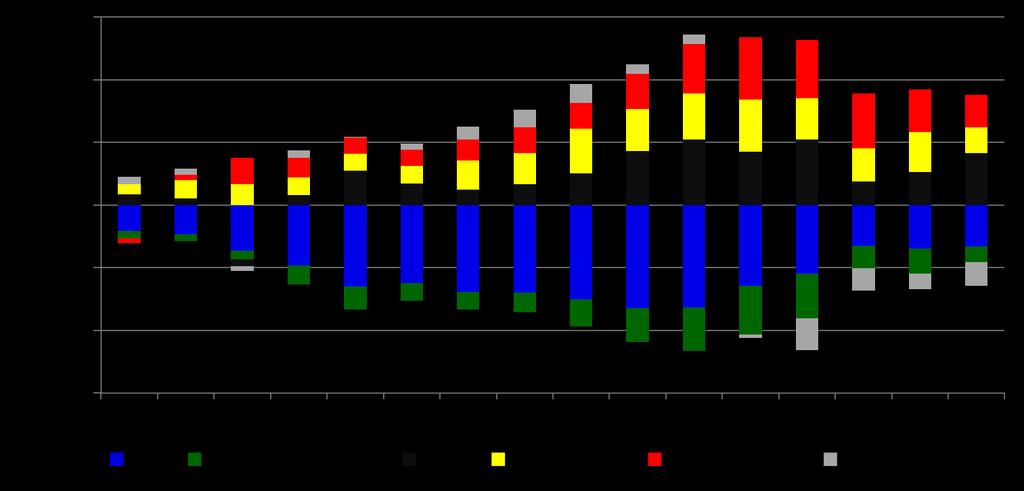
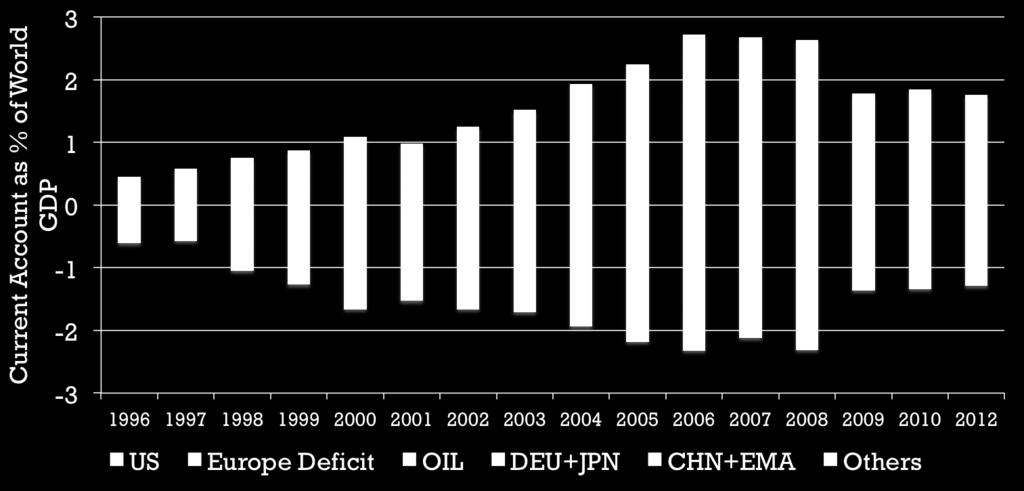
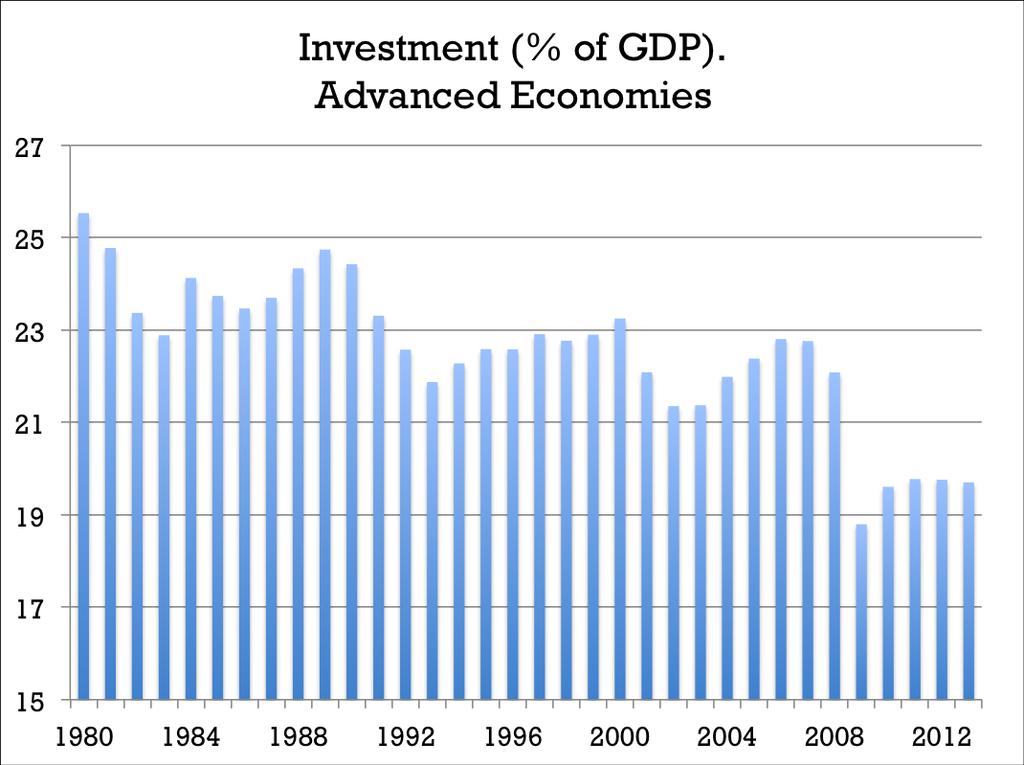
73 Loanable funds market equilibrium r S Y C ( Y T ) G Equilibrium real interest rate I (r ) Equilibrium level of investment S, I 72
 to both sides to get Y = C + I + G Eq m in L.F.")
74 The special role of r r adjusts to equilibrate the goods market and the loanable funds market simultaneously: Thus, If L.F. market in equilibrium, then Y C G = I Add (C +G ) to both sides to get Y = C + I + G Eq m in L.F. market (goods market eq m) Eq m in goods market 73
75 Digression: Mastering models To master a model, be sure to know: 1. Which of its variables are endogenous and which are exogenous. 2. For each curve in the diagram, know: a. definition b. intuition for slope c. all the things that can shift the curve 74
76 Mastering the loanable funds model Things that shift the saving curve public saving fiscal policy: changes in G or T private saving preferences tax laws that affect saving 401(k) IRA replace income tax with consumption tax 75
77 CASE STUDY: The Reagan deficits Reagan policies during early 1980s: increases in defense spending: G > 0 big tax cuts: T < 0 Both policies reduce national saving: S Y C ( Y T ) G G S T C S 76


78 CASE STUDY: The Reagan deficits 1. The increase in the deficit reduces saving r S 2 S 1 2. which causes the real interest rate to rise r 2 r 1 3. which reduces the level of investment. I 2 I 1 I (r ) S, I 77
79 Are the data consistent with these results? 1970s 1980s T G S r I T G, S, and I are expressed as a percent of GDP All figures are averages over the decade shown. 78
80 Mastering the loanable funds model, continued Things that shift the investment curve: some technological innovations to take advantage some innovations, firms must buy new investment goods tax laws that affect investment e.g., investment tax credit 79
81 An increase in investment demand r S raises the interest rate. But the equilibrium level of investment cannot increase because the supply of loanable funds is fixed. r 2 r 1 An increase in desired investment I 1 I 2 S, I 80
82 Another look at Consumption, Saving and the interest rate Why might saving depend on r? How would the results of an increase in investment demand be different? Would r rise as much? Would the equilibrium value of I change? 81

83 An increase in investment demand when saving depends on r An increase in investment demand raises r, which induces an increase in the quantity of saving, which allows I to increase. r r 2 r 1 S( r) I(r) 2 I(r) I 1 I 2 S, I 82
84 Increase in Global Savings 83
85 Effect on Global Balances 84
86 85
87 86
88 87
89 Consumption How do you decide how much to spend on consumption? 88
90 Consumption 2 competing views of consumption 1. Consumption depends primarily on current income (Keynesian consumption function). 2. People prefer a smooth path for consumption compared to a path that involves large movements (Permanent Income/Life Cycle Hypothesis). 89
91 The Keynesian consumption function C As income rises, consumers save a bigger fraction of their income, so APC falls. C C cy C C APC c Y Y slope = APC Y 90
92 Early empirical successes: Results from early studies Households with higher incomes: consume more, MPC > 0 save more, MPC < 1 save a larger fraction of their income, APC as Y Very strong correlation between income and consumption: income seemed to be the main determinant of consumption 91
93 Problems for the Keynesian consumption function Based on the Keynesian consumption function, economists predicted that C would grow more slowly than Y over time. This prediction did not come true: As incomes grew, APC did not fall, and C grew at the same rate as income. Simon Kuznets showed that C/Y was very stable from decade to decade. 92
94 The Consumption Puzzle C Consumption function from long time-series data (constant APC ) Consumption function from cross-sectional household data (falling APC ) Y 93
95 Irving Fisher and Intertemporal Choice The basis for much subsequent work on consumption. Assumes consumer is forward-looking and chooses consumption for the present and future to maximize lifetime satisfaction. Consumer s choices are subject to an intertemporal budget constraint, a measure of the total resources available for present and future consumption. 94
96 The basic two-period model Period 1: the present Period 2: the future Notation Y 1, Y 2 = income in period 1, 2 C 1, C 2 = consumption in period 1, 2 S = Y 1 C 1 = saving in period 1 (S < 0 if the consumer borrows in period 1) 95
97 Deriving the intertemporal budget constraint Period 2 budget constraint: Rearrange terms: C 2 Y2 (1 r ) S Y (1 r )( Y C ) (1 r ) C C Y (1 r ) Y Divide through by (1+r ) to get 96
98 The intertemporal budget constraint C C Y Y 1 r 1 r present value of lifetime consumption present value of lifetime income 97

99 The intertemporal budget constraint C 2 C C Y Y 1 r 1 r (1 r ) Y Y The budget constraint shows all combinations of C 1 and C 2 that just exhaust the consumer s resources. 1 2 Y 2 Saving Y 1 Consump = income in both periods Borrowing Y Y (1 r ) 1 2 C 1 98
 C 2 1 C C Y Y 1 r 1 r 2 2 1 1 (1+r ) Y 2 Y 1 C 1")
100 The intertemporal budget constraint The slope of the budget line equals (1+r ) C 2 1 C C Y Y 1 r 1 r (1+r ) Y 2 Y 1 C 1 99

101 Consumer preferences An indifference curve shows all combinations of C 1 and C 2 that make the consumer equally happy. C 2 Higher indifference curves represent higher levels of happiness. IC 2 IC 1 C 1 100

102 Consumer preferences Marginal rate of substitution (MRS ): the amount of C 2 the consumer would be willing to substitute for one unit of C 1. C 2 1 MRS The slope of an indifference curve at any point equals the MRS at that point. IC 1 C 1 101

103 Optimization The optimal (C 1,C 2 ) is where the budget line just touches the highest indifference curve. C 2 O At the optimal point, MRS = 1+r C 1 102

104 How C responds to changes in Y Results: Provided they are both normal goods, C 1 and C 2 both increase, whether the income increase occurs in period 1 or period 2. C 2 An increase in Y 1 or Y 2 shifts the budget line outward. C 1 103
105 Keynes vs. Fisher Keynes: Current consumption depends only on current income. Fisher: Current consumption depends only on the present value of lifetime income. The timing of income is irrelevant because the consumer can borrow or lend between periods. 104
106 How C responds to changes in r As depicted here, C 1 falls and C 2 rises. However, it could turn out differently C 2 B An increase in r pivots the budget line around the point (Y 1,Y 2 ). A Y 2 Y 1 C 1 105
107 How C responds to changes in r income effect: If consumer is a saver, the rise in r makes him better off, which tends to increase consumption in both periods. substitution effect: The rise in r increases the opportunity cost of current consumption, which tends to reduce C 1 and increase C 2. Both effects C 2. Whether C 1 rises or falls depends on the relative size of the income & substitution effects. 106
108 Constraints on borrowing In Fisher s theory, the timing of income is irrelevant: Consumer can borrow and lend across periods. Example: If consumer learns that her future income will increase, she can spread the extra consumption over both periods by borrowing in the current period. However, if consumer faces borrowing constraints (a.k.a. liquidity constraints), then she may not be able to increase current consumption and her consumption may behave as in the Keynesian theory even though she is rational & forward-looking. 107
109 Constraints on borrowing C 2 The budget line with no borrowing constraints Y 2 Y 1 C 1 108
110 Constraints on borrowing The borrowing constraint takes the form: C 1 Y 1 Y 2 C 2 The budget line with a borrowing constraint Y 1 C 1 109
111 Consumer optimization when the borrowing constraint is not binding The borrowing constraint is not binding if the consumer s optimal C 1 is less than Y 1. C 2 Y 1 C 1 110
112 Consumer optimization when the borrowing constraint is binding The optimal choice is at point D. C 2 But since the consumer cannot borrow, the best he can do is point E. E D Y 1 C 1 111
113 L E C T U R E S U M M A R Y Total output is determined by: the economy s quantities of capital and labor the level of technology Competitive firms hire each factor until its marginal product equals its price. If the production function has constant returns to scale, then labor income plus capital income equals total income (output). 112
114 L E C T U R E S U M M A R Y A closed economy s output is used for consumption, investment, and government spending. The real interest rate adjusts to equate the demand for and supply of: goods and services. loanable funds. 113
115 L E C T U R E S U M M A R Y A decrease in national saving causes the interest rate to rise and investment to fall. An increase in investment demand causes the interest rate to rise but does not affect the equilibrium level of investment if the supply of loanable funds is fixed. 114
116 L E C T U R E S U M M A R Y CHAPTER 1 Alternative Views of Consumption 1. Keynesian consumption theory Keynes s conjectures MPC is between 0 and 1 APC falls as income rises current income is the main determinant of current consumption Empirical studies in household data & short time series: confirmation of Keynes s conjectures in long-time series data: APC does not fall as income rises The Science of Macroeconomics 115
117 L E C T U R E S U M M A R Y 2. Fisher s theory of intertemporal choice Consumer chooses current & future consumption to maximize lifetime satisfaction of subject to an intertemporal budget constraint. Current consumption depends on lifetime income, not current income, provided consumer can borrow & save. CHAPTER 1 The Science of Macroeconomics 116
ECON 3010 Intermediate Macroeconomics. Chapter 3 National Income: Where It Comes From and Where It Goes
 ECON 3010 Intermediate Macroeconomics Chapter 3 National Income: Where It Comes From and Where It Goes Outline of model A closed economy, market-clearing model Supply side factors of production determination
9/10/2017. National Income: Where it Comes From and Where it Goes (in the long-run) Introduction. The Neoclassical model
 Introduction. The Neoclassical model") Chapter 3 - The Long-run Model National Income: Where it Comes From and Where it Goes (in the long-run) Introduction In chapter 2 we defined and measured some key macroeconomic variables. Now we start
Chapter 3 - The Long-run Model National Income: Where it Comes From and Where it Goes (in the long-run) Introduction In chapter 2 we defined and measured some key macroeconomic variables. Now we start
In this chapter, you will learn C H A P T E R National Income: Where it Comes From and Where it Goes CHAPTER 3
 C H A P T E R 3 National Income: Where it Comes From and Where it Goes MACROECONOMICS N. GREGORY MANKIW 007 Worth Publishers, all rights reserved SIXTH EDITION PowerPoint Slides by Ron Cronovich In this
Macroeconomcs. Factors of production. Outline of model. In this chapter you will learn:
 In this chapter you will learn: Macroeconomcs Professor Hisahiro Naito what determines the economy s total output/income how the prices of the factors of production are determined how total income is distributed
PART II CLASSICAL THEORY. Chapter 3: National Income: Where it Comes From and Where it Goes 1/64
 PART II CLASSICAL THEORY Chapter 3: National Income: Where it Comes From and Where it Goes 1/64 Chapter 3: National Income: Where it Comes From and Where it Goes 2/64 * Slides based on Ron Cronovich's
Chapter 3 National Income: Where It Comes From And Where It Goes
 Chapter 3 National Income: Where It Comes From And Where It Goes 0 1 1 2 The Neo-Classical Model Goal: to explain the more realistic circular flow Supply Side (firms): how total output(=income; GDP) is
PART II CLASSICAL THEORY. Chapter 3: National Income: Where it Comes From and Where it Goes 1/51
 PART II CLASSICAL THEORY Chapter 3: National Income: Where it Comes From and Where it Goes 1/51 Chapter 3: National Income: Where it Comes From and Where it Goes 2/51 *Slides based on Ron Cronovich's slides,
11/6/2013. Chapter 17: Consumption. Early empirical successes: Results from early studies. Keynes s conjectures. The Keynesian consumption function
 Keynes s conjectures Chapter 7:. 0 < MPC < 2. Average propensity to consume (APC) falls as income rises. (APC = C/ ) 3. Income is the main determinant of consumption. 0 The Keynesian consumption function
MACROECONOMICS II - CONSUMPTION
 MACROECONOMICS II - CONSUMPTION Stefania MARCASSA stefania.marcassa@u-cergy.fr http://stefaniamarcassa.webstarts.com/teaching.html 2016-2017 Plan An introduction to the most prominent work on consumption,
Chapter 16 Consumption. 8 th and 9 th editions 4/29/2017. This chapter presents: Keynes s Conjectures
 2 0 1 0 U P D A T E 4/29/2017 Chapter 16 Consumption 8 th and 9 th editions This chapter presents: An introduction to the most prominent work on consumption, including: John Maynard Keynes: consumption
Road-Map to this Lecture
 Allocation 1 Road-Map to this Lecture 1. Consumption 2. Investment 3. Government Expenditures 4. Equilibrium: equilibrium in financial markets 5. Fiscal Policy I slide 1 2 Demand for goods & services Components
Outline of model. The supply side The production function Y = F (K, L) A closed economy, market-clearing model
 A closed economy, market-clearing model") CHAPTER THREE National Income: Where it Comes From and Where it Goes what what determines the the economy s total total output/income how how the the prices prices of of the the factors factors of of production
CHAPTER THREE National Income: Where it Comes From and Where it Goes what what determines the the economy s total total output/income how how the the prices prices of of the the factors factors of of production
ECON 314:MACROECONOMICS 2 CONSUMPTION AND CONSUMER EXPENDITURE
 ECON 314:MACROECONOMICS 2 CONSUMPTION AND CONSUMER EXPENDITURE CONSUMPTION AND CONSUMER EXPENDITURE Previously, consumption was conjectured to be a function of income, more precisely current income. This
ECON 314: MACROECONOMICS II CONSUMPTION
 ECON 314: MACROECONOMICS II CONSUMPTION Consumption is a key component of aggregate demand in any modern economy. Previously we considered consumption in a simple way: consumption was conjectured to be
Micro foundations, part 1. Modern theories of consumption
 Micro foundations, part 1. Modern theories of consumption Joanna Siwińska-Gorzelak Faculty of Economic Sciences, Warsaw University Lecture overview This lecture focuses on the most prominent work on consumption.
Chapter 3. National Income: Where it Comes from and Where it Goes
 ECONOMY IN THE LONG RUN Chapter 3 National Income: Where it Comes from and Where it Goes 1 QUESTIONS ABOUT THE SOURCES AND USES OF GDP Here we develop a static classical model of the macroeconomy: prices
Lecture notes: 101/105 (revised 9/27/00) Lecture 3: national Income: Production, Distribution and Allocation (chapter 3)
 Lecture 3: national Income: Production, Distribution and Allocation (chapter 3)") Lecture notes: 101/105 (revised 9/27/00) Lecture 3: national Income: Production, Distribution and Allocation (chapter 3) 1) Intro Have given definitions of some key macroeconomic variables. Now start building
Lecture notes: 101/105 (revised 9/27/00) Lecture 3: national Income: Production, Distribution and Allocation (chapter 3) 1) Intro Have given definitions of some key macroeconomic variables. Now start building
ECON Intermediate Macroeconomic Theory
 ECON 3510 - Intermediate Macroeconomic Theory Fall 2015 Mankiw, Macroeconomics, 8th ed., Chapter 3 Chapter 3: A Theory of National Income Key points: Understand the aggregate production function Understand
EC 205 Macroeconomics I Fall Problem Session 2 Solutions. Q1. Use the neoclassical theory of distribution to predict the impact on the real wage
 Department of Economics Boğaziçi University EC 205 Macroeconomics I Fall 2015 Problem Session 2 Solutions Q1. Use the neoclassical theory of distribution to predict the impact on the real wage and the
The ratio of consumption to income, called the average propensity to consume, falls as income rises
 Part 6 - THE MICROECONOMICS BEHIND MACROECONOMICS Ch16 - Consumption In previous chapters we explained consumption with a function that relates consumption to disposable income: C = C(Y - T). This was
Chapter 7. Economic Growth I: Capital Accumulation and Population Growth (The Very Long Run) CHAPTER 7 Economic Growth I. slide 0
 CHAPTER 7 Economic Growth I. slide 0") Chapter 7 Economic Growth I: Capital Accumulation and Population Growth (The Very Long Run) slide 0 In this chapter, you will learn the closed economy Solow model how a country s standard of living depends
Chapter 7 Economic Growth I: Capital Accumulation and Population Growth (The Very Long Run) slide 0 In this chapter, you will learn the closed economy Solow model how a country s standard of living depends
Chapter 3: National Income: Where it Comes From and Where it Goes. CHAPTER 3 National Income. slide 0
 Chapter 3: National Income: Where it Comes From and Where it Goes slide 0 In this chapter, you will learn what determines the economy s total output/income how the prices of the factors of production are
CHAPTER 3 National Income: Where It Comes From and Where It Goes
 CHAPTER 3 National Income: Where It Comes From and Where It Goes A PowerPoint Tutorial To Accompany MACROECONOMICS, 7th. Edition N. Gregory Mankiw Tutorial written by: Mannig J. Simidian B.A. in Economics
Chapter 10 Aggregate Demand I
 Chapter 10 In this chapter, We focus on the short run, and temporarily set aside the question of whether the economy has the resources to produce the output demanded. We examine the determination of r
Chapter 10 Aggregate Demand I CHAPTER 10 0
 Chapter 10 Aggregate Demand I CHAPTER 10 0 1 CHAPTER 10 1 2 Learning Objectives Chapter 9 introduced the model of aggregate demand and aggregate supply. Long run (Classical Theory) prices flexible output
Lecture 3: National Income: Where it comes from and where it goes
 Class Notes Intermediate Macroeconomics Li Gan Lecture 3: National Income: Where it comes from and where it goes Production Function: Y = F(K, L) = K α L 1-α Returns to scale: Constant Return to Scale:
Review: objectives. CHAPTER 2 The Data of Macroeconomics slide 0
 Review: objectives Remind you of the main theories. Overview of how parts of the course all fit together. Draw the most important and general lessons to remember from the course. CHAPTER 2 The Data of
EC 205 Macroeconomics I. Lecture 5
 EC 205 Macroeconomics I Lecture 5 Macroeconomics I Chapter 3: The Science of Macroeconomics Outline of model A closed economy, market-clearing model Supply side factor markets determination of output/income
Econ 522: Intermediate Macroeconomics, Fall 2017 Chapter 3 Classical Model Practice Problems
 Econ 522: Intermediate Macroeconomics, Fall 2017 Chapter 3 Classical Model Practice Problems 1. Explain what determines the amount of output an economy produces? The factors of production and the available
! Continued. Demand for labor. ! The firm tries to maximize its profits:
 Chapter 3: National Income: Where it Comes From and Where it Goes! Continued slide 0 Demand for labor! The firm tries to maximize its profits: Profit = Total Revenue Total Cost = P.Y W.L R.K Profit=P.
macro macroeconomics Aggregate Demand I N. Gregory Mankiw CHAPTER TEN PowerPoint Slides by Ron Cronovich fifth edition
 macro CHAPTER TEN Aggregate Demand I macroeconomics fifth edition N. Gregory Mankiw PowerPoint Slides by Ron Cronovich 2002 Worth Publishers, all rights reserved In this chapter you will learn the IS curve,
Chapter 11 Aggregate Demand I: Building the IS -LM Model
 Chapter 11 Aggregate Demand I: Building the IS -LM Model Modified by Yun Wang Eco 3203 Intermediate Macroeconomics Florida International University Summer 2017 2016 Worth Publishers, all rights reserved
Road Map to this Lecture
 Economic Growth 1 Road Map to this Lecture 1. Steady State dynamics: 1. Output per capita 2. Capital accumulation 3. Depreciation 4. Steady State 2. The Golden Rule: maximizing welfare 3. Total Factor
Econ 522: Intermediate Macroeconomics, Spring 2018 Chapter 3 Practice Problem Set - Solutions
 Econ 522: Intermediate Macroeconomics, Spring 2018 Chapter 3 Practice Problem Set - Solutions 1. Explain what determines the amount of output an economy produces? The factors of production and the available
9. ISLM model. Introduction to Economic Fluctuations CHAPTER 9. slide 0
 9. ISLM model slide 0 In this lecture, you will learn an introduction to business cycle and aggregate demand the IS curve, and its relation to the Keynesian cross the loanable funds model the LM curve,
MACROECONOMICS. Aggregate Demand I: Building the IS-LM Model. N. Gregory Mankiw. PowerPoint Slides by Ron Cronovich
 11 : Building the IS-LM Model MACROECONOMICS N. Gregory Mankiw PowerPoint Slides by Ron Cronovich 2013 Worth Publishers, all rights reserved IN THIS CHAPTER, YOU WILL LEARN: the IS curve and its relation
3) Gross domestic product measured in terms of the prices of a fixed, or base, year is:
 Gross domestic product measured in terms of the prices of a fixed, or base, year is:") 3) Gross domestic product measured in terms of the prices of a fixed, or base, year is: Base GDP. Current GDP. Real GDP. Nominal GDP. 4) The number of people unemployed equals: The number of people employed
3) Gross domestic product measured in terms of the prices of a fixed, or base, year is: Base GDP. Current GDP. Real GDP. Nominal GDP. 4) The number of people unemployed equals: The number of people employed
Chapter 8 Economic Growth I: Capital Accumulation and Population Growth
 Chapter 8 Economic Growth I: Capital Accumulation and Population Growth Modified by Yun Wang Eco 3203 Intermediate Macroeconomics Florida International University Summer 2017 2016 Worth Publishers, all
IN THIS LECTURE, YOU WILL LEARN:
 IN THIS LECTURE, YOU WILL LEARN: the closed economy Solow model how a country s standard of living depends on its saving and population growth rates how to use the Golden Rule to find the optimal saving
Chapter 4. Consumption and Saving. Copyright 2009 Pearson Education Canada
 Chapter 4 Consumption and Saving Copyright 2009 Pearson Education Canada Where we are going? Here we will be looking at two major components of aggregate demand: Aggregate consumption or what is the same
Economics Macroeconomic Theory. Spring Final Exam, Tuesday 6 May 2003
 Economics 202.04 - Macroeconomic Theory Spring 2003 - Final Exam, Tuesday 6 May 2003 Please answer: ALL QUESTIONS IF YOU DO PART 1 3 OUT OF 4 QUESTIONS IF YOU DO PART 2 Each question in each part carries
Consumption, Saving, and Investment. Chapter 4. Copyright 2009 Pearson Education Canada
 Consumption, Saving, and Investment Chapter 4 Copyright 2009 Pearson Education Canada This Chapter In Chapter 3 we saw how the supply of goods is determined. In this chapter we will turn to factors that
Remember the dynamic equation for capital stock _K = F (K; T L) C K C = _ K + K = I
 C K C = _ K + K = I") CONSUMPTION AND INVESTMENT Remember the dynamic equation for capital stock _K = F (K; T L) C K where C stands for both household and government consumption. When rearranged F (K; T L) C = _ K + K = I This
CONSUMPTION AND INVESTMENT Remember the dynamic equation for capital stock _K = F (K; T L) C K where C stands for both household and government consumption. When rearranged F (K; T L) C = _ K + K = I This
INDIVIDUAL CONSUMPTION and SAVINGS DECISIONS
 The Digital Economist Lecture 5 Aggregate Consumption Decisions Of the four components of aggregate demand, consumption expenditure C is the largest contributing to between 60% and 70% of total expenditure.
Chapter 3. Continued. CHAPTER 3 National Income. slide 0
 Chapter 3 Continued slide 0 Notes The equilibrium is stable If r > r* S > I: More people want to save relative to demand for funds: excess supply; r decreases If r < r* I > S: More demand for funds then
ECN101: Intermediate Macroeconomic Theory TA Section
 ECN101: Intermediate Macroeconomic Theory TA Section (jwjung@ucdavis.edu) Department of Economics, UC Davis November 4, 2014 Slides revised: November 4, 2014 Outline 1 2 Fall 2012 Winter 2012 Midterm:
ECO403 Macroeconomics Solved Final Term Papers For Final Term Exam Preparation
 ECO403 Macroeconomics Solved Final Term Papers For Final Term Exam Preparation Question No: 1 curve include: ( Marks: 1 ) - Please choose one The determinants of demand Income, tastes, and the price of
Macroeconomics II Consumption
 Macroeconomics II Consumption Vahagn Jerbashian Ch. 17 from Mankiw (2010); 16 from Mankiw (2003) Spring 2018 Setting up the agenda and course Our classes start on 14.02 and end on 31.05 Lectures and practical
Introduction to economics for PhD Students of The Institute of Physical Chemistry, PAS Lecture 3 Consumer s choice
 Introduction to economics for PhD Students of The Institute of Physical Chemistry, PAS Lecture 3 Consumer s choice Dr hab. Gabriela Grotkowska, University of Warsaw Based on: Mankiw G., Taylor R, Economics,
SIMON FRASER UNIVERSITY Department of Economics. Intermediate Macroeconomic Theory Spring PROBLEM SET 1 (Solutions) Y = C + I + G + NX
 Y = C + I + G + NX") SIMON FRASER UNIVERSITY Department of Economics Econ 305 Prof. Kasa Intermediate Macroeconomic Theory Spring 2012 PROBLEM SET 1 (Solutions) 1. (10 points). Using your knowledge of National Income Accounting,
SIMON FRASER UNIVERSITY Department of Economics Econ 305 Prof. Kasa Intermediate Macroeconomic Theory Spring 2012 PROBLEM SET 1 (Solutions) 1. (10 points). Using your knowledge of National Income Accounting,
ECNS 303 Ch. 16: Consumption
 ECNS 303 Ch. 16: Consumption Micro foundations of Macro: Consumption Q. How do households decide how much of their income to consume today and how much to save for the future? Micro question with macro
This paper is not to be removed from the Examination Halls UNIVERSITY OF LONDON
 ~~EC2065 ZB d0 This paper is not to be removed from the Examination Halls UNIVERSITY OF LONDON EC2065 ZB BSc degrees and Diplomas for Graduates in Economics, Management, Finance and the Social Sciences,
Where does stuff come from?
 Where does stuff come from? Factors of production Technology Factors of production: Thanks, Marx! The stuff we use to make other stuff Factors of production: Thanks, Marx! The stuff we use to make other
a. Fill in the following table (you will need to expand it from the truncated form provided here). Round all your answers to the nearest hundredth.
. Round all your answers to the nearest hundredth.") Economics 102 Summer 2015 Answers to Homework #4 Due Monday, July 13, 2015 Directions: The homework will be collected in a box before the lecture. Please place your name on top of the homework (legibly).
Economics 102 Summer 2015 Answers to Homework #4 Due Monday, July 13, 2015 Directions: The homework will be collected in a box before the lecture. Please place your name on top of the homework (legibly).
Microeconomics. The Theory of Consumer Choice. N. Gregory Mankiw. Premium PowerPoint Slides by Ron Cronovich update C H A P T E R
 C H A P T E R 21 The Theory of Consumer Choice Microeconomics P R I N C I P L E S O F N. Gregory Mankiw Premium PowerPoint Slides by Ron Cronovich 2010 South-Western, a part of Cengage Learning, all rights
9 D/S of/for Labor. 9.1 Demand for Labor. Microeconomics I - Lecture #9, April 14, 2009
 Microeconomics I - Lecture #9, April 14, 2009 9 D/S of/for Labor 9.1 Demand for Labor Demand for labor depends on the price of labor, price of output and production function. In optimum a firm employs
MACROECONOMICS. Economic Growth I: Capital Accumulation and Population Growth MANKIW. In this chapter, you will learn. Why growth matters
 C H A P T E R 7 Economic Growth I: Capital Accumulation Population Growth MACROECONOMICS N. GREGORY MANKIW 2007 Worth Publishers, all rights reserved SIXTH EDITION PowerPoint Slides by Ron Cronovich In
). In Ch. 9, when we add technological progress, k is capital per effective worker (k = K
. In Ch. 9, when we add technological progress, k is capital per effective worker (k = K") Economics 285 Chris Georges Help With Practice Problems 3 Chapter 8: 1. Questions For Review 1,4: Please see text or lecture notes. 2. A note about notation: Mankiw defines k slightly differently in Chs.
Economics 285 Chris Georges Help With Practice Problems 3 Chapter 8: 1. Questions For Review 1,4: Please see text or lecture notes. 2. A note about notation: Mankiw defines k slightly differently in Chs.
Introduction to economic growth (2)
") Introduction to economic growth (2) EKN 325 Manoel Bittencourt University of Pretoria M Bittencourt (University of Pretoria) EKN 325 1 / 49 Introduction Solow (1956), "A Contribution to the Theory of Economic
Introduction to economic growth (2) EKN 325 Manoel Bittencourt University of Pretoria M Bittencourt (University of Pretoria) EKN 325 1 / 49 Introduction Solow (1956), "A Contribution to the Theory of Economic
This paper is not to be removed from the Examination Halls
 ~~EC2065 ZA d0 This paper is not to be removed from the Examination Halls UNIVERSITY OF LONDON EC2065 ZA BSc degrees and Diplomas for Graduates in Economics, Management, Finance and the Social Sciences,
Modules 6 and 7: Markets, Prices, Supply, and Demand practice problems. Practice problems and illustrative test questions for the final exam
 Modules 6 and 7: Markets, Prices, Supply, and Demand practice problems Practice problems and illustrative test questions for the final exam (The attached PDF file has better formatting.) This posting gives
A Real Intertemporal Model with Investment Copyright 2014 Pearson Education, Inc.
 Chapter 11 A Real Intertemporal Model with Investment Copyright Chapter 11 Topics Construct a real intertemporal model that will serve as a basis for studying money and business cycles in Chapters 12-14.
Micro-foundations: Consumption. Instructor: Dmytro Hryshko
 Micro-foundations: Consumption Instructor: Dmytro Hryshko 1 / 74 Why Study Consumption? Consumption is the largest component of GDP (e.g., about 2/3 of GDP in the U.S.) 2 / 74 J. M. Keynes s Conjectures
Midterm 1 Practice Multiple Choice Questions
 Midterm 1 Practice Multiple Choice Questions 1. To compute the value of GDP: A) goods and services are valued at market prices. B) the sale of used goods is included. C) production for inventory is not
Principles of Macroeconomics 2017 Productivity and Growth. Takeki Sunakawa
 Principles of Macroeconomics 2017 Productivity and Growth Takeki Sunakawa What will be covered Preliminary mathematics: Growth rate, the rule of 70, and the ratio scale Data and questions Productivity,
Economic Growth: Extensions
 Economic Growth: Extensions 1 Road Map to this Lecture 1. Extensions to the Solow Growth Model 1. Population Growth 2. Technological growth 3. The Golden Rule 2. Endogenous Growth Theory 1. Human capital
Gehrke: Macroeconomics Winter term 2012/13. Exercises
 Gehrke: 320.120 Macroeconomics Winter term 2012/13 Questions #1 (National accounts) Exercises 1.1 What are the differences between the nominal gross domestic product and the real net national income? 1.2
Business Cycles. (c) Copyright 1998 by Douglas H. Joines 1
 Copyright 1998 by Douglas H. Joines 1") Business Cycles (c) Copyright 1998 by Douglas H. Joines 1 Module Objectives Know the causes of business cycles Know how interest rates are determined Know how various economic indicators behave over the
Business Cycles (c) Copyright 1998 by Douglas H. Joines 1 Module Objectives Know the causes of business cycles Know how interest rates are determined Know how various economic indicators behave over the
Consumption and Investment
 Consumption and Investment PROBLEM SET 2 1 Consumption 1. What are the hypothesis of the Keynesian theory of consumption? 2. Consider an economy where the consumption function is the following: C = 0.82Y
Professor Christina Romer SUGGESTED ANSWERS TO PROBLEM SET 5
 Economics 2 Spring 2017 Professor Christina Romer Professor David Romer SUGGESTED ANSWERS TO PROBLEM SET 5 1. The tool we use to analyze the determination of the normal real interest rate and normal investment
Part II Classical Theory: Long Run Chapter 3 National Income: Where It Comes From and Where It Goes
 Part II Classical Theory: Long Run Chapter 3 National Income: Where It Comes From and Where It Goes Zhengyu Cai Ph.D. Institute of Development Southwestern University of Finance and Economics All rights
In this chapter, look for the answers to these questions
 In this chapter, look for the answers to these questions What are the main types of financial institutions and what is their function? What are the three kinds of saving? What s the difference between
Business Cycles II: Theories
 Macroeconomic Policy Class Notes Business Cycles II: Theories Revised: December 5, 2011 Latest version available at www.fperri.net/teaching/macropolicy.f11htm In class we have explored at length the main
5.1 Introduction. The Solow Growth Model. Additions / differences with the model: Chapter 5. In this chapter, we learn:
 Chapter 5 The Solow Growth Model By Charles I. Jones Additions / differences with the model: Capital stock is no longer exogenous. Capital stock is now endogenized. The accumulation of capital is a possible
Lecture 4: 16/07/2012
 Ljubljana Summer school, July 2012 Macroeconomics Professor: Lorenzo Burlon Exercise List 2 Lecture 4: 16/07/2012 1. The Fisher effect (a) represents the relation between unemployment and GDP growth. (b)
Homework Assignment #6. Due Tuesday, 11/28/06. Multiple Choice Questions:
 Homework Assignment #6. Due Tuesday, 11/28/06 Multiple Choice Questions: 1. When the inflation rate is expected to be zero, Steve plans to lend money if the interest rate is at least 4 percent a year and
3 General equilibrium model of national income
 OVS452 + 5EN 253 VSE NF, Spring 2010 Lecture Notes #2 Eva Hromádková 3 General equilibrium model of national income 3.1 Concept of equilibrium - Clasic model General concept = steady-state (i.e. state
Part 1: Short answer, 60 points possible Part 2: Analytical problems, 40 points possible
 Midterm #1 ECON 322, Prof. DeBacker September 25, 2018 INSTRUCTIONS: Please read each question below carefully and respond to the questions in the space provided (use the back of pages if necessary). You
5.1 Introduction. The Solow Growth Model. Additions / differences with the model: Chapter 5. In this chapter, we learn:
 Chapter 5 The Solow Growth Model By Charles I. Jones Additions / differences with the model: Capital stock is no longer exogenous. Capital stock is now endogenized. The accumulation of capital is a possible
ECO 301 MACROECONOMIC THEORY UNIVERSITY OF MIAMI DEPARTMENT OF ECONOMICS FALL 2008 Instructor: Dr. S. Nuray Akin MIDTERM EXAM I
 ECO 301 MACROECONOMIC THEORY UNIVERSITY OF MIAMI DEPARTMENT OF ECONOMICS FALL 2008 Instructor: Dr. S. Nuray Akin MIDTERM EXAM I Name: Section: Instructions: This exam consists of 6 pages; please check
Chapter 4. Determination of Income and Employment 4.1 AGGREGATE DEMAND AND ITS COMPONENTS
 Determination of Income and Employment Chapter 4 We have so far talked about the national income, price level, rate of interest etc. in an ad hoc manner without investigating the forces that govern their
NAME: INTERMEDIATE MICROECONOMIC THEORY FALL 2006 ECONOMICS 300/012 Midterm II November 9, 2006
 NAME: INTERMEDIATE MICROECONOMIC THEORY FALL 2006 ECONOMICS 300/012 Section I: Multiple Choice (4 points each) Identify the choice that best completes the statement or answers the question. 1. The marginal
consumption. CHAPTER Consumption is the sole end and purpose of all production. Adam Smith
 16 CHAPTER Consumption S I X T E E N Consumption is the sole end and purpose of all production. Adam Smith How do households decide how much of their income to consume today and how much to save for the
ECN101: Intermediate Macroeconomic Theory TA Section
 ECN101: Intermediate Macroeconomic Theory TA Section (jwjung@ucdavis.edu) Department of Economics, UC Davis October 27, 2014 Slides revised: October 27, 2014 Outline 1 Announcement 2 Review: Chapter 5
ECON 302 Fall 2009 Assignment #2 1
 ECON 302 Assignment #2 1 Homework will be graded for both content and neatness. Sloppy or illegible work will not receive full credit. This homework requires the use of Microsoft Excel. 1) The following
Monetary Macroeconomics Lecture 3. Mark Hayes
 Diploma Macro Paper 2 Monetary Macroeconomics Lecture 3 Aggregate demand: Investment and the IS-LM model Mark Hayes slide 1 Outline Introduction Map of the AD-AS model This lecture, continue explaining
Midterm Examination Number 1 February 19, 1996
 Economics 200 Macroeconomic Theory Midterm Examination Number 1 February 19, 1996 You have 1 hour to complete this exam. Answer any four questions you wish. 1. Suppose that an increase in consumer confidence
macro macroeconomics Economic Growth I Economic Growth I I (chapter 7) N. Gregory Mankiw
 N. Gregory Mankiw") macro Topic CHAPTER 4: SEVEN I (chapter 7) macroeconomics fifth edition N. Gregory Mankiw PowerPoint Slides by Ron Cronovich 2002 Worth Publishers, all rights reserved (ch. 7) Chapter 7 learning objectives
macro Topic CHAPTER 4: SEVEN I (chapter 7) macroeconomics fifth edition N. Gregory Mankiw PowerPoint Slides by Ron Cronovich 2002 Worth Publishers, all rights reserved (ch. 7) Chapter 7 learning objectives
Course information EC2065 Macroeconomics
 Course information 2015 16 This course introduces students to the most influential and compelling theories designed by macroeconomists to explain issues related to the determination of output, unemployment
Test Questions. Part I Midterm Questions 1. Give three examples of a stock variable and three examples of a flow variable.
 Test Questions Part I Midterm Questions 1. Give three examples of a stock variable and three examples of a flow variable. 2. True or False: A Laspeyres price index always overstates the rate of inflation.
Econ / Summer 2005
 Econ 3560.001 / 5040.001 Summer 2005 INTERMEDIATE MACROECONOMIC THEORY / MACROECONOMIC ANALYSIS FINAL EXAM Name (Last) (First) Signature Instructions The exam consists of 30 multiple-choice questions (Part
Saving, Investment, and the Financial System
 7 Saving, Investment, and the Financial System The Financial System The financial system consists of the group of institutions in the economy that help to match one person s saving with another person
Intermediate Macroeconomic Theory / Macroeconomic Analysis (ECON 3560/5040) Midterm Exam (Answers)
 Midterm Exam (Answers)") Intermediate Macroeconomic Theory / Macroeconomic Analysis (ECON 3560/5040) Midterm Exam (Answers) Part A (15 points) State whether you think each of the following questions is true (T), false (F), or
Intermediate Macroeconomic Theory / Macroeconomic Analysis (ECON 3560/5040) Midterm Exam (Answers) Part A (15 points) State whether you think each of the following questions is true (T), false (F), or
ECON 3312 Macroeconomics Exam 1 Fall 2016
 ECON 3312 Macroeconomics Exam 1 Fall 2016 Name MULTIPLE CHOICE. Choose the one alternative that best completes the statement or answers the question. 1) Under the assumption of perfect competition, all
Econ 223 Lecture notes 2: Determination of output and income Classical closed economy equilibrium
 Econ 223 Lecture notes 2: Determination of output and income Classical closed economy equilibrium Kevin Clinton Winter 2005 The classical model assumes that prices and wages etc. are fully flexible. Output
(Note: Please label your diagram clearly.) Answer: Denote by Q p and Q m the quantity of pizzas and movies respectively.
 Answer: Denote by Q p and Q m the quantity of pizzas and movies respectively.") 1. Suppose the consumer has a utility function U(Q x, Q y ) = Q x Q y, where Q x and Q y are the quantity of good x and quantity of good y respectively. Assume his income is I and the prices of the two
1. Suppose the consumer has a utility function U(Q x, Q y ) = Q x Q y, where Q x and Q y are the quantity of good x and quantity of good y respectively. Assume his income is I and the prices of the two
Chapter 7. Production and Growth Saving, Investment and the Financial System
 Chapter 7 Production and Growth Saving, Investment and the Financial System Source: Chapter 25-26 of Principles of Economics textbook (Mankiw) Objectives: By the end of this chapter, students should understand
Chapter 6 Firms: Labor Demand, Investment Demand, and Aggregate Supply
 Chapter 6 Firms: Labor Demand, Investment Demand, and Aggregate Supply We have studied in depth the consumers side of the macroeconomy. We now turn to a study of the firms side of the macroeconomy. Continuing
Lecture notes 2: Physical Capital, Development and Growth
 Lecture notes 2: Physical Capital, Development and Growth These notes are based on a draft manuscript Economic Growth by David N. Weil. All rights reserved. Lecture notes 2: Physical Capital, Development
VII. Short-Run Economic Fluctuations
 Macroeconomic Theory Lecture Notes VII. Short-Run Economic Fluctuations University of Miami December 1, 2017 1 Outline Business Cycle Facts IS-LM Model AD-AS Model 2 Outline Business Cycle Facts IS-LM