Operating Budget Report
|
|
|
- Chad Johns
- 5 years ago
- Views:
Transcription

1 Operating Budget Report Including Supplementary Financial Information Approved by the Board of Trustees June 28, 2012
2 TABLE OF CONTENTS Page Foreword 3 Part A Operating Budget 4 Background on the Operating Budget Situation 5 Summary of Multi-Year Recovery Strategy 5 Results of the Target Exercise 8 Budget Development and Monitoring 10 Financial Highlights of the Budget 16 o Table 1 - Operating Budget 19 Revenue Assumptions and Estimates 21 Expenditure Assumptions and Estimates 32 o Table 2 Summarized Operating Budget 33 Ancillary Operations 41 Part B Supplementary Financial Information 42 Capital Related Information 43 Cash and Debt Information 48 Part C Appendices 51 I Timelines & Process II Definitions and Counting Students III Enrolment Charts Headcounts IV Enrolment Tables Headcount, FFTEs, BIUs 2
3 FOREWORD This Operating Budget Report provides detailed information regarding the annual operating budget process, revenue and expenditure estimates and detailed financial information to enable the reader to gain a better understanding of Brock University s operating budget. The annual operating budget report is prepared annually and in a format consistent with previous years in order to enhance comparability. Consistent with many other universities, the Board of Trustees approves the Operating Budget annually. This budget is intended as a Final Budget. It is based on the best available assumptions concerning revenues and expenditures at this time. With the fiscal forecast process in place, updated projections are submitted to the Board of Trustees regularly throughout the year as changes in information about revenues and expenditures occur. The annual operating budget report includes all of the general operating and ancillary financial activities of the University. The operating budget represents approximately 80 85% of total university expenditures depending on annual levels of research funding and other expenditures. The other financial activities of the University include direct research, major capital projects, trust and endowments. As these resources are intended for restrictive purposes and are not available for general operating purposes, they are not included in the operating budget but accounted for annually in the audited financial statements. New this year is the inclusion in this report of Supplementary Financial Information that will review the capital projects, cash and debt information. A variety of historical financial information (budget reports, audited financial statements, audited pension statements and DBRS credit rating reports) are available on the Brock University Financial Services website at Questions or further information regarding this report may be directed to the Office of the Vice-President, Finance and Administration or Associate Vice-President of Finance. 3
4 Part A Operating Budget The following section provides extensive information on the major categories of the Operating Budget Revenue and Expenditure Estimates as presented in Table 1 (pages 19-20) 4
5 BACKGROUND ON THE OPERATING BUDGET SITUATION The current decentralized budget development process was first initiated at Brock in In each year since that time, operating budgets had been balanced annually until A structural deficit (where ongoing expenditures are greater than ongoing revenues) became apparent in The budget was balanced with one-time reserves from an accumulated surplus (resulting mainly from under spending in previous years). In , the University conducted a reduction exercise to eliminate most of the shortfall. The remaining gap was closed with an amount from the accumulated operating surplus that had been held in reserve for exactly that purpose. To avoid another target reduction exercise in , the strategy was to utilize one-time funds to balance the budget. The one-time funds came from additional unplanned grant revenues and general operating surpluses generated at year end from under spending. With the savings account being depleted in balancing , the next fiscal year began with a base structural shortfall of $12.6 million. This shortfall had to be addressed as it was estimated that the accumulated operating deficit would spiral upward to more than $90 million by the end of Adding to the base structural shortfall from were incremental inflationary costs that exceeded additional revenue. This brought the total projected shortfall for to $17.4 million. Eliminating a shortfall of $17.4 million all in one year would have caused severe irreparable damage to the University as it would have required an 11.5 per cent reduction. Therefore, that year a multi-year recovery strategy was developed and presented to the Board of Trustees to recover the shortfall, and each subsequent year s annual shortfall over the four-year economic cycle. SUMMARY OF THE MULTI-YEAR RECOVERY STRATEGY In , given the projections of revenue and expenditures and the need to achieve a balanced budget over a four-year cycle, revenue enhancements and/or expenditure savings target of about $7.5 million or five per cent in each year, were required. The multi-year recovery strategy included a four-year process to eliminate a structural deficit in the operating budget. The following summarizes the progress after three years and the plan for this fourth year of : Year 1 As presented in June 2009, the plan was to find five per cent on average and reduce the projected shortfall of $17.4 million by $7.7 million. This would finish the year with an accumulated shortfall of $8.7 million. Even though the final gap was greater than projected at $19.9 million, the target exercise generated more than planned at $8.3 million. The results ended with a $2.8 million surplus instead of the projected $1 million. The combined effect was that was still on track with the accumulated deficit projected at $8.8 million. 5
6 By fall 2009, the financial outlook for was much better than had been projected, with improvements in retention generating additional enrolments, which increased tuition revenue and government accessibility grants. By March 2010, the projections were even better with the Ministry s announcement that the undergraduate accessibility grants would be fully funded and an increase in the general quality/access grants. The additional tuition and the grants combined to generate $6.1 million more funding than was projected. Modest investments were made at mid-year to undergraduate scholarships and support for revenue generating initiatives. With the final year-end results and an improvement of almost $6 million for , the opening accumulated deficit going into was down to $4.8 million. This was a marked improvement from the $8.8 million originally projected in : Year 2 In February 2010, the financial projections for were better than had been projected in February With the improvement in the mid-year revenue projections and the on-going impact to base revenues, as well as modest increases to enrolment targets and softened inflationary costs, the projections now had the in-year shortfall at $10.3 million and the accumulated deficit at the end of at $19.1 million. The original plan was to find, on average, five per cent of reductions and/or revenue enhancements. However, the improvement on the revenue side provided the opportunity to reset the target for the budget exercise to two per cent. The lowering of the target was also viewed as an opportunity to provide time for revenue-enhancing investments to be made so they could begin to take hold in future years. By the end of April 2010, the final projections for had improved even more. The final government grant announcements for the undergraduate accessibility and the general quality/access grant were better than projected. As well, the two per cent target exercise of $3.1 million came in at $3.5 million. The improvement of revenue projections provided the opportunity to make a number of strategic investments into base budgets of $1.6 million that provide University-wide support. Once all budget figures were finalized in April 2010, the in-year shortfall improved by $1.2 million to $9.1 million. With the final improvement in the actual results of $6 million the accumulated deficit at the end of was at $11.9 million. This was a marked improvement from the $19.1 million deficit projected in February Since the budget was approved in June 2010 and as reported in January 2011, the operating results had improved by $3.5 million from additional tuition and grant revenues realized from increased retention enrolments. This was offset by $600,000 for ongoing investments made to the Faculties. As well, one-time funds of $700,000 held from were released. Thus, as reported in February 2011, the budget had improved by a total of $3.6 million. With the final improvement in the actual results of $1.3 million the accumulated deficit at the end of was just under $7 million. This was a marked improvement from the $11.9 million projected back in June 2010 when the budget was originally approved : Year 3 In February 2011, the assumptions concerning and beyond were changed to reflect the improvement in base revenues from and the modest increases in enrolment activity and moderating of inflationary expenditure increases. The budget exercise 6
7 proceeded on the assumption that additional revenue enhancements, in an amount of $4.8 million or 3.2 per cent would leave the remaining $2.8 million or 1.8 per cent to be identified through departmental targets to achieve the overall target of $7.6 million or five per cent. Even with these improvements in assumptions, an annual shortfall was estimated of just under $1 million. The projected April 30, 2012 accumulated deficit of $8.3 million was significantly less than the $19.1 million projected in February 2010 and even the $12.8 million projected in February During the mid-year, total revenue was projected to increase by $2.7 million from tuition and government grants. Additional resources (for contractual obligations, expenditure pressures from increased enrolments and revenue sharing commitments) were approved in the amount of $1.3 million. This left $1.3 remaining as a reserve and it was noted in February, as the budget and multi-year projections were discussed, that this midyear reserve would be released to support the overall operating budget results. The pension catch-up contribution for the period of July 1, 2011 to April 30, 2012 amounted to $3.9 million. With the $1.7 million held in reserve from the year end results an additional $2.2 million was required in As projected during the March fiscal forecast, there would be modest improvements in other global revenues and expenditures of about $1.1 million. At the time of writing, this had improved by a further $.8 million. In summary, the mid-year reserve and operating improvements would cover the pension payment and the $1 million in-year deficit originally projected. Therefore, the preliminary year end operating results are balanced and the accumulated operating deficit would be reduced to just under $7 million : Year 4 This year an additional $7.5 million was achieved from the overall target exercise of 2.1 per cent or $3.6 million plus improvements on-going from of $1.3 million and new global revenues of $2.6 million. The year ended April 30, 2013 would have projected an inyear surplus of $1.3 million before the increase pension plan payment of $4.8 million. This is an important point, as is the first year since where the university has been able to eliminate its structural deficit (that is, annual revenues are now projected to be greater than annual expenditures). In , the structural deficit was $17.4 million. This is a tremendous achievement to have eliminated this over the four years as planned. Regrettably, the significant increase to the pension payment has overshadowed those good results with the annual payment increase of $4.8 million for a total of $5.8 million. The in-year shortfall, after the pension payment, is estimated at $3.5 million. At the time of writing, the amount available from year end underspending and/or from carryforward reserves is estimated at $3.5 million which is enough to eliminate the in-year deficit projected. Therefore the accumulated deficit for April 30, 2013 would remain unchanged from the April 30, 2012 level which is estimated at $6.9 million. Notwithstanding that this is a significant amount, it is still a fraction of the accumulated operating deficit that was estimated to grow in excess of $90 million by the end of had the university not responded to its financial situation back in
8 RESULTS OF THE TARGET EXERCISE (including prior years) Under our current budget model, all resources for salary increases and positions are centrally funded. Extra costs are covered by additional revenue resources, and when the expenditures exceed the revenues, the shortfall has to be managed by an exercise that involves the entire University. As in previous years, Budget Developers identified University-wide contractual, regulatory compliance, and other fixed costs, that should not be reduced. Thus undergraduate bursaries, graduate fellowships, library acquisitions, IT acquisitions, debt service and other fixed contracts have been excluded from the target exercise. In , an across-the-board departmental five per cent target exercise was not undertaken. Rather, a strategic approach was taken to provide the opportunity to consider the impact that a reduction would have on a particular unit s programs, services and on students, faculty and staff. In and , an across-the-board target of two per cent and 1.8 per cent respectively for all units was put in place. However, Budget Developers still had the opportunity to present their revenue enhancement and expenditure reduction targets directly to the President, Vice-President, Academic and Vice-President, Finance and Administration and to discuss how the targets would impact students, services, programs and enrolments. The on-going revenue enhancement or savings target for was 2.5%. This target could have been reduced to 1.5% in recompense for a plan for significant pedagogical and/or operational reform to be implemented for the budget year. Targets could be achieved through a combination of on-going external revenue enhancement or savings resulting from cost reductions to the University s current operating budget. Targets needed to consider the impact on students, programs and services. Faculty units were encouraged to engage in any number of initiatives appropriate to their fields and which build on and expand recent discussions regarding new and innovative pedagogical approaches, flexible course offerings and scheduling, new and revised programming, alternate and mixed modes of delivery, and other inventive means of carrying out the University s mission. Such measures were to be presented in a concrete and specific format so as to allow for the accurate determination of their impact on revenues and/or costs. Administrative, Ancillary and Student Service areas were also encouraged to work collaboratively to consider initiatives that collectively can achieve an overall unit or divisional target. The following summarizes the target exercise results for and for the previous years: : Target Exercise Functional Area Revenue & Expense Onetime Total Amount % Executive 55,989 55, Administrative Areas 835,768 54, , Ancillary/Partial Revenue 415, , Academic & Student Support 431,077 71, , Faculties* 1,674,128 87,866 1,761, Total $3,412,199 $213,800 $3,625, % *Includes $384,305 credit for tuition revenue generated globally. 8
9 : Target Exercise Functional Area Revenue & Expense Onetime Total Amount % Executive 38,452 38, Administrative Areas 393,449 60, , Ancillary/Partial Revenue 104, , Academic & Student Support 301,959 24, , Faculties 1,873,787-1,873, Total $2,711,879 $85,047 $2,796, % : Target Exercise Functional Area Expense Revenue Total % Ongoing Onetime Ongoing Amount Executive 44, , % Administrative Areas 495,441 21,125 15, , % Ancillary/Partial Revenue 122, , , % Academic/Student Support 187, , , , % Faculties 1,488, ,285 2,012, % Total $2,215,985 $269,665 $974,765 $3,460, % : Target Exercise Functional Area Expense Revenue Total % Ongoing Onetime Ongoing Amount Executive 162, , % Administrative Areas 1,403, ,139 25,000 1,596, % Ancillary/Partial Revenue 574,330 95, , , % Academic/Student Support 316, , ,042 1,233, % Faculties 2,874, , ,473 4,368, % Total $5,330,988 $1,517,772 $1,444,860 $8,293, % 9
10 BUDGET DEVELOPMENT AND MONITORING This section provides background and review of the budget development including principles and guidelines; process and timelines; updates and monitoring; and annual enrolment/revenue model. Budget Principles and Guidelines The following principles and guidelines were shared in early February 2012 to Budget Developers (that represent a major division, department or financial unit of the University) in preparation of their budgets for : Principles: 1. A balanced operating budget will be achieved as quickly as possible and in a manner approved by the Board of Trustees. 2. The contractual, policy and legal obligations of the University to employees, students and to the public will be met. 3. The financial health and fiscal capacity of the University are prerequisites to sustaining our teaching, learning, research and creative activities. 4. The Budget will support Faculty strategic priorities and the interdisciplinary initiatives identified in the Integrated Strategic Plan and in Faculty Strategic Plans. 5. The Budget will be informed by the continued progress and development of the evolving resource allocation budget model. 6. Undergraduate and graduate enrolment will be maintained at annually-established activity target levels. 7. Revenue generating activity and entrepreneurial efforts will be strongly encouraged through the use of revenue sharing arrangements that benefit both the individual units and the University at large. 8. The openness and transparency of the budget process will be continually enhanced through the sharing of budget allocation priorities and decisions with faculty, staff, students and the broader university community. Guidelines: 1. The on-going revenue enhancement or savings target for is 2.5%. This target may be reduced to 1.5% in recompense for a plan for significant pedagogical and/or operational reform to be implemented for the budget year. 2. The on-going revenue enhancement or savings target will be calculated on the base budgets (including salaries and benefits) as per the on-line budget development system. The base budget can exclude non-compressible budgets which are defined as those costs that are university-wide contractual, regulatory compliance and other fixed costs (e.g. utilities, insurance, debt service, mandated student bursaries). For ancillary operations and cost recovery programs the target is based on the base contribution. 3. Targets may be achieved through a combination of on-going external revenue enhancement or savings resulting from cost reductions to the University s current operating budget. Targets need to consider the impact on students, programs and services. a) Faculty units are encouraged to engage in any number of initiatives appropriate to their fields and which build on and expand recent discussions regarding new and innovative pedagogical approaches, flexible course offerings and scheduling, new and revised programming, alternate and mixed modes of delivery, and other inventive 10
11 means of carrying out the University s mission. Such measures must be presented in a concrete and specific format so as to allow for the accurate determination of their impact on revenues and/or costs. b) Administrative, Ancillary and Student Service areas are also encouraged to work collaboratively to consider initiatives that collectively can achieve an overall unit or divisional target. 4. Permanent salaries and benefits costs have been calculated by the Offices of Human Resources and Finance and include any additional faculty and staff positions previously approved. Vacant positions must be carefully reviewed in light of opportunities to achieve savings targets. All salary savings (including those from temporary delayed hires) will be considered toward the savings target. Savings resulting from the difference between the retiring faculty or staff member and the approved starting salary will be returned to the centre, except as specifically approved by the Budget Committee to be counted toward any target savings. 5. Funding for new budget initiatives or requests (Schedule 5) for central funding that are very critical for programs and services may be submitted. Those that are self-funding initiatives will be considered at any time and will be given the highest priority. 6. Minor capital requests (Schedule 7) for central funding are to be restricted to those that are essential (e.g. those that sustain programs and services or ensure regulatory compliance) and must be submitted to Facilities Management for review and prioritization. 7. IT requests (Schedule 8) for central funding that are essential for programs and services must be submitted on-line to Information Technology Services for review and prioritization. The annual call for requests will take place early in the fall of 2012, but requests can be made at any time. Budget Process and Timelines There are approximately 35 main Budget Developers (e.g. Dean, Associate Vice-President or Director) that represent a major division, department or financial unit of the university. As part of the budget development process the following schedules (as applicable) need to be completed by each Budget Developer. The schedules and instructions are available on the Finance web site at Schedule 1 On-line budget development system (referred to as BUDDE) Schedule 2 Revenue Projections Worksheet Schedule 3(a) Permanent Faculty & Staff - Full-time & PT on benefits Schedule 3(b) Faculty Limited Term Appointments Schedule 4(a) Part Time Non-Teaching Salary Schedule 4(b) Part Time Teaching Salary Schedule 5 Additional Budget Resources Schedule 6 Feedback & Action Sheet Schedule 7 Minor Capital Renovations Request Schedule 8 Information Technology Requests The Timelines and Process for (Appendix I) is consistent with those followed in previous years and outlines the significant steps of the process as communicated to Budget Developers and other constituent groups throughout the University. The following 11
12 highlights the major steps of this year s process and actions taken to keep Budget Developers and constituents informed: During the month of January the following occurred: - ACID (Advisory Committee on Institutional Data) updated the multi-year enrolment, and tuition and grant revenue projections. - Finance updated the multi-year global revenues and expenditure assumptions. - Detailed salary schedules for budgeted salary requirements were prepared by Finance and sent to Budget Developers for their detailed review. On January 11 and January 23, the President, Vice-President, Academic and Vice- President, Finance & Administration met to review the updated enrolment projections, revenue and expenditure assumptions and the impact on the multi-year projections and recovery strategy. On January 25, a presentation was made to Budget Developers to provide an overview of the budget and multi-year projections and potential target strategies as well as preliminary process and timelines. On February 2, the Financial Planning and Human Resources Committee (FPHR) was presented with the following information: - Overview of key assumptions, financial projections and strategy of the multi-year budget projections as compared to where we were in February 2011, - A financial summary of the budget projections and impact to multi-year budget projections, - Proposed multi-year recovery strategy. On February 16, the President made a presentation to the Board of Trustees on various pedagogical ideas and the potential financial impact in the future under various options. On February 24, the Principles & Guidelines were provided as guidance to Budget Developers in preparing their budget projections and targeted savings submissions. During March, Budget Developers submitted their budget requests and updated budget projections to the on-line BUDDE system. During the week of March 19, Budget Developers presented their budget, target strategies and innovative plans with the Budget Committee (President and Vice Chancellor Jack Lightstone, Provost and Vice President, Academic Murray Knuttila, Vice Provost and Associate Vice President, Academic Greg Finn and Interim Vice President, Finance Joanne McKee). On April 12, the FPHR Committee was updated on the: - budget development activities to date and those that had occurred since the February meeting, - budget development currently underway including next steps, - provincial and federal budget and its impact on universities. During the month of April, the budget estimates were finalized by Finance: - comparisons to preliminary estimates were updated and reviewed, - budget requests and target submissions were reviewed in detail and checked for completeness and accuracy, - final calculations of university-wide global expenditures and salary and revenue budgets were finalized. - year-over-year summaries and analysis were prepared to verify and confirm preliminary budget estimates. 12
13 During the month of May the following was completed: - Deans completed their innovative strategies and ideas that may take hold in and modeling the potential financial impact. - The Advisory Committee on Institutional Analysis (ACID) completed the enrolment and revenue projections and prepared an annual report. - The Budget Committee met to review the financial budget reports and the variance analysis summary. - On May 17, the Draft Final Operating budget was presented to the Financial Planning and Human Resources Committee. - On May 18, the Draft Final Operating budget was presented to the Senate Budget Advisory Committee. - On May 23, Senate Budget Advisory presented their report to Senate. During the month of June the Final Operating Budget report was: - Presented to the Financial Planning and Human Resources Committee on June Approved by the Board of Trustees on June 28. Budget Updates and Monitoring Periodic budget updates and the fiscal forecast process is an integral and important aspect of budget development and has been so since the decentralized budget development process began with the fiscal year. The projected operating budget and fiscal forecast reports are shared regularly with the Financial Planning and Human Resources (FPHR) Committee and with the Board of Trustees as changes in revenues and expenditures estimates occur. The following outlines the process undertaken during : The Final Budget Report was approved at the June 23, 2011 meeting of the Board of Trustees. The first budget update occurred with the mid-year budget review. This process provided an opportunity for Budget Developers to analyze financial changes that occurred since the final budget estimates were determined and approved in June. As well revenue assumptions impacted by actual fall enrolment was a major part of the mid-year update. The Mid-Year Budget Review report was presented at the November meeting of the FPHR Committee and submitted to the Board of Trustees in December. The second update occurred with the March 31 fiscal forecast report. Information was provided regarding fiscal results for the period ending and incorporated the impact of any final government grant announcements and a review of Budget Developers year-end projections. In conjunction with the budget development Budget Developers were required to include projections of their budget to the end of the fiscal year. The next fiscal update occurred with the year ending April 30, The preliminary year end results are analyzed and the unaudited results are shared with the FPHR Committee and the Board of Trustees at the June meetings. The final update occurs with the April 30, 2012 audited financial statements which are presented in September to the Audit and FPHR Committees and the Board of Trustees for approval. 13
14 The Enrolment/Revenue Model Another integral part of the budget process is the development of tuition revenue and enrolment-based grant estimates. These annual estimates and periodic budget updates are derived directly from the enrolment and revenue model. This model is developed annually and monitored throughout the year by the Advisory Committee on Institutional Data (ACID). Senior management develops enrolment targets through consultation with the Deans. The targets are then used by ACID to update its enrolment and revenue model. Along with the mandate for enrolment and revenue projections, ACID is required to continually monitor actual revenue and actual enrolment and to report findings to the campus community. These findings inform the budget updates through the fiscal forecast process. As background, in late 2003, ACID became responsible for developing an enrolment and revenue projections model to inform the budget process. Since then, the model has evolved. The first version, used for projections, worked well, but it did not include the retention behaviours of different student groups, such as 101s (those students entering directly from high school) versus 105s, or domestic versus international (visa) students. Thus, from the projections forward, the model was revised to take into account undergraduate student populations by group (domestic 101s, domestic 105s, and visa) and academic progression. For the projections, further refinements to the undergraduate model were made. The double-cohort effect on retention was removed, the tracking of concurrent students was improved, and spring/summer admissions were added for visa and domestic 105s. As well, the graduate enrolment model was adjusted to reflect flow-through by cohort. Two additional modifications were made for the projections. Students taking a coop work term in either the Fall or Winter term were excluded. Domestic 101s who were admitted full-time but registered in a part-time course load in their initial year were added. As of the fall of 2010, the co-op program introduced a for-credit work term co-requisite course but the model continues to exclude students on work term. Currently, 80 per cent of students on a work term register in regular credit courses. This behaviour did not change in or Therefore no modification was incorporated in the model for this program change. To forecast growth, we need to understand where change will occur. Historical analysis of student retention and progression through program has identified that change patterns are driven primarily by undergraduate degree-seeking students. The model is based on the return pattern of undergraduate students pursuing their first degree and who entered within the previous seven years. These students typically account for 90 per cent of the undergraduate degree-seeking population. Eligible (for government funding) FTEs are relevant for determining grant and tuition revenue, while ineligible FTEs generate only tuition. As usual, ACID has developed enrolment scenarios which are separate for each of: a) Spring and Summer sessions (eligible undergraduate excluding Nursing) b) The Fall/Winter session (eligible undergraduate excluding Nursing) c) International (visa) students 14
15 d) Nursing e) Graduate students As has been the case since , excluded from the model are programs subject to special arrangements. These include the following ineligible programs: a) All ISP programs, such as MBA (ISP), MEd (ISP), MA in Applied Linguistics (TESL) (ISP), and IMacc b) Native Teacher Education Program (NTEP) c) In-service Education d) ESL & Testing Services Also excluded are the following eligible (for government funding) programs: a) Enterprise Education (discontinued in 2009) b) Teacher Education (formerly called Pre-Service Education) expected reductions due to the Ministry applied enrolment cap and funding limit are accounted for outside of the enrolment behaviour model c) Adult Education d) Spring/Summer undergraduate sessions BIU projections could be affected by a shift in program mix. For example, in , the average BIU/FTE ratios for first-year students and for all upper-year students combined is assumed to remain the same as in However, the following program mix factors may affect the extent to which this assumption will hold true: a) The mix between Arts & Science programs and other programs (such as Business and Applied Health Sciences), due to the different BIU/FTE weights between these two categories. b) The student program mix between Arts programs and Science programs. On average, students in Science programs have a higher BIU/FTE weight. c) Within Arts or Science programs, the program mix between Honours and Non- Honours students. The following factors determine whether a student can be reported as an Honours student: 1) the student must declare the intent for Honours, and 2) the student s academic performance must meet the minimum requirement for honours standing. Any of the above program mix changes in vs could result in a shift in the BIU/FTE ratios, which will result in a shift in projected BIU changes. The summary chart for enrolment/revenue projections is included in this budget report on page 23. The full Enrolment/Revenue Projections report is issued annually in early June and is available from the Office of Institutional Analysis. 15
16 FINANCIAL HIGHLIGHTS OF THE BUDGET Full financial details for the total revenue and expenditure estimates are provided in the Table 1 that follows on pages 19 and 20. The table provides total revenues by major category and expenditures by functional departmental/divisional reporting. This presentation is useful as it provides gross revenues and expenses and is presented in a manner that is consistent with previous periods and facilitates budget control and monitoring. The following comparative financial information is provided: Approved Budget (June 2011) Final Budget (June 2012) The variances between the Final Budget and Approved Final The following provides a summary comparison of the revenue and expenditure estimates to as summarized on Table 1: Total Revenues $222,720,914 $233,867,889 Total Expenditures 222,683, ,531,339 Surplus, before Pension Payment 37,779 2,336,550 Annual Pension Payment 1,027,000 5,808,000 Deficit, after Pension Payment (989,221) (3,471,450) Appropriated from 11/12 for pension 3,472,306 Surplus remaining after appropriation 856 Accumulated operating deficit, opening (6,967,136) (6,967,136) Accumulated operating deficit, ending $(7,956,357) $(6,966,280) Total Revenues The major categories of the revenues for the operating budget are as follows: % % Student Fees $97,282,319 44% $107,007,655 46% Operating & Other Grants 84,541,462 38% 85,775,456 37% Specific Purpose Grants 6,176,936 2% 5,640,204 2% Ancillary Revenues 30,496,197 14% 30,734,574 13% Other Revenues 4,224,000 2% 4,710,000 2% Total Revenues $222,720, % $233,867, % Total Revenues for are projected to be $233,867,889 which is $11,146,975 or 5 per cent higher than the approved budget. The increase is explained as follows: Tuition Revenue 9,725,336 Government Grants: Basic Operating (104,039) Enrolment Based 1,232,028 General Access (9,384) Performance Fund 115,827 Other Grants (438) 1,233,994 Specific Purpose Grants with matching expenditures (536,732) 16
17 Gross Revenues from Ancillary Operations 238,377 Other Revenues 486, revenue increases over $11,146,975 Total Expenditures The major categories of the expenditures for the operating budget are as follows: % % Academic Faculties $107,727, $113,047, Academic Support & Student Services 33,439, ,890, Executive, Administration, Facilities 44,525, ,493, Ancillary Expenditures 27,035, ,211, Other Global Expenditures 3,778, ,247, Specific Purpose Grants 6,176, ,640, Total Expenditures, excluding pension $222,683,135 $231,531,339 Annual Pension Payment 1,027, ,808, Total Expenditures, including pension $223,710, % $237,339, % Total operating expenditures before the pension payment for are projected to be $231,531,339 which is $8,848,204 or four per cent higher than the approved budget. Total expenses are $4,781,000 higher for the pension payment. The total increase of $13,629,264 is explained as follows: Increases to Departmental/Divisional Base budgets Faculties $5,319,620 Academic Support & Student Services 1,451,605 Facilities 1,648,658 Executive & Administration 319,226 Gross expenses from Ancillary Operations 176,082 Other Global Expenditures 469,745 Specific Purpose Grants with matching revenues (536,732) Expenditure increases, before pension 8,848,204 Pension Payment 4,781, expenditure increases over $13,629,204 Operating In-Year Shortfall and Accumulated Deficit The in-year shortfall, before the pension increase of $4,781,000 was projected to be a surplus of $1,309,550. This is an important figure, as is the first year since the university has been able to eliminate its structural deficit. That is annual revenues are projected to be greater than annual expenditures. In the structural shortfall was $17.4 million. It is a tremendous achievement to have eliminated this over the four years as planned. 17
18 Regrettably, the significant pension payment has overshadowed those good results with the annual payment of $5,808,000 which is an increase of $4,781,000 over the previous payment required of $1,027,000. The in-year shortfall, after the pension payment, is estimated at $3,471,450. At the time of writing, the amount available from year end underspending and/or from carryforward reserves is estimated at $3,472,306 which is enough to eliminate the in-year shortfall projected. As reported at the April meeting of the Financial Planning Human Resources Committee the April 30, 2012 accumulated deficit was forecasted at $7,652,047. With year-end positive variances the in-year shortfall for is expected to be eliminated. Therefore the accumulated deficit for both the April 30, 2012 and 2013 year ends are projected to remain at just under $7 million. Notwithstanding that this is a significant amount, it is still a fraction of the accumulated operating deficit that was estimated to grow in excess of $90 million by the end of had the university not responded to its financial situation back in Full financial details for the total revenue and expenditure estimates are provided in the Table 1 that follows on pages 19 to 20. This provides total revenues by major category and expenditures by functional departmental/divisional reporting. This presentation is useful as it provides gross revenues and expenses and is presented in a manner that is consistent with previous periods and facilitates budget control and monitoring. 18
19 TABLE 1 BROCK UNIVERSITY OPERATING BUDGET Revenues Approved Final Budget Budget June-11 Jun Incr/(Decr) Over Approved Budget Student Fees Tuition Revenue 93,638, ,988,097 9,349,812 10% Incidental Fees 2,520,595 2,704, ,805 7% Contribution from Other Tuition 1,123,439 1,315, ,719 17% sub-total 97,282, ,007,655 9,725,336 10% Operating & Other Grants Basic Operating Grant 74,049,606 73,945,567 (104,039) 0% Total Enrolment Based Grants 5,331,685 6,563,713 1,232,028 23% General Access/ Quality Grant 3,791,087 3,781,703 (9,384) 0% Performance Fund 700, , ,827 17% Other Grants 668, ,962 (438) 0% sub-total 84,541,462 85,775,456 1,233,994 1% Specific Purpose Grants Facilities Renewal Grants 608, ,500-0% Federal - Indirect Costs Program 2,034,592 2,000,000 (34,592) -2% Other Grants 3,533,844 3,031,704 (502,140) -14% sub-total 6,176,936 5,640,204 (536,732) -9% Gross Revenues from Ancillary Operations Bookstore & Printshop Operations 11,998,337 11,534,811 (463,526) -4% Residences 13,920,660 14,578, ,003 5% Conference Services 1,575,000 1,575,000-0% Parking 3,002,200 3,046,100 43,900 1% sub-total 30,496,197 30,734, ,377 1% Other Revenues Investment Income 1,250,000 1,600, ,000 28% Rental & Sundry 2,974,000 3,110, ,000 5% sub-total 4,224,000 4,710, ,000 12% Total Revenues 222,720, ,867,889 11,146,975 5%
20 TABLE 1 BROCK UNIVERSITY OPERATING BUDGET Approved Final Incr/(Decr) Budget Budget Over June-11 Jun-12 Approved Budget Expenditures Academic Faculties Faculty of Applied Health Sciences 13,482,195 14,309, , % Faculty of Business 17,031,795 17,889, , % Faculty of Education 13,874,519 14,784, , % Faculty of Humanities 19,911,056 20,672, , % Faculty of Math & Science 16,419,828 17,450,665 1,030, % Faculty of Social Sciences 27,008,081 27,940, , % sub-total 107,727, ,047,094 5,319, % Academic Support & Student Services Library Department 4,975,389 5,111, , % Library Acquisitions 2,497,875 2,497, % Research & VP Research 1,606,385 1,537,157 (69,228) -4.31% Graduate Studies & Fellowships 5,328,127 6,299, , % VP Acad, Co-op, CPI, CARP 2,636,027 2,630,684 (5,343) -0.20% Financial Aid - Set Aside 4,120,000 4,470, , % Financial Aid - Operating Support 2,505,500 2,505, % ESLS/ IMD 481, ,312 12, % AVP, Registrar, Recruitment, Student Support Services 9,288,509 9,345,279 56, % sub-total 33,439,093 34,890,698 1,451, % Executive, Administration, Facilities Facilities Mgmt Operating Costs 12,670,975 14,862,639 2,191, % Facilities Mgmt - Utilities & Co-gen Plant 4,731,634 4,188,628 (543,006) % Interest & Principal 2,282,271 2,282, % Campus Security, Emergency Management Plan 1,568,278 1,542,191 (26,087) -1.66% Information & Technology Services/Acquisitions 7,343,435 7,544, , % President & University Secretariat 1,180,418 1,183,412 2, % Planning, Internal Audit and Human Rights & Equity 457, ,270 12, % VP Finance/Admin, Finance, HR & Health & Safety 5,819,717 5,738,543 (81,174) -1.39% BCA, Athletics, Recreation, St. David's Road, Other Comm. Serv. 4,267,446 4,400, , % VP Advancement, Develop., Alumni, Telegrad, Mktg & Comm. 4,204,343 4,280,488 76, % sub-total 44,525,897 46,493,781 1,967, % Gross Expenses from Ancillary Operations Bookstore & Printshop Operations 10,243,569 9,758,942 (484,627) -4.73% Residences 13,920,404 14,578, , % Conference Services 1,257,650 1,249,700 (7,950) -0.63% Parking 1,614,000 1,624,400 10, % sub-total 27,035,623 27,211, , % Other Global Expenditures 3,778,112 4,247, , % Specific Purpose Grants Facilities Renewal Grants 608, , % Federal - Indirect Costs Program 2,034,592 2,000,000 (34,592) -1.70% Other Grants 3,533,844 3,031,704 (502,140) % sub-total 6,176,936 5,640,204 (536,732) -8.69% Total Expenditures 222,683, ,531,339 8,848, % Surplus, before Pension Payment 37,779 2,336,550 2,298,771 Pension Payment (1,027,000) (5,808,000) (4,781,000) Deficit, after Pension Payment (989,221) (3,471,450) (2,482,229) Appropriated from 11/12 for Pension 3,472,306 Surplus Remaining 856 Accum. Operating Deficit, beginning of year (6,967,136) (6,967,136) Accumulated Operating Deficit, end of year (7,956,357) (6,966,280)
21 REVENUE ASSUMPTIONS & ESTIMATES TUITION REVENUE Total tuition revenues for are expected to be $107,007,655. The tuition fee increases have grown steadily and more than doubled over ten years as the following chart depicts: $110.0 Tuition Revenue to $107.0 $100.0 $98.1 $90.0 $82.0 $90.5 $ (in millions) $80.0 $70.0 $60.0 $58.8 $64.0 $68.4 $71.3 $76.0 $76.2 $50.0 $46.0 $ /03 03/04 04/05 05/06 06/07 07/08 08/09 09/10 10/11 11/12 12/13 Tuition Revenue Tuition revenue represents almost 46% of total operating budget revenue and is estimated to increase by $9,725,336 or 10% (compared to $7,611,442 or 9% in the previous year). This year s increase is due to the additional enrolment increases experienced during of $1,777,572 that was reported in the mid-year budget report and will continue into As well activity and rate increases are expected to occur in of $2,021,208 and $4,951,032 respectively. Also included is a conservative estimate of additional revenues of $600,000 estimated to materialize from the pedagogical innovations that will begin during Other tuition includes incidental fees (co-op fees, Health Services, athletics and intramural fees) and contributions from the IELP (Intensive English Language Program), and various international programs. Increases have occurred in incidental fees to reflect actual revenue levels. Faculties have increased contributions to achieve targets. The following summarizes the changes in the budget over the approved budget: 21
22 Actual activity increase during $ 1,777,572 Projections over actual levels: Projected activity increase 2,021,208 Rate increases 4,951,032 Other Tuition Sharing & Incidental Student Fees 375,524 Estimate new revenue from Pedagogical Innovations 600,000 Total Tuition Revenue $ 9,725,336 Enrolment Projections The single-most important generator of revenue for the University is its enrolment. Two key assumptions in projecting enrolment include intake targets in Year 1, and retention behaviour of current students. Many factors, such as changes in retention strategies or policies and/or changes in the economic situation, could affect student retention behaviour, and the impact of such changes on student retention is very difficult to predict. The following chart displays that the Year 1 intake for domestic and visa students are projected at 3,780 for , which is over 100 more than actuals. The chart indicates that the actual results are slightly lower than projected (lower by 37). Year 1 intake, undergraduate full-time students (head count enrolment as at November 1) Domestic 101s (directly from secondary school) Domestic 105s (not directly from secondary school) Actual Projected Actual Projected 2,928 2,933 2,889 3, Subtotal Domestic 101 and 105 undergraduate students: 3,505 3,533 3,497 3,608 visa students Total: 3,641 3,705 3,668 3,780 The following chart displays the actuals and projections for all students by headcount, FFTEs and BIUs (see Appendix II Definitions and Counting Students): All students (undergraduate and graduate) Actual Projected Actual Projected Headcount enrolment 17,877 18,056 18,190 18,303 FFTEs 18,180 18,370 18,012 18,098 Yearly BIUs 25,077 25,418 24,723 24,816 Enrolment/Revenue Model for The Enrolment/Revenue Model developed through ACID projects head count enrolment, translates head count enrolments into FFTEs, converts FFTEs to BIUs, and calculates tuition and grant revenue. Eligible (for government funding) fiscal full-time equivalents (FFTEs) are relevant for determining tuition revenue and grant revenue, while ineligible FFTEs generate only tuition. Refer to Appendix II for Definitions and Counting Students. The 22
23 following chart from the ACID Enrolment/Revenue Projections report displays the projected change of over the actuals: Category: 1.0 ACTIVITY Revenue Type: Projections (change over actuals) Activity Change: Revenue Change: 1.1 Undergraduate Spring/Summer Domestic Tuition FFTEs: 0 $0 (excluding Nursing) Grant BIUs: 0 $0 Total: $ Fall/Winter Domestic Tuition FFTEs: $1,140,278 (excluding Nursing) Grant BIUs: $571,685 Total: $1,711, Visa Tuition FFTEs: 47.0 $673,881 Grant BIUs: Total: $673, Nursing Tuition FFTEs: ($67,148) Grant BIUs: ($120,132) Total: ($187,280) Total, Undergraduate: Tuition FFTEs: $1,747,011 Grant: BIUs: $451,553 Total: $2,198, Graduate * Tuition FFTEs: $274,197 Grant BIUs: $0 Total: $274, Total, All Activity Tuition FFTEs: $2,021,208 Grant BIUs: $451,553 Total: $2,472, TUITION RATE $4,951, GRAND TOTAL Total, Activity + Rate Tuition FFTEs: $6,972,240 Grant BIUs: $451,553 Total: $7,423,793 Tuition Set Aside** ($280,000) *Graduate headcount and FFTEs are both eligible and ineligible; BIUs are annual eligible only. Two assumptions regarding graduate expansion grant projections are: 1) the additional projected 10.8 PhD growth will be funded through a conversion of the 23.6 unused Masters spaces (similar to last summer s MTCU policy).; and 2) Brock would receive at least 15.5 PhDs (~last year s bridge fund --$413,219) from the 600 graduate spaces to be allocated for **Total undergraduate tuition is expected to increase by $1,747,011 in over , but $280,000 of this amount has to be added to set aside for bursaries. 23
24 Fee and Rate Setting Process Universities, through their individual acts of incorporation, have full authority to establish their own fee levels. The government, however, through the Ministry of Training, Colleges and Universities (MTCU), issues Tuition Fee Policy guidelines for government-funded courses. According to the guidelines, an institution will be penalized through a grant reduction for fees charged above the permitted levels. Universities have full discretion over tuition fee increases for non-government funded courses. A proposed list of the upcoming academic year tuition fees is brought forward annually to the Financial Planning and Human Resources Committee and to the Board of Trustees for approval. Given that the government s announcement on tuition fees took place on March 8, 2012, the approval was brought forward in April this year. This timing is important to ensure critical timelines are met for setting fees in the student information system, calendars, publications and payment notifications. Generally, tuition rate increases are effective for the next Fall/Winter session. Tuition rate increases may be effective for the next Spring/Summer session where the cohort for the academic year begins prior to the Fall session. Approved tuition fees for can be found on the Brock University website at Tuition Fee Policy Government Funded Programs The tuition fees for domestic students in government funded undergraduate and graduate programs were approved by the Board of Trustees on April 26, 2012 to the maximum percentages as allowed by the government s tuition guidelines. On April 10, 2006, the Ministry issued a Guideline for Implementation of Tuition Fee Policy for Publicly Assisted Universities that was in effect from until and provided a regulatory framework for all publicly funded programs. On March 29, 2010, the Ministry announced greater financial assistance for postsecondary students and a plan to modernize the Ontario Student Assistance Program (OSAP). The announcement also included the continuation of the current tuition framework for two years, with no changes, except for the requirement to contribute 10 per cent of additional revenue from tuition fee increases to bursaries and other student assistance programs that provide financial aid to students most in need. On March 8, 2012, the Ministry announced the extension of the current tuition framework for one year to tuition fees at colleges and universities. In addition, the government placed a moratorium on increasing or establishing flat and deferral fees for Universities cannot introduce changes to the structure of their tuition fee payment or deferral schedules or introduce new flat fee structures but can increase existing flat fees by the annual percentages allowed under the tuition fee framework. The guideline allows for tuition fee differentiation based on program and program year of study as follows: Distinguishes separate maximum limits for first year of study and continuing years. Tuition fees may increase within specified limits with the average tuition increase not to exceed 5 per cent (excluding changes in enrolment activity). 24
25 The following chart displays the government tuition guidelines: Maximum Allowable Fee Increase Program * Type Program Year First Year Continuing Years Arts & Science and Other Programs 4.5% 4% Professional and Graduate Programs 8% 4% Total Tuition Increase 5% * Program Categories are as defined by MTCU Appendix A to the Policy Since , this tuition framework has been implemented for Brock University programs. The Undergraduate Professional Programs include Computer Science and Business and Graduate Programs include Master of Accountancy, Master of Business Administration, Master of Education, Master of Arts, Master of Science, Master of Business Economics, Master of Applied Disability Studies, PhD Arts and Science, and PhD Education. Having implemented the Ontario government s tuition policy of fee differentiation, the 2012 fee structure will result in seven differentiated rates for each program type (First year / 2011 Continuing / 2010 Continuing / 2009 Continuing / 2008 Continuing / 2007 Continuing / 2006 and prior Continuing). The number of differentiated rates has resulted into a complex multirate matrix. Tuition Fees Non-Government Funded Programs Visa students in graduate and undergraduate programs are not eligible for provincial government funding and therefore universities are not governed by the government s tuition policy in setting tuition rates for this student group. This year a differentiated approach was taken with undergraduate versus graduate international students as well as benchmarking to fees charged at other Ontario universities. On April 26, 2012 the Board of Trustees approved the undergraduate visa rates to be increased by 13.7% and that approximately 5.5% would be set aside for awards and need-based bursaries. The graduate visa rates were also approved to increase in by 5%. Tuition fee increases for various other non-funded cost recovery programs and international students were also approved by the Board of Trustees on April 26, 2012 after comparisons with competitive markets were presented. Residence Fees Residence fees are brought forward in February to the Financial Planning and Human Resources Committee and to the Board of Trustees for approval on February 16, The Residence fees include costs associated with providing the room, utilities, phone, and network/cable TV connection, and residence life program and activities. Approved Residence fees for can be found on the Brock University website at 25
26 Compulsory Non-Tuition-Related Ancillary Fees Compulsory non-tuition-related ancillary fees are established by student referendum or according to the Ancillary Fee Protocol as agreed to with the Student Unions. Some existing fees can increase automatically only after the CPI has accumulated to 5% since the last fee increase or where fees are system wide fees applicable to all Ontario University students. Ancillary fees are all assessed and collected by the University and are either administered by the University or by the BUSU (Brock University Students Union) or the GSA (Graduate Students Association) and are effective for the fall 2012 term unless otherwise stated. These fees were presented to the Board of Trustees on April 26, Administrative, Membership, Parking & Service Fees Administrative Fees are for fee-for-service costs. The departments that provide these services and assess the fees include the Registrar s Office, Graduate Services, Student Accounts Finance, Career, International and Library Services. The fees are reviewed annually to ensure they cover current costs. Additionally, fees are charged by the University for the administration of tuition fees. These fees include such types as late registration fees, deferral fees, interest charges and deregistration fees. As part of the tuition fee announcement on March 8, 2012, the government placed a moratorium on deferral fees for with the intention of conducting a review of tuition administration fees to recommend a standardized approach amongst Ontario Universities. Thus no increases have been proposed on these types of fees pending the government review. Most administrative fees are effective May 1, 2012 and are published by the respective departments responsible for administering and/or collecting the fees. The Department of Recreation Services annually reviews Walker Complex membership rates for use by students, staff, faculty and community members. As well, Parking Services annually proposes new permit and visitor rates. The Ancillary, miscellaneous administrative and service fees for were brought forward to the Financial Planning and Human Resources Committee and the Board of Trustees for information on April 26, OPERATING AND OTHER GRANTS Operating Grants represents almost 37% of total operating budget revenue. They are typically general purpose and largely impacted by enrolment shifts over the previous year, over a government determined base year or trends over a number of years. Also, each university s grant is usually funded in direct proportion to its enrolment share of the provincial student enrolment system. Calculation of grants can often be predicted with relative accuracy, but some are not known until The Ministry of Training, Colleges and Universities (MTCU) announce them throughout the year with final announcements typically confirmed at the end of the province s fiscal year end of March 31. The following section summarizes the most significant grant estimates based on the University s best assumptions available at the time of writing. 26
27 Basic Operating Grant Core government funding comes through Basic Operating Grants. This funding is distributed to universities based on enrolment levels. To approximate the cost of each program, the number of fiscal full-time equivalent (FFTE) students is multiplied by a program weight to determine the number of Basic Income Units (BIUs). Refer to Appendix II for Definitions and Counting Students. Included in the basic operating grant is an amount for Teacher Expansion Funding that was initiated in As part of the 2010 Ontario Budget announcements, MTCU announced that the Teacher Expansion Funding would be removed from those institutions with a Faculty of Education in recognition that there was an oversupply of qualified teachers in Ontario. The amount of funding that will be removed from this group is being phased-in over two years, and The actual decrease in the base grant for was $312,081; and the expected decrease in is $207,999, for a total decrease of $520,080 over the two years in Teacher Expansion Funding. No further decreases are expected. In , the MTCU rolled into the Basic Operating Grant the , Undergraduate Accessibility grant of $2,557,731, thereby making it permanent funding. At the end of , the MTCU also rolled into base the Undergraduate Accessibility grant of $2,531,699. Reflecting these changes, the Basic Operating Grant is estimated at $73,945,567, as follows: Estimated Actuals Approved Budget Basic Operating Grant $69,376,217 $69,376,217 $69,376,217 Accessibility Grant-09/10 rolled into base 2,557,731 2,557,731 2,557,731 Accessibility Grant-10/11 rolled into base 2,531,699 2,531,699 2,531,699 Teacher Education Reduction Teacher Education Reduction-11/12 (416,042) (416,042) (416,042) Teacher Education Reduction MTCU adjustment- 11/12 103, ,961 Teacher Education Reduction-12/13 (207,999) Total Basic Operating Grant $73,945,567 $74,153,566 $74,049,605 Enrolment Based Grants The Enrolment Based Grants are estimated at $6,563,713, which is higher by $451,553 than the actuals and $1,232,028 higher than the approved budget. The increase in the enrolment-based grants (undergraduate, graduate and nursing) is due to additional undergraduate enrolment increases expected in as well as full funding of increases expected to occur in The certainty of funding for these grants is dependent on achieving enrolment results and on the government funding provided not only to Brock but the entire Ontario university system. Also, it is assumed that Brock would receive the same amount of Graduate Expansion Grant in as in (see details in the section below). The Nursing grant is expected to decrease slightly. The following summarizes the three enrolment-based grants: 27
28 Enrolment Based Grant Final Approved Budget (Jun 2011) Approved Mid-Year Budget Changes (Nov 2011) Budget and Actuals Projected Projected Total Budget (as at Nov 2011) Actual adjustments in Final Grant Actuals Received for Projected incremental for Requested Budget a b c=a+b d e=c+d f g=e+f Undergraduate Accessibility Fund $964,133 $1,210,772 $2,174,905 ($125,127) $2,049,778 $571,685 $2,621,463 New Graduate Expansion $1,993,028 ($593,998) $1,399,030 $0 $1,399,030 $0 $1,399,030 Nursing Grant $2,374,524 $285,590 $2,660,114 $3,238 $2,663,352 ($120,132) $2,543,220 Total: $5,331,685 $902,364 $6,234,049 ($121,889) $6,112,160 $451,553 $6,563,713 a) Undergraduate Accessibility Growth Fund The Ontario government introduced the undergraduate accessibility fund in to ensure that universities were able to cope with the expected enrolment growth due to the double cohort. At that time, universities received an undergraduate accessibility grant based on their year-over-year undergraduate enrolment growth. This grant rose significantly during the initial double cohort years, and the accessibility grants a university had received up to were rolled into its basic operating grant. Up to , an institution would receive an Undergraduate Accessibility Grant if there was positive enrolment growth over undergraduate enrolments. The Undergraduate Accessibility Grant for growth to was rolled into the base in In , Brock received an Undergraduate Accessibility Grant of $2,531,699 and this amount was rolled into the base in Brock received an Undergraduate Accessibility Grant of $2,049,778 in due to positive enrolment growth over by BIUs and FTEs. The Ministry of Training, Colleges and Universities has indicated that the Undergraduate Accessibility Grant will be funded based on positive growth over Since Brock s undergraduate enrolment will continue to increase in over , assuming fully funding, Brock s total the undergraduate accessibility grant in will be the amount received in plus the amount due to additional growth in over The following formula will again be applied: Undergraduate Accessibility Grant = Change in BOI [Increase in BIU * $5,442.15(BIU The Value)] change Change in BIUs in for Formula Fees over [Increase in is FTEs expected * $2, to be (adjusted and Formula the increase Fees in FTEs per FTE)] is expected to be Therefore: Change in BOI: 161.3*$5, = $877,818 Change in Formula Fees: 129.6*$2, = $306,133 28
29 Undergraduate Accessibility Grant for over is expected to be $571,685 ($877,818 $306,133). Final Approved Budget (Jun 2011) Approved Mid-Year Budget Changes (Nov 2011) Enrolment-based grant: Undergraduate Accessibility Grant Budget and Actuals Projected Projected Total Budget (as at Nov 2011) Actual adjustments in Final Grant Actuals Received for Projected incremental for Requested Budget a b c=a+b d e=c+d f g=e+f [$3,495,832 Less $2,531,699 rolled into base =] $964,133 $1,210,772 $2,174,905 ($125,127) $2,049,778 $571,685 $2,621,463 b) Graduate Expansion Grant Brock s graduate expansion enrolment allotment for the period of to was Masters and 17.5 PhDs (Eligible FTEs, Fall and Summer). In summer 2011, the Ministry of Training, Colleges and Universities announced that it would allow for conversion between Master s and PhDs if there were unused spaces in either level. In the announcement, the Ministry also provided a one-time top-up bridge fund for over-the-target graduate enrolment. In , Brock exceeded the previously allocated PhD target by 34.5 FTEs. However, Brock under-achieved the allocated Master s target by 49 FTEs and we were able to convert these 49 unused Masters into 19 PhDs. The remaining 15.5 PhD FTEs in were funded through the one-time top-up bridge fund. Therefore, Brock s enrolment growth in PhDs in was fully funded. Also, a result of the conversion, Brock s graduate expansion enrolment allotment was changed to Masters and 36.5 PhDs. For it is projected that Brock s eligible PhD enrolment will increase by 10.8 FTEs and the eligible Masters enrolment will decrease by 23.6 FTEs over We are hopeful that MTCU will again allow us to convert the 23.6 unused Master s into approximately 10 PhDs. Therefore the additional enrolment growth of 10.8 PhD FTEs is expected to be fully funded and such funding will compensate for the decrease in graduate expansion grant due to the enrolment decrease in Master s. Although MTCU has indicated that the one-time top-up bridge fund will not continue in , it is assumed that, of the 600 graduate spaces to be allocated for , Brock would receive an allotment of at least 15.5 PhDs. Therefore, Brock s enrolment growth in PhDs is expected to be fully funded in and the same amount of graduate expansion grant is expected to be received in as in The incremental and total budgeted graduate expansion grant amounts are summarized in the table below: 29
30 Final Approved Budget (Jun 2011) Enrolment-based grant: Graduate Expansion Operating Grant Approved Mid-Year Budget Changes (Nov 2011) Budget and Actuals Projected Projected Total Budget (as at Nov 2011) Actual adjustments in Final Grant Actuals Received for Projected incremental for Requested Budget a b c=a+b d e=c+d f g=e+f $1,993,028 ($593,998) $1,399,030 $0 $1,399,030 $0 $1,399,030 c) Nursing Collaborative and Completion Grant The following three programs are taken into consideration when predicting enrolment (and revenue): Collaborative Nursing (a joint program with Loyalist College); Nursing Completion (the final two years of the four-year BScN program) no longer offered; and The four-year BScN program. The Nursing grant is funded under a separate envelope through the college system envelope. Brock receives its grant through Loyalist College and is paid on a slip-year basis (that is, we are paid based on the enrolment in the prior year). The grant revenue for Nursing is calculated by multiplying the most recent year s ( ) funding rate by projected FTEs. Using this method, Nursing grant revenue is expected to decrease by $120,132. The total grant for is expected to be $2,543,220. Enrolment-based grant: Nursing Grant Budget and Actuals Projected Final Approved Budget (Jun 2011) Approved Mid-Year Budget Changes (Nov 2011) Projected Total Budget (as at Nov 2011) Actual adjustments in Final Grant Actuals Received for Projected incremental for Requested Budget a b c=a+b d e=c+d f g=e+f $2,374,524 $285,590 $2,660,114 $3,238 $2,663,352 ($120,132) $2,543,220 General Access & Quality Grant Funds were provided to universities to increase access to high-quality postsecondary education across the province. There is a requirement for each university to sign multi-year accountability agreements (MYAAs) that will monitor the use of the funds against the goals of access, quality and accountability. These quality funds are not guaranteed to become base funding. In preparing the grant estimates, the assumption is that General Access and Quality grant will continue at the same level as in and is estimated at $3,781,
31 Performance Fund Since , the government has provided Performance Funding. Universities are measured on three indicators: the employment rate of graduates six months after graduation; employment rates two years after graduation; and a cohort-based graduation (degree completion) rate. A benchmark is established for each of the three indicators and universities performing within 10 per cent of the benchmark receive funding based on their share of total BIUs and to what extent they are above or under their benchmark. Given the relatively stable level of funding, we have assumed that the grant for would be $816,511 based on the actual grant received in Specific Purpose and Other Grants The University receives a number of grants funded by the Provincial or Federal governments for specific expenditures of the same amount. Included in this category are a number of annual special grants relating to Facilities Renewal, Students with Disabilities, Interpreter and Learning Opportunities, Aboriginal, provincial Research Overhead, Municipal Taxes, Womens Campus Safety, provincial Student Bursaries, and Federal Indirect Costs Program. Budget amounts, in both revenues and expenses, have been adjusted to reflect expected funding levels. Facilities Renewal Funds One of the constraints in the 2010 provincial budget was that the Facilities Renewal Program (for deferred maintenance of academic space) would be reduced to $26 million (for both colleges and universities) from the level of $40 million. This grant is funded in direct proportion to the universities enrolment share of the provincial student enrolment. It was confirmed that the funding level would remain unchanged at $608,500. Federal Indirect Costs Program The three federal granting agencies (CIHR, NSERC, and SSHRC) support the direct costs of conducting research. The Indirect Costs Program helps universities to defray the indirect costs of federally-supported research. These include operations, maintenance, libraries and technology. The amount is determined based on a formula that incorporates a base amount and the average of the last three years of research funding from the three agencies. Brock s funding is estimated to be $2,000,000. Note that the operating budget does not include the direct cost funding for Research nor does it include the direct costs associated with Research. OTHER REVENUES Investment Income Investment income includes the interest that the University receives on short-term investments of its excess operating cash as well as interest income recovered from internallyfinanced capital projects. The interest income at 4.5 per cent is recovered from internallyfinanced capital projects (Courtyard Marketplace, International Building and the Glenridge Plaza) and will be $800,000. Interest income realized on excess cash balances will be higher than the approved budget by $400,000 and is currently estimated at $800,000. With the total budget at $1,600,000, the increase over is $350,000 or 28%. Refer to page 48 for cash flow information. 31
32 Rental and Sundry The largest portion of this revenue category is Brock s share of the fees charged by the Ontario Universities Application Centre. Also included are revenues from other general revenues, space rental, interest charges on accounts receivable, and fees for transcripts and other administrative service charges. Even though fluctuations occur within various categories, the overall budget has been relatively stable from year to year and is estimated to be $3,110,000 for is a 5% increase over the previous year. EXPENDITURE ASSUMPTIONS & ESTIMATES Budget Developer s prepared expenditure budgets as defined by their functional area of responsibility. The Responsibility Centre s are generally defined by the organization structure (e.g. Academic, Student Services and Administration). Budgets are developed, analyzed and variances explained by these functional areas and thus expenditures are summarized in this format. This presentation is useful as it provides expenses in a manner that is consistent with previous periods and facilitates budget control and monitoring. However, there are categories of expenses (e.g. salaries) that weave through and impact all departments and/or divisions and thus information on these major categories of expenses has been included. Table 2 that follows on page 33 provides a summary view of the major groupings of revenue, net ancillary revenue, responsibility centres and global expenditures. 32
33 TABLE 2 OPERATING BUDGET SUMMARIZED BY MAJOR GROUPINGS Approved Final Incr/(Decr) Budget Budget Over June-11 Jun-12 Approved Budget Revenues Student Fees 97,282, ,007,655 9,725,336 Operating & Other Grants 84,541,462 85,775,456 1,233,994 Other Revenues 4,224,000 4,710, ,000 Net Ancillary Revenue 3,460,574 3,522,869 62,295 Subtotal 189,508, ,015,980 11,507,625 Expense by Responsibility Centre Academic Faculties 107,727, ,047,094 5,319,620 Library Department 4,975,389 5,111, ,966 Research & VP Research 1,606,385 1,537,157 (69,228) Grad studies/dean's Office 849, ,130 18,076 VP Acad., Co Op, CPI 2,636,027 2,630,684 (5,343) AVP Student Services, Student Support Services 9,769,790 9,838,591 68,801 Facilities Mgmt Operating Costs 12,670,975 14,862,639 2,191,664 Campus Security, Emergency Mgmnt Plan 1,568,278 1,542,191 (26,087) Information & Technology Services 6,337,257 6,867, ,644 President & University Secretariat, 1,180,418 1,183,412 2,994 Planning, Internal Audit, Human Rights & Equity 457, ,270 12,890 VP Fin/Admin, Finance, HR & Health & Safety 5,819,717 5,738,543 (81,174) BCA, Athletics, Recreation, Other Community Services 4,267,446 4,400, ,536 VP Advancement, Devel., Alumni, Telegrad, Mktg & Comm 4,204,343 4,280,488 76,145 Subtotal 164,069, ,378,437 8,308,504 Global Expenditures Library Acquisitions 2,497,875 2,497,875 - Graduate Fellowships 4,479,073 5,432, ,333 Financial Aid Set Aside Bursaries & Scholarships 4,120,000 4,470, ,000 Financial Aid Operating Support Bursaries & Scholarships 2,505,500 2,505,500 - Facilities Mgmnt Utilities & Co Gen Plant 4,731,634 4,188,628 (543,006) IT Acquisitions 1,006, ,456 (329,722) Interest & Principal 2,282,271 2,282,271 - Pension 1,027,000 5,808,000 4,781,000 Professional Allowances 1,200,000 1,425, ,740 Other Global Expenditures 2,578,112 2,822, ,005 Subtotal 26,427,643 32,108,993 5,681,350 Total Deficit, after Pension Payment (989,221) (3,471,450) 2,482,229 Appropriated from 11/12 for Pension 3,472,306 Surplus Remaining 856
34 The following section on the budget expenditure estimates will be reviewed and focus on: Salaries and Benefits Non-Salary and Global Costs Highlights by Responsibility Centre Ancillary Operations SALARIES AND BENEFITS Given the nature of a university s business, it is not surprising that the largest cost would be salary and benefits of faculty and staff. Faculty and staff (full and part-time) salaries and benefits comprise the most significant portion (approximately $168,050,000 or 84 per cent) of the University s expenditure budget, excluding the expenses for gross ancillary operations and special purpose grants. The following graph shows how the salary and benefit costs have risen continually by almost $43 million over the last several years. $175.0 Salary & Benefit Costs to $168.0 $ (in millions) $165.0 $155.0 $145.0 $135.0 $125.0 $125.0 $128.5 $134.6 $138.4 $144.2 $150.1 $156.6 $ At Brock University, the salary base has grown rapidly over the past several years primarily from salary rate increases. Over the last several years minimal positions have been added from central funds, but new positions have been created from time-to-time with other resources (e.g. converting part-time into full-time). These investments add to the salary and benefit base on which annual rate increases apply. Benefit costs include faculty professional development accounts, employer contributions to the Brock University Pension Plan, dental, medical, and statutory taxes (CPP, EI, EHT and WSIB). These benefit costs have been increasing as many of these costs are a percentage of the employee s base salary. However, the increases are not a result of significant enhancements to the overall University benefit coverage. The University benefit budgets are estimated using an average experience percentage for each salary group. Actual benefit costs by employee are determined through the payroll system and are charged directly to the cost centre along with the employee s actual salary costs. 34
35 The largest increase in base operating budgets is from salary and benefit costs. The cost for salary and benefits of faculty and staff (full and part-time) salaries and benefits comprise the most significant portion (over 80 per cent) of the University s operating expenditure budget. The salary expenditure increases are relatively consistent from year to year as follows: Actual salary costs from negotiated contract settlements, Estimated salary costs for contracts in negotiation or rates to be determined, The benefit costs associated with increased salary rates, New positions (e.g. facilities and cleaning staff for CFHBRC), Additional positions (e.g. Deans returning to faculty) positions, Full-year impact of approvals, The full-year impact of faculty and staff salary increases, The full-year impact of increases due to job evaluations. The bargaining salary group costs were all known for except for the OSSTF support staff group. For known salary increases these have been allocated to departmental lines. The estimated costs for OSSTF have been set aside globally. As actual rates are known by individuals additional budget amounts will be allocated to departments and divisions throughout the year from the global estimates. The bargaining salary groups are as follows: BUFA Brock University Faculty Association Number of Employees: 566 Duration: July 1, 2011 to June 30, 2014 Bargaining Status: Ratified by the parties, September OSSTF, DISTRICT 35 Ontario Secondary School Teachers Federation (Admin Support Staff) Number of Employees: 238 Duration: May 1, 2010 to April 30, 2012 Bargaining Status: Ratified by the parties, April CUPE 1295 Canadian Union of Public Employees Maintenance & Trades Number of Employees: 125 Duration: May 1, 2010 to April 30, 2013 Bargaining Status: Ratified by the parties, February CUPE 2220 Rodman Hall Number of Employees: 3 Duration: July 1, 2009 to June 30, 2012 Bargaining Status: Ratified by the parties, February CUPE 4207 (Unit 1) TAs, Part-time Instructors, etc. Number of Employees: approx Duration: July 1, 2010 to June 30, 2013 Bargaining Status: Ratified by the parties, April CUPE 4207 (Unit 2) ESL Coordinators Number of Employees: 7 Duration: July 1, 2010 to June 30, 2013 Bargaining Status: Ratified by the parties, April CUPE 4207 (Unit 3) ESL Instructors (new) Number of Employees: 70 Duration: July 7, 2011 to July 6, 2014 Bargaining Status: Ratified by the parties, April

36 IATSE 461 International Alliance of Theatrical Stage Employees (Stagehands) (new) Number of Employees: 10 Duration: June 6, 2011 to June 5, 2014 Bargaining Status: Ratified by the parties, March The Administration and professional salary group represents the non-bargaining staff. With the provincial budget in March 2010, the government introduced the Public Sector Compensation Restraint to Protect Public Services Act, 2010 (Bill 16) to freeze compensation in the Ontario Public Service and the Broader Public Sector non-bargaining employees for two years (March 24, 2010 to March 31, 2012). For the last two years only step and merit increases proceeded as per existing and defined processes. For , salary adjustments were approved in March 2012 and were announced in May. The costs have been set aside globally. NON-SALARY COSTS Non-salary expenses represent the remaining 16 per cent of total expenditures (excluding the expenses for gross ancillary operations and special purpose grants). Budget Developers have the flexibility to manage their non-salary budgets and therefore increases or decreases can vary within the categories but have not fluctuated greatly from year to year. The components of the non-salary estimates for are illustrated below. Non-Salary Costs Printing/ Photocopying 3% Teaching, Office, Custodial Supplies 3% Consulting, Legal, Memberships 2% General Office 2% Property & Liability Insurance 2% IT Acquisitions 3% Travel 4% Student Scholarships & Bursaries 32% Debt Service 7% Utilities & Co-Gen 18% Library Acquisitions 7% Promotion, Training, Recruitment 7% Equipment, Repairs & Mtce 10% 36
37 GLOBAL EXPENDITURES The follow summaries significant global expenditures as summarized on Table 2 (page 33): 11/12 12/13 Increase (Decrease) Library Acquisitions 2,497,875 2,497,875 - Graduate Fellowships 4,479,073 5,432, ,333 Financial Aid Set Aside Bursaries & Scholarships 4,120,000 4,470, ,000 Financial Aid Operating Support Scholarships 2,505,500 2,505,500 - Facilities Utilities & Co Gen Plant 4,731,634 4,188,628 (543,006) IT Acquisitions 1,006, ,456 (329,722) Interest & Principal 2,282,271 2,282,271 - Pension 1,027,000 5,808,000 4,781,000 Professional Allowances 1,200,000 1,425, ,740 Other Global 2,578,112 2, ,005 26,427,643 32,108,993 5,681,350 Graduate Fellowships During the mid-year budget review, the Faculty of Graduate Studies requested that the value of the fellowships increase to ensure the packages to students were more competitive and requested a volume increase that would be needed in Therefore, it was approved at mid-year that the graduate fellowship budget for would be increased by an amount of $900,000. Undergraduate Bursaries & Scholarships Funding from the operating budget in support of undergraduate students include entrance scholarship funding and financial-need bursaries. The funding requirements are determined from Tuition Set-Aside and Student Access Guarantee (SAG) requirements. With the extension of the government s tuition fee policy, the current tuition fee set-aside policy will remain the same for The amount of tuition fee set-aside funding to be disbursed annually will be set at the previous year s tuition fee set-aside levels plus 10% of the additional fee revenue resulting from tuition fee increases in the current year, with adjustments to be made for annual enrolment changes i.e. increased/decreased by the annual percentage increase/decrease in fiscal full-time equivalent (FFTE) enrolment. Institutions are expected to disburse all of the tuition fee set-aside funds by August 31 of each year. 37
38 To calculate the tuition fee set-aside level for , Universities are to use the tuition fee set-aside level as the base, plus 10% of the incremental tuition fee revenue for tuition fee increases based on average tuition in each year and holding enrolment constant at levels (average tuition fee is represented by the enrolment weighted average tuition fee rate), and then adjust for the percentage change in enrolment between and The projected tuition fee set-aside amount is expected to increase by $280,000 plus a volume increase of $70,000 for a total increase of $350,000. The Student Access Guarantee (SAG) provides for students to be entitled to an amount of funding based on a specified automatic calculation. It is the government s prediction that this automatic funding will be reduced as a result of the 30% Ontario Tuition Grant which will provide the resources to support a number of government funded bursaries to be funded directly by the universities (e.g. Work-study). The impact will be reviewed at mid-year. Interest and Principal The debt service amount noted above reflects the global requirement only. The University has $93 million of senior unsecured debentures. In 2005, proceeds from the debentures were used to refinance existing debt and new capital requirements. These funds were acquired at an annual interest rate of per cent over a 40-year term, with the principal due as a bullet payment in A sinking fund had been established to ensure adequate funds are available to retire the debt in Since interest and principal payment savings on retired debt amounted to $1,400,000 annually. The annual interest payment on the $93 million amounts to $4.6 million and was allocated based on the loans refinanced or new capital acquired at that time. This interest payment and the annual sinking fund payment of $475,000 are covered in the operating budget as follows: Residence operations $2.5 Parking operations.5 Central 2.1 Total $5.1 million In addition to the amounts noted above, there is interest and principle annual payments of $2 million for Residence buildings that are covered by the Residence operation and the St. David Road s payments of $305,000 that are covered from the retail rent revenues at that location. Pension Plan Costs As indicated in the approved budget in June 2011, budget impacts from the pension would be brought forward during the budget updates. The greatest impact on the plan s funding shortfall is increasing salary wage costs and actuarial assumptions regarding life expectancies as well as the market conditions that have occurred since All pension plans have experienced growing deficits from asset values dropping from the market conditions and record low interest rates causing upward pressure on pension obligations. The actuarial results for July 1, 2011 were known in February 2012 and confirmed the significant increase to the going concern shortfall to $35 million. Annual payments will increase to $5.8 million from the current level of $1.1 million. At the March 12, 2012 joint meeting of the Financial Planning and Human Resources Committee and the Board Executive Committee the valuation results were presented and it was agreed by them that no deferment would be 38
39 requested and that the catch-up contribution would be made in April, The $5.8 million annually is required until at least the next valuation as of July 1, Other Global Expenditures This category includes costs that are not specific to any one department or division. This category also includes funds held globally, where required, for salary increases and start-up and recruitment for new faculty. Until such time as the amounts are known or approved, then budgets are transferred to the specific department or division. The overall budget is not significantly different than the prior year. BUDGETS BY RESPONSIBILITY CENTRE Budget Developer s prepared expenditure budgets as defined by their functional area of responsibility. The functional departments and/or divisions are generally defined by the organization structure (e.g. Academic, Student Services and Administration). Refer to Table 1 on page 20. Budgets are developed, analyzed and variances explained by these functional areas, thus expenditures are summarized in this format. This presentation is useful as it provides expenses in a manner that is consistent with previous periods and facilitates budget control and monitoring. Academic Faculties This grouping includes Applied Health Sciences, Business, Education, Humanities, Math & Science and Social Sciences. The budget for these six faculties amount to $113,047,094 or 47.7% of total expenditures. The largest budget increases to the Faculty budgets are for salary increases, as well as approvals made during the mid-year budget process. The following summarizes the major components of the increases over : Base Budget $107,727,474 Increases Approved 779,632 New positions and complement shifts 1,364,622 Increase Salary and Benefit budgets 4,480,928 6,625,182 Target savings from base budgets (1,305,562) Base Budget $113,047,094 The Faculties have had base budget increases from known and estimated salary costs, additional faculty and staff complements and mid-year investments. These increases total $6.6 million and are partially offset by the target reductions of $1.3 million, some of which are still pending review. Overall, the net increases to the base budgets are $5,319,620 or 4.94% per cent over the approved budget. Academic Support and Student Services Academic Support includes departments such as the Vice-President, Academic and Provost, Library (including acquisitions), Office of Research Services, Graduate Studies (including Fellowship bursaries), Co-op Services and the Centre for Pedagogical. Student Services includes the Associate Vice-President, Accessibility, Student Services, Registrar, Recruitment, Financial Aid (including undergraduate bursaries and scholarships), 39
40 Student Life & Community Experience, Student Development, Health Services, Career Services, International Services, International Market Development and English as a Second Language Services (ESLS). The budget is $34,890,698 which is 14.7% of total expenditures. This includes an estimate of $900,000 for graduate fellowships and $350,000 for undergraduate bursaries. Other increases reflect known salary increases and approvals made during the mid-year budget process which would be offset, in part, by target reductions. The total increase is $1,451,605 or 4.34% over the approved budget. Executive, Administration and Facilities This category includes campus-support departments such as Facilities Management, Campus Security, Information Technology services, the offices of the President and Vice-President, Finance & Administration, Finance and Procurement Services, Human Resources, Health & Safety, Internal Auditor, Institutional Analysis, Human Rights & Equity, the University Secretariat, Alumni Relations, Vice-President Advancement, Marketing Communications, and Development and Donor Relations. Also included are student and community support partial revenue generating services such as the Centre for the Arts, Recreation and Aquatics and Athletics and Community Services (Continuing Education, Youth University, Brock One Card and Dining Services). A large portion of this category includes university-wide budgets for facilities, infrastructure, utilities, co-generation plant, interest and debt service, audit, legal, consulting costs, pension, insurance, and health and safety. The budget is $46,493,781 which is 19.6% of total expenditures. The largest increases reflect the plant operating costs for the CFHBRC building in the amount of about $1,705,000. A reduction is estimated for utility savings in the amount of $532,000 over the budget. Other increases reflect known salary increases offset, in part, by target reductions. The net increase is $1,967,884 or 4.42% over the approved budget. 40
41 ANCILLARY OPERATIONS Ancillary Operations includes the gross revenue from the Bookstore, Print Shop, Parking, and Residences & Conference Services. Ancillary Operations are expected to contribute $3,522,869 (compared to $3,460,574 for ) on a total financial activity of $30,734,574. Table 1 (on pages 19 and 20) displays the gross revenues and expenses separately. The following chart summarizes the net contributions projected for Approved Budget Revenues Expenses Net Bookstore 11,534,811 9,758,942 1,775,869 Residences 14,578,663 14,578,663 - Conference 1,575,000 1,249, ,300 Parking 3,046,100 1,624,400 1,421,700 Total $30,734,574 $27,211,705 $3,522,869 Approved Budget Revenues Expenses Net Bookstore & Print Shop 11,998,337 10,243,569 1,754,768 Residences 13,920,660 13,920, Conference 1,575,000 1,257, ,350 Parking 3,002,200 1,614,000 1,388,200 Total $30,496,197 $27,035,623 $3,460,574 The following chart provides further information on the categories of expenses and the contributions made by these ancillary operations that are not apparent from the net contribution noted above. REVENUE Bookstore Print Shop Conference Services Parking Residences External/Internal Revenue 11,534,811 1,831,000 1,575,000 3,046,100 14,578,663 EXPENDITURE Non-Salary 8,837,500 1,206, , ,900 6,715,764 Debt Service Costs - 510,000 4,431,926 Salary & Benefits 1,173, , , ,500 2,380,973 Operating Expenditures 10,010,500 1,579,442 1,249,700 1,624,400 13,528,663 CONTRIBUTIONS Operating Budget 1,524, , ,300 1,421,700 Future Debt/Capital Reserve 1,050,000 41
42 Part B Supplementary Financial Information The following section provides information on Capital Related Projects & Cash and Debt Information 42
43 CAPITAL RELATED INFORMATION Overview In February 2003, the Brock University Board of Trustees approved a new Campus Plan. It was the first significant review and updating of the campus master plan since the original plan was prepared in The Campus Plan is intended to guide the physical development of the campus for the next thirty years and involved a widely consultative process. Principles and foundations of the campus plan: 1. Provide the full range of facilities and physical infrastructure necessary to fulfill the University's academic mission. 2. Plan for all of the University's properties. 3. Build a quality environment that will be the University's legacy. 4. Pursue design excellence. 5. Pursue a highly compact campus. 6. Provide a strong social infrastructure for the University community. 7. Ensure that the campus is accessible. 8. Continue an open and on-going dialogue about the evolution of the campus. Facilities Management (Campus Planning, Design & Construction) oversees campus physical planning, design and construction activities in accordance with Brock University policies and procedures and administers the minor and major capital project programs for the University in addition to other responsibilities described below. Minor Projects include departmental requests for changes to buildings, space or the campus grounds. Examples include adding or modifying electrical outlets, plumbing, built-in cabinetry, lighting changes, remodeling classrooms, offices or labs, removing or adding walls, installing specialized equipment, or landscaping improvements such as benches/gardens. Minor projects may be centrally funded by the University administration, or may be funded by the requesting department. Major Projects include construction of new buildings, significant renovations to existing buildings, and exterior changes such as new roads, parking lots and landscaped areas. Major projects are funded centrally by the University administration and approved by the Board of Trustees prior to implementation. Capital Project Budgeting and Funding Operating Budget: Approved annually by the Board of Trustees through the operating budget are various capital-related requirements. The following summarizes the various categories of capital spending that may occur from time to time within departmental non-salary budgets: Equipment Furniture and Furnishings Library Books and Periodicals IT software/hardware acquisitions/upgrades Repairs and Renovations 43
44 The Library and IT departments have the largest equipment related budget for annual acquisition requirements. The Residence operation and Facility Management regularly manage a significant annual deferred maintenance and renovations projects within their operating budgets. The annual capital related spending from the operating department budgets vary from year to year, but in the last few years it has averaged between $2 to 2.8 million. Facility Renewal Grants: Within the operating budget is a specific purpose grant for Facility Renewal that is funded to all Colleges and Universities based on our relative share of the system. As required by MTCU, the Facility Renewal projects have to be approved by MTCU and subject to regular reporting and an external audit. One of the constraints in the 2010 provincial budget was that the Facilities Renewal Program (for deferred maintenance of academic space) would be reduced to $26 million (for both colleges and universities) from the level of $40 million. During the 2012 provincial budget, it was confirmed that the funding level would remain unchanged at $608,500. The following projects have been submitted by Facilities Management to be spent from this grant: 573 Glenridge AHU Replacement $270,000 Accessibility Audit Projects 80,000 MCC & High Voltage Equipment Replacement 75,000 Annual Controls Conversion 75,000 Classroom Modernization Program 40,000 IT Cabling Renewal 43,500 Facility Condition Audits 25,000 Total $608,500 Deferred Maintenance Projects: Facilities Management regularly prepares a deferred maintenance renewal and accessibility status report to the Capital Projects and Facilities Committee. Given the growing need for deferred maintenance and the requirement to address the shortfall, the same report has been shared with the Financial Planning & Human Resources Committee. The latest facilities condition assessment report released by the Council of Ontario Universities reported an estimated deferred maintenance backlog of $69 million for Brock. Even though significant, the credit rating agency considers this to be manageable, in comparison, to other universities. In order to continue to address deferred maintenance, the Budget Committee approved that the savings generated from all energy management and conservation projects conducted by Facilities Management would be shared 25% centrally and 75% for deferred maintenance projects. In , with a planned investment of $456,000 for these projects are expected to yield savings during that will then be redeployed to more energy projects and deferred maintenance projects. Minor Capital Projects: A number of high-priority renewal and deferred maintenance projects, funded from operating budgets (e.g. departmental, Facilities Management, Residence Operations) and Facility Renewal Funds (noted above), are expected to be completed during The following highlights the main categories and the expected level of spending for these projects: 44
45 Mechanical/HVAC $1,599,000 Electrical 925,000 Functional and Space Improvements 706,000 Site and grounds 493,000 Co-generation 300,000 Accessibility 199,000 Structural interior/exterior 128,000 Environmental 115,000 Total $ 4,465,000 Major Capital Projects Given the significant funds involved in these projects and multi-year funding, these projects are approved as separate projects by the Board of Trustees jointly through the Financial Planning & Human Resources and the Capital Projects and Facilities Committee. The following summarizes the major construction approved projects currently underway during : Cairn s Family Health and Bioscience Research Complex $111,450, St. Paul Street - school of performing arts building 39,600,000 The funding of capital projects come from various sources; global operating, departmental revenue streams or budget savings, government grants, partners and donations. As assembling funds for capital projects can often not meet the need, there is always the pressure that the operating budget will be required to meet debt servicing requirements of capital projects. Cairn s Family Health and Bioscience Research Complex (CFHBRC) This project is intended to significantly increase Brock University s inventory of research space (176,530 gross square feet), providing state-of-the-art science research laboratories, for Applied Health Sciences and Biosciences researchers. In conformance with the Campus Plan, this building has been located immediately east of the Plaza Building. Construction of the CFHBRC remains on track with completion and occupants began to move-in during May Federal Knowledge Infrastructure Funding of $38,000,000 and provincial grant of $33,500,000 provided the majority of the construction funding. Funding of $32,000,000 has been identified from various partners, donations and other external and internal funding with, about $9,000,000 still to be identified. The University established a $33 million bank facility to manage the timing of the cash flows of this funding and the interest incurred during construction of about $900,000 has been capitalized as part of this bank loan. At the time of writing, a prepayment of cash received of approximately $8,100,000 is expected to be applied to this facility during the summer of 2012 which is estimated will reduce future interest costs by about $4,580,000. The expected debt service costs during of $1,600,000 will be fully covered with cash flows from existing capital project funding, so there will be no impact to the operating budget in An updated financing strategy and option review (considering current interest rates, timing of cash flows and the 45
46 additional funding requirement) is underway and will be brought forward to the Financial Planning and Human Resources Committee in the fall Any impact to future operating budgets will be managed to minimize the annual impact to the operating and to ensure that it matches the life of the asset (e.g. 25 years) and provides flexibility for any future contributions to this building. 198 St. Paul Street - School of Performing Arts Building This project is for the University s Marilyn I. Walker School of Fine and Performing Arts and consists of the creation of modern purpose-built space in the historic Canada Hair Cloth Building located in downtown St. Catharine s and is part of the overall Academic and Cultural Arts Centre project which also includes the City s Performing Arts Centre. Preliminary engineering and design work has begun and construction is expected to get underway during and to be completed in The project will be funded from a provincial grant of $26,000,000 with the remaining to be raised from other partner and donor contributions. Bridge financing is currently secured in the event cash is required to manage timing of these contributions. Other Major Capital Projects During the other major capital projects underway include the following: Post-Cairns Moves and Renovation $2,260,000 Aquatic Center Renewal $3,100,000 Post-Cairns Moves and Renovation During May 2012, as the majority of the Cairns Family Health and Bioscience Research Complex (CFHBRC) was completed, the occupants including staff, faculty and researchers began moving into the new building. The moves result in significant amounts of vacated existing space on campus requiring renovation and alterations including preparing the labs and offices in order for it to be functional for the new occupants. This post CFHBRC work is extensive and complex and involves renovations in eight buildings comprising 43,000 square feet of offices and labs in over 220 rooms. The project has been divided into five sub projects each of which involves phasing and staging to accommodate the interdepartmental shuffles and changes to the use of space. Included in this work is the expansion and full renovation of the existing aquatic animal lab in Mackenzie Chown Complex C Block, which is one of the more complex sub projects included in this work and is scheduled to commence during the summer of 2012 and continue until September 2013 (over two fiscal years and ). The cost of this post-cfhbrc project work is estimated at $2,260,000. It is intended to utilize any funds remaining from the CFHBRC project for this purpose although it is currently projected that this work will require additional funding. At the time of writing, consideration for funding of these renovations to be supplemented from a targeted renovation budget post the St. Paul Street project moves of $3,500,000. This will leave $1,300,000 for other renovations. At this time, there is no expectation that funding will be required from the operating budget. In the event, operating funds are required, this project will be funded internally and costs recovered over the expected useful life which is estimated at least 10 years or about $220,000 annually beginning in
47 Aquatic Center Renewal As a result of the visible signs of structural deterioration and prior concerns about the facility condition, a comprehensive facility condition audit was conducted of the Aquatic Centre in 2008 and Facilities Management developed a renewal plan and identified the work as the University s top priority deferred maintenance project and has been approved in the amount of $3,124,000. Recreation Services have blocked time for the work to take place during an expanded summer 2013 pool shutdown period with the pool returning to service by the end of September The funding for this project is noted below. Major Capital Projects Internally Funded From time to time, departments or units will fund various minor capital projects and major capital projects. Typically this funding occurs from accumulated savings earmarked for this purpose (e.g. Faculty of Education building addition) or from future revenue streams that are expected to increase from the building expansion (Guernsey Courtyard Marketplace and International Building). Given the significant funds involved in these projects and multi-year funding, these projects are approved as separate projects by the Board of Trustees jointly through the Financial Planning & Human Resources and the Capital Projects and Facilities Committee. The following summarizes the major capital projects that are being funded internally through past and future operating revenue streams: Aquatic Center Renewal (to begin during ) This project will be funded with existing surplus and through internal financing of $2.78 million. The first payment will be calculated using an interest rate of 1.5%. Each year the payment amount will grow by 2.19% creating an effective interest rate of 3.5% over 20 years. This strategy will protect Brock s investment income opportunity cost from the risk associated with rising interest rates. Additionally, this strategy minimizes the initial funding required from Recreation Services, while allowing inflation and growth from aquatic programs to cover future payment increases. Guernsey Courtyard Marketplace (completed during ) This project was completed in June The funding of $4.25 million will be repaid over 10 years at an interest rate of 4.5%, with an annual payment of $538,542 sourced from revenues generated from the marketplace. Norman Road (International Building) (completed during ) This project was completed in June The building provides additional space for expansion of the Intensive English Program (IELP)/ International Services. The project was designed in phases so a potential build-out of the property may be realized. The funding of $14.86 million will be repaid over 16 years at an interest rate of 4.5%, with an annual payment of $1.04 million sourced from revenues generated from IELP. 47
48 Aquatic Centre Renewal Courtyard Marketplace International Building Project Costs Construction Costs 3,123,661 9,000,000 14,860,000 Internal Financing Chargeback 1,227,819 1,122,634 4,994,747 Total Project Costs to Department 4,351,480 10,122,634 19,854,747 Funding External Partner 0 4,500,000 0 Departmental Funds 348, ,259 3,072,240 Departmental Sources - Future 4,003,097 5,373,375 16,782,507 Total Internal Sources 4,351,480 10,122,634 19,854,747 Terms Year Loan Initiated 2012/ / /11 Internal Financing Rate 3.50% 4.50% 4.50% Term Date Paid in Full 30-Apr Apr Apr-26 CASH AND DEBT INFORMATION Cash Flow Review The following graph outlines the monthly flow of cash over the course of the past three fiscal years for the University. The University collects most of its cash in August and September when students are paying tuition and fees. The graph below highlights that the University has been improving its cash flow over the past 3 fiscal years. The year end positive change in cash during the last month of was a result of a spike in account payables. Subsequently, the first few months of fiscal year the University experienced an increase in cash outflow to reduce the liability. 48
49 Cash Forecast The following graph tracks the estimated month end operating and capital surplus balance. The hollow top red box identifies the major additional uses of cash expected as a result of construction payments for Marilyn I. Walker School of Fine and Performing Arts and monthly principal and interest payments commencing on the $33 million loan for the Cairns Family Health and Bioscience Research Complex. If alternative funding sources other than the operating fund are secured for these incremental uses of cash then the expected cash balance will trend at the top of the hollow boxes. Based on this projection, our fixed income reserve may be liquidated to maintain liquidity early spring 2013, or earlier depending on signs of improvements in the economy that may lead to increases in expected shorter-term interest rates. The University also plans to pay out the 460 St. David s Road loan when it is up for renewal in September of The remaining balance at that time will be $2.27 million. This loan will not be paid off prior to renewal as a result of the punitive early payout penalty. Terms of this loan require that the penalty be calculated as total expected interest payments up until time of renewal discounted at the current one year Federal T-bill rate. As a result of this penalty, no economic benefit exists for the University to pay this loan off early given our return on cash exceeds the discount rate. 49
50 Internal and External Debt as at 'April 30, 2012 in Thousands Long-Term Debt Interest Rate Payment Terms Earp - Residence 7.200% Lowenberger - Residence 7.200% 460 St. David's Rd 6.270% CFHBRC Building 4.690% CFHBRC Building Prime (Currently 3.0%) Debenture Payable (Bullet) 4.967% Sinking Fund Investment Required Rate of Return Debenture Bullet 4.000% Internally Financed Project Interest Rate Payment Terms Courtyard Marketplace 4.500% International Building 4.500% Date to be Paid in Full Annual Payment 4/30/2011 (Audited) Outstanding Principal 4/30/2012 (Unaudited) Outstanding Principal Monthly blended payments of principal and interest of $90,570 October ,087 10,797 10,477 Monthly blended payments of principal and interest of $71,873 October ,569 8,315 Monthly blended payments of principal and interest of $25, September ,643 2,497 Monthly payments commencing one month past June 29, Interest rate swap on 28 million of 33 million July ,904 10,000 28,000 Monthly payments commencing one month past June 29, Variable portion of 33 million July ,000 Interest Payable semi-annually $2,309,000 December ,618 93,000 93,000 Total Long-Term 9, , ,288 Date to be Paid in Full Annual Payment Investment Balance Investment Balance Payment Terms 21 annual payments of $475,000 commencing June 2007, then $1,449,662 payment in 2028, then 18 annual payments of $2,424,000 until June 2045 December (2,784) (3,724) Total Sinking Fund Investment 475 (2,784) (3,724) Date to be Paid in Full Annual Payments Outstanding Principal Outstanding Principal Annual Payment built into departments budget April ,251 3,543 Annual Payment built into departments budget April ,049 11,788 10,727 Aquatics Roof Renovation 3.500% Commencing April 2013 principal of $2,775,278. First payment of $161,648 calculated using an interest rate of 1.5%. Payment amount will grow annually by 2.19% creating an effective interest rate of 3.5% over 20 years. April Short-Term Debt Interest Rate Terms / Purpose of Facility Operating Line of Credit Prime -0.55% Operating Line of Credit Bridging Facility Prime Prime Total Internally Financed 1,748 16,039 14,270 Credit Available Annual Payments Outstanding Principal Outstanding Principal Amounts are due on demand / for financing day to day operations of the University. 10,000, Amounts are due on demand / for financing day to day operations of the University. 5,000, Due 3 years from financial close / for assisting in the construction of the CFHBRC and Marilyn Walker School of Performing Arts Buildings. 15,000, Total Short-Term Grand Total 11, , ,835 50
51 Part C Appendices I II III IV Timelines & Process Definitions and Counting Students Enrolment Charts Headcount Enrolment Tables Headcount, FFTEs, BIUs 51
52 Brock University Budget Development Timelines & Process APPENDIX I Open on-line 12/13 Budget Development to Budget Developers Dec.1, 2011 Budget schedules available to Budget Developers on Finance website Jan.9, 2012 Finance distributes Permanent Employees on Benefits (Schedule 3) to Budget Developers Deans All (except Deans) Meeting with Budget Developers to provide Budget Update and Preliminary Timelines & Guidelines Jan.19 Jan.23 Jan.25 Residence Preliminary Budget submission (re: rate setting) Jan. 26 Budget Developers submit approved Salary Schedule 3 to Finance: All (including Deans) Review current status of 2012/13 Budget Development with: Financial Planning and Human Resources Committee Senate Budget Advisory Committee Board of Trustees Budget Developers submit Schedule 7s to Facilities Management: Urgent Life Safety/ Critical Infrastructure Department/ Faculty Funded Budget Developers submit Schedule 8s to ITS (online at Urgent or requiring budget for (i.e.,accompanied by Schedule 5) Department/ Faculty funded: continuous intake (prioritized as required) Budget Developers submit Targets to Finance for meetings Budget Developers submit 11/12 Year End Projections on-line Finance compilation of Budget Developer's Targets President and VPs meetings with Budget Developers to review Requested Budgets and Targets Budget Developers submit completed Requested Budget with Targets to Finance on BUDDE (on-line budget dev) (Include Schedules 2,4(a)(b) if applicable) On-line budget development access closed to all Budget Developers Review status of Budget Development with: Financial Planning and Human Resources Committee Senate Budget Advisory Committee Board of Trustees Finance compilation and analysis of Budget Feb.1 Feb.2 Feb.7 Feb.16 Feb.10 Feb.10 Feb.10 All Year Mar.9 Mar.16 Mar.16 Mar Mar.23 Mar.30 Apr.12 Apr.17 Apr.26 Apr.30 Review "Draft" Final Budget with: Financial Planning and Human Resources Committee May 17 Senate Budget Advisory Committee May 18 Senate May 23 Formal presentation and submit Final Budget for approval to : Financial Planning and Human Resources Committee Jun 14 Board of Trustees Jun 28 Approved budgets available to Budget Developers Jun 30 Budget Developers submit Schedule 7s arising from Faculty/Dept Strat Plans to Facilities Management Budget Developers submit Schedule 8s arising from Faculty/Dept Strat Plans to IT Mid-Year Review - Budget Update and meetings with Budget Developers Commence cycle for Budget October October October October Review Mid Year Budget with: Budget Developers Senate Budget Advisory Committee Financial Planning and Human Resources Committee Board of Trustees November November November December
53 APPENDIX II Definitions and Counting Students There are essentially three major ways of measuring enrolment at a university in Ontario: 1. Headcount Enrolment: A snapshot of the number of individuals who are attending the university at a particular point in time and the response to the commonly asked question: How many students does Brock have? 2. Full-Time Equivalent (FTE) Enrolment: FTEs are used to provide enrolment expressed as the equivalence to full-time students. For undergraduate students, FTEs are calculated by dividing total course enrolments by 5 (the nominal load of a fulltime student). Graduate students are counted on the basis of their registration status such that 1 full-time graduate student equals FTE per term and 1 part-time graduate student equals FTE per term. A graduate student registers for a summer session is reported as.5 FTEs. 3. Basic Income Units (BIUs): BIUs are used in reporting enrolment to the Ontario government for funding purposes and represent a weighted enrolment measure. Thus, one FTE undergraduate student in the Arts represents 1.0 BIU if enrolled in a pass (three-year) program and 1.5 BIUs if an honours student. Certain programs have higher weights (e.g., Business is 1.5 and Education is 2.0); otherwise Year 1 students (regardless of program) have a weight of 1.0. Eligible BIUs (and FTEs) are those which are associated with programs which have been approved by the Ontario government for funding purposes. Also, certain categories of students are ineligible (international, additional qualification and coop on work term being the three largest groups).

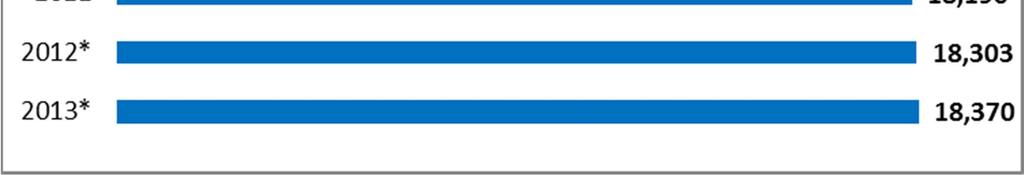


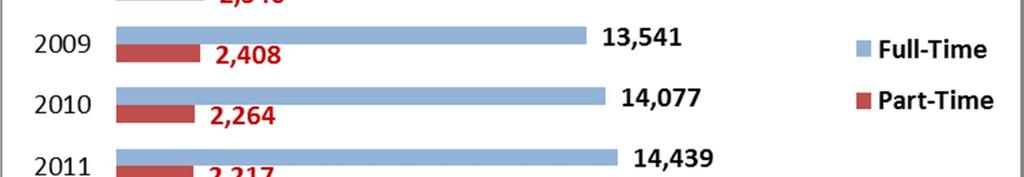
54 APPENDIX III ENROLMENT HEADCOUNTS
Strategic Budgetary Plan
 Strategic Budgetary Plan 2016 17 April 21, 2016 Table of Contents Executive Summary. Page 3 The Budget Model. Page 4 Approved 2016 17 Operating Budget. Page 5 1. Enrolment. Page 5 2. Revenue. Page 5 3.
Strategic Budgetary Plan
 Strategic Budgetary Plan 2015-16 April 22, 2015 Table of Contents Executive Summary. Page 3 The New Budget Model...Page 4 Approved 2015-16 Operating Budget...Page 5 1. Enrolment.Page 5 2. Revenue...Page
Wilfrid Laurier University. Inspiring Lives of Leadership and Purpose. 2017/18 Budget. Board Approved. June 22, 2017 Board of Governors
 Wilfrid Laurier University Inspiring Lives of Leadership and Purpose 2017/18 Budget Board Approved June 22, 2017 Board of Governors Table of Contents Part A Overview... 3 Governance Process... 3 Executive
Report to the Financial Planning, Investment and Human Resources Committee
 Board of Trustees Report to the Financial Planning, Investment and Human Resources Committee Information Item TOPIC: 2014-15 Q3 Report and Year End Forecast March 12, 2015 Brian Hutchings, Vice-President,
INDEX OF BUDGET DOCUMENTS
 Board of Governors April 30, 2010 INDEX OF BUDGET DOCUMENTS Pages 2-4 Page 5 Pages 6-10 Page 11 Pages 12-13 Page 14 Page 15 Pages 16-17 Page 18 Page 19 Introduction to the 2010-11 Operating Budget 2010-11
Revised 2011/2012 MTCU Operating Budget
 Revised 2011/2012 MTCU Operating Budget Prepared for the Finance Committee of the Board of Governors February 27, 2012 Including update to revised enrolment (fall 2011) I. Introduction: On April 20, 2011,
FY 2012 CURRENT FUNDS BUDGET
 FY 2012 CURRENT FUNDS BUDGET This page left blank intentionally. WAYNE STATE UNIVERSITY FY 2012 CURRENT FUNDS BUDGET Table of Contents I. Highlights Overview Presentation... 1 II. III. IV. Board Documents
Presentation to the Board of Governors May 30, By Matt Milovick, VP Administration & Finance
 Presentation to the Board of Governors May 30, 2014 By Matt Milovick, VP Administration & Finance Context for the FY2014/15 Budget Context for the FY2014/15 Budget Demographics AVED Funding Class Sizes
FY 2016 CURRENT FUNDS BUDGET
 FY 2016 CURRENT FUNDS BUDGET This page left blank intentionally. WAYNE STATE UNIVERSITY FY 2016 CURRENT FUNDS BUDGET Table of Contents I. Budget Highlights Overview Presentation... A-1 II. III. IV. Board
Operating Budget Fiscal
 Operating Budget Fiscal 2014 15 Index: Introduction.. Page 2 Budget Assumptions. Page 4 Budget Financials.. Page 5 Operating Revenues... Page 9 Provincial Operating Grants. Page 9 Enrolment & Tuition Page
Financial Management Guidelines and Procedures
 The financial position and future of the Colorado School of Mines is dependent on several variables including enrollment, research growth, changes in industry demand, and competing institutions at the
INDEX OF BUDGET DOCUMENTS
 Board of Governors Open Session, April 24, 2009 INDEX OF BUDGET DOCUMENTS Page 2-3 President s Introduction to the 2009-10 Operating Budget Page 4 2009-10 Operating Budget Pages 5-9 2009-10 Budget Variances
BUDGET ADVISORY COMMITTEE OPERATING BUDGET PLAN FOR REPORT LVI
 BUDGET ADVISORY COMMITTEE OPERATING BUDGET PLAN FOR 2018 19 REPORT LVI March 28, 2018 The Budget Advisory Committee (BAC) was established by the President in 1992 to advise on budgetary matters. The BAC
Transition to a New Budget Model at the University of Toronto. CAUBO June 17, 2008
 Transition to a New Budget Model at the University of Toronto CAUBO June 17, 2008 Sally Garner Senior Manager Long Range Budget Planning CAUBO 17June08 Overview U of T Facts and Figures Transition Timeline
Operating Budget
 2015 16 Operating Budget Published June 2015 Table of Contents 2015 16 Budget at a Glance... 1 Introduction... 2 Key Components of the 2015 16 Budget... 4 University Operating Budget Summary... 9 University
University of Houston-Clear Lake Appendix A - Allocation of New FY 2014 Resources
 Appendix A - Allocation of New FY 2014 Resources Revenue Changes A Reallocations/Reductions B Appropriations Bill 1 Reallocations $ (920,892) 1 General Revenue $ 1,310,875 2 Reductions (985,000) 2 State
New Mexico Highlands University Annual Operating Budget Process. approved Fall 2016
 New Mexico Highlands University Annual Operating Budget Process approved Fall 2016 Appendix I added Spring 2017 2 Table of Contents Introduction... 3 NMHU Budget Values and the NMHU Strategic Plan... 4
UNIVERSITY OF TORONTO LONG RANGE BUDGET GUIDELINES to
 UNIVERSITY OF TORONTO LONG RANGE BUDGET GUIDELINES 2007-08 to 2011-12 April 16, 2007 University of Toronto Long Range Budget Guidelines: 2007-08 to 2011-12 Table of Contents I. Fiscal Context II. III.
FY 2011 BUDGET (MAY 5, 2010)
") Approved by Chancellor Spakes May 11, 2010 FY 2011 BUDGET (MAY 5, 2010) INTRODUCTION Taking into account a constrained resource environment, the FY 2011 budget recommendation supports the mission of the
Approved by Chancellor Spakes May 11, 2010 FY 2011 BUDGET (MAY 5, 2010) INTRODUCTION Taking into account a constrained resource environment, the FY 2011 budget recommendation supports the mission of the
Joseph Trubacz Senior Vice President for Finance and Administration
 TO: FROM: Board of Trustees Joseph Trubacz Senior Vice President for Finance and Administration DATE: May 21, 2011 SUBJECT: FY 2013 Budget I. BACKGROUND INFORMATION Fiscal Year 2013 Operating Budget Summary
UH-Clear Lake Budget
 FY2016 Total Budget $ Millions Operating Budget $ 131.5 Capital Facilities 23.1 Total $ 154.6 Operating Budget Source of Funds Other Operating, $2.0M 2% Tuition & Fees $71.1M 54% Contracts & Grants *,
DEANS, VICE CHANCELLORS, UNIVERSITY LIBRARIAN, ATHLETIC DIRECTOR AND CHIEF INFORMATION OFFICER
 DEANS, VICE CHANCELLORS, UNIVERSITY LIBRARIAN, ATHLETIC DIRECTOR AND CHIEF INFORMATION OFFICER Re: Dear Colleagues, The budget planning process for 2019-20 marks a point of inflection for our financial
OPERATING BUDGET
 2018 19 OPERATING BUDGET May 10, 2018 Table of Contents 2018-19 Operating Budget at a Glance... 1 Introduction... 2 Key Components of the 2018-19 Budget... 3 Revenue... 3 Expenditures... 6 Appendices...
2016/17 CONSOLIDATED BUDGET
 2016/17 CONSOLIDATED BUDGET Approved by the Board of Governors June 9, 2016 Table of Contents EXECUTIVE SUMMARY... 1 CONTEXT... 2 Strategic Mandate Agreements and Forward with Integrity... 2 Revenue Generation
McMASTER UNIVERSITY CONSOLIDATED BUDGET
 McMASTER UNIVERSITY 2006-2007 CONSOLIDATED BUDGET Recommended by Budget Committee May 17, 2006 (Received by the Board of Governors, June 15 2006) Executive Summary McMaster University has a clearly defined
Budget Submission Calendar
 How to Submit the 2006-07 Budget University of Virginia Submissions, with prior vice presidential approval, must be received by the close of business on the dates listed. Each vice president, dean and
BUDGET ADVISORY COMMITTEE REPORT XXXVII
 BUDGET ADVISORY COMMITTEE REPORT XXXVII AN OPERATING BUDGET PLAN FOR 2008-09 May 30, 2008 The Budget Advisory Committee (BAC) was established by the President in 1992 to advise on budgetary matters. The
New Jersey Institute of Technology
 New Jersey Institute of Technology Budget Presentation to the Faculty Senate FY17 Budget Highlights FY17 Budget Status Status of Business Process Improvements Budget Development Calendar November 10, 2016
Budget Flint Campus
 2016-2017 Budget Flint Campus This page left blank intentionally. Table of Contents The University of Michigan - Flint Section One - Summary of Budgeted Revenues and Expenditures Schedule A: Summary by
Hostos Community College Budget Process
 Hostos Community College Budget Process Note: The following is largely excerpted from the 2017 MSCHE Periodic Review Report The Budget Components and Financial Planning Process The primary source of annual
Budget Preparation Manual FY
 Budget Preparation Manual FY 2018-19 Table of Contents Introduction...1 Purpose...1 Strategic Plan...1 Challenges...1 The Process...2 Initial E&G Budget Submission (BUDRPT19) and Updated Scenarios...2
UNTHSC. Annual Budget Development Process Fiscal Year 2019 Guidelines & Instructions - Spring 2018
 UNTHSC Annual Budget Development Process Fiscal Year 2019 Guidelines & Instructions - Spring 2018 INTRODUCTION: The budgeting process at the University of North Texas Health Science Center (UNTHSC) assigns
STANDARD OPERATING PROCEDURE
 Page 1 of 8 STANDARD OPERATING PROCEDURE DEPARTMENT: Business and Admin. Services TITLE: College Budget Planning PURPOSE: The College President, in consultation with the President s Executive Council (EC),
Campuswide Benefit Decentralization Implementation Process
 DRAFT--ISSUE REPORT January 18, 2012 Campuswide Benefit Decentralization 2012-13 Implementation Process TERMINOLOGY Unless otherwise stated, the term unit is intended to refer to the primary campus organizational
Financial Report of Ontario Universities Highlights. Council of Ontario Finance Officers Council of Ontario Universities
 Financial Report of Ontario Universities 2013-14 Highlights Council of Ontario Finance Officers Council of Ontario Universities APRIL 2015 Financial Report of Ontario Universities 2013-14 Highlights Prepared
The University of Winnipeg BUDGET OVERVIEW
 The University of Winnipeg BUDGET 2014-2015 - OVERVIEW December 2, 2013 The University of Winnipeg is beginning its 2014-2015 budgeting process. In an effort to encourage greater transparency, understanding
STATE FUNDING REQUESTED VS. GOVERNOR S PROPOSAL. Proposed by the Governor
 2 STATE FUNDING REQUESTED VS. GOVERNOR S PROPOSAL CSU Request $216.6M Proposed by the Governor $119.5M Funding Gap $97.1M 3 ENROLLMENT PLAN 2013/14 2014/15 2015/16 Base Surplus Total Base Surplus Total
Budget Summary Report
 Budget Summary Report 2018-2019 May 2018 1.0 Introduction An initial Budget Development Report 2018-19 document was produced and communicated to the University community in February 2018. The report is
Table of Contents. Management Discussion and Analysis. 1. Consolidated Statements - Executive Summary. 2. Statement of Operation Detail Operating Fund
 FINANCIAL REPORT TO THE BOARD OF GOVERNORS 2017-2018 2017-2018 FINANCIAL REPORT TO THE BOARD OF GOVERNORS Table of Contents Management Discussion and Analysis 1. Introduction i 2. Operating Environment
I. Background. Budget Advisory Council
 Office of the Vice President for Finance & Business Operations 330.941.1331 Fax 330.941.1380 University Budget Process Updated 1/17/18 I. Background Youngstown State University s annual operating budget
The Florida International University Budget Town Hall Discussion. March 9, 2009
 The Florida International University Budget Town Hall Discussion March 9, 2009 1 FLORIDA INTERNATIONAL UNIVERSITY AGENDA Direction What is the University s strategic direction? What are the state revenue
Fiscal Year Budget Planning & Outlook
 Fiscal Year 2016-2017 Budget Planning & Outlook David Bea Executive Vice Chancellor for Finance and Administration Spring 2016 Major Factors Impacting Budget No State Appropriations Continued Enrollment
Carry Forward of Year End Funds
 University of California, Merced Carry Forward of Year End Funds Responsible Official: Veronica Mendez, Vice Chancellor Finance and Admin Romi Kaur, Executive Director, Financial Planning & Analysis Responsible
Approved (March 27/12 UFV BOG) Budget Recommendation
 Budget Recommendation") Approved (March 27/12 UFV BOG) 2012-13 Budget Recommendation Table of Contents Executive Summary... 1 Budget Process... 2 Budget Allocation Recommendations and Fund Information... 2 General Operating Budget
Approved (March 27/12 UFV BOG) 2012-13 Budget Recommendation Table of Contents Executive Summary... 1 Budget Process... 2 Budget Allocation Recommendations and Fund Information... 2 General Operating Budget
HOLYOKE COMMUNITY COLLEGE FINANCIAL OUTLOOK FY 2016 FY 2020 DRAFT 11/12/14. Introduction
 HOLYOKE COMMUNITY COLLEGE FINANCIAL OUTLOOK FY 2016 FY 2020 DRAFT 11/12/14 Introduction Holyoke Community College s traditional mission to provide high quality, affordable educational opportunities to
Thompson Rivers University
 Thompson Rivers University Operating Budget 2010 2011 Senate Presentation April 2010 Budget Committee of Senate BCOS Regular monthly meetings Regular capital construction updates Presentations from Faculty
DRAFT August 2, Overview of OSU New Education and General (or Shared Responsibility) Budget Model Academic Colleges Focus
 Budget Model Academic Colleges Focus") Overview of OSU New Education and General (or Shared Responsibility) Budget Model Academic Colleges Focus OSU-Corvallis is implementing a new budget model with the FY18 E&G budget. The model was used to
Overview of OSU New Education and General (or Shared Responsibility) Budget Model Academic Colleges Focus OSU-Corvallis is implementing a new budget model with the FY18 E&G budget. The model was used to
LEHIGH University. Financial Planning Report With Budget
 LEHIGH University Financial Planning Report With 2012-2013 Budget L E H I G H U N I V E R S I T Y 2 0 1 2-1 3 B U D G E T ------------------------- T A B L E O F C O N T E N T S PAGE I. COMMENTARY 1-9
A New Academic Business Model for UMass Dartmouth
 Resourcing the Mission A New Academic Business Model for UMass Dartmouth Budgetary Planning Council 2016 Public Higher Ed in the 21 st C The situation The social compact has been compromised Resulting
Welcome to the Spring 2018 Budget Forum! Hosted by the President s Budget Advisory Committee
 Welcome to the Spring 2018 Budget Forum! Hosted by the President s Budget Advisory Committee Campus Budget Spring 2018 Budget Forum Sonoma State University March 13, 2018 Budget Basics About My Unit Laura
The William Paterson University of New Jersey
 The William Paterson University of New Jersey (A Component Unit of the State of New Jersey) Financial Statements and Management s Discussion and Analysis Table of Contents Page Independent Auditors Report
Dalhousie University. Operating Budget. Published June 2013
 2014 2013 Dalhousie University Operating Published June 2013 TABLE OF CONTENTS 2013-14 at a Glance... 1 Introduction... 2 Key Components of the 2013-14... 3 University Operating Summary... 7 University
Frequently Asked Questions (FAQs) about NKU s New Budget Model
 about NKU s New Budget Model") Frequently Asked Questions (FAQs) about NKU s New Budget Model Philosophy and guiding principles Why did NKU need a new budget model? Internal and external factors pointed to the need for a more flexible,
Frequently Asked Questions (FAQs) about NKU s New Budget Model Philosophy and guiding principles Why did NKU need a new budget model? Internal and external factors pointed to the need for a more flexible,
New Jersey Institute of Technology
 New Jersey Institute of Technology FY2018 Budget Development Presented to the Board of Trustees June 1, 2017 1 FY2018 Developing Operating Budget The developing FY2018 operating budget is the result of
Financial Statement Discussion and Analysis For the Year Ended June 30, 2017
 School District No. 63 (Saanich) Financial Statement Discussion and Analysis For the Year Ended June 30, 2017 School District No. 63 (Saanich) Financial Statement Discussion & Analysis For the Year Ended
Financial Operating. & Capital Plan Reviews FY Budget Forum. February 14, FY 2014 Budget Forum - February
 Financial Operating & Capital Plan Reviews FY 2014 Budget Forum February 14, 2013 FY 2014 Budget Forum - February 2013 0 University Budget Council (UBC) Bob Warren, Chair VP Administration & Finance Dennis
Management Discussion & Analysis
 Management Discussion & Analysis For the Year Ended March 31, 2016 TABLE OF CONTENTS MANAGEMENT DISCUSSION AND ANALYSIS OVERVIEW... - 1 - OPERATING ENVIRONMENT... - 1 - CHANGES IN FINANCIAL PRESENTATION...
Budget Model Refinement Discussion. October 2018
 Budget Model Refinement Discussion October 2018 1 Agenda 1. Budget Model Refinement Schedule 2. Opportunities for Refinement Significant Financial Challenges/Issues Overall Policy Issues Budget Model Formula
New Jersey Institute of Technology
 New Jersey Institute of Technology FY18 Budget Status Report and FY19 Budget Development Status Presented to the Joint Session of the Strategic Planning Steering Committee and Committee on Academic Strategic
UW-STOUT Annual Operating Budget Process
 UW-STOUT Annual Operating Budget Process An institution s budget process is shaped by institutional character; institutional size; administrative sophistication; faculty governance structures and processes;
Budget Preparation Manual FY
 Budget Preparation Manual FY 2017-18 Table of Contents Introduction...1 Purpose...1 Strategic Plan: Impact 2015 Extended to 2017...1 Challenges...1 The Process...2 Initial E&G Budget Submission (BUDRPT18)
2017/2018 BUDGET SUBMISSION TO THE UNIVERSITY OF BRITISH COLUMBIA BOARD OF GOVERNORS
 APRIL 2017 2017/2018 BUDGET SUBMISSION TO THE UNIVERSITY OF BRITISH COLUMBIA BOARD OF GOVERNORS Table of Contents 1. Executive Summary...1 2. Introduction...4 3. Budget Framework...5 4. Operating Budget...7
Wednesday, November 8, 2006
 Item: VI. AF: I-1 Wednesday, November 8, 2006 SUBJECT: FIRST QUARTER STATUS OF FLORIDA ATLANTIC UNIVERSITY S 2006 2007 OPERATING BUDGET, JULY 1 SEPTEMBER 30, 2006. PROPOSED BOARD RECOMMENDATION Information
McMASTER UNIVERSITY 2013/14 CONSOLIDATED BUDGET
 McMASTER UNIVERSITY 2013/14 CONSOLIDATED BUDGET Approved by the Board of Governors June 6, 2013 Table of Contents LIST OF TABLES...III LIST OF FIGURES...IV EXECUTIVE SUMMARY... 1 INTRODUCTION... 2 CONTEXT...
UNIVERSITY OF CALGARY. Management Discussion & Analysis
 UNIVERSITY OF CALGARY Management Discussion & Analysis For the Year Ended March 31, 2013 TABLE OF CONTENTS STATEMENT OF MANAGEMENT RESPONSIBILITY... - 1 - MANAGEMENT DISCUSSION AND ANALYSIS OVERVIEW...
For Yale Faculty, Staff, and Students only
 For Yale Faculty, Staff, and Students only Budget Book Fiscal Year 2017 Cover photo: Brandon Boyer YC 15 Analyst, Office of Financial Planning & Analysis, Yale University FY17 Operating and Capital Budget
BGSU FY P ropose ed Bu dgets
 Office of Finance & Administration June 2013 BGSU FY 20 014 P ropose ed Bu dgets BGSU FY 2014 Proposed Budgets Educational & General Budgets (Bowling Green & Firelands Campus) General Fee & Related Auxiliary
Budget Reform Update. Paul Ellinger, Associate Chancellor & Vice Provost Budget and Resource Planning
 Budget Reform Update Paul Ellinger, Associate Chancellor & Vice Provost Budget and Resource Planning February 2018 Outline Brief budget model overview Communication plan Principles Major components Timeline
TRIMESTER ONE REPORT
 TRIMESTER ONE REPORT MAY 1, 2018 TO AUGUST 31, 2018 2017-18 Trimester 2 Report TEXT TEXT 2 Executive summary This report covers the period from May 1, 2018 to August 31, 2018. This Trimester one forecast
Fiscal Year (FY13) Operating Budget and Capital Budget Overview
 Operating Budget and Capital Budget Overview") Approved by President Rush Fiscal Year 2012-2013 (FY13) Operating Budget and Capital Budget Overview Background A university budget represents the complex interchange between revenue streams that support
Approved by President Rush Fiscal Year 2012-2013 (FY13) Operating Budget and Capital Budget Overview Background A university budget represents the complex interchange between revenue streams that support
University of Houston Student Leadership Forum Budget and Legislative Processes
 University of Houston Student Leadership Forum Budget and Legislative Processes June 13, 2012 Overview of the Planning and Budget Process 2 Multiple Cycles January 2012 February 2012 March 2012 April 2012
RESPONSIBILITY CENTRED MANAGEMENT
 Page 1 of 7 RESPONSIBILITY CENTRED MANAGEMENT In 2014/15, Trent University will introduce a new approach to budget planning called Responsibility Centred Management (RCM). It aims to improve financial
Office of Finance & Administration. June BGS SU FY Pr ropo osed Budgets. Educational & General Budgets (Bowling Green & Firelands Campus)
") Office of Finance & Administration June 2012 BGS SU FY 20 13 Pr ropo osed Budgets BGSU FY 2013 Proposed Budgets Educational & General Budgets (Bowling Green & Firelands Campus) General Fee & Related Auxiliary
Office of Finance & Administration June 2012 BGS SU FY 20 13 Pr ropo osed Budgets BGSU FY 2013 Proposed Budgets Educational & General Budgets (Bowling Green & Firelands Campus) General Fee & Related Auxiliary
RCM Review. Responsibility Centered Management Review September Budget Planning & Resource Analysis
 RCM Review Responsibility Centered Management Review September 2011 Budget Planning & Resource Analysis What is RCM and RCB? RCM is Responsibility Centered Management RCB is Responsibility Centered Budgeting
Thompson Rivers University
 Thompson Rivers University Operating Budget 2011 2012 Senate Presentation April 2011 Budget Committee of Senate BCOS Regular monthly meetings Regular capital construction updates Presentations from School
Budget Summary Report
 Budget Summary Report 2016-2017 May 18, 2016 1.0 Introduction An initial Budget Development Report for 2016-17 was produced and communicated to the University community in February 2016. The report is
THE CITY UNIVERSITY OF NEW YORK. Basic Financial Statements and Supplementary Schedules and Management s Discussion and Analysis
 Basic Financial Statements and Supplementary Schedules and Management s Discussion and Analysis (With Independent Auditors Report Thereon) Table of Contents Management s Discussion and Analysis 1 Independent
Budgeting for Small Schools
 Budgeting for Small Schools College Business Management Institute July 2017 Presented by Lisa Marie McCauley, Ed.D, CPA Senior Vice President for Finance Middle States Commission on Higher Education Chief
SOUND FISCAL MANAGEMENT Self-Assessment Checklist
 SOUND FISCAL MANAGEMENT Self-Assessment Checklist for Fiscal Year Ended June 30, 2015 (Completed January 2016) 1. Deficit Spending: Is this area acceptable? Yes Is the district spending within their revenue
Budget Town Hall Meeting
 Budget Town Hall Meeting FY 2018-19 Operating Budget Proposal Chancellor Steven Angle & EVC Richard Brown Factors Impacting the FY 2019 Budget UTC #1 University in CCTA Metrics for Fourth Year in a Row!
EXECUTIVE SUMMARY. Performance Fund* 4,414,100 Total $74,448,900
 EXECUTIVE SUMMARY House Bill 200, the Executive Branch Budget, was passed by the 2018 Regular Session of the Kentucky General Assembly and provides a state expenditure plan for the 2018-20 biennium. The
BUDGETING FOR A FUNDS. Education and General Unrestricted Operating Funds
 BUDGETING FOR A FUNDS Education and General Unrestricted Operating Funds What is a budget? Why have a budget? Planning Controlling spending Identifying funding sources Good budgeting does not set priorities
This budget is the first to incorporate our university community s shared goals as expressed in our new strategic plan, Building on Excellence.
 Office of the President San Diego State University 5500 Campanile Drive San Diego, CA 92182 8000 Tel: 619 594 5201 Fax: 619 594 8894 September 30, 2014 Members of the university community: San Diego State
Functions at West Virginia University
 Functions at West Virginia University Function is used to classify the University's expenditures in multiple ways. The classifications are necessary to report the activity to the Federal government, sponsors
BUDGET ADVISORY COMMITTEE. Balancing Dalhousie s Operating Budget. Context for the Development of the Operating Budget REPORT LV
 BUDGET ADVISORY COMMITTEE Balancing Dalhousie s Operating Budget Context for the Development of the 2018 19 Operating Budget REPORT LV December 15, 2017 The Budget Advisory Committee (BAC) was established
McMASTER UNIVERSITY 2014/15 CONSOLIDATED BUDGET
 McMASTER UNIVERSITY 2014/15 CONSOLIDATED BUDGET Approved by the Board of Governors June 5, 2014 Table of Contents LIST OF TABLES... III LIST OF FIGURES... IV EXECUTIVE SUMMARY... 1 INTRODUCTION... 3 CONTEXT...
The University of Mississippi. Financial Statements. Fiscal Year 2009 Unaudited
 The University of Mississippi Financial Statements Fiscal Year 2009 Unaudited Table of Contents Management Discussion & Analysis 3 Financial Statements 13 Statement of Net Assets University of Mississippi
1 Campus Budget. 1.1 Revenues
 UCR Budget Primer prepared for Senate Committee on Planning & Budget as of September 2016 as understood by Christian Shelton with thanks to VC Maria Anguiano & former committee chair Ken Barish Abstract
UMass Lowell A Strategic Plan for the Next Decade. Committee on Financial Planning & Budget Review Organizational Meeting
 UMass Lowell 2020 A Strategic Plan for the Next Decade Committee on Financial Planning & Budget Review Organizational Meeting March 6, 2009 Agenda Summary of Committee Charge Budget Planning Context Overview
Office of the Provost University of Illinois at Urbana-Champaign. 3 February 2016
 Office of the Provost University of Illinois at Urbana-Champaign BUDGET REPORT GUIDANCE FOR FY17: CTE, DRES, I 3, KAM, KCPA, SPURLOCK, UNIVERSITY LIBRARY, LAW LIBRARY 3 February 2016 The campus finds itself
Prepared by the Office of the Treasurer
 Prepared by the Office of the Treasurer CSPP Budget Decision-Making Principles & Process The following principles, in order of importance and approved by the Board of Trustees, will guide budget decision
Report of the Senior Administration Responsibility Review Committee Response from the President s Executive Team (formerly UMC)
") Report of the Senior Administration Responsibility Review Committee Response from the President s Executive Team (formerly UMC) Title of the Vice-President Saint John Recommendation One: We recommend that
Report of the Senior Administration Responsibility Review Committee Response from the President s Executive Team (formerly UMC) Title of the Vice-President Saint John Recommendation One: We recommend that
University of California, Merced Final and Preliminary All-Funds Base Budget
 University of California, Merced 201516 Final and 201617 Preliminary AllFunds Base Budget FINAL Division of Planning and Budget Finance Group 1 WE WELCOME YOUR COMMENTS Division of Planning and Budget
ANTHONY P. JIGA Vice President Budget and Planning
 ANTHONY P. JIGA Vice President Budget and Planning 70 Washington Square South, Room 1202 New York, NY 10012 P: 212 998 2278 anthony.jiga@nyu.edu To: School, Administrative and Auxiliary Fiscal Officers
FISCAL 2019 BUDGET KICKOFF MEETING
 FISCAL 2019 BUDGET KICKOFF MEETING SCHELLER COLLEGE OF BUSINESS ROOM 314 MARCH 8, 2018 Agenda Fiscal 2019 Budget Kickoff Meeting 1. Fiscal 2018 Budget Overview 2. Year-End Closing Preparation 3. Fiscal
The William Paterson University of New Jersey
 The William Paterson University of New Jersey (A Component Unit of the State of New Jersey) Financial Statements and Management s Discussion and Analysis Table of Contents Page Independent Auditors Report
New Campus Budget Model
 New Campus Budget Model Moving to an All Funds Model May 25, 2016 Presented By: Nancy Warter-Perez Chair of the Academic Senate Peter McAllister Dean, College of Arts and Letters Lisa Chavez Vice President
FY 2019 UNIVERSITY BUDGET CALENDAR
 FY 2019 UNIVERSITY BUDGET CALENDAR FY2019 UNIVERSITY BUDGET CALENDAR PLANNING: July, 2017 Office of Budget Management distributes the following to all Vice Presidents, Provost Office, and Business Representatives
REPORT ON THE ANNUAL BUDGET
 REPORT ON THE ANNUAL BUDGET 2012-13 NOVEMBER 2012 QUEEN S UNIVERSITY KINGSTON, ONTARIO, CANADA REPORT ON THE ANNUAL BUDGET 2012-13 QUEEN S UNIVERSITY AT KINGSTON Preface This report is prepared by the
CSUF CALIFORNIA STATE UNIVERSITY, FULLERTON
 CSUF CALIFORNIA STATE UNIVERSITY, FULLERTON Budget Report Fiscal Year 2014-2015 Table of Contents I. Foreword II. University Resources a. Fiscal Year Budget 1 b. Highlights: 2014-15 Operating Fund Budget