Distribution of aggregate income in Portugal from 1995 to 2000 within a. SAM (Social Accounting Matrix) framework. Modelling the household. sector.
|
|
|
- Lisa Pitts
- 6 years ago
- Views:
Transcription
1 Distribution of aggregate income in Portugal from 1995 to 2000 within a SAM (Social Accounting Matrix) framework. Modelling the household sector. Susana Maria G. Santos Instituto Superior de Economia e Gestão Departamento de Economia Unidade de Estudos sobre a Complexidade em Economia Universidade Técnica de Lisboa Rua Miguel Lupi, 20, Lisboa, Portugal, Tel Fax: ss@iseg.utl.pt. (September 2004)
2 Abstract Aggregated Social Accounting Matrices (SAMs) will be constructed for the Portuguese economy from 1995 to 2000, based on the country s national accounts statistics. The economic flows associated with households, enterprises, government and other institutions will be analysed, as well as their evolution, whilst accounting multipliers will be calculated to facilitate the study of the effects resulting from changes in household income. Therefore, SAMs are modelled and structural path analysis will be used for the decomposition of the calculated multipliers. At the end, the general guidelines will be established for following the study of income distribution and poverty in Portugal. Key Words: Social Accounting Matrix; Income distribution. JEL Classification: D57; H31; O52
3 CONTENTS 1. Introduction The Portuguese SAM Structure and the importance of the household sector The SAM Modelling 3.1. Methodology Evaluation with changes in household income Concluding remarks...19 References Appendixes SAMs ( ) Description of the SAM cell contents Figure 1A: Accounting multipliers and additional extragroup and intergroup components from 1995 to
4 1. INTRODUCTION The Social Accounting Matrix, usually known as SAM, is the working instrument used in this paper 1 to study the effects on the economy of changes in the income of Portuguese households from 1995 to Compiled from the Portuguese System of National Accounts (SNA), the SAMs constructed for the Portuguese economy from 1995 to 2000 can be seen as its matrix representation, showing the entire circular flow of income. As will be seen in section 2, the SAM is a square matrix in which the entries made in rows specify incomes or receipts, whilst the entries made in columns specify outlays or expenditures. Its design was established with the intention of emphasising the household institutional sector and, in its treatment, attention was centred on analysing the households expenditures and receipts. Section 3 shows that the SAM can be understood as a general equilibrium data system, the modelling of which will help to quantify and analyse the effects of exogenous shocks or changes introduced into the households receipts. At the same time, the whole network through which some influences or effects of exogenous shocks are transmitted will be identified and partly specified through the use of structural path analysis. This analytical technique was introduced into a SAM framework by Defourny and Thorbecke (1984), being used to analyse intersectoral linkages between the individual accounts of the SAM by means of the paths along which effects travel. The technique is seen as an alternative to the so-called traditional decomposition of multipliers, defined by Stone (1985) and Pyatt and Round (1985), which is also used here. Section 4 ends the article with some concluding remarks. 2. THE PORTUGUESE SAM STRUCTURE AND THE IMPORTANCE OF THE HOUSEHOLD SECTOR Based on the works of Graham Pyatt and his associates (Pyatt, 1988, 1991a; Pyatt and Roe, 1977; Pyatt and Round, 1985) and on the author s own previous experience (Santos, 1999, 1 Based on the author s papers presented to the Economic Policies in the New Millennium Conference, the Department of Economics Seminar and the Input-Output and General Equilibrium: Data, Modelling and Policy analysis Conference, which were held respectively at the University of Coimbra on 16 April 2004, at the Higher Institute of Economics and Business Administration (Lisbon) on 6 July 2004 and at the Free University of Brussels on 2-4 September
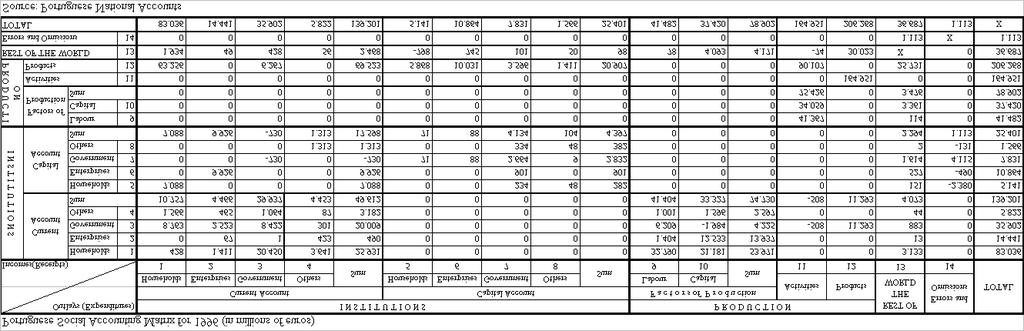
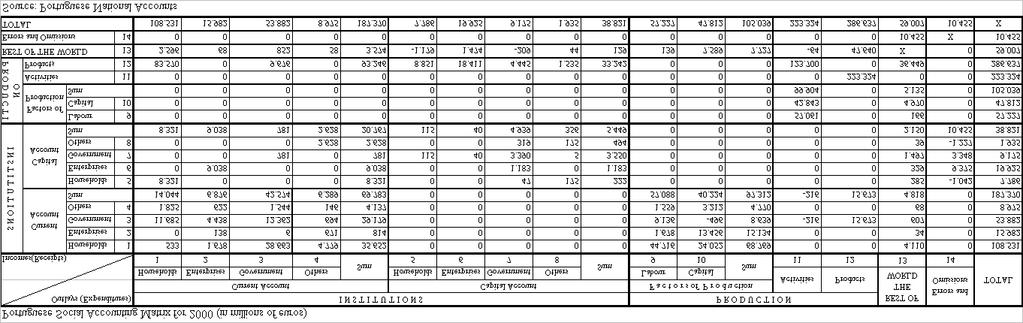
5 2001, 2003a, 2003b), the constructed SAMs (see the Appendixes), compiled from the Portuguese System of National Accounts, have the basic structure that is shown in Table 1. Table 1. Basic Portuguese SAM Outlay (expenditure) Incomes (receipts) Institutions Production Current Account Capital Account Rest of the World Errors and Omissions Current Account Institutions Capital Account Production Factors Activities Products Rest of the World (RW) Errors and Omissions (1, 4) (5, 8) (9, 10) (11) (12) (13) (14) Total CT 0 NP nta ntp CT rw 0 Inc DS KT KT rw nl/b I Factors AV 0 CF rw 0 CF Activities P 0 0 P Products FC GCF 0 IC 0 EX 0 D CT rw KT rw CF rw nta rw IM 0 TV rw tm nl/b nl/b Total Inc I CF TC S TV rw nl/b Note: account numbers are shown in brackets Key: AV = (gross) added value 2 KT = capital transfers CF = compensation of factors nl/b = net lending/borrowing 3 CT = current transfers NP = national product 4 D = aggregate demand nta = other net taxes on production DS = (gross) domestic saving ntp = net taxes on products EX = exports P = production value 2 In accordance with the SNA s production account, this is equal to GDP at market prices minus net indirect taxes (on products and production) (Santos 2003a, pp ). 3 This has the opposite mathematical sign to the net lending/borrowing of the SNA s capital account, which considers capital transfers as uses of that capital (Santos 2003a, pp ). 4 In accordance with the SNA s primary distribution of income accounts, this is equal to gross national income minus taxes on production and imports received by national institutions, net of subsidies paid by national institutions (Santos 2003a, pp )
6 FC = final consumption GCF = gross capital formation I = aggregate investment / investment funds IC = intermediate consumption IM = imports Inc = aggregate income 5 S = aggregate supply TC = total costs tm = trade margins TV = transactions value rw = to the rest of the world rw = from the rest of the world Because the National Accounts were the information source from which the SAMs were constructed, almost all their (non-financial 6 ) flows are included in them. The European System of National and Regional Accounts in the European Community of ESA 95, which is based on the 1993 version of the United Nations System of National Accounts - SNA 93, made it possible, in a more direct way than before (SNA 68), to construct aggregated SAMs that are in perfect harmony with this. Centring our attention on institutions, it is possible in Figure 1 to see how the incomes (receipts) and the outlays (expenditures) were distributed among Portuguese institutions between 1995 and From this same figure, it is also clear that the households lead other institutions in terms of total and current incomes and outlays, although their relative importance in terms of capital incomes and outlays is much less important, as is also shown by Table 2. Therefore, aggregate household income was more than half of total aggregate income, although its relative importance decreased, especially from 1995 to On the other hand, aggregate household investment/investment funds was less than a quarter of the total and its relative importance also decreased, especially from 1995 to These decreases would only have been relative if the average growth rates had not been as shown in Table 3. 5 In accordance with the SNA s secondary distribution of income accounts, the redistribution of income in kind and the use of disposable income accounts, this is equal to gross national income plus current transfers within national institutions and current transfers from the rest of the world. Or, alternatively, it is equal to gross disposable income plus current transfers within national institutions and current transfers to the rest of the world (Santos 2003a, pp ). 6 In a previous work (Santos, 1999), financial flows, reflecting financial activities in capital accounts (King 1981), were also included. When SAMs began to be constructed with data from the European System of National and Regional Accounts in the European Community of 1995 (ESA 95), this proved to be impossible due to a lack of available information
7 Table 2. Evolution of the relative importance of household current and capital income/expenditure (A)/(B) (C)/(D) % 20.7% % 20.2% % 20.7% % 19.4% % 19.7% % 20.1% Source: Portuguese SAMs (Appendixes) Key: (A) Aggregate household income (current receipts/expenditure of households) (B) Total aggregate income (total current receipts/expenditure) (C) Aggregate household investment funds/investment (capital receipts/expenditure of households) (D) Total aggregate investment/investment funds (total current receipts/expenditure) Table 3. Average growth rates (between 1995 and 2000) of total and household receipts and expenditure Aggregate household income (current receipts/expenditure of households) 6.7% Total aggregate income (total current receipts/expenditure) 7.8% Aggregate household investment funds/investment (capital receipts/expenditure of households) 8.9% Total aggregate investment/investment funds (total current receipts/expenditure) 9.6% Source: Portuguese SAMs (Appendixes) As a matter of fact, the total amounts (of aggregate income and aggregate investment/investment funds) grew at a higher rate than the household amounts
8 Figure 1. Distribution of incomes (receipts) and outlays (expenditures) among Portuguese Institutions from 1995 to ,0% 60,0% 50,0% 40,0% 30,0% 20,0% 10,0% 0,0% Current Receipts (compensation of factors + net indirect taxes + current transfers, within the economy and from the rest of the world = aggregate income) 70,0% 60,0% 50,0% 40,0% 30,0% 20,0% 10,0% 0,0% Capital Receipts (capital transfers, within the economy and from the rest of the world = investment funds - saving - net lending/borrowing) 70,0% 60,0% 50,0% 40,0% 30,0% 20,0% 10,0% 0,0% Total Receipts 70,0% 60,0% 50,0% 40,0% 30,0% 20,0% Current Expenditure (final consumption + current transfers, within the economy and to the rest of the world = aggregate income - saving) 60,0% 50,0% 40,0% 30,0% 20,0% Capital Expenditure (gross capital formation + capital transfers, within the economy and to the rest of the world = investment) 60,0% 50,0% 40,0% 30,0% 20,0% 10,0% Total Expenditure 10,0% 0,0% 10,0% 0,0% 0,0% Households Enterprises Government Others Source: Portuguese SAMs (Appendixes) - 5 -
9 The position of Portuguese institutions in terms of the balance between receipts and expenditure can be seen in Figure 2, where households show a positive current balance, i.e. saving, although the capital balance is negative, as it is for all other institutions. The total balance of households was always positive, except in 1999, although its value has shown a significant decrease. We can therefore say that, generally speaking, Portuguese households have tended to enjoy financing ability although this ability has begun to decrease. This may be an aspect to explore in any attempt made to reduce the observed increase in the net borrowing of the Portuguese economy, shown by the last (total) column for each year in the bottom graph, whose approximate share in the GDP 7 was: 0% in 1995; 1.3% in 1996; 3% in 1997; 4.5% in 1998; 6.1% in 1999 and 9.1% in Approximate GDP (in millions of euros) = Added value + other net taxes on production + net taxes on products (does not include net taxes on products that are receipts from European Union institutions, which are included in imports) = 86,211 in 1996; 92,857 in 1997; 100,815 in 1998; 107,901 in 1999 and 115,361 in
10 Figure 2. Balances between receipts and expenditures of the Portuguese economy and its institutions, between 1995 and 2000 Current Balance (saving) (millions of euros Capital Balance (millions of euros) Total Balance [net lending (+) / borrowing (-)] (millions of euros) Households Enterprises Government Others Total Source: Portuguese SAMs (Appendixes) - 7 -
11 As the beginning of an ambitious project for studying income distribution and poverty in Portugal, we will study the effects on aggregate household income and aggregate investment/investment funds resulting from changes in their current and capital receipts. The SAM will be modelled in keeping with this aim, for the six years of our series. 3. THE SAM MODELLING 3.1. Methodology In keeping with the work of G. Pyatt and A. Roe (1977), G. Pyatt and J. Round (1985) and J. Defourny and E. Thorbecke (1984), the base methodology of the multipliers and their decomposition will be used, considering the current and capital accounts of households, as well as the production accounts, as endogenous. Table 4. SAM in endogenous and exogenous accounts Expenditures Endogenous Sum Exogenous Sum Total Receipts Endogenous N n X x y n Exogenous L l R r y x Total y n y x Key: - Endogenous accounts in the Portuguese SAMs, see the Appendixes (number of the accounts in brackets): current and capital accounts of households (1 and 5); factors of production (9 and 10); activities (11) and products (12). - Exogenous accounts in the Portuguese SAMs: current and capital accounts of enterprises or non-financial corporations (2 and 6), government (3 and 7), and other institutions or financial corporations and non-profit institutions serving households (4 and 8); the rest of the world (13); and errors and omissions (14)
12 - L = leakages from endogenous into exogenous accounts - X = injections from exogenous into endogenous accounts From Table 4, it can be written that y n = n + x (1) y x = l + r (2) The amount that the endogenous accounts receive is equal to the amount that they spend. In other words, in aggregate terms, total injections from the exogenous into the endogenous accounts, i.e. the column sum of x, are equal to total leakages from the endogenous into the exogenous accounts, i.e. considering i to be the unitary vector (row), the column sum of 1 is: x * i = l * i. (3) a) Deduction of the accounting multipliers In the structure of Table 4, if the entries in the N matrix are divided by the corresponding total expenditures, a corresponding matrix (squared) can be defined of the average expenditure propensities of the endogenous accounts within the endogenous accounts or of the use of resources within those same accounts. Calling this matrix A n, it can be written that -1 A n = N * ŷ n (4) N = A n* ŷ n (5) Considering equation (1), y n = A n* y n + x (6) Therefore, y n = (I-A n ) -1 * x = M a * x. (7) We thus have the equation that gives the total receipts of the endogenous accounts (y n ), by multiplying the injections x by the matrix of the accounting multipliers: M a = (I-A n ) -1. (8) On the other hand, if the entries in the L matrix are divided by the corresponding total expenditures, a corresponding matrix (non squared) can be defined of the average expenditure propensities of the endogenous accounts within the exogenous accounts or of the use of resources from the endogenous accounts within the exogenous accounts. Calling this matrix A l, it can be written that -1 A l = L * ŷ n (9) L = A l* ŷ n (10) Considering equation (2), y x = A l* y n + r (11) - 9 -
13 Thus, l = A l * y n = A l * (I-A n ) -1 * x = A l * M a * x. (12) So, with the accounting multipliers, the impact of changes in receipts is analysed at the moment, assuming that the structure of expenditure in the economy does not change. This type of methodology allows for a static analysis to be made, assuming also that there is excess capacity, prices remain constant and the production technology and resource endowment are given. To have an idea about the level of veracity of the calculated accounting multipliers, a test was carried out in accordance with such a methodology, for the beginning of our series. In order to do this, accounting multipliers were first calculated from the Portuguese SAM for 1995, whilst the changes that really occurred from 1995 to 1996 were also considered, i.e. the x vector of the Portuguese SAM for 1996, and the new vector of receipts of the endogenous accounts (y n ) was calculated. From this, and with the aid of the matrices of average expenditure propensities (A n and A l ) for 1995, the endogenous part of the SAM was recalculated for 1996, where the value of aggregate household income showed a percentage difference in relation to the real SAM values of 1.12%, whilst the difference in investment/investment funds was 29.62%. The corresponding percentage difference, i.e. the difference between the calculated and the real total values, was 1.12% for account 9 (labour), 2.20% for account 10 (capital), 1.54% for account 11 (activities), and 1.53% for account 12 (products). In previous studies (Santos, 1999, 2003b), lower differences were obtained, probably due to a higher level of disaggregation of the SAM accounts. Taking into account these results and the assumptions referred to before, we will analyse our results in an indicative fashion. b) Decomposition of the accounting multipliers Accounting multipliers can be decomposed if we consider the A n matrix and two other ones with the same size (B n - with the diagonal of A n, whilst all the other elements are null - and C n - with a null diagonal, but with all the other elements of A n ). In this way, it can be written that A n = B n + C n. (13) Thus, from equation (6):
14 y n = B n * y n + C n * y n + x = [I (I - B n ) -1 * C n ] -1 * (I - B n ) -1 * x. 8 (14) Therefore: M a = [I (I - B n ) -1 * C n ] -1 * (I - B n ) -1 = M 3 *M 2 *M 1. (15) The accounting multiplier matrix is thus decomposed into multiplicative components, each of which relates to a particular kind of connection in the system as a whole (Stone, 1985) 9. - The intragroup or direct effects matrix, which represents the effects of the initial exogenous injection within the groups of accounts into which it had originally entered, i.e.: M 1 = (I - B n ) -1. (16) - The intergroup or indirect effects matrix, which represents the effects of the exogenous injection into the groups of accounts, after its repercussions have completed a tour through all the groups and returned to the one which they had originally entered. In other words, if we consider t to be the number of groups of accounts (five in the present study): M 2 = {I - [(I - B n ) -1 * C n ] t } -1. (17) - The extragroup or cross effects matrix, which represents the effects of the exogenous injection, when it has completed a tour outside its original group without returning to it, or, in other words, when it has moved around the whole system and ended up in one of the other groups. Thus, if we consider t to be the number of groups of accounts: M 3 = {I + [(I - B n ) -1 * C n ] + [(I - B n ) -1 * C n ] [(I - B n ) -1 * C n ] t-1 } (18) The decomposition of the accounting multiplier matrix can also be undertaken in an additive form, as follows: M a = I + (M 1 - I) + (M 2 - I) * M 1 + (M 3 - I) * M 2 * M 1. (19) Where I represents the initial injection and the remaining components the additional effects associated, respectively, with the three components described above (M 1, M 2 and M 3 ). Defourny and Thorbecke (1984) introduced an alternative to the above decomposition, namely structural path analysis, which makes it possible to identify and quantify the links between the pole (account) of origin and the pole (account) of destination of the impulses resulting from injections. According to this technique, the accounting multiplier is considered 8 yn = A n* y n + x = B n* y n + C n* y n + x y n - B n* y n = C n* y n + x y n = (I-B n ) -1 * C n * y n + (I-B n ) -1 *x y n - (I-B n ) -1 * C n * y n = (I-B n ) -1 *x [I - (I-B n ) -1 * C n ] * y n = (I-B n ) -1 * x y n = [I - (I-B n ) -1 * C n ] -1 * (I-B n ) -1 * x. 9 For a detailed deduction and explanation of these components, see, for example, Stone (1985, pp ); Pyatt and Round (1985, pp ); Santos (1999, pp )
15 as a global influence, which is decomposed into a series of total influences. These, in turn, are decomposed into direct influences multiplied by the path multiplier : ma ji G = I (i j) = n n T D I ( ) = I ( i j) * Mp i j p= 1 p p= 1 p (20) Where: ma ji is the (j,i) th element of the M a (accounting multipliers) matrix, which quantifies the full effect of a unitary injection x j on the endogenous variable y j ; I G (i j) is the Global Influence of pole i on pole j; p is the n th elementary path - the arc linking two different poles, oriented in the direction of the expenditure, located between i and j, with i being the pole of origin of the elementary path 1 (the first) and j the pole of destination of the elementary path n (the last); I T (i j) is the Total Influence transmitted from i to j along the elementary path p; p D I (i j) p is the Direct Influence of i on j transmitted along the elementary path p, which measures the magnitude of the influence transmitted between its two poles through the average expenditure propensity; Mp is the Multiplier of the path p, or the path Multiplier, which expresses the extent to which the influence along elementary path p is amplified through the effects of adjacent feedback circuits 10 : Mp = p (21) where: = the determinant of matrix I-A n of the structure represented by the SAM, p = the determinant of the submatrix of I-A n obtained by removing the row and the column associated with the poles of the elementary path p. 10 A circuit is a path for which the first pole (pole of origin) coincides with the last pole (pole of destination) (Defourny and Thorbecke, 1984, p. 119)
16 3.2. Evaluation with changes in household income a) Effects of changes in household current income In keeping with what was seen before, the items that can be changed in household current receipts (the items in row 1 of the X matrix, presented in Table 4 or cells (1,2), (1,3), (1,4) and (1,13), of the SAMs (in the Appendixes, see also the description of the cell contents) are: 1. social benefits other than social transfers in kind from non-financial corporations, government, financial corporations, non-profit institutions serving households and the rest of the world; 2. social transfers in kind from government and non-profit institutions serving households; 3. non-life insurance claims from financial corporations and the rest of the world; 4. miscellaneous current transfers from non-financial corporations, government and the rest of the world; Average expenditure propensities show that households spent a unit of their current receipts as follows (column 1 of A n and A l matrices): - Current transfers within households, to government, other institutions and the rest of the world Gross savings Final consumption Therefore, three quarters or more of a unit of household current receipts go towards final consumption. Its relative share increased from 1995 to 1999, recording a slight decrease in 2000, but nonetheless always changing by the same amount as the decrease (increase in 2000) in gross savings. The current transfers, within households, to government, other institutions and the rest of the world, remained unaltered in the expenditure structure of Portuguese households in the period studied. These values can be understood as reflecting the direct influence of a unitary change in the (above-described) household current receipts, whereas the global influence is quantified by the values of the accounting multipliers and their components, as shown in Tables 5, 6 and
17 Table 5: Global influences of unitary changes in the exogenous current receipts of households Aggregate income of households Aggregate investment /investment funds of households Compensation of labour Compensation of capital Production value/total costs ,999 1,907 1,863 1, Aggregate demand/supply Source: Portuguese accounting multiplier matrices (M a ) from 1995 to Apart from the effect on the aggregate income of households, where 1 is the initial injection of income, the greatest effects of unitary changes in the current receipts of households were felt on production values and aggregate demand, reflecting the great importance of final consumption for the total current outlays of households, as noted earlier. On the other hand, the predominance of additional extragroup influences, shown by Table 6, means that most of the repercussions originating from the current account of households (1) do not return to it, with the additional intergroup influences, shown by Table 7, representing those repercussions that do in fact return. Additional intragroup effects were felt only at the level of the aggregate income of households, with a constant value of In turn, the positive values of all these influences represent changes that have the same mathematical sign as the initial change for instance, increases in the exogenous current receipts of households will result in increases in the items presented in the rows of Tables 5, 6 or 7. Table 6: Additional extragroup influences of unitary changes in the exogenous current receipts of households Aggregate income of households Aggregate investment /investment funds of households Compensation of labour Compensation of capital Production value/total costs Aggregate demand/supply Source: Additional extragroup effects matrices ((M 3 -I)*M 2 *M 1 ) from 1995 to
18 Table 7: Additional intergroup influences of unitary changes in the exogenous current receipts of households Aggregate income of households Aggregate investment /investment funds of households Compensation of labour Compensation of capital Production value/total costs Aggregate demand/supply Source: Additional intergroup effects matrices ((M 2 -I)*M 1 ) from 1995 to The general decrease in the global influence (and its components) from 1995 to 2000, sometimes with a slight increase in 2000, is in keeping with what was seen in Tables 2 (see also the three left hand graphs of Figure 1A, in the Appendix), namely the decrease in the relative share of aggregate household income in total aggregate income. b) Effects of changes in household capital income The items that can be changed in household capital income (the items in row 5 of the X matrix, presented in Table 4, or cells (5,7), (5,8), (5,13) and (5,14), of the SAMs) are: 1. investment grants from government and the rest of the world; 2. (other) capital transfers from financial corporations and the rest of the world; 3. net lending. As was seen before, average expenditure propensities show that households spent a unit of their (now) capital receipts as follows (column 5 of A n and A l matrices): - Gross Capital Formation Capital taxes and (other) capital transfers to 0.01 government Acquisitions minus disposals of non-produced non-financial assets and (other) capital transfers to the rest of the world
19 The predominance of gross capital formation is evident, with a slight fluctuation from 1995 to Once again, the direct influence of a unitary change in the (now capital) receipts of households was most noted in the products account (12). Table 8 shows the global influences of a similar change. Table 8: Global influences of unitary changes in the exogenous capital receipts of households Aggregate income of households Aggregate investment /investment funds of households Compensation of labour Compensation of capital Production value/total costs Aggregate demand/supply Source: Portuguese accounting multiplier matrices (M a ) from 1995 to Therefore, apart from the effect on the investment funds/aggregate investment of households, where 1 is the initial injection of income, the greatest effects of unitary changes in the capital receipts of households were felt in production values and aggregate demand, just as in the case of current receipts, but now with higher values, reflecting the large share of gross capital formation in the total capital outlays of households. Table 9: Additional extragroup influences of unitary changes in the exogenous capital receipts of households Aggregate income of households Aggregate investment /investment funds of households Compensation of labour Compensation of capital Production value/total costs Aggregate demand/supply Source: Additional extragroup effects matrices ((M 3 -I)*M 2 *M 1 ) from 1995 to
20 Table 10: Additional intergroup influences of unitary changes in the exogenous capital receipts of households Aggregate income of households Aggregate investment /investment funds of households Compensation of labour Compensation of capital Production value/total costs Aggregate demand/supply ,521 Source: Additional intergroup effects matrices ((M 2 -I)*M 1 ) from 1995 to Once again, we have positive values for all the additional influences and a predominance of extragroup influences, as can be seen in Tables 9 and 10, meaning that most of the repercussions originating from the capital account of households (5) do not return to it. As was seen in the case of changes in household current income, and also in the case of household capital income, there is a general decrease in the global influence (and its components) from 1995 to 2000, sometimes with a slight increase in see also the three right hand graphs of Figure 1A, in the Appendix. c) Network of linkages between endogenous accounts Figure 3 helps us to understand the importance of the additional extragroup influences of changes taking place in the current or capital accounts of households (Tables 6 and 9), as well as the values of the global influences (Tables 5 and 8) of changes in the current and capital receipts of households on production accounts (9-12). Considering the importance of final consumption for households, the cells (12,1) of the accounting multiplier matrices (M a ) were decomposed, from 1995 to 2000, through structural path analysis, in keeping with equation (20). Table 11 shows the results of this analysis
21 Figure 3. Network of elementary paths and adjacent circuits linking endogenous accounts 0,005 (0,005) Current A. Households (1) 0,101 (0,077) 1,130 Capital A. (1,137) Households (5) 0,788 (0,781) 0,595 (0,503) 0,794 (0,770) Factors of Prod. Labour (9) Factors of Prod. Capital (10) Products (12) 0,250 (0,256) 0,208 (0,192) 0,779 (0,779) 0,545 (0,554) Activities (11) Note: This outline represents only the paths whose poles of origin and destination are the endogenous accounts of our model. Source: A n (average expenditure propensity) matrices, calculated from the Portuguese SAMs for 1995 and 2000 (values in brackets) Table 11: Structural path analysis of the global influences on aggregate demand of unitary changes in the exogenous current receipts of households Accounting Multiplier T I (1 12) T I (1 12) D I (1 12) D I (1 12) Mp Source: Portuguese accounting multiplier matrices (M a ) from 1995 to
22 As can be seen from Figure 3, path 1, represented by the arc above, links account 1 to account 12 through account 5, while path 2 makes the same link, but in this case directly. The total influence of the first is significantly lower than that of the second, whilst the high values of the path multipliers show that the most important influences are those of adjacent feedback circuits, a feature that is in keeping with what was noted in relation to the amounts of the additional extragroup and intergroup influences. A general decrease can be noted here in all the influences from 1995 to 2000, sometimes with a slight increase in Positive values can also be noted. 4. CONCLUDING REMARKS The SAM approach has shown itself to be a practical working instrument of considerable value as an accounting framework that includes all non-financial transactions within the economy and thereby provides a quantitative basis for analysis. It was possible to see that Portuguese aggregate household income amounted to more than half of the total aggregate income of Portugal and that the relative share of the former in the latter decreased from 1995 to 2000, with the average growth rates in that period being lower for household current and capital income than for the total. Changes in social benefits and transfers, non-life insurance claims and miscellaneous current transfers (current incomes), received by households, mostly affected aggregate demand through final consumption and the production value in direct and global terms. Almost the same effect was produced by changes in investment grants and (other) capital transfers (capital incomes), but this time through gross capital formation. In the case of such impacts, additional extragroup effects predominated, meaning that most of the repercussions of those changes do not return to the account where they were originally felt, and that the additional intergroup effects represent those repercussions that do return (additional intragroup effects were not felt). This fact was confirmed by the high values of the calculated path multipliers for the impact of a unitary change in households current receipts (account 1) on the products account (12). In all the experiments carried out with the built model, the effects had the same mathematical sign as the initial change and their amounts were, generally speaking, less
23 important in 2000 than in 1995 but revealing a stable tendency (shown by the various tables and graphs presented). Therefore, the SAM-based study that was carried out has made it possible to describe some structural features of the Portuguese economy from 1995 to 2000 with an emphasis on households. Through its modelling with the use of accounting multipliers, it was possible to set limits for the quantitative impact (i.e. the limits within which the impact could be noted) of various types of interventions relating to household income on the economy as a whole, with their importance for production accounts and the stability of these limits being evident. Despite its limiting assumptions, the SAM can be understood as a useful working instrument for improving our basic knowledge of all socio-economic mechanisms, as well as for constructing short-term scenarios involving changes in certain flows that it represents. Besides the test on the veracity of the results, undertaken in this study, many others could be undertaken, involving other years, to confirm the usefulness of the SAM. Other studies could also be undertaken, changing, for instance, the position of the dividing line between endogenous and exogenous accounts (using the words of Stone, 1981) or the expenditure structure. We hope that the present study has been a good starting point for a study that we plan to carry out into income distribution and poverty in Portugal, using the SAM 11. The next stage will be the disaggregation of the household sector, identifying the poor, and research into other modelling methodologies (based on SAMs), with less limiting assumptions. 11 The set of articles about the special issue Accounting for poverty and income distribution analysis, published in June 2003 in Vol. 15(2) of Economic Systems Research, and, in a more indirect way, the book by Duchin, F. (1998) Structural Economics: Measuring Changes in Technologies, Lifestyles, and the Environment (New York, Oxford University Press) have been useful guides
24 REFERENCES Defourny, J. and Thorbecke, E. (1984) Structural Path Analysis and Multiplier Decomposition within a Social Accounting Matrix Framework. The Economic Journal, 94, Khan, H. A. and Thorbecke, E. (1989) Macroeconomic Effects of Technology Choice: Multiplier and Structural Path Analysis within a SAM Framework. Journal of Policy Modeling, 11, Khan, H. A. (1997) Technology systems and technological dualism in a Social Accounting Framework. In H. A. Khan, Technology, Energy and Development: The South Korean Transition (pp ). Cheltenham, U.K. and Lyme, U.S.: E. Elgar. King, B. (1981) What is a SAM? A Layman's Guide to Social Accounting Matrices, World Bank Staff Working Paper No USA, The World Bank. Pyatt, G. (1988) A SAM Approach to Modeling. Journal of Policy Modeling, 10, Pyatt, G. (1991a) Fundamentals of Social Accounting. Economic Systems Research, 3, Pyatt, G. (1991b) SAMs, the SNA and National Accounting Capabilities, Review of Income and Wealth, 37, Pyatt, G. and Roe, A. (1977) Social Accounting for Development Planning with special reference to Sri Lanka. Cambridge: Cambridge University Press. Pyatt, G. and Round, J. (1985) Accounting and Fixed Price Multipliers in a Social Accounting Matrix Framework. In Pyatt, G. and Round J. (coord.) Social Accounting Matrices. A Basis for Planning (pp ). Washington, US: The World Bank. Also in Economic Journal 89 (356), 1979 (pp ). Pyatt, G. and Thorbecke, E. (1976) Planning Techniques for a Better Future. Geneva: International Labor Office. Round, J. (2003) Constructing SAMs for Development Policy Analysis: Lessons Learned and Challenges Ahead. Economic Systems Research, 15, Santos, S. (1999) The Social Accounting Matrix as a working instrument for defining economic policy. Its application to Portugal during the period , with emphasis on the agroindustrial sector (only available in Portuguese). Higher Institute of Economics and Business Administration, Ph.D. Dissertation, Lisbon. Santos, S. (2001) The importance of the Social Accounting Matrix. Its application to Portugal during the period Higher Institute of Economics and Business Administration, Department of Economics Seminar, Lisbon
25 Santos, S. (2003a) Quantitative analysis of the economic flows between Portugal and the other European Union Member States and Institutions in Higher Institute of Economics and Business Administration, Centre of Research on European and International Economics, Working Paper No. 2/03, Lisbon. Santos, S. (2003b) Social Accounting Matrices for Portugal in Modelling the effects of changes in government receipts and expenditure, Higher Institute of Economics and Business Administration, Working Paper No. 07/2003/Department of Economics/Research Unit on Complexity in Economics, Lisbon. Stone, R. (1985) The Disaggregation of the Household Sector in the National Accounts. In Pyatt, G. and Round J. (coord.) Social Accounting Matrices. A Basis for Planning (pp ). Washington, US: The World Bank. Thorbecke, E. (1985) The Social Accounting Matrix and Consistency-Type Planning Models. In Pyatt, G. and Round J. (coord.) Social Accounting Matrices. A Basis for Planning (pp ). Washington, US: The World Bank. Thorbecke, E. (2001) The Social Accounting Matrix: Deterministic or Stochastic Concept? Institute of Social Studies, Conference in Honour of Graham Pyatt s retirement, The Hague, Netherlands
26 APPENDIXES
27 - 24 -
28 - 25 -
29 - 26 -
30 - 27 -
31 - 28 -
32 Description of the SAM cell contents Row Col. Contents 1 1 Social benefits other than social transfers in kind and miscellaneous current transfers within households 1 2 Social benefits other than social transfers in kind and miscellaneous current transfers from non-financial corporations to households 1 3 Social benefits other than social transfers in kind, social transfers in kind and miscellaneous current transfers from government to households 1 4 Social benefits other than social transfers in kind received by households from financial corporations and non-profit institutions serving households; social transfers in kind from non-profit institutions serving households to households; non-life insurance claims from financial corporations to households; adjustment for the change in the net equity of households in pension funds 1 9 Wages and salaries plus imputed social contributions received by the households 1 10 Gross mixed income plus net property income received by the households 1 13 Social benefits other than social transfers in kind, non-life insurance claims and miscellaneous current transfers received by households from the rest of the world 2 2 Miscellaneous current transfers within non-financial corporations 2 3 Miscellaneous current transfers from government to non-financial corporations 2 4 Non-life insurance claims and miscellaneous current transfers from financial corporations to non-financial corporations 2 9 Imputed social contributions received by non-financial corporations 2 10 Gross operating surplus plus net property income received by nonfinancial corporations 2 13 Non-life insurance claims received by non-financial corporations from the rest of the world 3 1 Current taxes on income, wealth, etc., employees social contributions, social contributions by self-employed and non-employed persons and miscellaneous current transfers received by government from households 3 2 Current taxes on income, wealth, etc., and miscellaneous current transfers received by government from non-financial corporations 3 3 Current transfers and miscellaneous current transfers within government 3 4 Current taxes on income, wealth, etc. paid by financial corporations and non-profit institutions serving households to government; non-life insurance claims paid by financial corporations to government; miscellaneous current transfers from financial corporations and non-profit institutions serving households to government 3 9 Imputed social contributions received by general government plus employers actual social contributions received by social security funds 3 10 Gross operating surplus plus net property income received by general government
33 Row Col. Contents 3 11 Other taxes on production net of subsidies (on production) 3 12 Taxes on products paid by the national institutions net of subsidies (on products) received by the same institutions 3 13 Current international cooperation and miscellaneous current transfers received by government from the rest of the world 4 1 Employees social contributions, social contributions by self-employed and non-employed persons and net non-life insurance premiums received by financial corporations from households; miscellaneous current transfers from households to non-profit institutions serving households 4 2 Net non-life insurance premiums received by financial corporations from non-financial corporations; miscellaneous current transfers from nonfinancial corporations to financial corporations and non-profit institutions serving households 4 3 Net non-life insurance premiums received by financial corporations from government; miscellaneous current transfers from government to nonprofit institutions serving households 4 4 Net non-life insurance premiums paid by financial corporations and nonprofit institutions serving households to financial corporations; non-life insurance claims paid by financial corporations to themselves and to nonprofit institutions serving households; miscellaneous current transfers from financial corporations to non-profit institutions serving households and within the latter 4 9 Imputed social contributions received by financial corporations and nonprofit institutions serving households 4 10 Gross operating surplus plus net property income received by financial corporations and non-profit institutions serving households 4 13 Net non-life insurance premiums and non-life insurance claims received by financial corporations from the rest of the world 5 1 Gross savings of households 5 7 Investment grants and other capital transfers from local government to households 5 8 Other capital transfers from financial corporations to households 5 13 Investment grants and other capital transfers from the rest of the world to households 5 14 Net lending (-)/borrowing (+) of households 6 2 Gross savings of non-financial corporations 6 7 Investment grants and other capital transfers from government to nonfinancial corporations 6 8 Other capital transfers from social security funds to non-financial corporations 6 13 Investment grants and other capital transfers from the rest of the world to non-financial corporations 6 14 Net lending (-)/borrowing (+) of non-financial corporations 7 3 Gross savings of government
34 Row Col. Contents 7 5 Capital taxes and other capital transfers received by government from households 7 6 Other capital transfers from non-financial corporations to government 7 7 Investment grants and other capital transfers within central government 7 8 Other capital transfers from financial corporations and non-profit institutions serving households to government 7 13 Investment grants and other capital transfers from the rest of the world to government 7 14 Net lending (-)/borrowing (+) of government 8 4 Gross savings of financial corporations and non-profit institutions serving households 8 6 Other capital transfers from non-financial corporations to financial corporations 8 7 Investment grants and other capital transfers from government to nonprofit institutions serving households 8 8 Other capital transfers within financial corporations 8 13 Investment grants from the rest of the world to non-profit institutions serving households 8 14 Net lending (-)/borrowing (+) of financial corporations and non-profit institutions serving households 9 11 Compensation of employees paid by the activities 9 13 Compensation of employees paid by the rest of the world (from nonresident employers) Gross operating surplus of activities Property income paid by the rest of the world Output of goods and services 12 1 Actual household final consumption 12 3 Actual government final consumption 12 5 Gross Capital Formation by the enterprises classified in the household institutional sector 12 6 Gross Capital Formation by non-financial corporations 12 7 Gross Capital Formation by government 12 8 Gross Capital Formation by financial corporations and non-profit institutions serving households Intermediate consumption Exports plus direct purchases in domestic market by non-residents and the c.i.f./f.o.b. adjustment 13 1 Net non-life insurance premiums and miscellaneous current transfers received by the rest of the world from households; direct purchases abroad by residents 13 2 Net non-life insurance premiums received by the rest of the world from
35 Row Col. Contents non-financial corporations 13 3 Net non-life insurance premiums, current international cooperation, miscellaneous current transfers and social benefits other than social transfers in kind received by the rest of the world from government 13 4 Net non-life insurance premiums received by the other countries of the rest of the world from financial corporations and non-profit institutions serving households; non-life insurance claims received by the rest of the world from financial corporations 13 5 Acquisitions minus disposals of non-produced non-financial assets and other capital transfers from households to the rest of the world 13 6 Acquisitions minus disposals of non-produced non-financial assets and other capital transfers from non-financial corporations to the rest of the world 13 7 Acquisitions minus disposals of non-produced non-financial assets, investment grants and other capital transfers from government to the rest of the world 13 8 Acquisitions minus disposals of non-produced non-financial assets from financial corporations to the rest of the world 13 9 Compensation of employees received by the rest of the world (paid to non-resident employees) Property income received by the rest of the world Minus other subsidies on production received, by activities, from the institutions and other countries of the European Union Imports plus the part of taxes on products received by the institutions of the European Union net of the subsidies (on products) received from the same institutions Net lending of the rest of the world /Net borrowing of the Portuguese economy
36 Figure 1A: Accounting multipliers and additional extragroup and intergroup components from 1995 to 2000 Total Accounting Multipliers (current account of households) Total Accounting Multipliers (capital account of households) 3,000 2,500 2,000 1,500 1,000 3,500 3,000 2,500 2,000 1,500 1,000 0,500 0,500 0,000 0,000 Accounting Multipliers Componentes (current account of households) - Aditional extragroup effects Accounting Multipliers Componentes (capital account of households) - Aditional extragroup effects 2,500 2,000 3,000 2,500 1,500 2,000 1,000 0,500 1,500 1,000 0,500 0,000 0,000 Accounting Multipliers Componentes (current account of households) - Aditional intergroup effects Accounting Multipliers Componentes (capital account of households) - Aditional intergroup effects 0,600 0,400 0,200 0,000 Source: Portuguese accounting multiplier matrices (M a ) from 1995 to 2000 and their components (additional intergroup effects ((M 2 -I)*M 1 ) and additional extragroup effects ((M 3 -I)*M 2 *M 1 )). 0,700 0,600 0,500 0,400 0,300 0,200 0,100 0,000 Agreg.Inc.Hous. Agreg.Inv.Hous. Comp.Labour Comp.Capital Prod.V./Tot.Cos Agreg.D/S
Input-Output and General Equilibrium: Data, Modelling and Policy analysis. September 2-4, 2004, Brussels, Belgium
 Input-Output and General Equilibrium: Data, Modelling and Policy analysis September 2-4, 2004, Brussels, Belgium Distribution of aggregate income in Portugal within the framework of a Social Accounting
Economic Policies in the New Millennium
 Economic Policies in the New Millennium Coimbra, April 2004 The Social Accounting Matrix as a working instrument for defining economic policy. Its application in Portugal, with special emphasis on the
A quantitative approach to the effects of social policy measures. An application to Portugal, using Social Accounting Matrices
 MPRA Munich Personal RePEc Archive A quantitative approach to the effects of social policy measures. An application to Portugal, using Social Accounting Matrices Susana Santos ISEG (School of Economics
Seminário do Departamento de Economia. SOCIAL ACCOUNTING MATRIX MODELLING. An application to Portugal in 1997
 Seminário do Departamento de Economia SOCIAL ACCOUNTING MATRIX MODELLING. An application to Portugal in 1997 Susana Santos Instituto Superior de Economia e Gestão Universidade Técnica de Lisboa Rua Miguel
QUANTTTATTVE ANALYSTS OF TIm ECONOMTC FLO}VS BETWEEN PORTUGAL AND TIIE OTIIER EUROPEAN I]NION MEMBER STATES A}ID INSTITUTIONS IN 1997
![QUANTTTATTVE ANALYSTS OF TIm ECONOMTC FLO}VS BETWEEN PORTUGAL AND TIIE OTIIER EUROPEAN I]NION MEMBER STATES A}ID INSTITUTIONS IN 1997](/thumbs/92/108597183.jpg "QUANTTTATTVE ANALYSTS OF TIm ECONOMTC FLO}VS BETWEEN PORTUGAL AND TIIE OTIIER EUROPEAN I]NION MEMBER STATES A}ID INSTITUTIONS IN 1997") QUANTTTATTVE ANALYSTS OF TIm ECONOMTC FLO}VS BETWEEN PORTUGAL AND TIIE OTIIER EUROPEAN I]NION MEMBER STATES A}ID INSTITUTIONS IN 1997 Susana Santos Documento de Trabalho N'2/3 CEDIN - Centro de Estüdos
QUANTTTATTVE ANALYSTS OF TIm ECONOMTC FLO}VS BETWEEN PORTUGAL AND TIIE OTIIER EUROPEAN I]NION MEMBER STATES A}ID INSTITUTIONS IN 1997 Susana Santos Documento de Trabalho N'2/3 CEDIN - Centro de Estüdos
THE SOCIAL ACCOUNTING MATRIX AND THE SOCIO- DEMOGRAPHIC MATRIX-BASED APPROACHES FOR STUDYING THE SOCIOECONOMICS OF AGEING
 Theoretical and Practical Research in Economic Field DOI: http://dx.doi.org/10.14505/tpref.v4.2(8).06 THE SOCIAL ACCOUNTING MATRIX AND THE SOCIO- DEMOGRAPHIC MATRIX-BASED APPROACHES FOR STUDYING THE SOCIOECONOMICS
Studying the informal aspects of the activity of countries with Social Accounting and Socio- Demographic Matrices
 Department of Economics Susana Santos Studying the informal aspects of the activity of countries with Social Accounting and Socio- Demographic Matrices WP17/2014/DE/UECE WORKING PAPERS ISSN 2183-1815 Studying
Better policy analysis with better data. Constructing a Social Accounting Matrix from the European System of National Accounts
 School of Economics and Management TECHNICAL UNIVERSITY OF LISBON Department of Economics Carlos Pestana Barros & Nicolas Peypoch Susana Santos A Comparative Analysis of Productivity Change in Italian
NEW I-O TABLE AND SAMs FOR POLAND
 Łucja Tomasewic University of Lod Institute of Econometrics and Statistics 41 Rewolucji 195 r, 9-214 Łódź Poland, tel. (4842) 6355187 e-mail: tiase@krysia. uni.lod.pl Draft NEW I-O TABLE AND SAMs FOR POLAND
Using the SNA and SAMs for a better (socio-)economic modelling.
economic modelling.") 19 th International Input-Output Conference 13 17 June, 2011, Alexandria, Virginia, USA Using the SNA and SAMs for a better (socio-)economic modelling. Susana Santos ISEG (School of Economics and Management)/UTL
19 th International Input-Output Conference 13 17 June, 2011, Alexandria, Virginia, USA Using the SNA and SAMs for a better (socio-)economic modelling. Susana Santos ISEG (School of Economics and Management)/UTL
23rd International Input-Output Conference June 2015, Mexico, Mexico City
 23rd International Input-Output Conference 22-26 June 2015, Mexico, Mexico City The informal aspects of the activity of countries studied through Social Accounting and Socio-Demographic Matrices. SUSANA
Looking for Empirical Evidence about the Socio-Economic Activity of Countries with Social Accounting Matrices
 Looking for Empirical Evidence about the Socio-Economic Activity of Countries with Social Accounting Matrices Susana Santos ISEG (School of Economics and Management) of the Technical University of Lisbon
Macro-SAMs for modeling purposes. An application to Portugal in 2003
 School of Economics and Management TECHNICAL UNIVERSITY OF LISBON Department of Economics Carlos Pestana Barros & Nicolas Peypoch Susana Santos A Comparative Analysis of Productivity Change in Italian
SOCIAL ACCOUNTING MATRIX (SAM) AND ITS IMPLICATIONS FOR MACROECONOMIC PLANNING
 AND ITS IMPLICATIONS FOR MACROECONOMIC PLANNING") Unpublished Assessed Article, Bradford University, Development Project Planning Centre (DPPC), Bradford, UK. 1996 SOCIAL ACCOUNTING MATRIX (SAM) AND ITS IMPLICATIONS FOR MACROECONOMIC PLANNING I. Introduction:
Unpublished Assessed Article, Bradford University, Development Project Planning Centre (DPPC), Bradford, UK. 1996 SOCIAL ACCOUNTING MATRIX (SAM) AND ITS IMPLICATIONS FOR MACROECONOMIC PLANNING I. Introduction:
The Impact of Structural Adjustment on Income Distribution in Pakistan A SAM-based Analysis
 The Pakistan Development Review 37 : 4 Part II (Winter 1998) pp. 37:4, 377 397 The Impact of Structural Adjustment on Income Distribution in Pakistan A SAM-based Analysis ZAFAR IQBAL and RIZWANA SIDDIQUI
School of Economics and Management
 School of Economics and Management TECHNICAL UNIVERSITY OF LISBON Department of Economics Carlos Pestana Barros & Nicolas Peypoch Susana Santos A Comparative Analysis of Productivity Change in Italian
2011 The International School of Input- Output Analysis
 2011 THE INTERNATIONAL SCHOOL OF INPUT-OUTPUT ANALYSIS MODULES 12 th Workshop of the APDR Leiria, Portugal 14 th February 2012 1. Construction of Social Accounting Matrices... 2 2. Updating Symmetric Input-Output
Impact Assessment of the Russian Boycott on Spain
 The Empirical Economics Letters, 16(6): (June 2017) ISSN 1681 8997 Impact Assessment of the Russian Boycott on Spain M. Alejandro Cardenete and M. Carmen Delgado * Department of Economics, Loyola University
SAM-Based Accounting Modeling and Analysis Sudan 2000 By
 SAM-Based Accounting Modeling and Analysis Sudan 2000 By Azharia A. Elbushra 1, Ibrahim El-Dukheri 2, Ali A. salih 3 and Raga M. Elzaki 4 Abstract SAM-based accounting multiplier is one of the tools used
A 2009 Social Accounting Matrix (SAM) for South Africa
 for South Africa") A 2009 Social Accounting Matrix (SAM) for South Africa Rob Davies a and James Thurlow b a Human Sciences Research Council (HSRC), Pretoria, South Africa b International Food Policy Research Institute,
A 2009 Social Accounting Matrix (SAM) for South Africa Rob Davies a and James Thurlow b a Human Sciences Research Council (HSRC), Pretoria, South Africa b International Food Policy Research Institute,
FINANCIAL SOCIAL ACCOUNTING MATRIX: CONCEPTS, CONSTRUCTIONS AND THEORETICAL FRAMEWORK ABSTRACT
 FINANCIAL SOCIAL ACCOUNTING MATRIX: CONCEPTS, CONSTRUCTIONS AND THEORETICAL FRAMEWORK BY KELLY WONG KAI SENG*, M. AZALI AND LEE CHIN Department of Economics, Faculty of Economics and Management, Universiti
SAM Multipliers: Their Decomposition, Interpretation and Relationship to Input-Output Multipliers
 Research Bulletin XB1 27 1993 SAM Multipliers: Their Decomposition, Interpretation and Relationship to Input-Output Multipliers ~ Washington State University - College of Agriculture and Home Economics
Net lending of the Portuguese economy increased to 1.1% of GDP
 22 December 2017 Quarterly Sector Accounts (Base 2011) Third Quarter 2017 Net lending of the Portuguese economy increased to 1.1% of GDP The net lending of the economy stood at 1.1% of the Gross Domestic
offer the chance to experiment with different interventions in regard to its functioning.
 1 ISEG (School of Economics and Management) of the University of Lisboa 1 UECE (Research Unit on Complexity and Economics) and DE (Department of Economics) Abstract: In looking for empirical evidence about
J Mukarati & G Makombe
 ODELING THE DITRIBUTIVE EFFECT OF AN AGRCIULTURAL HOCK ON HOUEHOLD INCOE IN OUTH AFRICAN: A A ULTIPLIER DECOPOITION AND TRUCTURAL PATH ANALYI J ukarati & G akombe Abstract Natural resource redistribution
Session 5 Supply, Use and Input-Output Tables. The Use Table
 Session 5 Supply, Use and Input-Output Tables The Use Table Introduction A use table shows the use of goods and services by product and by type of use for intermediate consumption by industry, final consumption
Jean Monnet Chair. Small Area Methods for Monitoring of Poverty and Living conditions in EU (SAMPL-EU)
") Jean Monnet Chair Small Area Methods for Monitoring of Poverty and Living conditions in EU (SAMPL-EU) II.1. Income, Consumption and Poverty in the European Statistical System Luigi Biggeri Outline 1. Some
Jean Monnet Chair Small Area Methods for Monitoring of Poverty and Living conditions in EU (SAMPL-EU) II.1. Income, Consumption and Poverty in the European Statistical System Luigi Biggeri Outline 1. Some
What is Macroeconomics?
 Introduction ti to Macroeconomics MSc Induction Simon Hayley Simon.Hayley.1@city.ac.uk it What is Macroeconomics? Macroeconomics looks at the economy as a whole. It studies aggregate effects, such as:
Economic Impact of Social Protection Programmes in India: A Social
 Economic Impact of Social Protection Programmes in India: A Social Accounting Matrix Multiplier Analysis 1 Akhilesh K. Sharma 2 Abstract: Social protection consists of governments policies and programs
Executive Summary. I. Introduction
 Extending the Measurement of the Economic Impact of Tourism Beyond a Regional Tourism Satellite Account A paper delivered to the INRouTE 1 st Seminar on Regional Tourism: Setting the Focus, Venice, Italy,
Import multiplier in input - output analysis
 VNU Journal of Science, Economics and Business 25, No. 5E (2009) 41-45 Import multiplier in input - output analysis Dr. Bui Trinh *, Pham Le Hoa, Bui Chau Giang General Statistics Office, No 2, Hoang Van
Introduction to Supply and Use Tables, part 3 Input-Output Tables 1
 Introduction to Supply and Use Tables, part 3 Input-Output Tables 1 Introduction This paper continues the series dedicated to extending the contents of the Handbook Essential SNA: Building the Basics 2.
A price model to assess the effects of European Regional Development. Fund in Andalusia
 Zaragoza, 5 al 7 de septiembre de 2007 A price model to assess the effects of European Regional Development Fund in Andalusia M. Carmen Lima Universidad Pablo de Olavide M. Alejandro Cardenete Universidad
VIII. FINANCIAL STATISTICS
 VIII. FINANCIAL STATISTICS INTRODUCTION 405. The financial statistics covered in this chapter have broader sectoral coverage than the monetary statistics described in Chapter 7. The scope of the monetary
Characterization of the Spanish Economy based on Sector linkages: IO, SAM and FSAM Multipliers
 Characterization of the Spanish Economy based on Sector linkages: IO, SAM and FSAM Multipliers Henry Aray Luís Pedauga Agustín Velázquez University of Granada April, 2018 Abstract This article goes further
PAPER No. : 4 Basic Macroeconomics MODULE No. : 2- Circular Flow of Income and Expenditure
 Subject Paper No and Title Module No and Title Module Tag 4, Basic Macroeconomics 2, Circular Flow of Income and Expenditure ECO_P4_M2 TABLE OF CONTENTS 1. Learning Outcomes 2. Introduction 3. The Four
The Underlying Database of an Instrument for Economic and Social Policy Analysis for the Azores: Application and Extension to 2005
 WORKING PAPER SERIES CEEAplA WP No. 14/2011 The Underlying Database of an Instrument for Economic and Social Policy Analysis for the Azores: Application and Extension to 2005 Susana Santos April 2011 Universidade
INTEGRATED FINANCIAL AND NON-FINANCIAL ACCOUNTS FOR THE INSTITUTIONAL SECTORS IN THE EURO AREA
 INTEGRATED FINANCIAL AND NON-FINANCIAL ACCOUNTS FOR THE INSTITUTIONAL SECTORS IN THE EURO AREA In May 26 the published for the first time a set of annual integrated non-financial and financial accounts,
RELATIVE INCOME DETERMINATION IN THE UNITED STATES: A SOCIAL ACCOUNTING PERSPECTIVE
 Review of Income and Wealth Series 38, Number 3, September 1992 RELATIVE INCOME DETERMINATION IN THE UNITED STATES: A SOCIAL ACCOUNTING PERSPECTIVE BY DAVID W. ROLAND-HOLST Mills College AND Universitat
Social Accounting Matrix and its Application. Kijong Kim Levy Economics Institute GEM-IWG summer workshop July
 Social Accounting Matrix and its Application Kijong Kim Levy Economics Institute GEM-IWG summer workshop July 01 2009 Basic Structure Balanced matrix representation of flow of funds in the economy (row
Flow Structure in Nepal and the Benefit to the Poor. Abstract
 Flow Structure in Nepal and the Benefit to the Poor Sanjaya Acharya Hokkaido University Abstract In this paper we use the latest Social Accounting Matrix (SAM) for Nepal and some complementary data to
Trade Performance in Internationally Fragmented Production Networks: Concepts and Measures
 World Input-Output Database Trade Performance in Internationally Fragmented Production Networks: Concepts and Measures Working Paper Number: 11 Authors: Bart Los, Erik Dietzenbacher, Robert Stehrer, Marcel
Policy Making in the National Context
 1 of 40 Policy Making in the National Context How Policies Impact on a Socio-Economic System 2 of 40 Policy Making in the National Context How Policies Impact on a Socio-Economic System By Lorenzo Giovanni
Chapter 4 THE SOCIAL ACCOUNTING MATRIX AND OTHER DATA SOURCES
 Chapter 4 THE SOCIAL ACCOUNTING MATRIX AND OTHER DATA SOURCES 4.1. Introduction In order to transform a general equilibrium model into a CGE model one needs to incorporate country specific data. Most of
Professor Yuri Mansury KDI School of Public Policy and Management
 Identifying the Channels of Impact Transmission during a Disaster Event April 10, 2008 Seoul National University Professor Yuri Mansury KDI School of Public Policy and Management What is a disaster event?
FEEDBACK TUTORIAL LETTER
 FEEDBACK TUTORIAL LETTER 2 ND SEMESTER 2018 ASSIGNMENT 1 INTERMEDIATE MACRO ECONOMICS IMA612S 1 Course Name: Course Code: Department: INTERMEDIATE MACROECONOMICS IMA612S ACCOUNTING, ECONOMICS AND FINANCE
Introduction to Supply and Use Tables, part 1 Structure 1
 Introduction to Supply and Use Tables, part 1 Structure 1 Introduction This paper continues the series dedicated to extending the contents of the Handbook Essential SNA: Building the Basics 2. The aim
Joensuu, Finland, August 20 26, 2006
 Session Number: session 2 C Session Title: Developments in the Compilation of Supply Use Tables Input- Output Tables Session Organizer(s): Liv Hobbelstad Simpson, Statistics Norway, Oslo, Norway Session
4. SOME KEYNESIAN ANALYSIS
 4. SOME KEYNESIAN ANALYSIS Fiscal and Monetary Policy... 2 Some Basic Relationships... 2 Floating Exchange Rates and the United States... 7 Fixed Exchange Rates and France... 11 The J-Curve Pattern of
GOVERNMENT FINANCE STATISTICS
 August 2004 GOVERNMENT FINANCE STATISTICS THE GOVERNMENT FINANCE STATISTICS MANUAL 2001 FRAMEWORK AND ITS RELATIONSHIP WITH THE EUROPEAN SYSTEM OF ACCOUNTS 1995 JÓHANN R. BJÖRGVINSSON STATISTICS DEPARTMENT
Real National Accounts as a Money Flow System
 Real National Accounts as a Money Flow System Matti Estola 1 and Alia Dannenberg 2 The analogy between a money and a water flow system is demonstrated in Figure 1, where the difference between inflow and
Multiplier Decomposition, Poverty and Inequality in Income Distribution in a SAM Framework: The Vietnamese Case
 QUDERNI DEL DIPRTIMENTO DI ECONOMI PUBBLIC E TERRITORILE n. 4/28 Marisa Bottiroli Civardi, Renata Targetti Lenti and Rosaria Vega Pansini Multiplier Decomposition, Poverty and Inequality in Income Distribution
THE CONTRIBUTION OF THE FINANCIAL SERVICES SECTOR TO THE ECONOMY OCTOBER 2017
 THE CONTRIBUTION OF THE FINANCIAL SERVICES SECTOR TO THE ECONOMY OCTOBER 2017 1 02 ACKNOWLEDGEMENTS The MFSA would like to thank Dr Ian P. Cassar B.Com. (Hons)(Econ.) (Melit.), M.Sc. (Econ.)(Edin.), Ph.D.
An Introduction to System of National Accounts - Basic Concepts
 Lesson II: Macro-economic Framework An Introduction to System of National Accounts - Basic Concepts Fifth e-learning Course on the 2008 System of National Accounts May 2014 July 2014 1 Content 2 SNA Introduction
ECON 1102: MACROECONOMICS 1 Chapter 1: Measuring Macroeconomic Performance, Output and Prices
 ECON 1102: MACROECONOMICS 1 Chapter 1: Measuring Macroeconomic Performance, Output and Prices 1.1 Measuring Macroeconomic Performance 1. Rising Living Standards Economic growth is the tendency for output
ECO403 Macroeconomics Solved Online Quiz For Midterm Exam Preparation Spring 2013
 ECO403 Macroeconomics Solved Online Quiz For Midterm Exam Preparation Spring 2013 Question # 1 of 15 ( Start time: 03:22:55 PM ) Total Marks: 1 If the U.S. real exchange rate increases, then U.S. ----------------
Overview of Social Accounting Matrices
 Overview of Social Accounting Matrices David Roland-Holst and Sam Heft-Neal, UC Berkeley Faculty of Economics Chiang Mai University Contents 1.Introduction 2.What is needed? 3.What is a SAM? 4.How to Build
Operating Surplus, Mixed Income and Consumption of Fixed Capital 1
 Total Total Operating Surplus, Mixed Income and Consumption of Fixed Capital 1 Introduction This paper continues the series dedicated to extending the contents of the Handbook Essential SNA: Building the
National Financial Accounts
 National Financial Accounts BANCO DE PORTUGAL E U R O S Y S T E M Supplement to the Statistical Bulletin October 216 3 3 National Financial Accounts Supplement to the Statistical Bulletin October 216
Salient Features of Social Accounting Matrix of Pakistan for : Disaggregation of the Households Sector
 Salient Features of Social Accounting Matrix of Pakistan for 1989-90: Disaggregation of the Households Sector RIZWANA SIDDIQUI Research Economist ZAFAR IQBAL Senior Research Economist January 1999 1 CONTENTS
CONSTRUCTION OF SOCIAL ACCOUNTING MATRIX FOR KENYA 2009
 CONSTRUCTION OF SOCIAL ACCOUNTING MATRIX FOR KENYA 2009 By Miriam W. O. Omolo, Ph.D Programmes Coordinator Institute of Economic Affairs Nairobi, Kenya TABLE OF CONTENTS September 2014 1 BACKGROUND...
ECONOMIC PERFORMANCE ANALYSIS OF THE AUSTRALIAN PROPERTY SECTOR USING INPUT-OUTPUT TABLES. YU SONG and CHUNLU LIU Deakin University
 ECONOMIC PERFORMANCE ANALYSIS OF THE AUSTRALIAN PROPERTY SECTOR USING INPUT-OUTPUT TABLES YU SONG and CHUNLU LIU Deakin University ABSTRACT The property sector has played an important role with its growing
An Introduction to System of National Accounts - Basic Concepts
 Lesson-VI: Printable Lesson: VI Sequence of Accounts An Introduction to System of National Accounts - Basic Concepts Fourth e-learning Course on the 2008 System of National Accounts October December 2013
ECONOMICS EXAMINATION OBJECTIVES
 ECONOMICS EXAMINATION OBJECTIVES The following objectives of the examination are to test whether the candidates have acquired a basic understanding of economics with special emphasis on Hong Kong conditions
National Accounts of Tajikistan
 National Accounts of Tajikistan Nilyufar Khuseynova Spesialist of SNA and financial statistics department Introduction of SNA -93 The practical introduction of System of National Accounts in Tajikistan
Lecture Investment and Saving
 Lecture 3-1 4. Investment and Saving Investment is the portion of final product that adds to the nation s stock of income-yielding physical assets or that replaces old, worn-out physical assets. The goods
Gross domestic product, 2008 (Preliminary estimation)
") Internet publication www.ksh.hu Hungarian September 2009 Central Statistical Office ISBN 978-963-235-266-4 Gross domestic product, 2008 (Preliminary estimation) Contents Summary...2 Tables...4 Methodological
Internet publication www.ksh.hu Hungarian September 2009 Central Statistical Office ISBN 978-963-235-266-4 Gross domestic product, 2008 (Preliminary estimation) Contents Summary...2 Tables...4 Methodological
Łucja Tomaszewicz University of Lodz Joanna Trębska Academy of Management Poland
 Łucja Tomaszewicz University of Lodz Joanna Trębska Academy of Management Poland To present flow of funds accounts (FFA) in the meaning of social accounting matrix (SAM), To construct SAM for Poland integrated
Economic Impacts of a Universal Pension in Bangladesh
 Issue No No 1 1 PATHWAYS PERSPECTIVES on social policy in international development Issue No 17 Economic Impacts of a Universal Pension in Bangladesh Bazlul H Khondker Do social protection schemes generate
The Goods Market and the Aggregate Expenditures Model
 The Goods Market and the Aggregate Expenditures Model Chapter 8 The Historical Development of Modern Macroeconomics The Great Depression of the 1930s led to the development of macroeconomics and aggregate
New Notation Introduction Steady State Solutions in REG Experiments with REG. EC6012 Lecture 8. The Open Economy. Stephen Kinsella
 EC6012 Lecture 8 The Open Economy Stephen Kinsella Dept. Economics, University of Limerick April 19, 2007 Objectives today 1 2 3 4 All the notation you re no doubt familiar with (C, G, Y ), etc is still
14.02 Principles of Macroeconomics Problem Set # 1, Answers
 14.02 Principles of Macroeconomics Problem Set # 1, Answers Part I 1. True: The labor supply curve will shift up-left and a new equilibrium with a higher real wage will exist. This is, in part, due to
Construction of Financial Social Accounting Matrix for Tunisia
 International Journal of Business and Social Science Vol. 5, No. 10; September 2014 Construction of Financial Social Accounting Matrix for Tunisia Manel Ayadi Faculty of Economics and Management of Sfax
A Social Accounting Matrix for Scotland
 A Social Accounting Matrix for Scotland Emonts-Holley, T., Ross, A., and Professor Swales, J.K., Fraser of Allander Institute Abstract Irrespective of the outcome of the September 2014 Scottish independence
G.C.E. (A.L.) Support Seminar- 2016
 Support Seminar- 2016") G.C.E. (A.L.) Support Seminar- 2016 Economics I Two hours Instructions : Answer all the questions. In each of the questions 1 to 50, pick one of the alternatives from (1), (2), (3), (4) and (5), which
G.C.E. (A.L.) Support Seminar- 2016 Economics I Two hours Instructions : Answer all the questions. In each of the questions 1 to 50, pick one of the alternatives from (1), (2), (3), (4) and (5), which
Project Evaluation and the Folk Principle when the Private Sector Lacks Perfect Foresight
 Project Evaluation and the Folk Principle when the Private Sector Lacks Perfect Foresight David F. Burgess Professor Emeritus Department of Economics University of Western Ontario June 21, 2013 ABSTRACT
CIE Economics A-level
 CIE Economics A-level Topic 4: The Macroeconomy e) The circular flow of income Notes Closed and open economies A closed economy is entirely self-sufficient, so it has no need to import anything, and it
Adam Smith Aggregate monetary resources Automatic stabilisers Autonomous change Autonomous expenditure multiplier Balance of payments
 Glossary Adam Smith (1723 1790) Regarded as the father of modern Economics. Author of Wealth of Nations. Aggregate monetary resources Broad money without time deposits of post office savings organisation
The New Treatment of Reinsurance in SNA 2008: Implementation and Impact
 The New Treatment of Reinsurance in SNA 2008: Implementation and Impact Wolfgang Eichmann (Federal Statistical Office of Germany) Paper Prepared for the IARIW 33 rd General Conference Rotterdam, the Netherlands,
Glossary. Average household savings ratio Proportion of disposable household income devoted to savings.
 - 440 - Glossary Administrative expenditure A type of recurrent expenditure incurred to administer institutions that directly and indirectly participate in the delivery of services. For example, in the
II.2. Member State vulnerability to changes in the euro exchange rate ( 35 )
") II.2. Member State vulnerability to changes in the euro exchange rate ( 35 ) There have been significant fluctuations in the euro exchange rate since the start of the monetary union. This section assesses
II.2. Member State vulnerability to changes in the euro exchange rate ( 35 ) There have been significant fluctuations in the euro exchange rate since the start of the monetary union. This section assesses
Data Development for Regional Policy Analysis
 Data Development for Regional Policy Analysis David Roland-Holst UC Berkeley ASEM/DRC Workshop on Capacity for Regional Research on Poverty and Inequality in China Monday-Tuesday, March 27-28, 2006 Contents
Macroeconomics I International Group Course
 Macroeconomics I International Group Course 2004-2005 Topic 7: SAVINGS AND INVESTMENT IN THE OPEN ECONOMY Learning objectives We now start the study of the open economy. This brings into the analysis of
THE NEED FOR MACROECONOMIC PLANNING IN THE REPUBLIC OF MACEDONIA
 Business Statistics Economic Informatics THE NEED FOR MACROECONOMIC PLANNING IN THE REPUBLIC OF MACEDONIA INSTITUTIONAL AND METHODOLOGICAL ASPECTS Assoc. Prof. Ph.D. Sasho Kjosev, University Ss. Cyril
Decomposition of GDP-growth in some European Countries and the United States 1
 CPB Memorandum CPB Netherlands Bureau for Economic Policy Analysis Sector : Conjunctuur en Collectieve Sector Unit/Project : Conjunctuur Author(s) : Henk Kranendonk and Johan Verbrugggen Number : 203 Date
The primary purpose of the International Comparison Program (ICP) is to provide the purchasing
 is to provide the purchasing") CHAPTER 3 National Accounts Framework for International Comparisons: GDP Compilation and Breakdown Process Paul McCarthy The primary purpose of the International Comparison Program (ICP) is to provide
CHAPTER 3 National Accounts Framework for International Comparisons: GDP Compilation and Breakdown Process Paul McCarthy The primary purpose of the International Comparison Program (ICP) is to provide
TOPIC 1: IS-LM MODEL...3 TOPIC 2: LABOUR MARKET...23 TOPIC 3: THE AD-AS MODEL...33 TOPIC 4: INFLATION AND UNEMPLOYMENT...41 TOPIC 5: MONETARY POLICY
 TOPIC 1: IS-LM MODEL...3 TOPIC 2: LABOUR MARKET...23 TOPIC 3: THE AD-AS MODEL...33 TOPIC 4: INFLATION AND UNEMPLOYMENT...41 TOPIC 5: MONETARY POLICY AND THE RESERVE BANK OF AUSTRALIA...53 TOPIC 6: THE
OCR Economics A-level
 OCR Economics A-level Macroeconomics Topic 2: Aggregate Demand and Aggregate Supply 2.1 Circular flow of income Notes The circular flow of income Firms and households interact and exchange resources in
Lesson 8: Aggregate demand; consumption, investment, public expenditure and taxation.
 Introduction to Economic Analysis. Antonio Zabalza. University of Valencia 1 Lesson 8: Aggregate demand; consumption, investment, public expenditure and taxation. 8.1 Consumption As we saw in the circular
St. Gallen, Switzerland, August 22-28, 2010
 Session Number: Second Poster Session Time: Thursday, August 26, PM Paper Prepared for the 31st General Conference of The International Association for Research in Income and Wealth St. Gallen, Switzerland,
State level fiscal policy choices and their impacts
 State level fiscal policy choices and their impacts Analysis using a regional social accounting matrix for India, 2011-12 A. Ganesh-Kumar 1 and Manoj Panda 2 1 Professor, Indira Gandhi Institute of Development
Updated System of National Accounts (SNA): Chapter 16: Summarising and integrating the accounts
: Chapter 16: Summarising and integrating the accounts") Statistical Commission Thirty-ninth session 26 29 February 2008 Item 3(d) of the provisional agenda Items for discussion and decision: National accounts Background document Available in English only Updated
Statistical Commission Thirty-ninth session 26 29 February 2008 Item 3(d) of the provisional agenda Items for discussion and decision: National accounts Background document Available in English only Updated
EVALUATING THE IMPACT OF A CARBON TAX IN PORTUGAL CONSIDERING ALTERNATIVE ASSUMPTIONS FOR PRICE ELASTICITY OF DEMAND
 EVALUATING THE IMPACT OF A CARBON TAX IN PORTUGAL CONSIDERING ALTERNATIVE ASSUMPTIONS FOR PRICE ELASTICITY OF DEMAND Ana Maria Dias (ana.dias@sg.mamb.gov.pt) Prospective and Planning Services, General
MEASURING GDP AND ECONOMIC GROWTH. Objectives. Gross Domestic Product. An Economic Barometer. Gross Domestic Product. Gross Domestic Product CHAPTER
 MEASURING GDP AND ECONOMIC CHAPTER GROWTH Objectives After studying this chapter, you will able to Define GDP and use the circular flow model to explain why GDP equals aggregate expenditure and aggregate
The impact of the European System of Accounts 2010 on euro area macroeconomic statistics
 Box 8 The impact of the European System of Accounts 21 on euro area macroeconomic statistics The introduction of the new European System of Accounts 21 (ESA 21) in line with international statistical standards
An Introduction to System of National Accounts - Basic Concepts
 An Introduction to System of National Accounts - Basic Concepts Lesson I: Lecture 1 Introduction Lesson I Fifth Basic e-learning Course on 2008 System of National Accounts September - November 2014 e 2008
The Economic Impact of Belarus Accession to the WTO: A Quantitative Assessment
 IPM Research Center German Economic Team in Belarus PP/14/04 The Economic Impact of Belarus Accession to the WTO: A Quantitative Assessment Summary In this paper a computable general equilibrium model
Sources for Other Components of the 2008 SNA
 4 Sources for Other Components of the 2008 SNA This chapter presents an overview of the sequence of accounts and balance sheets of the 2008 SNA. It is designed to give the compiler of the quarterly GDP
SCHOOL OF ACCOUNTING AND BUSINESS BSc. (APPLIED ACCOUNTING) GENERAL / SPECIAL DEGREE PROGRAMME YEAR II SEMESTER II END SEMESTER EXAMINATION APRIL 2015
 GENERAL / SPECIAL DEGREE PROGRAMME YEAR II SEMESTER II END SEMESTER EXAMINATION APRIL 2015") All Rights Reserved No. of Pages - 09 No of Questions - 08 SCHOOL OF ACCOUNTING AND BUSINESS BSc. (APPLIED ACCOUNTING) GENERAL / SPECIAL DEGREE PROGRAMME YEAR II SEMESTER II END SEMESTER EXAMINATION APRIL
All Rights Reserved No. of Pages - 09 No of Questions - 08 SCHOOL OF ACCOUNTING AND BUSINESS BSc. (APPLIED ACCOUNTING) GENERAL / SPECIAL DEGREE PROGRAMME YEAR II SEMESTER II END SEMESTER EXAMINATION APRIL
Guidelines for the Notes on National Accounts Methodology
 Guidelines for the Notes on National Accounts Methodology In addition to the national accounts data, metadata on the national accounts methodology is published in the United Nations publication: National