FOREWORD. Shri A.B. Chakraborty, Officer-in-charge, and Dr.Goutam Chatterjee, Adviser, provided guidance in bringing out the publication.
|
|
|
- Ferdinand Wright
- 5 years ago
- Views:
Transcription
1 FOREWORD The publication, Basic Statistical Returns of Scheduled Commercial Banks in India, provides granular data on a number of key parameters of banks. The information is collected from bank branches through Basic Statistical Returns 1 & 2 (BSR 1&2). Under BSR 1, account level data for loan accounts with credit limit more than ` 200,000 and occupation-wise consolidated data for loan accounts with credit limit up to ` 200,000 are collected branch-wise. Under BSR 2, branchwise data related to parameters such as staff, type of deposits and maturity pattern of term deposits are collected. The data through BSR 1&2 are being collected since The present volume, 41 st in the series, provides detailed data on and Deposits of scheduled commercial banks as on 31 st March It covers nearly one lakh branches with more than 131 million credit accounts and 903 million deposit accounts spread across more than 36,000 centers. It provides detailed occupation-wise credit data on different dimensions viz. type of account, organization, interest rate range and size of credit limit. It also provides information on population group, bank group and state-wise credit data according to type of occupation. One unique feature of this publication is that it covers spatial distribution of credit as per place of sanction and place of utilization. The voluminous work relating to this publication was undertaken in the Banking Statistics Division of the Department of Statistics and Information Management, Reserve Bank of India. The core team, headed by Shri S.Bose, Director, involved in the process of bringing out this publication comprised Shri. V.C.Augustine and Shri S.Gangadaran, Assistant Advisers, Shri S.Sarkar and Dr. S.Singh, Research Officers, Smt. S.S.Surve, Assistant Manager and Smt. S.S.Kulkarni, Special Assistant. Other staff members of the Division ably supported the core team. In bringing out the publication through DBIE: Reserve Bank s Data Warehouse, the help of Data Warehouse Division is acknowledged. Shri A.B. Chakraborty, Officer-in-charge, and Dr.Goutam Chatterjee, Adviser, provided guidance in bringing out the publication. I trust, as in the past, the current volume would prove to be a valuable source of information on the banking sector in India. Deepak Mohanty Executive Director 22 nd April, 2013
2 INTRODUCTION This Volume, forty first in the series, presents comprehensive data on deposits and credit of scheduled commercial banks and the information on number of employees of these banks, as on 31 st March The data are collected through the annual statistical surveys, Basic Statistical Returns (BSR) - 1 & 2, from the offices of scheduled commercial banks in India including Regional Rural Banks. 2. The BSR-1&2 returns are revised periodically in line with policy changes, developments in the banking sector and also with a view to have uniform coding system for various classificatory characteristics. The last such revision was effective from March 2008 Survey. A detailed description of the changes made in the last revision is listed in the previous Volume No.37 for the year Accordingly, the data presented in some of the tables in this Volume are not strictly comparable with those of the years prior to BSR-1 relates to gross bank credit and comprises term loans, cash credit, overdrafts, bills purchased and discounted, bills rediscounted under the Bill Market Scheme and also dues from banks, whereas, the bank credit data, based on returns under Section 42(2) of the RBI Act, 1934, is exclusive of dues from banks and bills rediscounted. The BSR-1 return is divided into two parts - Part A and Part B (termed as BSR-1A and BSR-1B). Till 1998, the BSR-1A return covered accounts with individual credit limit of over ` 25,000. Consequent upon the revision in the cut-off credit limit from March 1999 survey, BSR-1A return for scheduled commercial banks other than Regional Rural Banks, covers accounts with individual credit limit of over ` 0.2 million. In the case of Regional Rural Banks, the cut off limit then was ` 25,000. The revision of cut off limit for classifying accounts in BSR-1A has been made as ` 0.2 million for Regional Rural Banks also from March 2002 onwards. In BSR-1A, information in respect of each of the borrowal accounts is collected on various characteristics, such as place (district and population group) of utilisation of credit, type of account, type of organisation, occupational category, category of borrower code, secured/unsecured loan code, fixed / floating rate of interest flag, rate of interest, credit limit and amount outstanding. In BSR-1B, information in respect of small borrowal accounts with individual credit limit up to ` 0.2 million is obtained from all scheduled commercial banks in consolidated form for broad occupational categories for two separate credit limit groups, i.e., up to `25,000 and over `25,000 and up to ` 0.2 million. i
3 4. In BSR-2, each bank office submits information on deposits with their break-up into current, savings and term deposits. Information on deposit accounts of females is given separately. Information of term deposits according to different maturity periods is also furnished in this return. In addition, BSR-2 provides information on staff strength, classified according to gender and category (i.e. officers, clerical and subordinates), in individual bank offices as on the reference date of the returns. Deposits exclude inter-bank deposits. Current deposits comprise (i) deposits subject to withdrawal on demand (other than savings deposits) or on notice of less than 14 days, or term deposits with a maturity period of less than 7 days (ii) call deposits withdrawable not later than 14 days; (iii) unclaimed deposits; (iv) overdue fixed deposits; (v) credit balance in cash credit and overdraft accounts and (vi) contingency unadjusted account if in the nature of deposits. Savings deposits are deposits accepted by banks under their savings bank deposit rules. Term deposits are deposits with a fixed maturity of not less than 7 days and above or subject to notice of not less than 14 days. These would also include (a) deposits payable after 14 days notice; (b) cash certificates; (c) cumulative or recurring deposits; (d) Kuri & Chit deposits and (e) special deposits in the nature of term deposits. Conceptually, the deposits data in BSR-2 and the aggregate deposits in Section 42(2) return are the same. In BSR-2, bank branches also give classification of term deposits according to broad interest rate ranges as well as size of deposits. Based on these data, tables giving percentage distribution of term deposits according to interest rate range and size of deposits are presented in the Volume. The data on residual maturity of term deposits are also collected through this return; and their percentage distribution is presented in the Volume. 5. Out of the 1,00,805 offices of scheduled commercial banks functioning as on the last day of March 2012, BSR-1A return was received from 90,260 offices and BSR- 1B return was received from 90,312 offices. Deposit data in BSR-2 return was received from 96,050 offices. Administrative offices and other offices without credit and deposit accounts have to report only staff data in BSR-2. Out of the nonreporting offices the data have been estimated for 2199, 2425 & 1752 offices for BSR1A, BSR1B and BSR2 respectively based on the available information from the previous round of the survey and the Quarterly Return on Aggregate Deposits and Gross Bank (BSR-7) as of 31st March ii
4 Outline of the Volume 6. This Volume is divided into five Sections disseminating the data on deposits and credit of scheduled commercial banks with reference to various classificatory characteristics. Section 1 presents general information on commercial banking and also the summary data on deposits and credit at the All-India level and state level. Section 2 gives State-wise distribution of deposits and outstanding credit classified according to population groups and bank groups. Data on distribution of deposits by type of deposits are presented in Section 3. Classification of outstanding credit according to different characteristics such as size of credit limit, rate of interest, type of organisation, type of account, bank group, state and population group, etc., are given in Section 4. In Section 5, these data are further classified according to occupation of the borrower. 7. BSR-1A return provides the identification of the district and population group of the place where the credit is utilised. However, in BSR-1B return, such information is not being collected. It is presumed that in respect of these accounts of relatively smaller sizes, the credit is utilised in the same place where it has been sanctioned. State and population group-wise data on credit given in Sections 4 and 5 are based on place of utilisation of credit, whereas in Section 2, these are based on place of sanction of credit. In Section 1, data on credit when presented with deposits (Tables 1.3, 1.4 and 1.5) are as per place of sanction and when presented separately (Tables 1.10 and 1.11) they are based on place of utilisation. Tables 1.6 to 1.8 present the data on credit according to both the place of sanction and the place of utilisation so as to facilitate comparison. A listing of tables on credit, which are based on place of sanction / utilisation, is also given in the Notes on Tables. Besides data presented in the printed copy of the publication, tables presenting District-wise data on number of bank offices, deposits and credit, and State/District-wise classification of outstanding credit according to occupation are also included in the soft copy of the publication available in CD-ROM. Explanatory Notes 8. Brief explanatory notes on some of the tables presented in various Sections of this Volume are given below: In Section 1, Table 1.1 presents the progress of commercial banking at a glance, based on data collected from different sources as per details given in the Notes on iii
5 Tables. Table 1.9 presents classification of outstanding credit according to detailed occupations. Tables 1.13, 1.14 and 1.15 provide truncated distributions of outstanding credit of scheduled commercial banks according to interest rate range, type of account and organisation, respectively, for accounts having individual credit limit above ` 0.2 million. Table 1.16 gives percentage distribution of small borrowal accounts according to broad category of borrowers into individuals & others and gender-wise classification of individual borrowers. Table 1.17 gives population group and occupation-wise classification of small borrowal accounts each with credit limit of ` 0.2 million and less. Tables 1.21 to 1.23 give the information on deposits of scheduled commercial banks according to broad ownership category. Tables 1.24 to 1.26 give (original) maturity pattern of term deposits according to broad ownership category, population group and bank group, respectively. Table 1.27 presents the percentage distribution of the term deposits of scheduled commercial banks, as per the residual maturity period. Table 1.28 gives interest rate range-wise percentage distribution of term deposits. Table 1.29 presents the percentage distribution of the term deposits of scheduled commercial banks as per the size of deposits. Tables 3.4 to 3.5 give (original) maturity pattern of term deposits according to broad ownership category with population group and state. Tables 4.1 to 4.6 in Section 4 and Tables 5.1 to 5.3 in Section 5 provide truncated distribution according to different characteristics of outstanding credit of scheduled commercial banks, for accounts having individual credit limit above ` 0.2 million. 9. In this Volume population group-wise data for Non-Food (i.e. total credit excluding credit extended for Food procurement) is presented separately in two tables viz. Table 1.3 and a newly introduced Table 1.6A. 10. Population groups of the banked centres presented in this Volume are based on the 2001 census. As such, the population group-wise data presented in the tables in this Volume are not strictly comparable with those of the years prior to The population groups are defined as follows: i. Rural group includes all centres with population of less than 10,000 ii. iii. iv. Semi-urban group includes centres with population of 10,000 and above but less than 0.1 million Urban group includes centres with population of 0.1 million and above but less than 1 million Metropolitan group includes centres with population of 1 million and more. iv
6 11. Banks have been grouped as: (i) State Bank of India and its Associates, (ii) Nationalised banks, (iii) Foreign banks, (iv) Regional rural banks and (v) Private Sector banks. The bank group, Nationalised Banks also includes the data of IDBI Bank Ltd. Private Sector Banks refer to Indian old and new private sector banks, which was previously (till 2008 volume) referred to as Other Scheduled Commercial Banks. 12. Significant features relating to credit and deposits of Scheduled Commercial Banks based on information in various tables in this volume are covered in the Highlights. 13. The totals given in the tables may not exactly tally with the sum of the constituent items on account of rounding off of the figures. The unit one million is equal to 1,000,000. The symbol indicates nil or negligible throughout this Volume. Figures in brackets indicate percentages to respective total. Notes on tables as appropriate to each table are given at the end of the Volume. 14. Information on related publications of the Bank on Banking Statistics is given in the Appendix. 15. This Volume is prepared in the Banking Statistics Division of the Department of Statistics and Information Management v
7 Basic Statistical Returns of Scheduled Commercial Banks in India - Volume 41, March 2012 Highlights 1. The publication Basic Statistical Returns of Scheduled Commercial Banks in India - Volume 41 is based on data collected through BSR 1 and 2 surveys as on March 31, 2012, which covered 1,00,805 offices of scheduled commercial banks including regional rural banks. The salient findings of the surveys are set out below: of Scheduled Commercial Banks:- 2. Growth of gross outstanding credit: At the end of March 2012 gross outstanding credit of scheduled commercial banks amounted to ` 48,032,669 million registering an increase of 17.9 per cent as against an increase of 21.8 per cent in the previous year (Table No.1.3). The number of borrowal accounts increased by 8.4 per cent to 131 million in from 121 million in 2011 (Table No. 1.3). 3. Population group-wise distribution of credit: Rural centers registered the highest growth in gross bank credit at 28.6 per cent in 2012 as compared to 18.7 per cent last year. The credit growth in Semi-urban centers increased to 20.5 per cent from 19.3 percent in Urban and Metropolitan 1 All references to the periods 2011 and 2012 will mean position as at the end of March 2011 and March 2012, respectively. Detailed data as at the end of March 2011 are available in the previous publication Basic Statistical Returns of Banks in India, Volume 40, March-2011.
8 centers registered credit growth of 14.3 and 17.2 per cent respectively, which are lower than last year s growth of 22.4 per cent each. (Table No. 1.3). The growth in gross bank credit extended by rural branches in 2012 was influenced by shifting of some large credit accounts for food procurement from Metropolitan to Rural branches. The growth in bank credit in Rural centers, excluding food procurement credit was at 22.1 per cent (Table No. 1.3). The credit growth, excluding food procurement credit, for Semi-urban, Urban and Metropolitan centers were at 21.0, 15.4 and 17.3 per cent respectively. The shares of Urban and Metropolitan centers in the incremental credit 2 in , excluding food procurement credit, were lower at 14.7 and 65.5 per cent respectively as compared to 17.4 and 68.3 per cent respectively in the previous year. The shares of Rural and Semi-urban centers, on the other hand, increased to 8.7 and 11.2 per cent respectively from 6.0 and 8.3 per cent respectively in indicating higher credit offtake in Rural and Semi-urban centers in Bank group-wise distribution of credit: The share of the Nationalized Banks in total bank credit marginally decreased to 52.4 per cent in 2012 from 53.0 per cent in Share of Private Sector Banks increased to 18.5 per cent in 2012 as compared to 17.8 per cent in The share of other bank groups remained almost unchanged (Table No.1.4). The Private Sector Banks registered the highest credit growth at 22.1 per cent followed by Foreign Banks (19.6 per cent), Regional Rural Banks (18.6 per cent), SBI & Associates (17.3 per cent) and Nationalized Banks (16.5 per cent). growth of all the bank groups (except SBI & Associates and Regional Rural Banks) declined in 2012 as compared to Of the incremental credit in , the share of Nationalized Banks declined to 48.8 per cent as compared to 57.8 per cent in The shares of other bank groups viz., Private Sector Banks (22.1 per cent), SBI & Associates (21.2 per cent), Foreign Banks (5.4 per cent) and Regional Rural Banks (2.5 per cent) in the incremental credit were higher than their respective shares in Incremental credit is the difference between amount outstanding as at the end of March in the reference year and its preceding year. ii
9 5. Sectoral (occupation-wise) deployment of bank credit: The shares of credit to Agriculture and Industrial sectors in gross bank credit increased marginally to 11.7 and 40.4 per cent respectively from 11.3 and 39.6 per cent respectively in 2011 (Table 1.11 and Chart 2). The shares of Housing loans and Other Personal loans reduced to 7.9 and 7.7 per cent respectively from 8.5 and 8.0 per cent respectively in The share of Professional & Other Services also reduced to 7.6 per cent from 9.0 per cent in The share of credit to Trade sector increased to 9.8 per cent in 2012 from 8.2 per cent in Sectoral (Occupation-wise) credit growth: The growth rate of bank credit to Agriculture sector and Industrial sector increased to 21.9 and 20.5 per cent, respectively in 2012 as compared to 18.1 and 18.9 per cent respectively in 2011 (Table 1.9). to Trade sector registered growth rate of 40.6 per cent which is significantly higher than previous year s credit growth for this sector (9.1 per cent). All other sectors witnessed lower credit growth in 2012 as compared to the previous year. to Transport operators registered 6.8 per cent growth (28.7 per cent in 2011). Housing Loans and Other Personal loans grew at 9.5 and 14.6 per cent iii
10 respectively in 2012 as compared to 12.9 and 28.4 per cent respectively in Growth in credit to Financial sector decreased to 16.5 per cent in 2012 as compared to 44.3 per cent in the previous year. to Professional and Other Services sector witnessed a small decline in 2012 as against a growth of 20.5 per cent in Sectoral (Occupation-wise) share in incremental bank credit: Shares of Agricultural sector and Industrial sector in the incremental credit increased to 13.9 and 45.3 per cent respectively in as compared to 9.7 and 35.2 per cent respectively in The Trade sector absorbed about 18.6 per cent of the incremental credit in as compared to 3.8 per cent in The share of all other sectors in incremental credit declined in as compared to The shares of Housing loans and Other Personal loans reduced to 4.5 and 6.5 per cent respectively from 5.4 and 9.8 per cent respectively in Shares of credit to Transport Operators and Financial Sector reduced to 1.0 and 8.0 per cent respectively in as compared to 3.4 and 14.7 per cent in Size-wise distribution of bank credit: The number of small borrowal accounts (with credit limit up to ` 0.2 million) contributed 83.4 per cent of the total number of borrowal accounts as against 84.6 per cent in 2011, while the share of outstanding credit of small borrowal accounts was 9.5 per cent as compared to 9.4 per cent in 2011 (Table No.1.12). with credit limit above ` 250 million each, had a share of 48.4 per cent of the total outstanding credit in 2012 as compared to 47.3 per cent in the previous year. 9. Interest rate on bank credit: The distribution of outstanding credit according to interest rate ranges (available for each account with credit limit of over ` 0.2 million) revealed a shift towards higher rates in For the interest rate range less than 10.0 per cent, the proportion of credit reduced to 10.5 per cent from 27.9 per cent in the previous year. On the other hand, the proportion of credit with interest rate 14.0 per cent and above, increased to 30.3 per cent from 15.1 per cent and for the interest rate range 10.0 per cent and iv
11 above but below 14.0 per cent, the proportion increased to 59.3 per cent from 57 per cent in the previous year (Table No. 1.13). The weighted average interest rate in respect of all loans and advances with credit limit of over ` 0.2 million worked out to be per cent as at the end of March 2012 as compared to per cent a year ago. Aggregate Deposits:- 10. Growth in aggregate deposits: Aggregate deposits amounted to ` 60,782,433 million, registering a growth of 12.8 per cent in 2012 as against 18.2 per cent in previous year (Table No.1.18). The Savings deposit grew at a much lower rate of 9.5 per cent as compared to 19.2 per cent previous year. Also, the Current deposit registered a decline of 2.7 per cent as compared to the growth of 20.7 per cent in Growth in Term deposit increased marginally to 17.4 per cent from 17.2 per cent in The number of deposit accounts in 2012 increased by 11.4 per cent to 903 million from about 810 million in Total number of savings bank account in 2012 was 703 million as compared to 624 million in Bank group-wise distribution of deposits: The share of Nationalized Banks in aggregate bank deposits reduced to 52.8 per cent in 2012 from 53.2 per cent in The share of SBI and Associates increased marginally to 21.7 per cent in 2012 from 21.4 per cent in 2011 (Table No.1.4). The deposits of the Nationalized Banks registered a growth of 12.0 per cent which is lower than the previous year s growth of 21.1 per cent. Similarly the deposits of Regional Rural Banks and Private Sector Banks registered lower growth rates of 10.9 and 12.9 per cent respectively, (15.3 and 20.5 per cent respectively in 2011). SBI and Associates registered higher deposit growth at 14.4 per cent (13.3 per cent in 2011). Also Foreign Bank s deposits grew at 15.3 per cent which is higher than previous year s growth figure of 2.9 per cent. 12. Type of deposits: The share of term deposits in total deposits increased to 62.8 per cent in 2012 from 60.4 per cent in The shares of current deposits and saving deposits declined to v
12 10.7 and 26.4 per cent, respectively in 2012 from 12.4 and 27.2 per cent in 2011 (Table No.1.18). 13. Maturity pattern of term deposits: The share of term deposits with original maturity period of 5 years and above in total term deposits increased to 9.3 per cent in 2012 from 8.8 per cent in Also, deposits with maturity 1 year to less than 2 years witnessed increase in the share to 45.7 per cent (from 40.8 per cent in 2011). (Table No.1.24) Deposits with maturity period 2 years to less than 3 years and 3 years to less than 5 years witnessed decrease in their shares to 9.4 per cent (from 12.8 per cent in 2011) and 9.9 per cent (from 11.0 per cent in 2011) respectively. The above change in maturity pattern is in tandem with the deposit interest rate structure of banks prevailed in Interest rate on term deposits: The weighted average interest rate of term deposits worked out to 9.19 per cent in 2012, as compared to 8.29 per cent in 2011 (Table No.1.28). A shift in the distribution of term deposits towards the higher interest rates is observed. The share of term deposits with interest rate less than 9.0 per cent in total term deposits decreased to 21.1 per cent in 2012 from 57.3 per cent in the previous year. Also the share of deposits with interest rate 9.0 per cent and above increased to 78.9 per cent (as compared to 42.8 per cent in 2011) with highest share of 53.0 per cent in the interest rate range per cent. (Table No.1.28 and Chart 3). vi
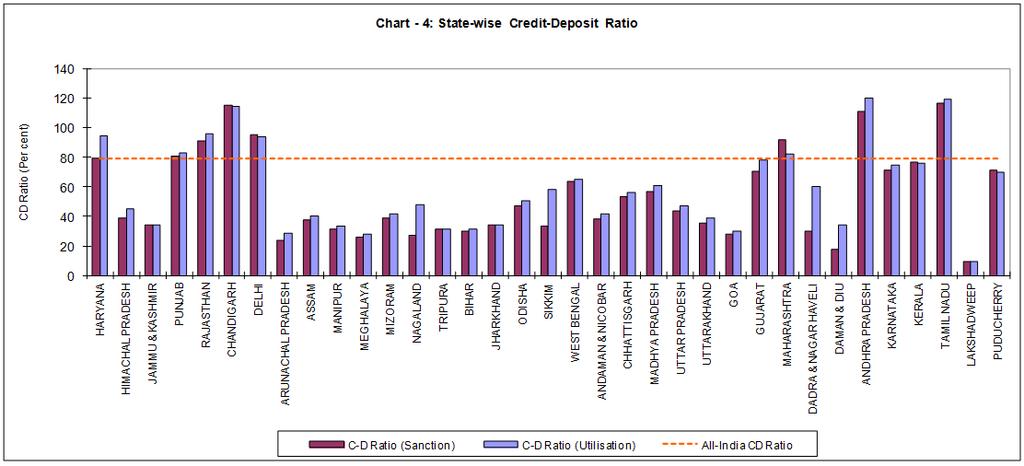
13 - Deposit Ratio:- (As per Place of Sanction and Place of Utilisation of ) 15. Population group-wise C-D Ratio: The All-India C-D ratio was at 79.0 per cent in 2012 compared to 75.6 per cent in As per place of sanction of credit, the C-D ratio in respect of Rural centers at the end of March 2012 was at 66.4 per cent as compared to 60.0 per cent in the previous year. In the case of Semi-urban, Urban and Metropolitan centers, the C-D ratios (as per place of sanction) were 54.6, 61.4 and 93.8 per cent respectively compared to 53.2, 61.6 and 88.4 per cent in the previous year. The C-D ratios as per place of utilization of credit for Rural, Semi-urban, Urban and Metropolitan centers were 77.1, 62.7, 67.2 and 87.8 per cent, respectively, compared to 79.6, 63.1, 70.2 and 79.9 per cent, respectively in the previous year. (Table No.1.6). 16. Bank group-wise C-D Ratio: The C-D ratio of SBI & Associates was at 79.3 per cent in 2012 compared to 77.3 per cent in the previous year while C-D ratio of Nationalized Banks was at 78.4 per cent (compared to 75.4 per cent in 2011). The C-D ratios of Foreign Banks (88.1 per cent), Regional Rural Banks (64.1 per cent) and Private Sector Banks (80.8 per cent) have increased in 2012 from their levels in the previous year (85.0, 59.9 and 74.7 per cent respectively). 17. Migration of credit among the states: An analysis of migration of credit among the states has been done through the -Deposit ratio, calculated as per the place of sanction and place of utilization of credit. It is observed that Haryana, Sikkim, Nagaland, Dadra & Nagar Haveli and Daman & Diu had significantly higher C-D ratio as per place of utilisation than place of sanction. (Table No. 1.7 and Chart 4) Haryana, Punjab, Rajasthan, Chandigarh, Delhi, Maharashtra, Andhra Pradesh and Tamil Nadu had higher C-D ratios as compared to all India C-D ratio of 79 per cent. Chandigarh, Andhra Pradesh and Tamil Nadu registered C-D ratio more than 100 per cent. ********************* vii
14
15 CONTENTS Section 1 : summary tables Table No. 1.1 Progress of Commercial Banking at a glance 1.2 Distribution of banking centres according to state and population group (As at the end of March 2010 and 2011) 1.3 Deposits and credit of scheduled commercial banks according to population group 1.4 Deposits and credit of scheduled commercial banks according to bank group 1.5 Deposits and credit of scheduled commercial banks according to state 1.6 Population group-wise outstanding credit of scheduled commercial banks according to place of sanction and utilisation 1.6A Population group-wise outstanding credit of scheduled commercial banks according to place of sanction and utilisation (Excluding Food Procurement ) 1.7 State-wise outstanding credit of scheduled commercial banks according to place of sanction and utilisation 1.8 State and population group-wise outstanding credit of scheduled commercial banks according to place of sanction and utilisation 1.9 credit of scheduled commercial banks according to occupation 1.10 Population group-wise outstanding credit of scheduled commercial banks according to occupation 1.11 Percentage distribution of outstanding credit of scheduled commercial banks according to population group and occupation 1.12 credit of scheduled commercial banks according to size of credit limit 1.13 credit of scheduled commercial banks according to interest rate range 1.14 credit of scheduled commercial banks according to type of account 1.15 credit of scheduled commercial banks according to organisation 1.16 Percentage distribution of outstanding credit of small borrowal accounts of scheduled commercial banks according to broad category of borrowers 1.17 Population group-wise outstanding credit of small borrowal accounts of scheduled commercial banks according to occupation 1.18 Population group-wise deposits of scheduled commercial banks according to type of deposits 1.19 Bank group-wise deposits of scheduled commercial banks according to type of deposits
16 1.20 State-wise deposits of scheduled commercial banks according to type of deposits 1.21 Population group-wise deposits of scheduled commercial banks according to broad ownership category Table No Bank group-wise deposits of scheduled commercial banks according to broad ownership category 1.23 State-wise deposits of scheduled commercial banks according to broad ownership category 1.24 Maturity pattern of term deposits of scheduled commercial banks according to broad ownership category 1.25 Maturity pattern of term deposits of scheduled commercial banks according to population group 1.26 Maturity pattern of term deposits of scheduled commercial banks according to bank group 1.27 Percentage distribution of term deposits of scheduled commercial banks according to residual maturity and broad ownership category 1.28 Percentage distribution of term deposits of scheduled commercial banks according to interest rate range and broad ownership category 1.29 Percentage distribution of term deposits of scheduled commercial banks according to size of deposit and broad ownership category 1.30 State-wise distribution of employees of scheduled commercial banks according to category 1.31 Bank group and population group-wise distribution of employees of scheduled commercial banks according to category Section 2 : Deposits and 2.1 Population group and bank group-wise deposits and credit (total credit and credit of small borrowal accounts) of scheduled commercial banks 2.2 State and bank group-wise deposits and credit (total credit and credit of small borrowal accounts) of scheduled commercial banks 2.3 State and population group-wise deposits and credit (total credit and credit of small borrowal accounts) of scheduled commercial banks Section 3 : Deposits 3.1 State and population group-wise deposits of scheduled commercial banks according to type of deposits 3.2 State and bank group-wise deposits of scheduled commercial banks according to type of deposits 3.3 Population group and bank group-wise deposits of scheduled commercial banks according to type of deposits 3.4 Maturity pattern of term deposits of scheduled commercial banks according to population group and broad ownership category 3.5 Maturity pattern of term deposits of scheduled commercial banks according to state
17 Section 4 : 4.1 Size of credit limit and interest rate range-wise classification of outstanding loans and advances of scheduled commercial banks 4.2 Interest rate range and type of account-wise classification of outstanding loans and advances of scheduled commercial banks Table No. 4.3 Interest rate range and organisation-wise classification of outstanding loans and advances of scheduled commercial banks 4.4 Type of account and organisation-wise classification of outstanding credit of scheduled commercial banks 4.5 Size of credit limit and organisation-wise classification of outstanding credit of scheduled commercial banks 4.6 Size of credit limit and type of account-wise classification of outstanding credit of scheduled commercial banks 4.7 Bank group-wise outstanding credit of scheduled commercial banks according to size of credit limit 4.8 Population group and bank group-wise outstanding credit of scheduled commercial banks according to broad ranges of credit limit 4.9 State and population group-wise outstanding credit of scheduled commercial banks 4.10 State and bank group-wise outstanding credit of scheduled commercial banks Section 5 : Occupation-wise classification of credit 5.1 Type of account-wise classification of outstanding credit of scheduled commercial banks according to occupation 5.2 Organisation-wise classification of outstanding credit of scheduled commercial banks according to occupation 5.3 Interest rate range-wise classification of outstanding loans and advances of scheduled commercial banks according to occupation 5.4 Size of credit limit-wise classification of outstanding credit of scheduled commercial banks according to occupation 5.5 Population group and bank group-wise classification of outstanding credit of scheduled commercial banks according to occupation
18 TABLE NO. 1.1 PROGRESS OF COMMERCIAL BANKING AT A GLANCE June March March March March March March March March March IMPORTANT INDICATORS Commercial Banks (a) Scheduled Commercial Banks Of which: Regional Rural Banks (b) Non-Scheduled Commercial Banks Number of Offices of Scheduled Commercial Banks in India ^ (a) Rural (b) Semi-Urban (c) Urban (d) Metropolitan Population per office (in thousands) Deposits of Scheduled Commercial Banks in India ( ` Billion ) & & of which: (a) Demand (b) Time of Scheduled Commercial Banks in India ( ` Billion ) Deposits of Scheduled Commercial Banks per office (` Million) of Scheduled Commercial Banks per office (` Million) Per Capita Deposits of Scheduled Commercial Banks (`) Per Capita of Scheduled Commercial Banks (`) Deposits of Scheduled Commercial Banks as percentage of National Income (NNP at Factor Cost, at current prices) Scheduled Commercial Banks Advances to Priority Sector (` Billion) Share of Priority Sector Advances in Total of Scheduled Commercial Banks (per cent) Share of Priority Sector Advances in Total Non-Food of Scheduled Commercial Banks (per cent) Deposit Ratio Investment Deposit Ratio Cash Deposit Ratio & Includes India Millennium Deposits (IMD) (` billion) ^ Excludes Administrative Offices See Notes on Tables.
19 TABLE NO DISTRIBUTION OF BANKING CENTRES ACCORDING TO STATE AND POPULATION GROUP (AS AT THE END OF MARCH 2011 and 2012) POPULATION GROUP RURAL SEMI-URBAN URBAN METROPOLITAN ALL CENTRES REGION/STATE/ UNION TERRITORY NORTHERN REGION Haryana Himachal Pradesh Jammu & Kashmir Punjab Rajasthan Chandigarh Delhi NORTH-EASTERN REGION Arunachal Pradesh Assam Manipur Meghalaya Mizoram Nagaland Tripura EASTERN REGION Bihar Jharkhand Orissa Sikkim West Bengal Andaman & Nicobar Islands CENTRAL REGION Chhattisgarh Madhya Pradesh Uttar Pradesh Uttaranchal WESTERN REGION Goa Gujarat Maharashtra Dadra & Nagar Haveli Daman & Diu SOUTHERN REGION Andhra Pradesh Karnataka Kerala Tamil Nadu Lakshadweep Pondicherry ALL INDIA The data are based on Master Office File of bank branches, which is regularly updated, as such, the information presented in this table is the latest and may not match with those published earlier. See Notes on Tables
20 TABLE NO. 1.3 DEPOSITS AND CREDIT OF SCHEDULED COMMERCIAL BANKS ACCORDING TO POPULATION GROUP DEPOSITS CREDIT CREDIT (Non Food )* POPULATION GROUP Offices RURAL 35, ,071, ,115, ,115, (35.6) (31.3) (9.4) (31.4) (7.9) (31.4) (7.2) SEMI-URBAN 25, ,951, ,047, ,047, (25.6) (26.6) (13.9) (23.7) (9.6) (23.7) (9.7) URBAN 20, ,626, ,442, ,442, (20.1) (20.0) (20.9) (13.3) (16.3) (13.3) (16.5) METROPOLITAN 18, ,551, ,274, ,274, (18.7) (22.1) (55.8) (31.5) (66.2) (31.5) (66.6) ALL-INDIA 100, ,200, ,881, ,880, (100.0) (100.0) (100.0) (100.0) (100.0) (100.0) (100.0) * Excluding credit extended for Food procurement.
21 TABLE NO DEPOSITS AND CREDIT OF SCHEDULED COMMERCIAL BANKS ACCORDING TO BANK GROUP BANK GROUP Offices DEPOSITS CREDIT STATE BANK OF INDIA AND ITS ASSOCIATES NATIONALISED BANKS FOREIGN BANKS REGIONAL RURAL BANKS PRIVATE SECTOR BANKS ALL SCHEDULED COMMERCIAL BANKS 19, ,946, ,119, (19.4) (25.2) (21.7) (19.2) (21.8) 50, ,585, ,794, (50.1) (49.9) (52.8) (31.9) (52.4) 324 3,923, ,411, (0.3) (0.4) (4.5) (7.2) (5.0) 16, ,438, ,728, (16.5) (12.9) (3.0) (15.8) (2.4) 13, ,306, ,828, (13.7) (11.5) (18.1) (25.8) (18.5) 100, ,200, ,881, (100.0) (100.0) (100.0) (100.0) (100.0)
22 TABLE NO DEPOSITS AND CREDIT OF SCHEDULED COMMERCIAL BANKS ACCORDING TO STATE REGION / STATE / UNION TERRITORY Offices DEPOSITS CREDIT NORTHERN REGION 17, ,519, ,671, Haryana 3,022 23,580, ,978, Himachal Pradesh 1,164 7,443, , Jammu & Kashmir 1,198 10,150, , Punjab 4,346 32,420, ,337, Rajasthan 4,936 36,014, ,244, Chandigarh 363 2,592, , Delhi 2,876 30,317, ,571, NORTH-EASTERN REGION 2,556 23,100, ,599, Arunachal Pradesh , , Assam 1,639 16,629, ,761, Manipur , , Meghalaya 237 1,390, , Mizoram , , Nagaland , , Tripura 271 2,371, , EASTERN REGION 16, ,998, ,912, Bihar 4,650 40,064, ,821, Jharkhand 2,180 17,956, ,709, Odisha 3,319 26,525, ,662, Sikkim , , West Bengal 6,061 63,642, ,647, Andaman & Nicobar Islands , , CENTRAL REGION 19, ,969, ,636, Chhattisgarh 1,597 12,669, ,072, Madhya Pradesh 4,805 40,572, ,949, Uttar Pradesh 12, ,198, ,812, Uttarakhand 1,450 9,529, , WESTERN REGION 15, ,327, ,481, Goa 521 3,868, , Gujarat 5,548 47,456, ,827, Maharashtra 9, ,365, ,397, Dadra & Nagar Haveli , , Daman & Diu , , SOUTHERN REGION 28, ,284, ,579, Andhra Pradesh 8,333 79,125, ,546, Karnataka 7,137 59,908, ,770, Kerala 5,006 36,104, ,082, Tamil Nadu 7,641 69,565, ,863, Lakshadweep 12 63, , Puducherry 171 1,517, , ALL-INDIA 100, ,200, ,881,
23 TABLE NO POPULATION GROUP-WISE OUTSTANDING CREDIT OF SCHEDULED COMMERCIAL BANKS ACCORDING TO PLACE OF SANCTION AND UTILISATION AS PER PLACE OF SANCTION AS PER PLACE OF UTILISATION POPULATION GROUP Deposit Ratio Deposit Ratio RURAL 41,115, ,749, SEMI-URBAN 31,047, ,292, URBAN 17,442, ,740, METROPOLITAN 41,274, ,099, ALL-INDIA 130,881, ,881,
24 TABLE NO. 1.6A - POPULATION GROUP-WISE OUTSTANDING CREDIT OF SCHEDULED COMMERCIAL BANKS ACCORDING TO PLACE OF SANCTION AND UTILISATION (Excluding Food Procurement ) - AS PER PLACE OF SANCTION AS PER PLACE OF UTILISATION POPULATION GROUP Deposit Ratio Deposit Ratio RURAL 41,115, ,749, SEMI-URBAN 31,047, ,292, URBAN 17,442, ,740, METROPOLITAN 41,274, ,098, ALL-INDIA 130,880, ,880, Note: Excluding credit extended for Food procurement.
25
26 TABLE NO STATE-WISE OUTSTANDING CREDIT OF SCHEDULED COMMERCIAL BANKS ACCORDING TO PLACE OF SANCTION AND UTILISATION REGION / STATE / UNION TERRITORY Total Sanctioned in the State Utilised in the State of Sanction Sanctioned Utilised in the State in the but Utilised State but in Other Sanctioned in States Other States Total Utilised in the State -Deposit Ratio As per Sanction (per cent) As per Utilisation (per cent) NORTHERN REGION Haryana Himachal Pradesh Jammu & Kashmir Punjab Rajasthan Chandigarh Delhi NORTH-EASTERN REGION Arunachal Pradesh Assam Manipur Meghalaya Mizoram Nagaland Tripura EASTERN REGION Bihar Jharkhand Odisha Sikkim West Bengal Andaman & Nicobar Islands CENTRAL REGION Chhattisgarh Madhya Pradesh Uttar Pradesh Uttarakhand WESTERN REGION Goa Gujarat Maharashtra Dadra & Nagar Haveli Daman & Diu SOUTHERN REGION Andhra Pradesh Karnataka Kerala Tamil Nadu Lakshadweep Puducherry ALL-INDIA
27 TABLE NO STATE AND POPULATION GROUP-WISE OUTSTANDING CREDIT OF SCHEDULED COMMERCIAL BANKS ACCORDING TO PLACE OF SANCTION AND UTILISATION RURAL SEMI-URBAN URBAN METROPOLITAN TOTAL REGION / STATE / UNION TERRITORY Sanction Utilisation Sanction Utilisation Sanction Utilisation Sanction Utilisation Sanction Utilisation NORTHERN REGION Haryana Himachal Pradesh Jammu & Kashmir Punjab Rajasthan Chandigarh Delhi NORTH-EASTERN REGION Arunachal Pradesh Assam Manipur Meghalaya Mizoram Nagaland Tripura EASTERN REGION Bihar Jharkhand Odisha Sikkim West Bengal Andaman & Nicobar Islands CENTRAL REGION Chhattisgarh Madhya Pradesh Uttar Pradesh Uttarakhand WESTERN REGION Goa Gujarat Maharashtra Dadra & Nagar Haveli Daman & Diu SOUTHERN REGION Andhra Pradesh Karnataka Kerala Tamil Nadu Lakshadweep Puducherry ALL-INDIA
REPORT ON THE WORKING OF THE MATERNITY BENEFIT ACT, 1961 FOR THE YEAR 2010
 REPORT ON THE WORKING OF THE MATERNITY BENEFIT ACT, 1961 FOR THE YEAR 2010 1. Scope and Objective 1.1 The Maternity Benefit Act, 1961 extends to the whole of the Indian Union and applies to every factory,
Post and Telecommunications
 Post and Telecommunications This section presents operating and financial data relating to the different branches of the Department of Posts including the Post Office Savings Banks. It comprises statistics
POPULATION PROJECTIONS Figures Maps Tables/Statements Notes
 8 POPULATION PROJECTIONS Figures Maps Tables/Statements 8 Population projections It is of interest to examine the variation of the Provisional Population Totals of Census 2011 with the figures projected
Note on ICP-CPI Synergies: an Indian Perspective and Experience
 2 nd Meeting of the Country Operational Guidelines Task Force March 12, 2018 World Bank, Washington, DC Note on ICP-CPI Synergies: an Indian Perspective and Experience 1. Meaning and Scope 1.1 International
International Journal for Research in Applied Science & Engineering Technology (IJRASET) Status of Urban Co-Operative Banks in India
 Status of Urban Co-Operative Banks in India") Status of Urban Co-Operative Banks in India Siddhartha S Vishwam 1, Dr. B. S. Chandrashekar 2 1 Research Scholar, DOS in Economics and Co-operation, University of Mysore, Manasagangothri, Mysore 2 Assistant
Status of Urban Co-Operative Banks in India Siddhartha S Vishwam 1, Dr. B. S. Chandrashekar 2 1 Research Scholar, DOS in Economics and Co-operation, University of Mysore, Manasagangothri, Mysore 2 Assistant
JOINT STOCK COMPANIES
 This section contains statistics relating to joint stock companies which are based on returns received from Registrars of Joint Stock Companies. Tables 25.1 (A) (B) to 25.4 These tables present data regarding
Insolvency Professionals to act as Interim Resolution Professionals or Liquidators (Recommendation) Guidelines, 2018
 Guidelines, 2018") Insolvency Professionals to act as Interim Resolution Professionals or Liquidators (Recommendation) Guidelines, 2018 Provisions in the Insolvency and Bankruptcy Code, 2016 31 st May, 2018 1. Section 16(3)(a)
Insolvency Professionals to act as Interim Resolution Professionals or Liquidators (Recommendation) Guidelines, 2018 Provisions in the Insolvency and Bankruptcy Code, 2016 31 st May, 2018 1. Section 16(3)(a)
4.4 Building Name 4.5 Block/Sector. 4.8 City 4.9 State Code (Refer to State Code in instructions)
") FORM No. 61A [See rule 114E] Annual Information Return under section 285BA of the Income -tax Act, 1961 (PART-A) Please see the instructions and fill up relevant columns 1. Name of the person (in block
FORM No. 61A [See rule 114E] Annual Information Return under section 285BA of the Income -tax Act, 1961 (PART-A) Please see the instructions and fill up relevant columns 1. Name of the person (in block
Financial Results Q3/FY February 2019
 Financial Results Q3/FY18-19 08 February 2019 HIGHLIGHTS - DEC 2018 Total Business Total Deposit Gross Advance Operating Profit (Q-3) Rs. 291519 Crore Rs. 177906 Crore Rs.113610 Crore Rs. 381 Crore Basel
Dr. Najmi Shabbir Lecturer Shia P.G. College, Lucknow
 Banking Development after Nationalization and Social Control in India (1967 To 1991) Dr. Najmi Shabbir Lecturer Shia P.G. College, Lucknow Abstract: This paper mainly analyses the impact of Nationalisation
ROLE OF PRIVATE SECTOR BANKS FOR FINANCIAL INCLUSION
 270 ROLE OF PRIVATE SECTOR BANKS FOR FINANCIAL INCLUSION ABSTRACT DR. BIMAL ANJUM*; RAJESHTIWARI** *Professor and Head, Department of Business Administration, RIMT-IET, Mandi Gobindgarh, Punjab. **Assistant
... (Please leave one blank box between two words) 2. Permanent Account Number (PAN) of the person (see instructions)
 2. Permanent Account Number (PAN) of the person (see instructions)") FORM NO. 66 [See rule 114E of income-tax rules, 1962] Annual Information Return under section 285BA of the Income-tax Act, 1961 (PART-A) Please see the instructions and fill up relevant columns Name of
FORM NO. 66 [See rule 114E of income-tax rules, 1962] Annual Information Return under section 285BA of the Income-tax Act, 1961 (PART-A) Please see the instructions and fill up relevant columns Name of
2011: Annexure I. Guidelines/Norms for Utilization of Funds for conducting Soeio-Economic and Caste Census
 Annexure I I. 2. 3. 4. 5. 6. 7. 8. 9. 10. 11. 12. 13. 14. Guidelines/Norms for Utilization of Funds for conducting Soeio-Economic and Caste Census 2011: State wise Number of s may be taken as per population
STATE DOMESTIC PRODUCT
 CHAPTER 4 STATE DOMESTIC PRODUCT The State Domestic Product (SDP) commonly known as State Income is one of the important indicators to measure the economic development of the State. In the context of planned
EXPORT OF GOODS AND SOFTWARE REALISATION AND REPATRIATION OF EXPORT PROCEEDS LIBERALISATION
 Corporate Law Alert J. Sagar Associates advocates and solicitors Vol.16 April 30, 2011 RBI EXPORT OF GOODS AND SOFTWARE REALISATION AND REPATRIATION OF EXPORT PROCEEDS LIBERALISATION The Reserve Bank of
Microfinance Industry Penetration in India: A State - wise Analysis in Context of Micro Credit
 24 Microfinance Industry Penetration in India: A State - wise Analysis in Context of Micro Credit Laxmi Devi, Assistant Professor, Gargi College, University of Delhi Umed Yadav, Student, Dept. of Commerce,
IJPSS Volume 2, Issue 9 ISSN:
 REGIONAL DISPARITY IN THE DISTRIBUTION OF AGRICULTURAL CREDIT DR.S.GANDHIMATHI* DR.P.AMBIGADEVI** V.SHOBANA*** _ ABSTRACT The Eleventh Five year plan makes specific focus on the inclusive growth of the
Banking Sector Liberalization in India: Some Disturbing Trends
 SPECIAL REPORT Banking Sector Liberalization in India: Some Disturbing Trends Kavaljit Singh In the first week of August 2005, Reserve Bank of India (RBI), country s central bank, issued a list of 391
FORM L-1-A : Revenue Account. FORM L-1-A : Revenue Account UP TO THE QUARTER ENDED ON JUNE Non Participating (Linked) Total
 Total") Insurer : DHFL Pramerica Insurance Company Limited Registration No. 140 ; Date of Registration with the IRDAI: June 27, 2008 Revenue Account For the quarter Ended June 30, 2017 FORM L-1-A : Revenue Account
Insurer : DHFL Pramerica Insurance Company Limited Registration No. 140 ; Date of Registration with the IRDAI: June 27, 2008 Revenue Account For the quarter Ended June 30, 2017 FORM L-1-A : Revenue Account
The detailed press note issued by Ministry of Statistics & Programme Implementation is attached herewith for information of the members.
 TO ALL MEMBERS: th August Consumer Price Numbers on Base = for Rural, Urban and Combined for the Month of July July Consumer Price (CPI) rose to. % against.% for the month of June. CPI Urban Inflation
Commercial Banks, Financial Inclusion and Economic Growth in India
 International Journal of Business and Management Invention ISSN (Online): 2319 8028, ISSN (Print): 2319 801X Volume 2 Issue 5 ǁ May. 2013ǁ PP.01-06 Commercial Banks, Financial Inclusion and Economic Growth
State Government Borrowing: April September 2015
 November 5, 2015 Economics State Government Borrowing: April September 2015 State Development Loans (SDL) are debt issued by state governments to fund their fiscal deficit. States in India like the centre,
Financial Results Q2 & H1 FY November 06, 2015
 Financial Results Q2 & H1 FY 2015-16 November 06, 2015 Highest Gainer in Brand Value Brand value rises 72% on accelerated digitalization efforts. 2 Structural Transformation Initiative 3 Performance Highlights
Eligible students have to contact our branches where they have availed/availing loans.
 Eligible students have to contact our branches where they have availed/availing loans. The last date for Banks to submit subsidy claims to Nodal Bank is 31.08.2014. Hence, we advise the students to submit
CONTENTS A BRIEF HISTORY AND FUNCTIONING OF THE RNI OFFICE 1-10 GENERAL REVIEW 11-15
 CONTENTS INTRODUCTORY CHAPTER Page CHAPTER 1 CHAPTER 2 CHAPTER 3 CHAPTER 4 CHAPTER 5 CHAPTER 6 A BRIEF HISTORY AND FUNCTIONING OF THE RNI OFFICE 1-10 GENERAL REVIEW 11-15 Analysis of Daily Publications
Analyzing Data of Pradhan Mantri Jan Dhan Yojana
 Technical Report 217 Analyzing Data of Pradhan Mantri Jan Dhan Yojana Tulika Dutta and Ashish Das Department of Mathematics Indian Institute of Technology Bombay Mumbai-476, India May 217 Indian Institute
GOVERNMENT OF INDIA MINISTRY OF HOME AFFAIRS LOK SABHA UNSTARRED QUESTION NO. 2557
 GOVERNMENT OF INDIA MINISTRY OF HOME AFFAIRS LOK SABHA UNSTARRED QUESTION NO. 2557 TO BE ANSWERED ON THE 01 ST AUGUST, 2017 / SHRAVANA 10, 1939 (SAKA) PENSION TO FREEDOM FIGHTERS 2557. SHRI TAMRADHWAJ
Financial Results Q1 FY July 28, 2015
 Financial Results Q1 FY 2015-16 July 28, 2015 A Step Towards Digitalization 2 Performance Highlights Business Opex Profitability Global Business increased by 8.6% to ` 582817 crore Savings Deposits grew
IRDA PUBLIC DISCLOSURES FOR THE QUARTER ENDED JUNE 30, 2014
 IRDA PUBLIC DISCLOSURES FOR THE QUARTER ENDED JUNE 30, 2014 Name of the Insurer: HDFC Standard Life Insurance Company Limited Registration Number and Date of Registration with the IRDA : 101 dated 23rd
THE INDIAN HOUSEHOLD SAVINGS LANDSCAPE
 THE INDIAN HOUSEHOLD SAVINGS LANDSCAPE Cristian Badarinza National University of Singapore Vimal Balasubramaniam University of Oxford Tarun Ramadorai University of Oxford, CEPR and NCAER July 2016 Savings
GST Concept and Design
 GST Concept and Design GST Understanding from the First discussion paper released by the Empowered Committee of State Finance Ministers on November 10, 2009 1 Understanding GST Brief History Need for GST
Disclosures - LIFE INSURANCE COMPANIES- WEBSITE
 Disclosures - LIFE INSURANCE COMPANIES- WEBSITE Form NO. L-1-A-RA L-2-A-PL L-3-A-BS L-4-PREMIUM SCHEDULE L-5-COMMISSION SCHEDULE L-6-OPERATING EXPENSES SCHEDULE L-7-BENEFITS PAID SCHEDULE L-8-SHARE CAPITAL
GOVERNMENT OF INDIA MINISTRY OF AGRICULTURE AND FARMERS WELFARE DEPARTMENT OF AGRICULTURE, COOPERATION AND FARMERS WELFARE
 GOVERNMENT OF INDIA MINISTRY OF AGRICULTURE AND FARMERS WELFARE DEPARTMENT OF AGRICULTURE, COOPERATION AND FARMERS WELFARE 425 SHRI VENKATESH BABU T.G.: SHRI KESHAV PRASAD MAURYA: DR. A. SAMPATH: ADV.
GOVERNMENT OF INDIA MINISTRY OF FINANCE DEPARTMENT OF REVENUE (CENTRAL BOARD OF DIRECT TAXES) NOTIFICATION INCOME-TAX
 NOTIFICATION INCOME-TAX") [TO BE PUBLISHED IN THE GAZETTE OF INDIA (EXTRAORDINARY) PART II, SECTION 3, SUB-SECTION (ii)] GOVERNMENT OF INDIA MINISTRY OF FINANCE DEPARTMENT OF REVENUE (CENTRAL BOARD OF DIRECT TAXES).. NOTIFICATION
[TO BE PUBLISHED IN THE GAZETTE OF INDIA (EXTRAORDINARY) PART II, SECTION 3, SUB-SECTION (ii)] GOVERNMENT OF INDIA MINISTRY OF FINANCE DEPARTMENT OF REVENUE (CENTRAL BOARD OF DIRECT TAXES).. NOTIFICATION
GST Update M.S. CHHAJED & CO. GST UPDATE 2/
 GST Update 02 2018-19 01st June 2018 FOR PRIVATE CIRCULATION ONLY M.S. CHHAJED & CO. GST UPDATE 2/18-19 1 E-way Bill Now E-way Bill shall be required to be generated for intra-state movement of goods in
IRDA Public Disclosures
 IRDA Public Disclosures QUARTER ENDED 31st DEC 2018 Aviva Life Insurance Company India Limited S. No. Form No. Description Page No. 1 L-1 REVENUE ACCOUNT 1-2 2 L-2 PROFIT & LOSS ACCOUNT 3 3 L-3 BALANCE
IRDA Public Disclosures
 IRDA Public Disclosures QUARTER ENDED 31st MARCH 2018 Aviva Life Insurance Company India Limited S. No. Form No. Description Page No. 1 L-1 REVENUE ACCOUNT 1-2 2 L-2 PROFIT & LOSS ACCOUNT 3 3 L-3 BALANCE
Investor Presentation
 FINANCIAL RESULTS FOR THE QUARTER & NINE-MONTH ENDED DEC 2013 Investor Presentation UCO BANK 1 BANKS OPERATING ENVIRONMENT Positives in Q3: Improving liquidity situation Ebbing stress on cost of funds
A Study of Corruption for Issuing Aadharr Card in India by Using Mathematical Modeling
 International Refereed Journal of Engineering and Science (IRJES) ISSN (Online) 2319-183X, (Print) 2319-1821 Volume 7, Issue 2 (February 2018), PP. 57-64 A Study of Corruption for Issuing Aadharr Card
FINANCIAL INCLUSION: PRESENT SCENARIO OF PRADHAN MANTRI JAN DHAN YOJANA SCHEME IN INDIA
 FINANCIAL INCLUSION: PRESENT SCENARIO OF PRADHAN MANTRI JAN DHAN YOJANA SCHEME IN INDIA *Dr. P. Chellasamy Associate Professor, School of commerce, Bharathiar University, Coimbatore. **Mr. R. Selvakumar
Schemes->Margin Money Scheme of Khadi & Village Industries Commission (KVIC) MARGIN MONEY SCHEME OF KHADI & VILLAGE INDUSTRIES COMMISSION (KVIC)
 MARGIN MONEY SCHEME OF KHADI & VILLAGE INDUSTRIES COMMISSION (KVIC)") Schemes->Margin Money Scheme of Khadi & Village Industries Commission (KVIC) MARGIN MONEY SCHEME OF KHADI & VILLAGE INDUSTRIES COMMISSION (KVIC) Implementing Agency Official(s) to be contacted Khadi &
Schemes->Margin Money Scheme of Khadi & Village Industries Commission (KVIC) MARGIN MONEY SCHEME OF KHADI & VILLAGE INDUSTRIES COMMISSION (KVIC) Implementing Agency Official(s) to be contacted Khadi &
FORM L-1-A : Revenue Account. FORM L-1-A : Revenue Account UP TO THE QUARTER ENDED ON JUNE Non Participating. (Linked) Individual
 Individual") Insurer : DHFL Pramerica Insurance Company Limited Registration No. 140 ; Date of Registration with the IRDAI: June 27, 2008 Revenue Account For the quarter Ended March 31, 2018 FORM L-1-A : Revenue Account
Insurer : DHFL Pramerica Insurance Company Limited Registration No. 140 ; Date of Registration with the IRDAI: June 27, 2008 Revenue Account For the quarter Ended March 31, 2018 FORM L-1-A : Revenue Account
Indian Regional Rural Banks Growth and Performance
 Indian Regional Rural Banks Growth and Performance Syed Mahammad Ghouse ghouse.marium@gmail.com Narayana Reddy tnreddy.jntua@gmail JNTU College of Engineering Regional rural Banks play a vital role for
PERIODIC DISCLOSURES FORM NL-1-A-REVENUE ACCOUNT TATA AIG GENERAL INSURANCE COMPANY LIMITED IRDAI Registration No. 108, dated January 22, 2001
 FORM NL-1-A-REVENUE ACCOUNT IRDAI Registration No. 18, dated January 22, 21 1 Premium earned (Net) NL-4- Premium Schedule 2 Profit/ Loss on sale/redemption of Investments Schedule REVENUE ACCOUNT FOR THE
IRDA Public Disclosures
 IRDA Public Disclosures QUARTER ENDED 31st DECEMBER 2016 Aviva Life Insurance Company India Limited S. No. Form No. Description Page No. 1 L-1 REVENUE ACCOUNT 1-2 2 L-2 PROFIT & LOSS ACCOUNT 3 3 L-3 BALANCE
Measuring Outreach of Microfinance in India Towards A Comprehensive Index
 From the SelectedWorks of Dr. Arindam Laha January, 2012 Measuring Outreach of Microfinance in India Towards A Comprehensive Index Dr. Arindam Laha Prof. Pravat Kumar Kuri Available at: https://works.bepress.com/arindam_laha/8/
DF-3 Capital Adequacy- Qualitative Disclosure
 DF-3 Capital Adequacy- Qualitative Disclosure The Bank actively manages its capital requirement by taking in to account the current and future Business growth of the Bank. Stress tests are used as a part
FARMER SUICIDES. Will the Minister of AGRICULTURE AND FARMERS WELFARE क य ण ½ãâ ããè be pleased to state:
 O.I.H. GOVERNMENT OF INDIA MINISTRY OF AGRICULTURE AND FARMERS WELFARE DEPARTMENT OF AGRICULTURE, COOPERATION AND FARMERS WELFARE LOK SABHA UNSTARRED QUESTION NO.3442 TO BE ANSWERED ON THE 6 TH DECEMBER,
CONTENTS AT A GLANCE DIRECT TAX INDIRECT TAX CORPORATE LAWS
 November 2016 / Volume VIII / ASA The key amendments introduced in statutes, policies and procedures in respect of Direct Tax, Indirect Tax, Corporate Laws & Accounting Standards, Foreign Exchange Management
IRDA Public Disclosures
 IRDA Public Disclosures QUARTER ENDED 31st MARCH 2017 Aviva Life Insurance Company India Limited S. No. Form No. Description Page No. 1 L-1 REVENUE ACCOUNT 1-2 2 L-2 PROFIT & LOSS ACCOUNT 3 3 L-3 BALANCE
1,14,915 cr GoI allocations for Ministry of Rural Development (MoRD) in FY
 in FY") BUDGET BRIEFS Vol 1/ Issue 9 Mahatma Gandhi National Rural Employment Guarantee Scheme (MGNREGS), GoI, 218-19 HIGHLIGHTS Mahatma Gandhi National Rural Employment Guarantee Scheme (MGNREGS) is a flagship
BUDGET BRIEFS Vol 1/ Issue 9 Mahatma Gandhi National Rural Employment Guarantee Scheme (MGNREGS), GoI, 218-19 HIGHLIGHTS Mahatma Gandhi National Rural Employment Guarantee Scheme (MGNREGS) is a flagship
Year Ended March 31, 2011
 FORM NL-1-B-RA Name of the Insurer: TATA AIG GENERAL INSURANCE COMPANY LIMITED IRDA Registration No. 108, dated January 22, 2001 REVENUE ACCOUNT FOR THE YEAR ENDED MARCH 31, 2011 Particulars Schedule Year
V Leeladhar: Taking banking services to the common man - financial inclusion
 V Leeladhar: Taking banking services to the common man - financial inclusion Commemorative lecture by Mr V Leeladhar, Deputy Governor of the Reserve Bank of India, at the Fedbank Hormis Memorial Foundation,
Fire Marine Miscellaneous Total Fire Marine Miscellaneous Total 3,37,441 23,19,275 2,14,17,685 2,40,74,401 2,67,675 22,58,259 1,81,45,741 2,06,71,675
 FORM NL-1-B-RA Name of the Insurer: TATA AIG GENERAL INSURANCE COMPANY IRDA Registration No. 108, dated January 22, 2001 REVENUE ACCOUNT FOR THE YEAR ENDED Particulars Schedule For the YEAR ENDED For the
Dependence of States on Central Transfers: State-wise Analysis
 Dependence of States on Central : State-wise Analysis C. Bhujanga Rao and D. K. Srivastava Working Paper No. 2014-137 May 2014 National Institute of Public Finance and Policy New Delhi http://www.nipfp.org.in
By : Brijesh Srivastava, Principal Systems Analyst(NIC-DRD)
") ग र म ण व क स म त र ऱय भ रत सरक र MINISTRY OF RURAL DEVELOPMENT Government of India DBT in National Social Assistance Programme NIC-Department of Rural Development Krishi Bhawan, MoRD By : Brijesh Srivastava,
ग र म ण व क स म त र ऱय भ रत सरक र MINISTRY OF RURAL DEVELOPMENT Government of India DBT in National Social Assistance Programme NIC-Department of Rural Development Krishi Bhawan, MoRD By : Brijesh Srivastava,
Customers perception on Pradan Manthri Jan Dhan Yojana in Shivamogga District of Karnataka State, India.
 Customers perception on Pradan Manthri Jan Dhan Yojana in Shivamogga District of Karnataka State, India. by Mr. Anand M B [a] & Dr. H H Ramesh [b] Abstract Government is responsible for end financial untouchability,
SOLAR ENERGY CORPORATION OF INDIA LIMITED DRAFT 1000 MW GRID CONNECTED ROOF TOP SOLAR PV SCHEME FOR GOVERNMENT BUILDINGS UNDER CAPEX AND RESCO MODELS
 SOLAR ENERGY CORPORATION OF INDIA LIMITED DRAFT 1000 MW GRID CONNECTED ROOF TOP SOLAR PV SCHEME FOR GOVERNMENT BUILDINGS UNDER CAPEX AND RESCO MODELS 1000 MW GRID CONNECTED ROOF TOP SOLAR PV SYSTEM SCHEME
AN EVALUATION OF FINANCIAL INCLUSION
 AN EVALUATION OF FINANCIAL INCLUSION 1 2 3 Mary Sunita Dutto, Namratha R D, Dr. R. Himachalapathy 1 Research Scholar, St. Joseph's College of Commerce, Bangalore 2 Research Scholar, St. Joseph's College
Q4 FY 13. Investor Information
 Q4 FY 13 Investor Information Key Messages : FY 13 Retail Advance grew by 25.47% (12.58%) SME Advance grew by 22.44% (9.49%) Retail & SME Customer base increased by 79.8% in 12 months (32.90%) Other Income
FEE RULES. o Samples/models actual cost; o Postal charges additional; o Inspection of records 1st hour free and Rs 5 for each subsequent 15 mins.
 FEE RULES Government Andhra Pradesh Application Fees No fee at village level; Rs 5 at mandal level; Rs 10 for all other public Additional Fees o A4/A3 paper Rs 2 per o Larger paper actual cost; o Priced
Tally.ERP 9 Series A Release 1.5 Stat.900 Version 89. Release Notes
 Tally.ERP 9 Series A Release 1.5 Stat.900 Version 89 Release Notes August 15, 2009 The information contained in this document is current as of the date of publication and subject to change. Because Tally
The Critical Role of Micro, Small & Medium Enterprises in Employment Generation: An Indian Experience
 Asian Social Science; Vol. 11, No. 24; 2015 ISSN 1911-2017 E-ISSN 1911-2025 Published by Canadian Center of Science and Education The Critical Role of Micro, Small & Medium Enterprises in Employment Generation:
OUTSTANDING GOVERNMENT DEBT
 48 CCIL ISIN Monthly Newsletter d OUTSTANDING GOVERNMENT DEBT TABLE 3: OUTSTANDING GOVERNMENT DEBT Yield Yield (Previous Month) Mod V+ ( V- ( Modified 100bps 100bps Expected price a 100bps rise in yield
GOVERNMENT OF INDIA MINISTRY OF AGRICULTURE AND FARMERS WELFARE DEPARTMENT OF AGRICULTURE, COOPERATION AND FARMERS WELFARE
 GOVERNMENT OF INDIA MINISTRY OF AGRICULTURE AND FARMERS WELFARE DEPARTMENT OF AGRICULTURE, COOPERATION AND FARMERS WELFARE 748. PROF. SAUGATA ROY: LOK SABHA UNSTARRED QUESTION NO. 748 TO BE ANSWERED ON
Forthcoming in Yojana, May Composite Development Index: An Explanatory Note
 1. Introduction Forthcoming in Yojana, May 2014 Composite Development Index: An Explanatory Note Bharat Ramaswami Economics & Planning Unit Indian Statistical Institute, Delhi Centre In May 2013, the Government
A Class 2 Digital Signature Certificate is available for download after verification based on a trusted and pre-verified database.
 S No. 1 2 3 4 5 New Description of Services DSC Class-2/2 Years/Signature DSC Class-2/ 2 Years/ Combo DSC Class-3/2 Years/Signature DSC Class-3/ 1 Year/ Combo DSC Class-3/ 2 Year/ Combo 6 DSC Token Legends
GUIDELINES FOR ELECTRONIC TRANSMISSION OF ACCOUNTING DATA UNDER THE CPPC SYSTEM BY AUTHORIZED BANKS. [e-scroll]
![GUIDELINES FOR ELECTRONIC TRANSMISSION OF ACCOUNTING DATA UNDER THE CPPC SYSTEM BY AUTHORIZED BANKS. [e-scroll]](/thumbs/89/100576287.jpg "GUIDELINES FOR ELECTRONIC TRANSMISSION OF ACCOUNTING DATA UNDER THE CPPC SYSTEM BY AUTHORIZED BANKS. [e-scroll]") GUIDELINES FOR ELECTRONIC TRANSMISSION OF ACCOUNTING DATA UNDER THE CPPC SYSTEM BY AUTHORIZED BANKS [e-scroll] [Version 2.5] Date of Release: 18/09/2010 Central Pension Accounting Office Ministry of Finance
GUIDELINES FOR ELECTRONIC TRANSMISSION OF ACCOUNTING DATA UNDER THE CPPC SYSTEM BY AUTHORIZED BANKS [e-scroll] [Version 2.5] Date of Release: 18/09/2010 Central Pension Accounting Office Ministry of Finance
OUTSTANDING GOVERNMENT DEBT
 ISIN Security OUTSTANDING GOVERNMENT DEBT TABLE 3: OUTSTANDING GOVERNMENT DEBT (Previous Month) Mod V+ (for V- (for Modified for 100bps for 100 bps Expected price for a 100bps rise in yield due to and
CENTRAL WAREHOUSING CORPORATION (A GOVT. OF INDIA UNDERTAKING)
") CENTRAL WAREHOUSING CORPORATION (A GOVT. OF INDIA UNDERTAKING) No. CWC/FD- Taxation/GST/2017-18 Dated: 30.01.2018 GST FAQs-5 1. All the Regional Managers of CWC 2. All the Executive Engineers in -charge
CENTRAL WAREHOUSING CORPORATION (A GOVT. OF INDIA UNDERTAKING) No. CWC/FD- Taxation/GST/2017-18 Dated: 30.01.2018 GST FAQs-5 1. All the Regional Managers of CWC 2. All the Executive Engineers in -charge
POVERTY ESTIMATES IN INDIA: SOME KEY ISSUES
 ERD Working Paper No. 51 POVERTY ESTIMATES IN INDIA: SOME KEY ISSUES SAVITA SHARMA May 2004 Savita Sharma is Director of the Perspective Planning Division, Planning Commission, India. This paper was prepared
LIBRARY NATIONAL INSTITUTE OF PUBLIC FINANCE AND POLICY 18/2- SATSANG VIHAR MARG, SPECIAL INSTITUTIONAL AREA,
 LIBRARY NATIONAL INSTITUTE OF PUBLIC FINANCE AND POLICY 18/2- SATSANG VIHAR MARG, SPECIAL INSTITUTIONAL AREA, New Delhi-110067 1 CURRENT AWARENESS SERVICE [ New Arrivals of Books ] [ Volume 12; Issue No.
Particulars Schedule FOR THE QUARTER ENDED MARCH 31, (a) Premium 7,708,794 22,405,865 8,363,801 24,295,165
 Premium 7,708,794 22,405,865 8,363,801 24,295,165") FORM L-1-A-RA Name of the Insurer: PNB MetLife India Insurance Company Limited Registration No. and Date of Registration with the IRDA:117, August 6, 2001 REVENUE ACCOUNT FOR THE YEAR ENDED MARCH 31, 2014
FORM L-1-A-RA Name of the Insurer: PNB MetLife India Insurance Company Limited Registration No. and Date of Registration with the IRDA:117, August 6, 2001 REVENUE ACCOUNT FOR THE YEAR ENDED MARCH 31, 2014
IRDA Public Disclosures
 IRDA Public Disclosures QUARTER ENDED 31st DECEMBER 2017 Aviva Life Insurance Company India Limited S. No. Form No. Description Page No. 1 L-1 REVENUE ACCOUNT 1-2 2 L-2 PROFIT & LOSS ACCOUNT 3 3 L-3 BALANCE
1,07,758 cr GoI allocations for Ministry of Rural Development (MoRD) in FY
 in FY") BUDGET BRIEFS Vol 10/ Issue 9 Mahatma Gandhi National Rural Employment Guarantee Scheme (MGNREGS), GoI, 2017-18 HIGHLIGHTS Mahatma Gandhi National Rural Employment Guarantee Scheme (MGNREGS) is a flagship
BUDGET BRIEFS Vol 10/ Issue 9 Mahatma Gandhi National Rural Employment Guarantee Scheme (MGNREGS), GoI, 2017-18 HIGHLIGHTS Mahatma Gandhi National Rural Employment Guarantee Scheme (MGNREGS) is a flagship
India s CSR reporting survey 2018
 India s CSR reporting survey 2018 December 2018 kpmg.com/in 1 Foreword Contents The combination of a forward thinking corporate sector and the propulsion generated by Section 135 of the Companies Act,
Micro Finance and Poverty Alleviation: An Analysis with SHGS Contribution
 Micro Finance and Poverty Alleviation: An Analysis with SHGS Contribution P.BALAMURUGAN Research Staff, ICSSR Sponsored Major Research Project, Gobi Arts & Science College, Gobichettipalayam Tamil Nadu
Analysis of State Budgets :
 Analysis of State Budgets 2017-18: Emerging Issues policy brief on state finances 2017 Pinaki Chakraborty Manish Gupta Lekha Chakraborty Amandeep Kaur 1 Introduction While the Union Government finances
Senior Citizens: Problems and Welfare
 LOK SABHA SECRETARIAT PARLIAMENT LIBRARY AND REFERENCE, RESEARCH, DOCUMENTATION AND INFORMATION SERVICE (LARRDIS) MEMBERS REFERENCE SERVICE REFERENCE NOTE. No.27/RN/Ref./2013 For the use of Members of
Disclosures -NON LIFE INSURANCE COMPANIES
 Disclosures -NON LIFE INSURANCE COMPANIES Sr No Form No Description 1 NL-1-B-RA Revenue Account 2 NL-2-B-PL Profit & Loss Account 3 NL-3-B-BS Balance Sheet 4 NL-4-PREMIUM SCHEDULE Premium 5 NL-5-CLAIMS
14 th Finance Commission: Review and Outcomes. Economics. February 25, 2015
 February 25, 2015 Economics 14 th Finance Commission: Review and Outcomes The 14th Finance Commission (FFC) was constituted on 2nd January, 2013 and submitted its report on 15 th December, 2014. The recommendations
Investor Presentation Q3 FY 12
 Investor Presentation Q3 FY 12 Performance Highlights Profitability Measure ROA 1.30 1.44 1.41 11.37 14.29 14.56 Shareholder Value Measure ROE 37.30 38.91 37.13 Efficiency Measure COST-INCOME 0.81 0.58
(b) whether the Government has paid insurance claims as compensation for damage of crops due to floods and drought during the current year;
 whether the Government has paid insurance claims as compensation for damage of crops due to floods and drought during the current year;") O.I.H. GOVERNMENT OF INDIA MINISTRY OF AGRICULTURE AND FARMERS WELFARE DEPARTMENT OF AGRICULTURE, COOPERATION AND FARMERS WELFARE LOK SABHA UNSTARRED QUESTION NO.2026 TO BE ANSWERED ON THE 14 TH MARCH,
O.I.H. GOVERNMENT OF INDIA MINISTRY OF AGRICULTURE AND FARMERS WELFARE DEPARTMENT OF AGRICULTURE, COOPERATION AND FARMERS WELFARE LOK SABHA UNSTARRED QUESTION NO.2026 TO BE ANSWERED ON THE 14 TH MARCH,
IJMIE Volume 2, Issue 8 ISSN:
 FINANCIAL INCLUSION PLANS (FIPs) Growing Roots in the light of good governance of RBI Pawan Sharma* Richa Tuli* Abstract: This study is an effort to investigate the status of financial inclusion in India.
`6,244 cr GOI allocations for Ministry of Drinking Water and Sanitation(MoDWS) in FY
 in FY") Accountability Initiative Research and Innovation for Governance Accountability The Swachh Bharat Mission (SBM), previously called the Nirmal Bharat Abhiyan (NBA), is the Government of India s (GOI) flagship
Accountability Initiative Research and Innovation for Governance Accountability The Swachh Bharat Mission (SBM), previously called the Nirmal Bharat Abhiyan (NBA), is the Government of India s (GOI) flagship
Banking Ombudsman Scheme, 2006
 Banking Ombudsman Scheme, 2006 1. What is the Banking Ombudsman Scheme? The Banking Ombudsman Scheme enables an expeditious and inexpensive forum to bank customers for resolution of complaints relating
CENTRAL ELECTRICITY REGULATORY COMMISSION NEW DELHI. Coram: Shri V. S. Verma, Member Shri M. Deena Dayalan, Member
 CENTRAL ELECTRICITY REGULATORY COMMISSION NEW DELHI Coram: Shri V. S. Verma, Member Shri M. Deena Dayalan, Member No. L-1/44/2010-CERC Date of Order: 29.6.2013 In the matter of: Determination of Point
The Planning Commission uses the Expert Group1 method
 An Estimate of Poverty Reduction between 2004-05 and 2005-06 K L Datta Using sample data from the 62nd round of the National Sample Survey, this paper estimates the headcount ratio of poverty for 2005-06.
GOVERNMENT OF INDIA MINISTRY OF SOCIAL JUSTICE AND EMPOWERMENT LOK SABHA UNSTARRED QUESTION NO TO BE ANSWERED ON
 GOVERNMENT OF INDIA MINISTRY OF SOCIAL JUSTICE AND EMPOWERMENT LOK SABHA UNSTARRED QUESTION NO. 3334 TO BE ANSWERED ON 06.12.2016 OLD AGE HOMES 3334. SHRI RAJESH KUMAR DIWAKER: SHRI SUKHBIR SINGH JAUNAPURIA:
Self Help Groups, Eradication of Poverty and Inclusive Growth
 Self Help Groups, Eradication of Poverty and Inclusive Growth *Dr. Ravindra K., Lecturer, Gulf College, Sultanate of Oman **Dr. Abhay Kumar Tiwari, Faculty Member, IBS Business School Dehradun Abstract
Financial year-wise FDI Equity Inflows:
 (ii) Financial year-wise FDI Equity : Financial Year (Apr-Mar) Amount of FDI Equity %age growth over the in Rupees Crore in US$ million previous year 2000-01 10,733 2,463-2001-02 18,654 4,065 ( + ) 65
Regional Rural Banks- Sustainability through Outreach. Amarendra Sahoo Chief General Manager RBI, Mumbai
 Regional Rural Banks- Sustainability through Outreach Amarendra Sahoo Chief General Manager RBI, Mumbai Scheme of Presentation I. RRBs mandate and to what extent fulfilled II. Perceived tension between
RELIANCE GENERAL INSURANCE COMPANY LIMITED Disclosures - NON- LIFE INSURANCE COMPANIES. S.No. Form No Description
 Disclosures - NON- LIFE INSURANCE COMPANIES S.No. Form No Description 1 NL-1-B-RA Revenue Account 2 NL-2-B-PL Profit & Loss Account 3 NL-3-B-BS Balance Sheet 4 NL-4-PREMIUM SCHEDULE Premium 5 NL-5-CLAIMS
Financial Results Q4 FY & FY May 13, 2016
 Financial Results Q4 FY 2015-16 & FY 2015-16 May 13, 2016 Table of Contents #1 Story of Transformation #2 Business Performance #3 Financials 2 Structural Transformation 3 Structural Transformation Medium
INDICATORS DATA SOURCE REMARKS Demographics. Population Census, Registrar General & Census Commissioner, India
 Public Disclosure Authorized Technical Demographics Public Disclosure Authorized Population Urban Share Child Sex Ratio Adults Population Census, Registrar General & Census Commissioner, India Population
BUDGET BRIEFS Vol 9/Issue 3 Mahatma Gandhi National Rural Employment Guarantee Scheme (MGNREGS) GOI, ,07,758 cr
 GOI, ,07,758 cr") BUDGET BRIEFS Vol 9/Issue 3 Mahatma Gandhi National Rural Employment Guarantee Scheme (MGNREGS) GOI, 2017- HIGHLIGHTS 1,07,758 cr Mahatma Gandhi National Rural Employment Guarantee Scheme (MGNREGS) is
BUDGET BRIEFS Vol 9/Issue 3 Mahatma Gandhi National Rural Employment Guarantee Scheme (MGNREGS) GOI, 2017- HIGHLIGHTS 1,07,758 cr Mahatma Gandhi National Rural Employment Guarantee Scheme (MGNREGS) is
RELIANCE GENERAL INSURANCE COMPANY LIMITED - NON- LIFE INSURANCE COMPANIES
 Disclosures - NON- LIFE INSURANCE COMPANIES S.No. Form No Description 1 NL-1-B-RA Revenue Account 2 NL-2-B-PL Profit & Loss Account 3 NL-3-B-BS Balance Sheet 4 NL-4-PREMIUM SCHEDULE Premium 5 NL-5-CLAIMS
Subject: Allocation of foodgrains under Welfare Institutions and Hostels Scheme
 No.9-5/2014-BP-1I Government of India Ministry of Consumer Affairs, Food & Public Distribution Department of Food & Public Distribution Krishi Bhawan, Rafi Marg, New Delhi -110 001 Dated - September 1,
79,686 cr GoI allocations for the Ministry of Human Resource Development (MHRD) in FY
 in FY") BUDGET BRIEFS Vol 10/ Issue 1 Sarva Shiksha Abhiyan (SSA) GoI, 2017-18 Sarva Shiksha Abhiyan (SSA) is the Government of India s (GoI) flagship elementary education programme. Launched in 2001, it aims
BUDGET BRIEFS Vol 10/ Issue 1 Sarva Shiksha Abhiyan (SSA) GoI, 2017-18 Sarva Shiksha Abhiyan (SSA) is the Government of India s (GoI) flagship elementary education programme. Launched in 2001, it aims
Labour Regulations: Coverage in North East India
 Labour Regulations: Coverage in North East India Jesim Pais Institute for Studies in Industrial Development New Delhi Presentation at the Conference on India s Look East Policy Challenges for Sub-Regional