OTP BANKA SRBIJA A.D., NOVI SAD. Consolidated Financial Statements Year Ended December 31, 2014 and Independent Auditors Report
|
|
|
- Edward Matthew Clark
- 5 years ago
- Views:
Transcription
1 Consolidated Financial Statements Year Ended 2014 and Independent Auditors Report
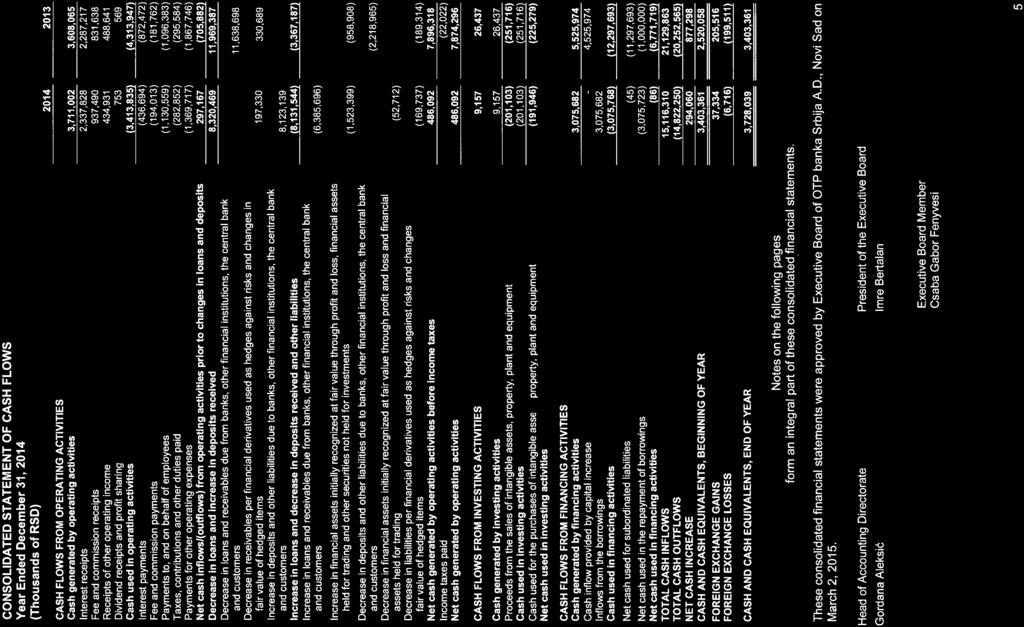
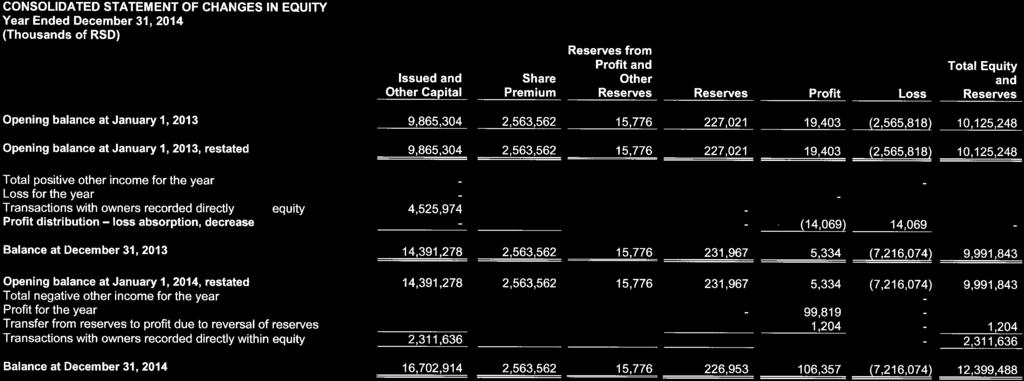
2 CONTENTS Page Independent Auditors' Report 1 Consolidated Financial Statements: Consolidated Income Statement 2 Consolidated Statement of Other Comprehensive Income 3 Consolidated Balance Sheet 4 Consolidated Statement of Cash Flows 5 Consolidated Statement of Changes in Equity 6 Notes to the Consolidated Financial Statements 7-72 Appendix: Annual Business Report
3


4


5


6


7


8
9 BANK S ESTABLISHMENT AND ACTIVITY These consolidated financial statements include the stand-alone financial statements of OTP Banka Srbija a.d. Novi Sad and those of its subsidiary OTP Investments d.o.o. Novi Sad. OTP Banka Srbija a.d. Novi Sad, as a parent entity to the subsidiary OTP Investments d.o.o. Novi Sad, prepares consolidated financial statements. OTP Banka Srbija a.d., Novi Sad (hereinafter: the Bank ) is a direct legal successor of Kulska banka a.d., Novi Sad. Kulska banka a.d., Novi Sad was registered as a shareholding company with the Commercial Court of Sombor, in accordance with May 17, 1995 Decision No. Fi 488/95. Pursuant to the Serbian Business Registers Agency Decision number BD 32735/2007 as of May 18, 2007, the name Kulska banka a.d., Novi Sad was changed into OTP banka Srbija a.d., Novi Sad. Simultaneously, the status change of merger and acquisition was registered, whereby Zepter banka a.d. Beograd and Niška banka a.d. Niš were merged with and acquired by Kulska banka a.d. Novi Sad as the Acquirer; through the aforesaid status change Zepter banka a.d. Beograd and Niška banka a.d. Niš ceased to exist and were deleted from the Business Register. The Bank is registered in the Republic of Serbia to provide banking services of payment transfers, lending and depositary activities in accordance with the Law on Banks, and it is obligated to operate based upon principles of liquidity, safety and profitability. As at 2014, the Bank consisted of the Head Office in Novi Sad, at No. 80 Bulevar Oslobođenja Street, 6 regional affiliates and 48 branches. As at 2014, the Bank had 670 employees ( 2013: 691 employees). The Bank s tax identification number is OTP Investments d.o.o., Novi Sad is a legal successor of the company KB-NS Investments d.o.o. KB- NS Investments d.o.o. was established pursuant to the Decision of Foundation dated January 19, 2006 as a limited liability company. The Company was registered with the Serbian Business Registers Agency in Novi Sad no. BD /2006. The Company s core business activities are factoring and consulting. The Bank is the sole owner of the Company. As of 2014, the Company had 1 employee (2013: 1 employee). The tax identification number of the company OTP Investments d.o.o. is BASIS OF PREPARATION AND PRESENTATION OF THE CONSOLIDATED FINANCIAL STATEMENTS 2.1. Basis of Preparation and Presentation of the Consolidated Financial Statements Legal entities and entrepreneurs incorporated in Serbia are required to maintain their books of account, to recognize and value assets and liabilities, income and expenses, and to present, submit and disclose financial statements in conformity the Law on Accounting (hereinafter referred as: the Law, Official Gazette of the Republic of Serbia no. 63/2013). As a large legal entity, the Bank is required to apply International Financial Reporting Standards ( IFRS ), which as per the aforementioned law comprise the following: the Framework for the Preparation and Presentation of Financial Statements (the Framework ), International Accounting Standards ( IAS ), International Financial Reporting Standards ( IFRS ), as well as the related interpretations issued by the International Financial Reporting Interpretations Committee ( IFRIC ) and additional related interpretations issued by International Accounting Standards Board ( IASB ), the translations of which to the Serbian language were approved and issued by the competent Ministry of Finance and which were in effect as at
10 BASIS OF PREPARATION AND PRESENTATION OF THE CONSOLIDATED FINANCIAL STATEMENTS (Continued) 2.1. Basis of Preparation and Presentation of the Consolidated Financial Statements (Continued) The amendments to IAS, as well as the newly issued IFRS and the related interpretations issued by the IASB and the IFRIC, in the period between 2002 and January 1, 2009, were officially adopted pursuant to a Decision enacted by the Ministry of Finance of the Republic of Serbia (the Ministry ) on October 5, 2010 and published the Official Gazette of the Republic of Serbia no. 77/2010. The Ministry s Decision dated March 13, 2014 adopted the translation of the Conceptual Framework for Financial Reporting and (the Conceptual Framework, adopted by the IASB in September 2010, which supplants the Framework for Preparation and Presentation of the Financial Statements) and basic texts of IAS and IFRS ( Decision on Adoption of the Translations of the Conceptual Framework for Financial Reporting and Basic Texts of International Accounting Standards and International Financial Reporting Standards, published the Official Gazette of the Republic of Serbia no. 35 on March 27, 2014 ( Decision on Adoption of the Translations ), encompassing amendments to IAS and new IFRS and related interpretations. Based on this Decision on Adoption of the Translations, the Conceptual Framework, IAS, IFRS, IFRIC and related interpretations that have been translated shall be applied to the financial statements prepared as of Standards and interpretations issued that came into effect in the current period pursuant to the Decision on Adoption of the Translations are disclosed in Note 2.2, while standards and interpretations in issue but not yet in effect are disclosed in Note 2.3. The accompanying consolidated financial statements are presented in the format prescribed under the Decision on the Forms and Contents of the Items in the Forms of the Financial Statements of Banks (Official Gazette of RS nos. 71/2014 and 135/2014). These consolidated financial statements were prepared at historical cost principle unless otherwise stipulated in the accounting policies presented hereunder. In the preparation of the accompanying consolidated financial statements, the Bank adhered to the accounting policies described in Note 3. The Bank s consolidated financial statements are stated in thousands of dinars (RSD). Dinar is the official reporting currency in the Republic of Serbia Standards and Interpretations Issued that Came into Effect in the Current Period Pursuant to the Decision on Adoption of the Translations of the Ministry Amendments to IFRS 7 Financial Instruments: Disclosures Amendments improving fair value and liquidity risk disclosures (revised in March 2009, effective for annual periods beginning on or after January 1, 2009); Amendments to IFRS 1 First-Time Adoption of IFRS Additional Exemptions for First-Time Adopters. The amendments relate to assets in oil and gas industry and determining whether an arrangement contains a lease (revised in July 2009, effective for annual periods beginning on or after January 1, 2010); Amendments to various standards and interpretations resulting from the Annual Quality Improvement Project of IFRS published on April 16, 2009 (IFRS 5, IFRS 8, IAS 1, IAS 7, IAS 17, IAS 36, IAS 39, IFRIC 16) primarily with a view to removing inconsistencies and clarifying wording, (amendments are to be applied for annual periods beginning on or after 1 January 2010, while the amendment to IFRIC is to become effective as of July 1, 2009); Amendments to IAS 38 Intangible Assets (revised in July 2009, effective for annual periods beginning on or after July 1, 2009); 8
11 BASIS OF PREPARATION AND PRESENTATION OF THE CONSOLIDATED FINANCIAL STATEMENTS (Continued) 2.2. Standards and Interpretations Issued that Came into Effect in the Current Period Pursuant to the Decision on Adoption of the Translations of the Ministry (Continued) Amendments to IFRS 2 Share-Based Payment : Amendments resulting from the Annual Quality Improvement Project of IFRS (revised in April 2009, effective for annual periods beginning on or after July 1, 2009) and amendments relating to group cash-settled share-based payment transactions (revised in June 2009, effective for annual periods beginning on or after January 1, 2010); Amendments IFRIC 9 Reassessment of Embedded Derivatives effective for annual periods beginning on or after July 1, 2009 and IAS 39 Financial Instruments: Recognition and Measurement Embedded Derivatives (effective for annual periods beginning on or after June 30, 2009); IFRIC 18 Transfers of Assets from Customers (effective for annual periods beginning on or after July 1, 2009); Conceptual Framework for Financial Reporting 2010 being amendments to Framework for the Preparation and Presentation of Financial Statements (effective for transfer of assets from customers received on or after September 2010); Amendments to IFRS 1 First-time Adoption of International Financial Reporting Standards Limited Exemption from Comparative IFRS 7 Disclosures for First-time Adopters (effective for annual periods beginning on or after July 1, 2010); Amendments to IAS 24 Related Party Disclosures Simplifying the disclosure requirements for government-related entities and clarifying the definition of a related party (effective for annual periods beginning on or after January 1, 2011); Amendments to IAS 32 Financial Instruments: Presentation Accounting for Rights Issues (effective for annual periods beginning on or after February 1, 2010); Amendments to various standards and interpretations Improvements to IFRSs (2010) resulting from the Annual quality improvement project of IFRS published on May 6, 2010 (IFRS 1, IFRS 3, IFRS 7, IAS 1, IAS 27, IAS 34, IFRIC 13) primarily with a view to removing inconsistencies and clarifying wording, (most amendments are to be applied for annual periods beginning on or after January 1, 2011); Amendments to IFRIC 14 IAS 19 The Limit on a Defined Benefit Asset, Minimum Funding Requirements and Their Interaction Prepayments of a Minimum Funding Requirement (effective for annual periods beginning on or after January 1, 2011); IFRIC 19 Extinguishing Financial Liabilities with Equity Instruments (effective for annual periods beginning on or after July 1, 2010). Amendments to IFRS 1 First-Time Adoption of IFRS Severe Hyperinflation and Removal of Fixed Dates for First-time Adopters (effective for annual periods beginning on or after July 1, 2011); Amendments to IFRS 7 Financial Instruments: Disclosures Transfers of Financial Assets (effective for annual periods beginning on or after January 1, 2011); Amendments to IAS 12 Income Taxes Deferred Tax: Recovery of Underlying Assets (effective for annual periods beginning on or after January 1, 2012); IFRS 10 Consolidated Financial Statements (effective for annual periods beginning on or after January 1, 2013); 9
12 BASIS OF PREPARATION AND PRESENTATION OF THE CONSOLIDATED FINANCIAL STATEMENTS (Continued) 2.2. Standards and Interpretations Issued that Came into Effect in the Current Period Pursuant to the Decision on Adoption of the Translations of the Ministry (Continued) IFRS 11 Joint Arrangements (effective for annual periods beginning on or after January 1, 2013); IFRS 12 Disclosures of Involvement with Other Entities (effective for annual periods beginning on or after January 1, 2013); Amendments to IFRS 10, IFRS 11 and IFRS 12 Consolidated Financial Statements, Joint Arrangements and Disclosures of Involvement with Other Entities: Transition Guidance (effective for annual periods beginning on or after January 1, 2013); IAS 27 (revised in 2011) Separate Financial Statements (effective for annual periods beginning on or after January 1, 2013); IAS 28 (revised in 2011) Investments in Associates and Joint Ventures (effective for annual periods beginning on or after January 1, 2013); IFRS 13 Fair Value Measurement (effective for annual periods beginning on or after January 1, 2013); Amendments to IFRS 1 First-time Adoption of International Financial Reporting Standards Government Loans with a Below-Market Rate of Interest (effective for annual periods beginning on or after January 1, 2013); Amendments to IFRS 7 Financial Instruments: Disclosures Offsetting Financial Assets and Financial Liabilities (effective for annual periods beginning on or after January 1, 2013); Amendments to IAS 1 Presentation of Financial Statements Presentation of Items of Other Comprehensive Income (effective for annual periods beginning on or after July 1, 2012); Amendments to IAS 19 Employee Benefits Improvements to the Accounting for Post- Employment Benefits (effective for annual periods beginning on or after January 1, 2013); Amendments to various standards Improvements to IFRSs ( Cycle) issued in May 2012, resulting from the annual improvement project of IFRS (IFRS 1, IAS 1, IAS 16, IAS 32, IAS 34) primarily with a view to removing inconsistencies and clarifying wording (amendments are to be applied for annual periods beginning on or after January 1, 2013); IFRIC 20 Stripping Costs in the Production Phase of a Surface Mine (effective for annual periods beginning on or after January 1, 2013); and Amendments to IAS 32 Financial Instruments: Presentation Offsetting Financial Assets and Financial Liabilities (effective for annual periods beginning on or after January 1, 2014) Standards and Interpretations in Issue not yet in Effect At the date of issuance of these consolidated financial statements the following standards, revisions and interpretations were in issue but not yet effective: IFRS 9 Financial Instruments and subsequent amendments, supplanting the requirements of IAS 39 Financial Instruments: Recognition and Measurement, with regard to classification and measurement of financial assets. This standard eliminates the categories existing under IAS 39 assets held to maturity, assets available for sale and loans and receivables. IFRS 9 shall be effective for annual periods beginning on or after January 1, 2018, with early adoption permitted. 10
13 BASIS OF PREPARATION AND PRESENTATION OF THE CONSOLIDATED FINANCIAL STATEMENTS (Continued) 2.3. Standards and Interpretations in Issue not yet in Effect (Continued) In accordance with IFRS 9, financial assets shall be classified in one of the following two categories upon initial recognition: financial assets at amortized cost or financial assets at fair value. A financial asset shall be measured at amortized cost if the following two criteria are met: financial assets relate to the business model whose objective is to collect the contractual cash flows and the contractual terms provide the basis for collection at certain future dates of cash flows that are solely payments of principal and interest on the principal outstanding. All other financial assets shall be measured at fair value. Gains and losses on the fair value measurement of financial assets shall be recognized in the profit and loss statement, except for investments in equity instruments which are not traded, where IFRS 9 allows at initial recognition a subsequently irreversible choice to recognize changes in fair value within other gains and losses in the statement of comprehensive income. An amount recognized in such a manner within the statement of comprehensive income cannot subsequently be recognized in profit and loss. Given the nature of the Bank s operations, the adoption of the standard is expected to have a significant impact on the Bank s consolidated financial statements. Amendments to IFRS 11 Joint Arrangements Accounting for Acquisition of an Interest in a Joint Operation (effective for annual periods beginning on or after January 1, 2016); IFRS 14 Regulatory Deferral Accounts (effective for annual periods beginning on or after January 1, 2016); IFRS 15 Revenue from Contracts with Customers, defining the framework for revenue recognition. IFRS 15 supplants IAS 18 Revenue, IAS 11 Construction Contracts, IFRIC 13 Customer Loyalty Programs, IFRIC 15 Agreements for the Construction of Real Estate and IFRIC 18 Transfers of Assets from Customers. IFRS 15 shall be effective for annual periods beginning on or after January 1, 2017, with early adoption permitted. Amendments to IAS 16 Property, Plant and Equipment and IAS 38 Intangible Assets Clarification of Acceptable Methods of Depreciation and Amortization (effective for annual periods beginning on or after January 1, 2016 ); Amendments to IAS 16 Property, Plant and Equipment and IAS 41 Agriculture Agriculture: Bearer Plants (effective for annual periods beginning on or after January 1, 2016); IAS 27 Separate Financial Statements Equity Method in Separate Financial Statements (effective for annual periods beginning on or after January 1, 2016); Amendments to IFRS 10 Consolidated Financial Statements and IAS 28 Investments in Associates and Joint Ventures Sale or Contribution of Assets between an Investor and its Associate or Joint Venture (effective for annual periods beginning on or after January 1, 2016 ); Amendments to IAS 19 Employee Benefits Defined Benefit Plans: Employee Contributions (effective for annual periods beginning on or after January 1, 2014); Amendments resulting from Annual Improvements Cycle issued in December 2013 (IFRS 2, IFRS 3, IFRS 8, IFRS 13, IAS 16, IAS 24 and IAS 38) with a view to removing inconsistencies and clarifying wording (effective for annual periods beginning on or after July 1, 2014); and Amendments resulting from Annual Improvements Cycle issued in December 2013 (IFRS 1, IFRS 3, IFRS 13 and IAS 40) with a view to removing inconsistencies and clarifying wording (effective for annual periods beginning on or after July 1, 2014). 11
14 SUMMARY OF SIGNIFICANT ACCOUNTING POLICIES 3.1. Interest Income and Expenses Interest income and expenses are recognized in the income statement for all interest-bearing financial instruments following the effective interest method. Interest income and expenses are recorded in the Bank s income statement in the period to which they belong by applying the matching principle and following the requirements delineated in the agreement signed between a customer and the Bank. Loan origination fees are credited to profit and loss account as interest income, i.e., as the adjustment to the effective return on loans disbursed proportionately to the outstanding loan maturities. Interest accrued is recorded within the income statements when there is no doubt as to its collectability in accordance with IAS 18 and the Guidance for Recognition Interest Income and Manner of Interest Recognition after Unwinding, which is an integral part of the Bank's Accounting Policies. Up to 2014, in accordance with the Rules on the Layout of Chart of Accounts and Content of Accounts in the Chart of Accounts for Banks (Official Gazette of RS, nos. 98/2007, 57/2008 and 3/2009), the Bank suspended interest, i.e., discontinued adding interest to assets with certain degree of recoverability. Interest suspension was performed in the manner and via account prescribed by the aforecited Rules, while the collection of suspended interest was recorded in the income accounts under the aforecited Rules. In 2014 the Bank no longer suspended interest. Interest income from performing and risk-free loans whose collection is certain is fully recognized. Interest income from the borrowers/loans subject to individual impairment assessment is recognized in accordance with IAS 39. When a financial asset or a group of similar financial assets is written off due to impairment loss, the related interest income is recognized from then on using the interest rate applied in discounting the future cash flows for the purpose of measuring the impairment loss. For borrowers/loans subject to group or collective impairment assessment, interest income is recognized in proportion to the net value of the loan. The Bank's management is of the opinion that this change to the accounting policy of interest income has no material effect on the prior years' consolidated financial statements of the Bank Fee and Commission Income and Expenses Fee and commission income and expenses from banking services (payment transactions, issuance of guaranties and other sureties, letters of credit, purchase and sale of foreign currencies and other banking services) when such services are invoiced and rendered. Fees and commission charged for guarantees, sureties and letters of credit issued are deferred and recognized as income proportionately over their maturity periods. The Bank recognizes fee and commission income that is part of the effective interest as interest income Foreign Exchange Translation Assets and liabilities denominated in foreign currencies at the balance sheet date are translated into dinars at official middle exchange rates of the National Bank of Serbia effective as at the reporting date. Gains or losses arising on the translation of receivables and payables are credited or charged to income statement. Transactions denominated in foreign currencies are translated into dinars at official exchange rates effective at the date of each transaction. Net foreign exchange positive or negative effects arising upon the translation of transactions, and the assets and liabilities denominated in foreign currencies are credited or charged to the income statement as foreign exchange gains or losses. Commitment and contingent liabilities in foreign currencies are translated into dinars at official middle exchange rates of the National Bank of Serbia effective as at the reporting date. 12
15 SUMMARY OF SIGNIFICANT ACCOUNTING POLICIES (Continued) 3.3. Foreign Exchange Translation (Continued) The exchange rates for major currencies used in the translation of balance sheet components into dinars were as follows: Currency Official middle exchange rate at 2014 Official middle exchange rate at 2013 USD CHF EUR impairment of Financial Assets and Credit risk-weighted Off-Balance Sheet Items The bank makes impairment allowance for loans and other financial assets as well as credit riskweighted off-balance sheet items when recoverability thereof is no longer certain as well as when there is a probability of incurring losses per credit risk-weighted off-balance sheet items. Impairment allowance is made under the Bank's Accounting Policy adopted in accordance with IAS 39 and defined in the Procedure for Assessing Impairment of Balance Sheet Assets and Probable Losses per Off-Balance Sheet Items in accordance with IFRS/IAS Cash and Cash Funds Held with the Central Bank Cash and cash funds held with the central bank include cash on hand in local and in foreign currencies, balances on the current accounts with the National Bank of Serbia, including the obligatory RSD and foreign currency reserves, gold and other precious metals as well as funds on current accounts held with other domestic and foreign banks in local and in foreign currencies (Note 17). Cash equivalents comprise gold and other precious metals initially measured at cost and subsequently carried at their market value. The market value is determined based on the price of precious metals quoted on the world market. The increase in the market value is recognized as income while the decrease is included in expenses on the income statement Financial Instruments Loans and Receivables Loans and receivables are non-derivative financial assets with fixed or determinable payment that are not quoted on an active market. Loans originated by the Bank are recognized within the balance sheet upon the transfer of loan funds to the borrower. Loans are initially recorded at the price representing the market value of the cash funds disbursed as loans, including all transaction costs; loans are subsequently measured at amortized cost using effective interest method. The Bank makes impairment allowance for those loans that are no longer recoverable in accordance with the Procedure for Assessing Impairment of Balance Sheet Assets and Probable Losses per Off-Balance Sheet Items in accordance with IFRS/IAS. In its loan portfolio the Bank has loans agreed upon with a number of borrowers with contractually defined currency clause as a risk hedge. Income arising from currency clause effects is recorded within the income statement under net foreign gains and positive currency clause effects (Note 9). Currency clause is a derivative which is not recorded separately from its host contract given that the economic benefits and risks of the embedded derivative closely related to the host contract. In its loan portfolio the Bank has loans linked to the consumer price index (officially published), which were contracted and approved in prior periods. Income and expenses arising therefrom are recorded as gains and losses on risk hedges (Note 7). Contractual loan link to the consumer price index represents embedded derivatives which are closely related to the host contracts yet recorded separately from those host contracts. 13
16 SUMMARY OF SIGNIFICANT ACCOUNTING POLICIES (Continued) 3.6. Financial Instruments (Continued) Impairment Allowance of Balance Sheet Assets and Provisions for Losses per Off-Balance Sheet Items Impairment allowance of balance sheet assets and provisions for losses per off-balance sheet items are made based on the estimate of the impairment of balance sheet assets and probable losses per offbalance sheet items in accordance with IFRS/IAS as part of the Bank's accounting policies adopted based on IAS 39. Impairment allowance of balance sheet assets is recorded within assets on the impairment allowance accounts in the income statements while provisions for losses per off-balance sheet items are recorded on the accounts prescribed for this purpose by NBS, within liabilities Securities and Financial Assets Carried at Fair value through Profit and Loss (Trading Assets) Trading securities comprise those securities held by the Bank for the purpose of their sale with the objective of generating a profit from short-term fluctuations in their market prices. The Bank uses the settlement date calculation upon recording transactions of purchasing securities held for trading. Transaction costs are not included in the value thereof but presented within the expenses of the period. Any unrealized gains and losses arising from changes in the market value of such assets are recognized as from the transaction origination date (trade date) in the profit and loss statement. Following the trading date, when the transaction is settled (settlement date), the resulting financial assets shall be recognized within the balance sheet at market value of the consideration paid for acquisition of securities increased by the changes in the market value of the contract arisen since the trading date. Market value is determined based on the valuation techniques, fair value hierarchies and inputs of the certain fair value hierarchy levels in accordance with the provisions of the relevant IFRS/IAS. All realized and unrealized gains and losses arising from changes in the market value of trading securities are recognized in the income statement as gains and losses on the financial assets held for trading (Note 6). As of 2014 the Bank had only derivatives held for trading in its portfolio (Note 18) Securities and Other Financial Assets Held to Maturity Securities and other financial assets held to maturity are financial assets with fixed maturities that the Bank intends to hold up to their maturity dates. Securities held to maturity are stated at their amortized cost using the effective interest method net of accumulated impairment. The amortized cost is calculated taking into account all discounts or premiums earned upon the purchase over the maturity period. Interest accrued as of the balance sheet date is credited to income in the profit and loss account. Changes in the fair value of these securities are also included in the profit and loss under gains or losses on the valuation of securities. This category of securities includes bills of exchange received for discounting and commercial papers (Note 20) Securities and Other Financial Assets Available for Sale Securities and other financial assets available for sale are non-derivative financial assets designated as available for sale (AFS) and are not classified as: loans and receivables, investments held to maturity or financial assets ate fair value through profit and loss. AFS financial assets represent financial instruments intended to be held for and indefinite period, which can nevertheless be sold for liquidity maintenance or due to changes in interest rates, foreign exchange rates or equity prices. 14
17 SUMMARY OF SIGNIFICANT ACCOUNTING POLICIES (Continued) 3.6. Financial Instruments (Continued) Securities and Other Financial Assets Available for Sale (Continued) Securities available for sale are measured at market value. Market value is determined based on the valuation techniques, fair value hierarchies and inputs of the certain fair value hierarchy levels in accordance with the provisions of the relevant IFRS/IAS. Unrealized gains and losses arising from changes in the market value of available-for sale investments are stated as reserves within equity until such a financial asset is sold, collected or otherwise disposed of or until it is determined to have suffered impairment. Upon sales or permanent impairment of these securities adequate amounts of previously formed revaluation reserves are stated in the income statement as net gains or losses on securities Equity Investments Equity investments represent long-term financial investments in other legal entities equity, without any intention of their sale in the near future. All investments are initially recorded at their nominal value. Equity investments are recorded in the Bank s financial statements using the historical cost method Intangible Assets, Property, Plant and Equipment The Bank s property, plant and equipment and intangible assets are recognized at cost (historical cost) less any accumulated depreciation and amortization and impairment. Depreciation and amortization are calculated on a straight-line basis at the following annual rates in order to write off the cost of assets over their estimated useful lives: Buildings 1% 6.59% Computers 20% Calculators, typewriters and money handling machines 15.5% Passenger vehicles 15.5% Communications equipment 10% Heating equipment 16.5% Copying equipment 14.3% Furniture 12,5% IT equipment 10 20% Mobile phones 33.33% Other equipment 11% In accordance with the relevant Leasehold improvements lease agreement terms Property, plant and equipment are periodically reviewed in order to determine indicators of impairment, if any Investment Property The Bank s investment property is property held to earn rental income and/or for capital appreciation. An investment property is measured at fair value which accounts for all movements in the market value and is recorded in the income statement. The Bank's investment property is not depreciated. 15
18 SUMMARY OF SIGNIFICANT ACCOUNTING POLICIES (Continued) 3.9. Non-Current Assets Held for Sale Non-current assets held for sale are the assets classified upon acquisition as non-current, which the Bank decided to dispose of after a certain period of use. Upon the reclassification of a portion of assets into non-current assets held for sale, assets are measured at the lower of their carrying value and fair value less costs to sell. In the first case, the asset is stated at its carrying value whereas in the latter case, revaluation surplus accrued for that particular asset is reversed, and the amount in excess of such surplus is charged to expenses of the given period as impairment of assets. Impairment losses are transferred to losses on the sale in case such asset is reclassified into the category of assets held for sale and sold in the same year. In case of reclassification from investment property carried at fair value the rules of measurement need not be applied. In order to reclassify and asset from investment property to non-current assets held for sale, not only a relevant decision on the sale is to be made but also the capital expenditure of reclassification of such an asset. Depreciation of non-current assets held for sale is not calculated. Sales of such assets are recorded as net sales. The remaining assets classified in this category meet the requirements prescribed by IFRS 5 for continued recognition of non-current assets held for sale and are available for sale (Note 30) Assets Held for Sale Equity Tangible assets received in lieu of debt collection, as well as property from joint ventures are classified as assets held for sale and presented within the line item of inventories. Assets held for sale are measured at the lower of cost and at fair value less costs to sell. These assets are not depreciated as long as they are classified as tangible assets received in lieu of debt collection in the above described manner. The Bank's equity is comprised of: issued capital, share issue premium, reserves and retained earnings/ accumulated losses. Issued Capital The Bank's share capital is formed from the monetary contributions made by the Bank's founders. For funds invested, shareholders receive a proportionate number of shares or receipts as defined in the Law on the Capital Market (Official Gazette of RS no. 31/11). Shareholders cannot withdraw funds invested in the Bank s share capital. The Bank uses capital to perform banking operations and cover operating risks. Revaluation Reserves The surplus determined in the revaluation of property and equipment is credited to revaluation reserves. If a previously revalued asset with positive revaluation effects credited to revaluation reserves is sold or disposed of, the respective revaluation surplus credited to revaluation reserves is transferred to retained earnings (Note 40). Where the fair value of property decreases because the asset s market value is below its carrying value, revaluation surplus arising from that particular asset is reversed accordingly to the extent of the previously formed revaluation reserves. Unrealized gains and losses arising from remeasurement of securities available for sale to their market value are recorded as reserves within equity (Note 40). The structure of and changes in the Bank's equity are disclosed in Note
19 SUMMARY OF SIGNIFICANT ACCOUNTING POLICIES (Continued) Borrowings and Due Deposits Liabilities arising from borrowings and due deposits are recognized within the balance sheet when the respective funds are deposited. Upon initial recognition, borrowings and deposits are measured at fair value increased by transaction costs which may be added to the respective deposits or presented as separate financial liabilities. Subsequent to initial recognition, liabilities arising from borrowings and deposits due are measured at amortized cost by applying the effective interest method. Foreign currency deposits are stated in RSD as translated by applying the middle exchange rates effective as of the balance sheet date Managed Funds The Bank manages funds on behalf of and for the account of third parties and charges fees for these services. These items are not included in the Bank s balance sheet and are presented within off-balance sheet items (Note 41) Employee Benefits The Bank does not have defined benefit plans or share-based remuneration options and there were no identified liabilities thereof as of The Bank calculated future retirement benefits in accordance with IAS 19, based on the assumptions made in accordance with the provisions of the aforesaid standard. As of 2014, the Bank increased provisions in comparison to Taxes and Contributions Current Income Tax The Bank does not perform tax consolidation. With regard thereto, disclosures of income taxes are made separately for the Bank and its subsidiary. Current income tax represents an amount that is calculated by applying the prescribed income tax rate of 15% to the taxable base stated in the income tax return, which includes the profit shown in the statutory statement of income, as adjusted for certain permanent and temporary differences that are specifically defined under statutory tax rules of the Republic of Serbia. Current income tax is calculated and paid in accordance with the Corporate Income Tax Law and other relevant fiscal regulations prevailing in the Republic of Serbia. The monthly advance income tax payment is paid on monthly basis while the adjustment of the sum of advance payments is made at the year-end, i.e. upon submission of the tax balance and the annual income tax return to the tax authorities for advance and final determination of the corporate income tax Deferred Income Taxes Deferred income taxes are provided for temporary differences arising between the tax bases of assets and liabilities and their carrying values in the Bank's consolidated financial statements in accordance with IAS 12. Deferred tax liabilities are recognized for all taxable temporary differences as at the balance sheet date between the tax bases of assets and liabilities and their carrying values used for financial reporting purposes, which will result in taxable amounts in the future periods. Deferred tax assets are income tax amounts recoverable in the future periods which pertain to all deductible temporary differences and all unused tax credits and losses available for carryforward. Deferred tax assets and liabilities are determined at the tax rate expected to be applied in the period of the relevant asset realization/liability settlement, based on the currently enacted or tax rates expected to be enacted up to the balance sheet date. As at 2014, deferred tax assets and liabilities were provided at the rate of 15%. 17
20 SUMMARY OF SIGNIFICANT ACCOUNTING POLICIES (Continued) Taxes and Contributions (Continued) Deferred Income Taxes (Continued) In 2014 the Bank recognized deferred tax assets based on the temporary differences between the base of calculation tax-purpose and financial reporting depreciation and amortization of fixed assets, provisions for retirement benefits calculated in accordance with IAS 19, impairment of assets and unpaid public duties payable. The Bank did not recognize deferred tax assets based on the stated tax losses and unused tax credit in accordance with IAS 12, paragraph Indirect Taxes and Contributions Indirect taxes and contributions include property taxes, value added tax, payroll taxes and contributions and various other taxes and contributions paid pursuant to effective republic and local tax regulations. These taxes and contributions are included within operating expenses and staff costs. VAT may be presented within certain balance sheet items if related to procurements that do not represent expenses but certain balance sheet items according to IAS Financial Derivatives The Bank recognizes financial derivatives at their contractually defined value (cost) within off-balance sheet items, which represents the fair value of consideration received or receivable where any fair value adjustment as of the balance sheet date is recorded in the balance sheet and in the income statement Fair Value The Bank applies provisions of IFRS 13 to determine the fair values of items that are measured at fair value according to its adopted accounting policy. It is the policy of the Bank to disclose the fair value information on those financial assets and financial liabilities for which published market information is readily and reliably available, and whose fair value is materially different from their recorded amounts. The Bank records loans at their fair values as the terms at which the Bank extends loans are reconciled with the market prices through the variable interest rates. As per the Bank s management, amounts expressed in the consolidated financial statements reflect the fair value which is most reliable and useful for the needs of the financial reporting in accordance with the International Financial Reporting Standards as per the Law on Accounting of the Republic of Serbia and regulations of the National Bank of Serbia governing financial reporting of banks Loan Adjustment to Market Prices The Bank agrees with retail customers on either fixed or variable interest rates. Where a variable interest rate is agreed in a relevant contract clause, it is subject to reconciliation with variable interest rate elements which are officially published (key policy rate, consumer price index, etc.). In case such an element changes, an annex to the agreement regulating the interest rate change is not signed. Instead, before the changed interest rate is applied, the Bank will inform the customer in writing, or using any other permanent data carrier, of the changed interest rate, stipulating the date when the changed interest rate will come in effect along with a new loan repayment schedule. More detailed terms for the change of interest rate are determined in individual loan agreements. This manner of reconciliations is in accordance with the Law on the Protection of Users of Financial Services. The Bank agrees on variable interest rate with corporate customers, which rate is reconciled with the movements in the key policy rate and amendments to the General Business Terms and formal documents of the Bank determining the product and service prices. 18
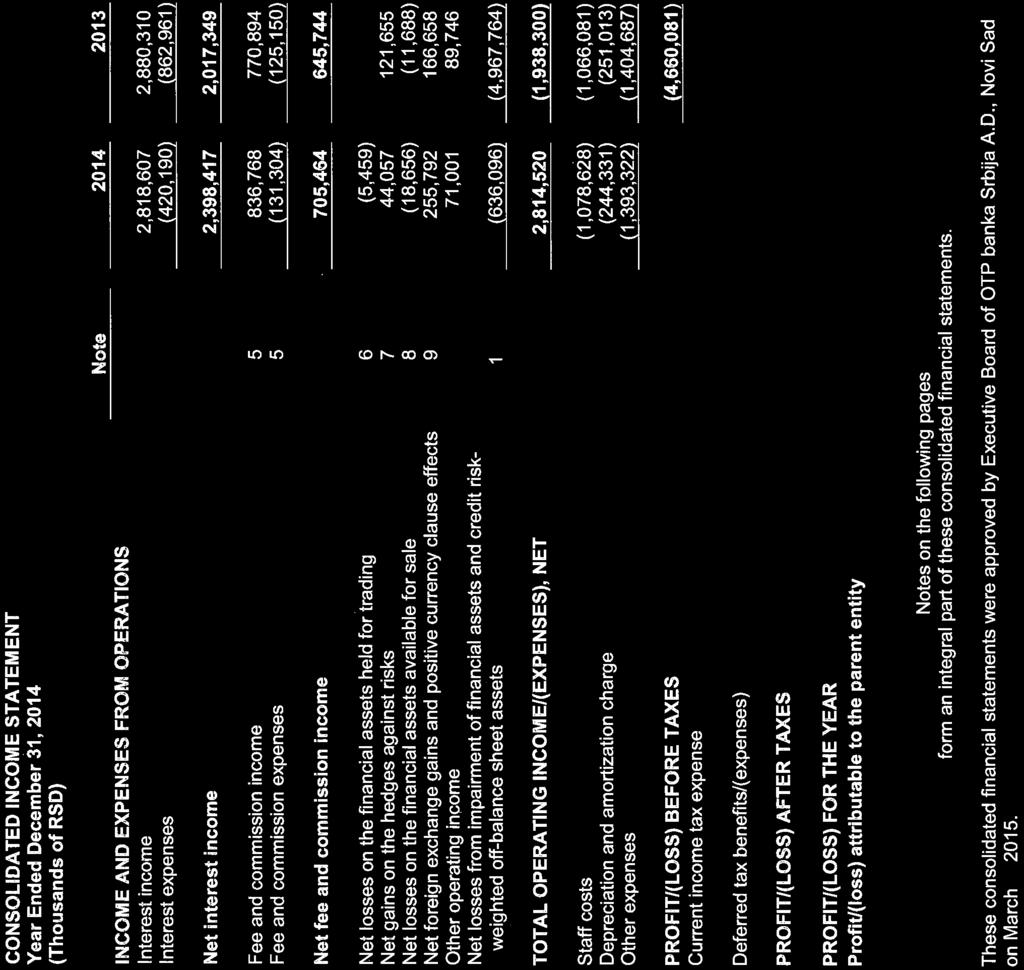
21 INTEREST INCOME AND EXPENSES Year Ended Interest income arising from: Loans 2,512,047 2,487,657 Deposits 65,179 93,258 Securities 234, ,595 Other investments 6,744 63,800 Total interest income 2,818,607 2,880,310 Interest expenses arising from: Loans (52,206) (289,627) Deposits (366,348) (571,698) Other investments (1,636) (1,636) Total interest expenses (420,190) (862,961) Net interest income for the year 2,398,417 2,017,349 Interest expenses from other investments of RSD 1,636 thousand related to dividends per cumulative preference shares calculated for the year FEE AND COMMISSION INCOME AND EXPENSES Year Ended Fee and commission income Loan origination fees 7,015 12,149 Payment card transaction fees 234, ,836 Payment transaction fees 266, ,644 Electronic banking fees 19,256 18,226 Other fees and commissions 309, ,039 Total fee and commission income 836, ,894 Fee and commission expenses Other financial liabilities (1,222) (10,311) Payment card transaction fees (86,385) (71,313) Other fees and commissions (28,791) (29,607) Loan origination fees (14,906) (13,919) Total fee and commission expenses (131,304) (125,150) Net fee and commission income for the year 705, , NET LOSS ON THE FINANCIAL ASSETS HELD FOR TRADING Year Ended 2014 Gains on the fair value changes of derivatives held for trading 57,349 - Losses on the fair value changes of derivatives held for trading (62,808) - Net loss on the financial assets held for trading for the year (5,459) - As from November 1, 2014, the Bank started classifying swap transactions as derivatives held for trading. 19
22 NET GAINS ON THE HEDGES AGAINST RISKS Year Ended Gains on the valuation of loans and receivables changes in retail prices 184 1,048 Gains on the valuation of loans and receivables gains on changes in the value of gold and other precious metals 2,831 - Gains on the valuation of derivatives designated for risk hedging interest rate swap 200, ,970 Losses on the valuation of loans and receivables changes in retail prices (30) (561) Losses on the valuation of loans and receivables gains on changes in the value of gold and other precious metals (7) (6,475) Losses on the valuation of derivatives designated for risk hedging interest rate swap (159,475) (203,327) Net gains on the hedges against risks for the year 44, , NET LOSSES ON THE FINANCIAL ASSETS AVAILABLE FOR SALE Year Ended Gains on the sale of securities and other financial assets available for sale Losses on the sale of securities and other financial assets available for sale (18,656) (12,547) Net losses on the financial assets available for sale for the year (18,656) (11,688) 9. NET FOREIGN EXCHANGE GAINS AND POSITIVE CURRENCY CLAUSE EFFECTS Year Ended Foreign exchange gains Unrealized foreign exchange gains 1,119,178 2,244,021 Realized foreign exchange gains 277, ,373 On valuation of loans, receivables and liabilities 987, ,671 Total foreign exchange gains 2,384,263 3,478,065 Foreign exchange losses Unrealized foreign exchange losses (1,671,821) (2,295,762) Realized foreign exchange losses (136,492) (113,138) On valuation of loans, receivables and liabilities (320,158) (902,507) Total foreign exchange losses (2,128,471) (3,311,407) Net foreign exchange gains and positive currency clause effects for the year 255, ,658 20
23 OTHER OPERATING INCOME Year Ended Gains on the sale of other loans and receivables 2,974 4,264 Other income from operations 11,665 12,448 Reversal of unreleased provisions for liabilities 73 27,584 Gains on the sale of property, plant, equipment and intangible assets 3,483 6,913 Write-off of liabilities 2,356 10,872 Dividend income and income from equity investments Surpluses 2,502 1,458 Payment card operations 19,210 - Other income 27,985 25,638 Total other operating income for the year 71,001 89, NET LOSSES FROM IMPAIRMENT OF FINANCIAL ASSETS AND CREDIT RISK-WEIGHTED OFF-BALANCE SHEET ITEMS Year Ended Impairment losses on loans and receivables included in the balance sheet (1,767,488) (6,456,235) Provisions for off-balance sheet items (58,286) (58,033) Write-off of irrecoverable receivables (6,797) (19,104) (1,832,571) (6,533,372) Reversal of impairment losses on loans and receivables included in the balance sheet 1,154,728 1,538,674 Reversal of provisions for off-balance sheet items 38,837 26,386 Collected receivables previously written off 2, ,196,475 1,565,608 Net losses from impairment of financial assets and credit risk-weighted off-balance sheet items for the year (636,096) (4,967,764) 12. STAFF COSTS Year Ended Net salaries 792, ,696 Net benefits 8,434 3,466 Taxes on salaries and benefits 82,898 89,056 Contributions to salaries and benefits 161, ,112 Temporary and seasonal employees 1,435 3,048 Other staff costs 26,487 13,828 Provisions for retirement and other employee benefits 4,863 2,875 Total staff costs for the year 1,078,628 1,066,081 Other staff costs in 2014 mostly relate to the remunerations paid to the members of the Board of Directors in the amount of RSD 8,518 thousand. Expenses in respect of provisions for retirement benefits amounted to RSD 3,367 thousand. Other provisions for employee benefits relate to short-term provisions for unused annual leave (vacation) benefits. 21
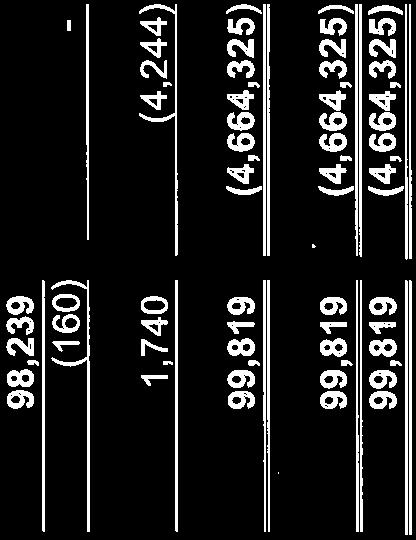
24 DEPRECIATION AND AMORTIZATION CHARGE Year Ended Depreciation charge property owned by the Bank 15,837 15,899 Depreciation charge leasehold improvements 24,046 21,287 Amortization charge intangible assets 60,303 67,552 Depreciation charge computer equipment 44,821 44,919 Depreciation charge office equipment and devices 25,792 22,509 Depreciation charge other equipment 73,532 78,840 Depreciation charge equipment acquired under finance lease - 7 Total depreciation and amortization charge for the year 244, , OTHER EXPENSES Year Ended Losses on the sale of other loans and receivables - 20,676 Cost of materials 98, ,761 Cost of production services 470, ,293 Non-material costs 483, ,385 Taxes payable 56,315 74,127 Contributions payable 167, ,337 Other costs and charges 63,593 30,579 Provisions for liabilities 17,258 26,386 Losses on the sale of property, plant, equipment and intangible assets 1,642 1,955 Losses on the disposal and write-off of property, plant, equipment and intangible assets 3, Shortages and damages 1,096 5,046 Other expenses 28,773 67,734 Total other expenses for the year 1,393,322 1,404, INCOME TAXES 1 CURRENT INCOME TAX Year Ended Current income tax expense Total current income tax expense as at December INCOME TAXES 2 DEFERRED TAX ASSETS/(LIABILITIES) AND TAX BENEFITS/(EXPENSES) a) Movements on Deferred Tax Assets/(Liabilities) at the reporting date the Bank stated deferred tax assets as totaling RSD 7,264 thousand. Movements on deferred tax assets are presented in the table below: Year Ended Balance of deferred tax assets/liabilities as at January 1 5,524 9,768 Effect of the temporary tax differences credited/(charged) to the income statement 1,740 (4,244) Other - - Balance of deferred tax assets as at December 31 7,264 5,524 22
25 INCOME TAXES 2 DEFERRED TAX ASSETS/(LIABILITIES) AND TAX BENEFITS/(EXPENSES) (Continued) a) Movements on Deferred Tax Assets/(Liabilities) (Continued) As of 2014 the Bank recognized deferred tax assets in the amount of RSD 7,264 thousand ( 2013: RSD 5,524 thousand), on various grounds. Namely, deferred tax assets were recognized based on the temporary difference between depreciation and amortization recognized for accounting and for tax purposes of RSD 3,046 thousand, provisions made for employee retirement benefits in accordance with IAS 19 of RSD 1,637 thousand, based on unpaid public duties of RSD 745 thousand, and deductible temporary differences in allowances for impairment losses of RSD 1,836 thousand. b) Numerical Reconciliation between Total Tax Expense Stated in the Income Statement and the Product of the Accounting Results Multiplied by the Applicable Tax Rate Year Ended Bank s profit/(loss) before taxes 105,799 (4,652,365) Income tax at the statutory tax rate of 15% 15,870 (697,855) (Prior years loss as per tax balance up to the amount of taxable profit) / Unrecognized tax losses (17,756) 548,624 Effects of the expenses not recognized within the tax balance 1, ,231 Deferred tax benefit/(expense) 1,740 (4,244) Total tax benefit/(expense) 1,740 (4,244) Effective tax rate 1.64% 0.09% c) Gains/(losses) on the Created Deferred Tax Assets Year Ended Gains on the created deferred tax assets and decrease in deferred tax liabilities 1,740 (4,244) Gains on the created deferred tax assets and decrease in deferred tax liabilities as at December 31 1,740 (4,244) 23
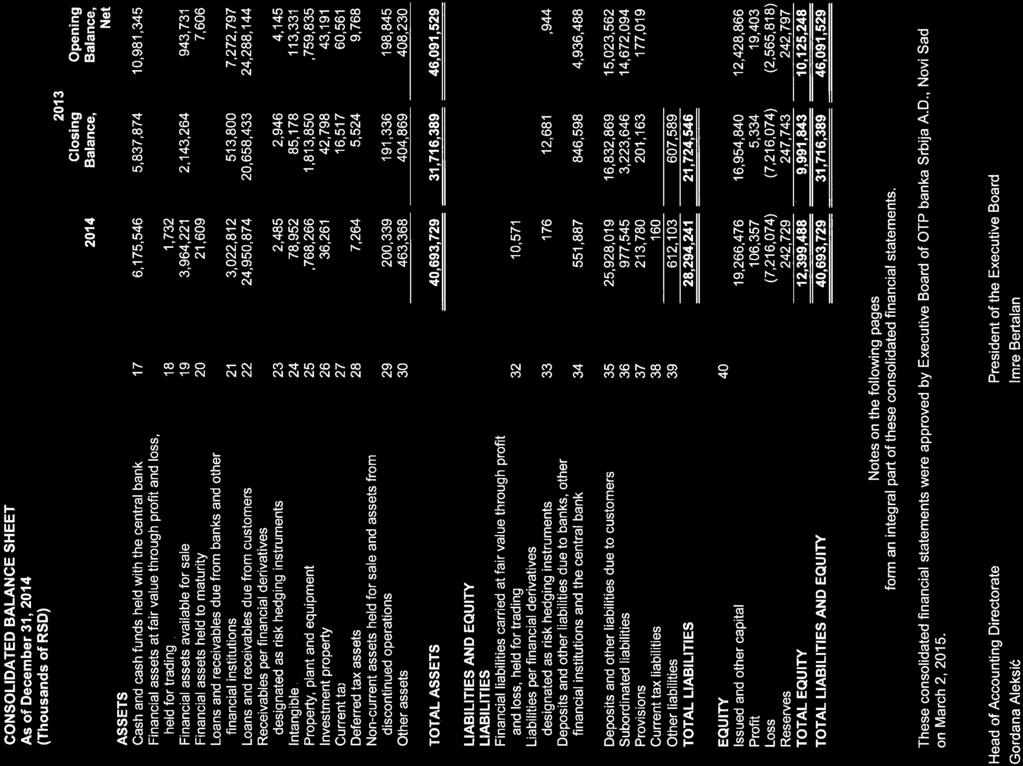
26 INCOME TAXES 2 DEFERRED TAX ASSETS/(LIABILITIES) AND TAX BENEFITS/(EXPENSES) (Continued) d) Income Tax Benefit/(Expense) Year Ended Accounting profit/(loss) before taxes 105,799 (4,652,365) Expenses not recognized for tax purposes permanent differences 12, ,871 Taxable income 118,375 (3,657,494) Capital gains/(losses) 2,046 (20,274) Taxable base - - Tax rate 15% 15% Calculated income tax - - Current income tax expense - - Loss decrease by created deferred tax assets 1,740 (4,244) Total tax benefit/(expense) 1,740 (4,244) Net profit 107,539 (4,656,609) Current income tax expense - - Deferred income tax benefit 1,740 (4,244) 1,740 (4,244) 17. CASH AND CASH FUNDS HELD WITH THE CENTRAL BANK In RSD Cash funds in RSD 2,824,806 2,406,203 Cash on hand in RSD 511, ,661 Total cash funds in RSD 3,336,019 2,964,864 In foreign currencies Cash on hand in foreign currencies 266, ,669 Other monetary items in foreign currencies 20,987 12,948 Obligatory foreign currency reserve held with NBS 2,534,058 2,588,792 Total cash funds in foreign currencies 2,821,103 2,857,409 Gold and other precious metals 18,424 15,601 Total cash and cash funds held with the central bank, balance as at December 31 6,175,546 5,837,874 The Bank s obligatory RSD reserve represents the minimum RSD reserve set aside in accordance with the NBS Decision on Required Reserves of Banks with the National Bank of Serbia (Official Gazette of RS, nos. 3/11, 31/12, 57/12, 78/12, 87/12, 107/12, 62/13, 125/14 and 135/14). Pursuant to the aforesaid Decision, the obligatory reserve is to be calculated at the rate of 5% on the portion of the RSD base comprised of liabilities maturing within 2 years, i.e. within 730 days, and at the rate of 0% on the portion of the dinar base comprised of liabilities with maturities of over 2 years, i.e. over 730 days. The RSD base for the calculation of the obligatory reserve is the amount of average daily balance of RSD liabilities during the preceding calendar month, except RSD liabilities indexed to a currency clause as follows: - non-indexed liabilities arising from RSD deposits, loans, securities and other RSD liabilities to domestic legal entities and retail bank clients; - non-indexed liabilities arising from RSD deposits, loans and other RSD liabilities to foreign creditors. 24
27 CASH AND CASH FUNDS HELD WITH THE CENTRAL BANK (Continued) A portion of the obligatory foreign currency reserve was converted into obligatory RSD reserve at the rates of 36% and 28% for the obligatory reserves of up to and over 2 years, respectively. The obligatory RSD reserve balance that had to be maintained from December 18, 2014 to January 17, 2015 amounted to RSD 1,892,528 thousand, where the calculated RSD portion of the reserve amounted to RSD 471,166 thousand, and the RSD equivalent of the reserve portion calculated in EUR and deposited in RSD amounted to RSD 1,421,362 thousand. The Bank is under obligation to calculate and maintain the average daily balance of the allocated obligatory RSD reserve on its gyro account over the accounting period. The calculated obligatory RSD reserve is deposited in RSD on the Bank's gyro account. As at 2014 the Bank was in full compliance with the regulations of the National Bank of Serbia with regard to the calculation and allocation of the obligatory RSD reserve. The obligatory foreign currency reserve represents the minimum foreign currency reserve set aside in accordance with the NBS Decision on Required Reserves of Banks with the National Bank of Serbia (Official Gazette of RS nos. 3/11, 31/12, 57/12, 78/12, 87/12, 107/12, 62/13, 125/14 and 135/14) which prescribes that banks calculate the obligatory foreign currency reserve at the following rates: - 27% on the portion of the foreign currency reserve comprised of liabilities maturing within 2 years, i.e. up to 730 days, and exceptionally at the rate of 50% on the portion of the foreign currency reserve comprised of RSD liabilities indexed to a currency clause maturing within 2 years, i.e. up to 730 days; - 20% on the portion of the foreign currency reserve comprised of liabilities with maturities of over 2 years, i.e. over 730 days, and exceptionally at the rate of 50% on the portion of the foreign currency reserve comprised of RSD liabilities indexed to a currency clause with maturities of over 2 years, i.e. over 730 days. The foreign currency base for the calculation of required reserve is the amount of average daily balance of foreign currency liabilities during the preceding calendar month and the amount of average daily balance of RSD liabilities from the preceding calendar month indexed to a currency clause as follows: - liabilities arising from deposits, loans, securities and other foreign currency liabilities to foreign creditors; - liabilities arising from deposits, loans, securities and other foreign currency liabilities to domestic legal entities and other liabilities; - foreign currency savings deposits with other banks; - indexed liabilities arising from deposits, loans, securities and other RSD liabilities as well as indexed RSD deposits received through transactions the Bank performs on behalf of and for the account of third parties if they exceed the amounts of loans the Bank disbursed from these deposits. The Bank deposits the obligatory foreign currency reserve onto the foreign currency account with the National Bank of Serbia. As at 2014 the Bank was in full compliance with the regulations of the National Bank of Serbia with regard to the calculation and allocation of the obligatory foreign currency reserve. Based on the Decision on the Conditions and Manner of Implementing Open Market Operations (Official Gazette of RS, nos. 45/2011 and 34/2013), the Bank conducts repurchase transactions with the National Bank of Serbia. The subject of repo transactions are commercial papers issued by the NBS. The NBS has the obligation to repurchase commercial papers before their maturity. As of 2014 the Bank had no contracted repo transactions; however, during 2014 the Bank had a significant turnover per repo transactions totaling RSD 41 billion. Total income from interest accrued per repo transactions in 2014 amounted to RSD 52,825 thousand. In 2014 the Bank had a larger volume of contracted loans based on repurchase transactions in foreign currencies with OTP Bank Ltd. Budapest as compared to the previous year in the amount of RSD 1,291,800 thousand. 25
28 FINANCIAL ASSETS AT FAIR VALUE THROUGH PROFIT AND LOSS HELD FOR TRADING Receivables per derivatives held for trading currency swap 1,732 - Total financial assets at fair value through profit and loss held for trading as at December 31 1,732 - The Bank had no securities held for trading in its portfolio. This line item comprises derivatives held for trading. 19. FINANCIAL ASSETS AVAILABLE FOR SALE Face value 4,531,998 2,736,488 Departures from the face value (78,187) (83,909) Impairment allowance (489,590) (509,315) Total financial assets available for sale, net as at December 31 3,964,221 2,143, Investments in financial assets available for sale Shares of insurance companies - reclassified Shares of other financial institutions 2,243 2,243 Shares of holding companies 121, ,670 Shares of other companies 97, ,471 Shares of other companies - reclassified - 3 Treasury bills and public sector bonds 3,953,859 2,132,769 Shares of other customers 278, ,215 Shares of other customers - reclassified Securities available for sale 4,453,811 2,652,578 Faxe value of securities available for sale 4,531,998 2,736,488 Departures from the face value (78,187) (83,910) Impairment allowance (489,590) (509,314) Securities available for sale, net as at December 31 3,964,221 2,143,264 Increase in securities available for sale was due to the purchases of Treasury bills and bonds of the Republic of Serbia. As at 2014 the Bank had Treasury bills and bonds of the Republic of Serbia totaling RSD 4,012,480 thousand in its portfolio. Treasury bills and bonds of the Republic of Serbia were classified as securities available for sale. The following table shows the breakdown of Treasury bills per maturity: Maturity Book value Interest accrued up to maturity Short-term T-bills 1,502,600 (22,734) Long-term T-bills 2,054,880 (69,298) Long-term bonds 455,000 32,750 Total as at December 31 4,012,480 (59,282) As at 2014 the Bank determined the fair value of Treasury bills in accordance with the provisions of IFRS
29 FINANCIAL ASSETS AVAILABLE FOR SALE (Continued) Investments in financial assets available for sale (Continued) Upon determining the fair value of the Treasury bills the Bank used valuation techniques which it deemed appropriate under the circumstances and for which it had sufficient data available for fair value measurement, with the maximum use of observable inputs and an effort to minimize the use of unobservable input data. Regarding the aforesaid, the Bank decided on the use of combined market and income approaches and estimated the fair value based on hierarchy Level 2 inputs. Fair values were determined based on: prices available at the principal/secondary market in the observation period which is deemed relevant for trading these securities (a period of two weeks); based on prices offered for specific maturities. Based on the fair value estimate, it was determined that the value of Treasury bills as at 2014 was impaired by RSD 661 thousand and that it amounted to RSD 3,953,859 thousand. 20. FINANCIAL ASSETS HELD TO MATURITY Face value 73,173 51,237 Departures from the face value (86) 241 Impairment allowance (51,478) (51,478) Total financial assets held to maturity, net as at December 31 21, LOANS AND RECEIVABLES DUE FROM BANKS AND OTHER FINANCIAL INSTITUTIONS Loans per transaction accounts - 63,614 Overnight loans 1,250,312 - Other RSD loans 123, Other loans Interest and fees per deposits and off-balance sheet items Net Bank s RSD loans and receivables 1,374,884 64,867 Foreign currency accounts 86, ,003 Loans per foreign currency repo transactions 1,493,248 - Other foreign currency loans 345, ,455 Other general foreign currency deposits 53, ,570 Earmarked foreign currency deposits received in accordance with the regulations 4,838 4,586 Other earmarked foreign currency deposits 8,467 - Other foreign currency receivables 1,721 1,666 Interest and fees per deposits and off-balance sheet items Net Bank s FX loans and receivables 1,993, ,420 Impairment allowance (345,169) (288,487) Total Bank s loans and receivables, net as at December 31 3,022, ,800 27
30 LOANS AND RECEIVABLES DUE FROM CUSTOMERS Loans and receivables due from customers breakdown per product Loans per transaction accounts 973,906 1,118,867 Consumer loans 79, ,373 RSD loans for liquidity maintenance and working capital 12,357,790 7,787,837 RSD export loans 51,488 51,488 Investment loans 3,538,180 3,386,331 Housing loans 4,535,222 4,303,909 Cash loans 6,924,341 6,040,263 Other RSD loans 7,660,840 9,186,471 Receivables from factoring with the right to recourse 2,903 14,958 Receivables for acceptances, bills of exchange and payments per guarantees called on 961, ,283 Other loans and receivables 19,095 22,526 Interest and fees per deposits and off-balance sheet items 89,040 56,350 Net Bank s RSD loans and receivables 37,193,260 33,041,656 Foreign currency cheques Foreign currency loans for payment of imported goods and services 227, ,195 Other foreign currency loans 80,902 77,072 Other foreign currency earmarked deposits 109,411 91,441 Other foreign currency loans and receivables 1,578 1,042 Interest and fees per deposits and off-balance sheet items 2,924 3,177 Net Bank s foreign currency loans and receivables 422, ,204 Impairment allowance (12,664,660) (12,859,427) Total Bank s loans and receivables, net as at December 31 24,950,874 20,658, Loans and receivables due from customers breakdown per industry Public companies 3,873,796 1,993,690 Corporate customers 8,430,876 6,771,900 Entrepreneurs 251, ,673 Public sector 40,628 47,916 Retail customers 10,714,678 10,020,402 Non-residents 117,764 99,494 Agricultural producers 339, ,616 Other customers 1,181,874 1,382,742 Total Bank s loans and receivables as at December 31 24,950,874 20,658,433 28
31 RECEIVABLES PER FINANCIAL DERIVATIVES DESIGNATED AS RISK HEDGING INSTRUMENTS With contracted risk hedges consumer price index growth Receivables per financial derivatives designated as risk hedging instruments 2,485 2,497 In foreign currencies Currency swap Total receivables per financial derivatives designated as risk hedging instruments as at December 31 2,485 2, INTANGIBLE ASSETS Licenses 153, ,087 Software 302, ,812 Total intangible assets 455, ,899 Impairment of intangible assets (22,558) (22,558) Accumulated amortization of intangible assets (354,466) (294,163) Intangible assets, net book value as at December 31 78,952 85, PROPERTY, PLANT AND EQUIPMENT Land Buildings 1,346,648 1,346,063 Equipment 1,486,788 1,460,152 Equipment in progress 17,247 45,935 Leasehold improvements 303, ,022 Total property, plant and equipment 3,154,400 3,112,311 Accumulated depreciation of property, plant and equipment (1,386,134) (1,298,461) Property, plant and equipment, net book value as at December 31 1,768,266 1,813,850 29
32 PROPERTY, PLANT AND EQUIPMENT (Continued) Movements on Property, Plant and Equipment, Investment Property and Intangible Assets: Land and Buildings Equipme nt and Other Assets Constructio n in Progress Intangible Assets Total Cost Balance, January 1, ,556,075 1,460,152 96, ,898 3,514,209 Additions 26,877 10, ,124 40, ,371 Transfers from construction in progress 83, ,550 (198,758) 13,449 - Disposals and retirements (17,331) (85,655) (1,218) - (104,204) Balance, ,649,380 1,486,788 18, ,976 3,610,376 Accumulated depreciation and amortization Balance, January 1, , , ,721 1,615,182 Charge for the year 39, ,146-60, ,331 Disposals and retirements (11,275) (85,080) - - (96,355) Balance, ,896 1,019, ,024 1,763,158 Net book value as of ,282, ,550 18,232 78,952 1,847,218 Land and Buildings Equipment and Other Assets Constructio n in Progress Intangible Assets Total Cost Balance, January 1, ,518,399 1,561,030 33, ,551 3,569,723 Additions 6,633 5, ,663 33, ,186 Transfers from construction in progress 40, ,977 (175,322) 6,021 - Disposals and retirements (9,281) (235,368) - (94,051) (338,700) Balance, ,556,075 1,460,152 96, ,898 3,514,209 Accumulated depreciation and amortization Balance, January 1, ,700 1,048, ,220 1,696,556 Charge for the year 37, ,275-67, ,013 Disposals and retirements (3,597) (234,739) - (94,051) (332,387) Balance, , , ,721 1,615,182 Net book value as of ,217, ,980 96,084 85,177 1,899,027 As of 2014 the Bank had no mortgages instituted over its property and equipment to securitize loan repayment. 26. INVESTMENT PROPERTY Investment property 36,261 42,798 Investment property, net book value as at December 31 36,261 42,798 30
33 CURRENT TAX ASSETS Current tax assets - 16,517 Current tax assets as at December 31-16, DEFERRED TAX ASSETS Deferred tax assets 7,264 5,524 Deferred tax assets as at December 31 7,264 5,524 Temporary difference amount Deferred tax amount Deductible temporary differences per depreciable assets deferred tax assets 20,305 3,046 Deductible temporary differences per provisions made for employee retirement benefits in accordance with IAS 19 deferred tax assets 10,912 1,637 Deductible temporary differences per unpaid public duties deferred tax assets 4, Deductible temporary differences per impairment losses deferred tax assets 12,240 1,836 Total as at ,427 7,264 At the year-end total deferred tax assets amounted to RSD 7,264 thousand. 29. NON-CURRENT ASSETS HELD FOR SALE AND ASSETS FROM DISCONTINUED OPERATIONS Non-current assets held for sale 200, ,336 Non-current assets held for sale as at December , ,336 Non-current assets held for sale as of 2014 comprise the following: Building properties Area Amount Apartment for sale, Prote Mateje 66, Beograd 151m² 14,877 Building in Novi Sad, Bulevar oslobođenja m² 18,170 Business premises, Knjaževačka bb., Niš 15.16m² 987 Residential premises Slatinski venac 5a Vrnjačka Banja m² 166, ,339 31
34 OTHER ASSETS In RSD RSD fee and commission receivables per other assets 23,597 23,786 RSD receivables from sales 103,140 55,881 Interest receivables per other assets 20 2 Total receivables for fees, sales, and other assets 126,757 79,669 Impairment allowance (45,741) (35,586) Receivables for fees, sales, and other assets, net 81,016 44,083 Receivables arising from RSD advances for working capital 11,952 15,387 Receivables arising from advances for property, plant and equipment 16,056 17,554 RSD receivables from employees Receivables arising from prepaid taxes and contributions 19,433 16,010 Other RSD receivables from operations 196, ,709 RSD suspense and temporary accounts (1,458) (6,485) RSD receivables in settlement 238, ,099 Total other receivables and advances paid 481, ,422 Impairment allowance (172,111) (165,107) Other receivables and advances paid, net 309, ,315 Inventories Tangible assets received in lieu of debt collection 22,310 13,934 Tools and fixtures in use 2,406 2,956 Total inventories 25,058 17,376 Impairment allowance (2,406) (2,956) Inventories, net 22,652 14,420 In foreign currencies Other receivables from regular operations for determining foreign currency income 5,480 5,187 Total other receivables 5,480 5,187 Impairment allowance (5,472) (5,171) Other receivables, net 8 16 Receivables arising from foreign currency advances for working capital Foreign currency advances paid 5,114 4,452 Foreign currency receivables from employees 2,268 2,436 Other foreign currency receivables from operations 3,077 2,749 Foreign currency suspense and temporary accounts (609) (578) Foreign currency receivables in settlement 15,918 22,205 Total other receivables and advances paid 26,197 31,552 Impairment allowance (4,458) (4,297) Other receivables and advances paid, net 21,739 27,255 Deferred other RSD expenses 22,383 9,608 Other RSD prepayments 2,588 3,762 Deferred foreign currency interest expenses Deferred other foreign currency expenses 3,287 1,628 Other foreign currency prepayments Total deferred receivables 28,647 15,780 Total other assets as at December , ,869 32
35 PROVISIONS FOR IDENTIFIED LOSSES PER BALANCE SHEET ITEMS Provisions for interest, fee and sales receivables and prepayments 232, ,540 Provisions for loans, deposits and other advances 12,828,046 13,059,132 Provisions for securities 541, ,289 Provisions for other receivables 176, ,413 Total provisions for potential losses per balance sheet items as at December 31 13,778,680 13,924,374 Movements on provisions for identified losses per balance sheet items in 2014 were as follows: Opening balance Increase during the year Decrease during the year Prior years decrease FX differences Closing balance Write-off Provisions for interest, fee and sales receivables and prepayments 129,540 (22,614) 167,192 (25,316) (16,848) 1, ,995 Provisions for loans, deposits and other advances 13,059,132 (940,667) 2,324,032 (836,684) (1,042,636) 264,869 12,828,046 Provisions for securities 563,289 (13) - - (22,586) ,069 Provisions for other receivables 172,413 (11,239) 39,603 (9,826) (14,792) ,570 Total provisions for potential losses per balance sheet items 13,924,374 (974,533) 2,530,827 (871,826) (1,096,862) 266,700 13,778,680 Movements on provisions for identified losses per balance sheet items in 2013 were as follows: Opening balance Increase during the year Decrease during the year Prior years decrease FX differences Closing balance Write-off Provisions for interest, fee and sales receivables and prepayments 110,355 (14,109) 98,608 (28,794) (36,811) ,540 Provisions for loans, deposits and other advances 9,604,499 (1,401,898) 7,138,177 (844,232) (1,446,418) 9,004 13,059,132 Provisions for securities 577,212 (11,873) 13,999 (3,791) (12,188) (70) 563,289 Provisions for other receivables 179,041 (29,446) 77,150 (4,472) (49,835) (25) 172,413 Total provisions for potential losses per balance sheet items 10,471,107 (1,457,326) 7,327,934 (881,289) (1,545,252) 9,200 13,924,374 Required Reserve for Estimated Losses Based on the categorization of loans and receivables in accordance with the regulations of the National Bank of Serbia, the Bank calculated the reserve for estimated losses based on the total Bank's exposure to credit risk as of Calculated reserve for estimated losses in accordance with the Decision of the National bank of Serbia per: Balance sheet assets 18,452,693 Off-balance sheet items 171,294 Total 18,623,987 33
36 PROVISIONS FOR IDENTIFIED LOSSES PER BALANCE SHEET ITEMS (Continued) Required Reserve for Estimated Losses (Continued) Impairment allowance and provisions calculated in accordance with the internally adopted methodology (IAS 39): Impairment allowance of balance sheet assets 13,776,693 Provisions for losses per off-balance sheet items 183,736 13,960,429 Pursuant to the NBS Decision on the Classification of Balance Sheet Assets and Off-Balance Sheet Items, the sum of positive differences between the reserve for estimated losses calculated in accordance with the aforecited decision and the amount of impairment allowance of balance sheet assets and provisions for losses per off-balance sheet items in accordance with the internally adopted methodology represents the amount of the required reserve for estimated losses. If the amount of impairment allowance for balance sheet assets and off-balance sheet items exceeds the amount of the reserve for potential losses as calculated for an individual borrower, the Bank is under no obligation to calculate the required special reserve for potential losses per balance sheet assets and off-balance items. Required reserve for estimated losses per balance sheet assets and off-balance sheet items 5,033, FINANCIAL LIABILITIES AT FAIR VALUE THROUGH PROFIT AND LOSS HELD FOR TRADING Currency swap 10,571 - Total financial liabilities at fair value through profit and loss held for trading as at December 31 10, LIABILITIES PER FINANCIAL DERIVATIVES DESIGNATED AS RISK HEDGING INSTRUMENTS With contracted risk hedges consumer price index growth Liabilities per financial derivatives designated as risk hedging instruments In foreign currencies Currency swap - 12,505 Total liabilities per financial derivatives designated as risk hedging instruments as at December ,681 34
37 DEPOSITS AND OTHER LIABILITIES DUE TO BANKS, OTHER FINANCIAL INSTITUTIONS AND THE CENTRAL BANK In RSD Transaction deposits 345,205 23,310 Earmarked deposits 4,392 5,805 Other deposits 2,573 12,223 Overnight deposits and borrowings - 556,089 Other financial liabilities 10,213 6,799 RSD deposits and other liabilities 362, ,226 In foreign currencies Transaction deposits 36,918 54,831 Earmarked deposits Other deposits 152, ,447 Other financial liabilities 1 25 Foreign currency deposits and other liabilities 189, ,372 Total deposits and other liabilities due to banks, other financial institutions and the central bank as at December , , DEPOSITS AND OTHER LIABILITIES DUE TO CUSTOMERS Deposits and other liabilities due to customers breakdown per product In RSD Transaction deposits 6,625,732 3,795,285 Savings deposits 417, ,318 Deposits based on approved loans 30,748 2,148 Earmarked deposits 333, ,554 Other deposits 2,191, ,404 Overnight deposits 1,009, ,881 Borrowings 2,675 2,675 Other financial liabilities 75,176 75,866 RSD deposits and other liabilities 10,685,928 5,654,131 In foreign currencies Transaction deposits 3,388,199 1,831,437 Savings deposits 9,786,531 8,189,671 Deposits based on approved loans 481, ,186 Earmarked deposits 406, ,993 Other deposits 990, ,889 Other financial liabilities 188,968 42,562 Foreign currency deposits and other liabilities 15,242,091 11,178,738 Total deposits and other liabilities due to customers as at December 31 25,928,019 16,832,869 35
38 DEPOSITS AND OTHER LIABILITIES DUE TO CUSTOMERS (Continued) Deposits and other liabilities due to customers breakdown per industry Holding companies - 9 Public companies 2,413, ,635 Corporate customers 6,478,136 3,873,947 Entrepreneurs 586, ,577 Public sector 2,030, ,619 Retail customers 12,693,869 10,426,249 Non-residents 956, ,402 Agricultural producers 260, ,724 Other customers 508, ,707 Total deposits and other liabilities due to customers as at December 31 25,928,019 16,832, SUBORDINATED LIABILITIES Subordinated liabilities in foreign currency 976,100 3,217,972 Deferred interest payable per subordinated liabilities in foreign currency 1,445 5,674 Total subordinated liabilities as at December ,545 3,223,646 Decrease in liabilities for subordinated loans was a result of conversion of subordinated debt into the Bank's equity in 2014 (Note 46). 37. PROVISIONS Provisions for potential litigation losses 19,131 27,597 Provisions for losses per off-balance sheet items 183, ,301 Provisions for retirement benefits 10,912 10,265 Total provisions as at December , ,163 Movements on provisions are presented in the table below: Provisions for potential litigation losses Balance as at January 1 27,597 30,892 Charge for the year 17,257 26,386 Reversal of provisions (25,723) (29,681) Balance as at December 31 19,131 27,597 Provisions for losses per off-balance sheet items Balance as at January 1 163, ,599 Charge for the year 58,286 58,033 Reversal of provisions (38,837) (26,386) Foreign exchange differences Balance as at December , ,301 Provisions for retirement benefits Balance as at January 1 10,265 10,025 Charge for the year 3,639 2,875 Reversal of provisions (2,992) (2,635) Balance as at December 31 10,912 10,265 36
39 CURRENT TAX LIABILITIES Current income tax expense liabilities - subsidiary Total current tax liabilities as at December OTHER LIABILITIES In RSD Fees and commission payable per other liabilities 8,041 6,514 Trade payables 81,039 91,716 Advances received 47,369 48,324 Dividend payment liabilities 198, ,779 Liabilities per managed funds 18 - Other liabilities from operations 28,903 30,964 Liabilities in settlement 32,691 27,187 Total other liabilities 396, ,484 Net salaries 71 - Payroll taxes 10 - Payroll contributions 21 1 Other liabilities to employees 1, Value added tax payable 4,117 3,124 Other taxes and contributions payable 2,625 4,144 Total liabilities for salaries, taxes and contributions 8,660 7,523 Accrued liabilities for other expenses 155, ,995 Deferred interest income 9, Deferred other income 10,062 12,923 Other accruals 462 1,588 Total accruals 175, ,448 In foreign currencies Fees and commission payable per other liabilities 1,604 1,416 Trade payables 1,849 1,603 Advances received 21,443 16,650 Liabilities per managed funds Other liabilities from operations 1 1 Liabilities in settlement Temporary and suspense accounts 6 6 Total other liabilities 25,759 20,111 Accrued liabilities for other expenses 5,568 2,460 Deferred other income 158 1,563 Total accruals 5,726 4,023 Total other liabilities as at December , ,589 37
40 OTHER LIABILITIES (Continued) Taxes Payable Value added tax payable 4,117 3,124 Payroll taxes charged to the Bank Payroll contributions charged to the Bank City development land fees 4 1,584 Other contributions communal tax for business sign display 1,277 1,439 Personal income tax payables 1, Other taxes and contributions payable Total taxes payable as at December 31 6,742 7, Dividend Payment Liabilities Payment of dividend regular shares 19,544 19,544 Payment of dividend preferred shares Payment of dividend regular shares for prior years (prior to 2003) Payment of dividend preferred shares for prior years (prior to 2003) Payment of dividend regular shares for ,157 4,157 Payment of dividend preferred shares for Payment of dividend regular shares for ,337 6,337 Payment of dividend preferred shares for Payment of dividend preferred shares for ,849 8,849 Payment of dividend preferred shares for ,282 47,282 Payment of dividend preferred shares for ,282 47,282 Payment of dividend preferred shares for ,282 47,282 Payment of dividend preferred shares for ,749 7,749 Payment of dividend preferred shares for ,924 4,924 Payment of dividend preferred shares for ,636 1,636 Payment of dividend preferred shares for ,636 1,636 Payment of dividend preferred shares for ,636 - Total dividend payment liabilities as at December , ,779 Dividend payables based on preferred shares for 2014 were recognized in the Bank's income statement for the year 2014 in the amount of RSD 1,636 thousand. The Bank had no liabilities for current income tax in
41 EQUITY Equity is includes issued capital, reserves, share issue premium, retained earnings and accumulated losses. The Bank's share capital is comprise of regular (common stock) shares and preferred cumulative and non-cumulative shares ISSUED CAPITAL Ordinary shares 9,900,866 7,589,230 Non-cumulative preferred shares 6,745,961 6,745,961 Cumulative preferred shares 54,544 54,544 Total issued capital 16,701,371 14,389,735 Other capital 1,543 1,543 Share issue premium 2,563,562 2,563,562 RESERVES Revaluation reserves from valuation of intangible assets, property, plant and equipment 229, ,518 Revaluation reserves from changes in fair value of securities available for sale 1,808 3,826 Legal and statutory reserves 15,776 15,776 Unrealized losses on securities available for sale (3,671) (3,377) Actuarial losses per defined employee contribution plans (273) - Total reserves 242, ,743 RETAINED EARNINGS Prior years retained earnings 6,538 5,334 Current year s retained earnings 99,819 - Total retained earnings 106,357 5,334 Prior year losses (7,216,074) (7,216,074) Equity as at December 31 12,399,488 9,991,843 Based on the Decision enacted by the Bank's Assembly as of January 3, 2013 and the Decision of the Serbian Business Registers Agency no. BD 2422/2013 dated January 17, 2013, the Bank realized the 28th share issue for the purpose of increasing core capital for the total of RSD 4,525,974 thousand, i.e. 91,360 non-cumulative preferred shares of the individual par value of RSD 49,540. The shares were purchased by OTP Bank Ltd., Budapest and paid in cash. Based on the Decision enacted by the Bank's Assembly as of January 15, 2014 and the Decision of the Serbian Business Registers Agency no. BD 15253/2014 dated February 26, 2014, the Bank realized the 29th share issue for the purpose of increasing core capital for the total of RSD 2,311,635 thousand, i.e regular shares with the individual par value of RSD 49,540. The core capital was increased through conversion of debt due to OTP Bank Ltd. Budapest into equity (Note 46). As of 2014 the Bank had 199,856 ordinary shares with the individual par value of RSD 49,540 as well as 1,101 cumulative preferred shares with the individual par value of RSD 49,540 and 136,172 non-cumulative preferred shares with the individual par value of RSD 49,540. The Bank recognizes cumulative preferred shares as complex financial instruments in accordance with IAS 32, paragraph 29. Revaluation reserves from equity investments were formed by determining the market value of securities available for sale. 39
42 EQUITY (Continued) Shareholder Structure As of 2014, the Bank had the total of 67 shareholders ( 2013: 68 shareholders). The shareholders structure as of 2014 with interest of over 1% and data on the number of shares as registered in the Central Securities Depository and Clearing House were as follows: Ordinary Shares Shareholder Book Value Share Count % of Interest OTP ban.rt. Budapest, Hungary 9,597, , % Home Art & Sales Services a.g. 265,832 5, % Total 9,863, , % Other shareholders 37, % Total ordinary shares 9,900, , % Preferred Cumulative Shares Shareholder Book Value Share Count % of Interest Republic of Serbia 27, % AIK Niš d.o.o., Niš 8, % OTP bank. Rt. Budapest, Hungary 7, % FAM a.d., Kruševac 2, % Ambalažno staklo d.o.o, Paraćin 1, % Mladost a.d. Odžaci 1, % Kompanija Vojvodinaput a.d., Novi Sad. 1, % SL Mitros a.d., Sremska Mitrovica % Zastava Promet a.d., Sombor % Total 50,630 1, % Other shareholders 3, % Total preferred cumulative shares 54,544 1, % Preferred Non-Cumulative Shares Shareholder Book Value Share Count % of Interest OTP bank Rt. Budapest, Hungary 6,745, , % Total preferred non-cumulative shares 6,745, , % Earnings per Share The Bank did not calculate earnings per share given the fact it was deleted from the Register of Public Companies under Decision of the Securities Commission no. 4/ /3-12 dated May 21, MANAGED FUNDS Other corporate customers 21,992 23,962 Public sector 56,802 55,240 Total managed funds as at December 31 78,794 79,202 40
43 GUARANTEES AND OTHER SURETIES ISSUED, SURETIES TO SECURITIZE LIABILITY SETTLEMENT, COLLATERALS, IRREVOCABLE COMMITMENTS AND OTHER LIABILITIES Guarantees and other sureties issued Payment guarantees 822, ,364 Performance bonds 1,671, ,774 Acceptances 14,744 14,744 Letters of credit 12,214 17,460 Letters of intent Total guarantees and other sureties issued 2,521,538 1,470,342 Commitments for undrawn RSD loans and facilities, irrevocable without prior notice 1,977, ,403 Other commitments, irrevocable without prior notice in RSD 47,275 12,165 Total guarantees and other sureties issued, sureties to securitize liability settlement, collaterals, irrevocable commitments and other liabilities as at December 31 4,546,364 1,823, DERIVATIVES Derivatives designated as risk hedging instruments at contractual price - swaps - 2,675,383 Derivatives held for trading at contractual price - swaps 4,291,414 - Total derivatives as at December 31 4,291,414 2,675,383 As of 2014, the Bank had contracted swop transactions. Receivables arising from the fair value changes in derivatives: Fair value Fair value Contracted nominal Contracted nominal amount Assets Liabilities amount Assets Liabilities Derivatives held for trading Currency swaps 4,291,414 1,732 10, Total 4,291,414 1,732 10, OTHER OFF-BALANCE SHEET ASSETS Received tangible asset collaterals 33,950,094 - Guarantees and other sureties received 3,284,828 1,539,576 Revocable commitments 2,336,187 1,577,774 Savings bonds 5,465,668 5,946,779 Repo transactions 1,391,020 2,500,000 Spot transactions 601,384 - Previously suspended interest 9,501,710 8,388,427 Other off-balance sheet assets 33,273 36,672 Other off-balance sheet assets as at December 31 56,564,164 19,989,228 As of 2014 the Bank recorded received tangible asset collaterals in the amount of RSD 33,950,094 thousand in accordance with the NBS regulations. The assets received include mortgage and pledge liens instituted over property and movable assets. 41
44 CONSOLIDATED STATEMENT OF COMPREHENSIVE INCOME Through the reclassification of financial assets available for sale, the Bank incurred a loss of RSD 786 thousand in 2014 and a loss of RSD 2,471 thousand in CASH AND CASH EQUIVALENTS In RSD: Gyro account 2,824,806 2,406,203 Cash on hand 511, ,661 Total RSD 3,336,019 2,964,864 In foreign currencies: Foreign currency accounts 86, ,003 Cash on hand in foreign currencies 266, ,669 Cheques in foreign currencies Other monetary items in foreign currencies 20,987 12,947 Total cash funds in foreign currencies 373, ,896 Gold and other precious metals 18,424 15,601 Total cash and cash equivalents as at December 31 3,728,039 3,403,361 For the purposes of the consolidated statement of cash flows, the Bank incudes the above listed items in cash and cash equivalents. 47. RELATED PARTY TRANSACTIONS Transactions with related parties take the form of founder s contributions, loans and deposits, provision and purchase of services within regular operating transactions with subsidiaries and associates in which the Bank holds significant equity interest or where the Bank has relations with the Parent Bank or an entity related to the Parent Bank. The following table presents the Bank s total receivables and payables to and from related parties as of 2014: 42
45 RELATED PARTY TRANSACTIONS (Continued) OTP Bank LTD Budapest OTP Financing Netherlands R.E.Four MOL Serbia OTP Factoring Receivables Interest receivables 1, Receivables per derivatives held for trading - 1, Other receivables Receivables from payment card transactions Foreign currency accounts - 15, Loans per foreign currency repo transactions - 1,493, Foreign currency suspense and temporary accounts Loans per transaction accounts and revolving loans 123, Deferred receivables for interest accrued per loans, deposits and other receivables in foreign currencies Other foreign currency prepayments Deferred other foreign currency expenses Total receivables 124,370 1,510, Payables RSD transaction deposits , ,855 Earmarked deposits 97 4, Overnight liabilities ,213 Other financial liabilities ,456 Interest liabilities ,367 Liabilities per derivatives held for trading - 10, Trade payables Other liabilities from operations ,605 - Value added tax payable 6 1, Accrued liabilities for other accrued RSD expenses Deferred income for receivables stated at amortized cost 1, Deferred other income Foreign currency transaction deposits - 6,098-5, ,186 Other foreign currency deposits ,192 - Foreign currency trade payables - 1, Subordinated liabilities , Accrued liabilities for interest on foreign currency subordinated liabilities - - 1, Accrued liabilities for other accrued foreign currency expenses Accrued liabilities for interest on loans, deposits and other foreign currency liabilities Deferred other foreign currency income Total liabilities 2, , ,546 31, ,179 43
46 RELATED PARTY TRANSACTIONS (Continued) OTP Bank LTD Budapest OTP Financing Netherlands R.E.Four MOL Serbia OTP Factoring Equity Issued capital 16,351, Total equity - 16,351, Total liabilities and equity 2,172 16,695, ,546 31, ,179 Total net 122,198 (15,184,184) (977,546) (31,793) (551,178) RSD guarantees and other sureties issued ,444 Derivatives held for trading at contractual price - 4,291, Other off-balance sheet assets in foreign currency - repo transactions - 1,391, Other off-balance sheet assets Treasury transactions - 149, Other off-balance sheet liabilities revocable commitments 26, ,909 21,421 Total off-balance sheet items 26,790 5,832,209-3,909 59,865 44
47 RELATED PARTY TRANSACTIONS (Continued) The following table presents the Bank s total receivables and payables to and from related parties as of 2013: OTP Bank LTD Budapest OTP Financing Netherlands R.E.Four MOL Serbia OTP Factoring Receivables Interest receivables Fee and commission receivables Receivables per derivatives held for trading Other receivables RSD suspense and temporary accounts Receivables from payment card transactions Foreign currency accounts - 12, Foreign currency suspense and temporary accounts - (566) Loans per transaction accounts and revolving loans 66, Other foreign currency deposited funds - 229, Deferred receivables for interest accrued per loans, deposits and other receivables in foreign currencies Other foreign currency prepayments Total receivables 66, , Payables RSD transaction deposits ,614 1,946 Earmarked deposits - 4, Other RSD deposits 9, Overnight liabilities - 556, ,703 Other financial liabilities ,878 Interest liabilities Liabilities per derivatives held for trading - 12, Trade payables 1, , Other liabilities from operations ,292 - Liabilities in settlement Value added tax payable Accrued interest liabilities in RSD Deferred income for receivables stated at amortized cost 1, Deferred other income Foreign currency transaction deposits - 5,780-2,382 1,802 Foreign currency earmarked deposits ,464 Foreign currency trade payables - 1, Subordinated liabilities - - 3,217, Accrued liabilities for interest in foreign currency - - 5, Deferred other foreign currency income - 1, Total liabilities 11, ,644 3,223,647 6, ,917 45
48 RELATED PARTY TRANSACTIONS (Continued) OTP Bank LTD Budapest OTP Financing Netherlands R.E.Four MOL Serbia OTP Factoring Equity Issued capital - 14,039, Total equity - 14,039, Total liabilities and equity 11,814 14,621,884 3,223,647 6, ,917 Total net 54,866 (14,380,080) (3,223,647) (6,427) (138,892) RSD guarantees and other sureties issued ,800 Receivables/payables per currency derivatives - 2,675, Commitments for loans per current accounts 53, Total off-balance sheet items 53,398 2,675, ,800 46
49 RELATED PARTY TRANSACTIONS (Continued) Foreign currency subordinated liabilities comprise the following amounts: Contractual amount Creditor Debt balance as at 2014 Ultimate maturity date Annual interest rate EUR 8,069,722 OTP Financing Netherlands EUR 8,069,722 September 5, month Euribor % p.a. As of January 9, 2013, the Bank repaid the subordinated debt due to OTP Financing Netherlands B.V. in the amount of EUR 40 million on the maturity date in accordance with the Subordinated Loan Agreement dated January 4, As of April 29, 2013, the Bank repaid the subordinated debt due OTP Financing Netherlands B.V. in the amount of CHF 24 million in accordance with the Subordinated Loan Agreement dated April 16, As of June 10, 2013, the Bank repaid the subordinated debt due OTP Financing Netherlands B.V. in the amount of EUR 40.2 million as well as the subordinated debt due to OTP Bank Ltd., Budapest in the amount of EUR 442, on the maturity date, as in accordance with the Subordinated Loan Agreement dated June 2, 2008 and the May 17, 2012 Receivable Transfer Agreement entered into by OTP Financing Netherlands as the Transferor and OTP Bank Ltd., Budapest as the Acquirer. As of January 9, 2014, OTP Banka Srbija a.d., Novi Sad received Notification on Assignment of Receivables per Subordinated Debt by the Creditor OTP Financing Netherlands to the Parent Bank OTP Bank LTD Budapest in the amount of EUR 20,000,000. The Agreement on Assignment of Receivables (Cession) was entered into by and between OTP Financing Netherlands as the Assignor and OTP Bank LTD Budapest as the Acquirer on January 6, 2014 relating to the assignment of receivables per Loan Agreement executed on March 11, 2008 and subsequently amended by Annex to the Agreement dated February 29, 2012 signed by OTP Bank Srbija a.d., Novi Sad as the Borrower and OTP Financing Netherlands as the Creditor. The change of creditor was made for the purpose of converting the subordinated debt into ordinary shares for capital increase. In accordance with the aforesaid, and based on the Debt to Equity Conversion Agreement executed on January 24, 2014 by and between OTP Bank Ltd., Budapest and OTP Banka Srbija a.d., Novi Sad, the Bank's subordinated loan liability was derecognized (Note 40). 47
50 RELATED PARTY TRANSACTIONS (Continued) Income and expenses from related party transactions in 2014 were as follows: OTP Factoring OTP Bank LTD Budapest OTP Financing Netherlands DSK Bank Plc OTP Banka Slovensko R.E. Four Income Interest income 12,626 17, Fee and commissions income 129 1, ,000 Other operating income ,022 - Other income Gains on the valuation of loans and receivables Gains on the changes in fair value of derivatives - 257, Foreign exchange gains - realized 20 69, ,226 Foreign exchange gains - unrealized - 197,358 4, ,306 1,902 Total income 13, ,307 4, ,865 24,130 Expenses Interest expenses ,067 44, ,835 Fee and commissions expenses Operating expenses 10,591 12, ,791 12,220 Losses on the impairment of balance sheet assets Other expenses Losses on the valuation of loans and receivables Losses on the changes in fair value of derivatives - 222, Foreign exchange losses - realized - 45, Foreign exchange losses - unrealized - 136,027 64, ,807 4,513 Total expenses 10, , , ,627 50,569 Total, net 2, ,797 (104,793) 441 (195) (25,762) (26,439) MOL Serbia 48
51 RELATED PARTY TRANSACTIONS (Continued) Income and expenses from related party transactions in 2013 were as follows: OTP Factoring OTP Bank LTD Budapest OTP Financing Netherlands DSK Bank Plc OTP Banka Slovensko R.E. Four Income Interest income 11,124 33,235-1,801 9,689 1,932 - Fee and commissions income 108 1, ,800 Other operating income Gains on the impairment of balance sheet assets Other income Gains on the valuation of loans and receivables ,071 - Gains on the changes in fair value of derivatives - 331, Foreign exchange gains - realized 22 72, ,614 Foreign exchange gains - unrealized - 177, ,761 11,053 20,744 2,098 1,320 Total income 11, , ,761 12,909 30,433 6,657 23,735 Expenses Interest expenses , , ,395 43,229 Fee and commissions expenses Operating expenses 10,299 13, ,828 11,227 Other expenses Losses on the valuation of loans and receivables Losses on the changes in fair value of derivatives - 203, Foreign exchange losses - realized - 30, Foreign exchange losses - unrealized - 169, ,339 8,024 54,641 6,035 1,927 Total expenses 11, , ,263 8,050 54,641 48,260 56,675 Total, net ,739 (182,502) 4,859 (24,208) (41,603) (32,940) MOL Serbia 49
52 RELATED PARTY TRANSACTIONS (Continued) In 2014 and 2013, the members of the Executive Board and Board of Directors were remunerated as follows: Gross salaries of Executive Board members 78,299 66,792 Net salaries of Executive Board members 66,493 56,729 Rental costs for Executive Board members 3,381 4,332 Use of company automobiles by the Executive Board members 2,351 3,084 Reimbursement of expenses incurred by the Executive Board members 41 1,94 Mobile phone costs of Executive Board members Gross remuneration to the Board of Directors 11,402 11,328 Net remuneration to the Board of Directors 8,518 8, RISK MANAGEMENT POLICIES Liquidity Risk Liquidity risk is associated with the adverse effects which the Bank s inability to settle its liabilities when due could have on the Bank s financial result and equity. The Bank continuously monitors its exposure to liquidity risk and its compliance with the set limits. During 2014 the Bank's liquidity was within the prescribed limits (liquidity and cash liquidity ratios). Cash liquidity ratio 2014 Liquidity ratio 2014 Liquidity ratio 2013 As of December Period's average Maximum Minimum The Bank maintains the portfolio comprised of highly liquid securities (issued by the National Bank of Serbia or the Republic of Serbia) and diversified assets that are easily convertible into cash in case of unforeseen and adverse fluctuations in the Bank's cash flows. The Bank also maintains the required level of dinar and foreign exchange reserve as required by the National Bank of Serbia. The Bank may call on liquid assets of its Parent Bank and, therefore, in case of deteriorating liquidity due to the financial market crisis the Bank may bridge its liquidity gap by borrowing from the Parent Bank. The Bank's adopted policies and procedures i procedure ensure adequate asset management and adequate liquidity level planning. In addition to the liquidity indicators prescribed by NBS< the bank uses the following methods for measuring liquidity risk exposure: Primary and operating liquidity level (liquid assets maturing up to a month and up to 3 months are compared to target values covering liabilities maturing in the period under review, corporate sector requirements and deposit shock, i.e., 99 percentile change in 3-month deposits); Regular stress testing; and Testing Contingency Financing Plan in Liquidity Crises. For the needs of measuring and monitoring liquidity risk, the Bank measures and monitors net cash flows, by keeping track of assets and liabilities according to their outstanding maturities, by measuring and comparing cash inflows and outflows, i.e. through the GAP analysis. Upon categorizing balance sheet items in the GAP report, the Bank observes the outstanding maturity principle. The Bank compiles a GAP report for dinars (RSD) that make 56% the Bank s total assets, as well as for significant currencies that make more than 1% of the Bank s total assets. Those currencies are Euro, comprising 36% of the Bank's total assets, Swiss franc (CHF) comprising 5% and American dollar (USD), comprising 3% of the Bank's total assets. 50
53 RISK MANAGEMENT POLICIES (Continued) Liquidity Risk (Continued) Total liquidity gap between the outstanding contractual maturities of financial assets and liabilities as of 2014 was as follows: Up to a Month From 1 to 3 Months From 3 to 12 Months From 1 to 5 Years Over 5 Years Matured Without Contractually Defined Maturity Total Cash and cash funds held with the central bank 6,154, ,987-6,175,546 Pledged financial assets Financial assets at fair value through profit and loss, held for trading 1, ,732 Financial assets available for sale 836,618 1,452,899 1,664,342 10, ,964,221 Financial assets held to maturity 21, ,609 Loans and receivables due from banks and other financial institutions 2,882, , , ,022,812 Loans and receivables due from customers 300,363 1,387,145 5,760,687 9,842,109 3,747,298 3,805, ,026 24,950,874 Receivables per financial derivatives designated as risk hedging instruments ,485-2,485 Other assets , , ,376 Total assets 10,197,655 2,840,044 7,612,826 9,852,471 3,747,298 3,916, ,424 38,275,655 Financial liabilities at fair value through profit and loss, held for trading ,571 10,571 Liabilities per financial derivatives designated as risk hedging instruments Deposits and other liabilities due to banks, other financial institutions and the central bank 384,861 21, , ,886 Deposits and other liabilities due to customers 16,230,796 2,516,469 5,726, , , , ,867 25,928,019 Subordinated liabilities , ,545 Other liabilities , , ,076 Total liabilities 16,615,657 2,538,306 5,871,122 2,040, , , ,495 27,659,273 Liquidity gap as of 2014 (6,418,002) 301,738 1,741,704 7,811,736 3,472,624 3,809,652 (103,071) 10,616,382 Liquidity gap as of 2013 (23,645) (1,333,675) 1,133,379 5,773,313 1,603,526 3,270,027 (2,190,783) 8,232,142 51
54 RISK MANAGEMENT POLICIES (Continued) Liquidity Risk (Continued) Liquidity Stress Test In addition to the liquidity management in the normal course of business, the Bank does periodical stress testing as well in order to identify and measure its liquidity risk exposure in extraordinary circumstances and analyze its potential effects on the cash flows. A stress test model entails a negative scenario based on the assumption that in extraordinary circumstances five largest depositors (scenario "A") and ten largest depositors (scenario "B") will withdraw their deposits. Total outflow of deposits in scenario A would amount to RSD 5,084,838 thousand and in scenario B RSD 6,426,059 thousand. Up to a Month From 1 to 3 Months From 3 to 12 Months From 1 to 5 Years Over 5 Years Matured Without Contractually Defined Maturity Financial assets 10,197,655 2,840,044 7,612,826 9,852,471 3,747,298 3,916, ,424 38,275,655 Scenario "A" 5,112,818 2,840,044 7,612,826 9,852,471 3,747,298 3,916, ,424 33,190,817 Scenario "B" 3,771,596 2,840,044 7,612,826 9,852,471 3,747,298 3,916, ,424 31,849,596 Financial liabilities 16,615,657 2,538,306 5,871,121 2,040, , , ,495 27,659,273 Scenario "A" 12,010,597 2,239,037 5,862,778 2,038, , , ,495 22,574,436 Scenario "B" 10,910,083 2,239,037 5,622,070 2,038, , , ,495 21,233,214 Gap as at Dec 31, 2014 (6,418,002) 301,738 1,741,705 7,811,736 3,472,624 3,809,652 (103,071) - Scenario "A" (6,897,779) 601,007 1,750,048 7,814,443 3,642,082 3,809,652 (103,071) - Scenario "B" (7,138,487) 601,007 1,990,756 7,814,443 3,642,082 3,809,652 (103,071) - Negative gap would arise in the first bucket because this bucket includes the total transaction deposits of the Bank's customers (RSD 10.3 billion) although their withdrawal could not be expected in the ensuing month. Given the fact that the Bank has at its disposal RSD 2.8 billion invested in the Interbank Market as well as RSD 3.95 billion invested in Treasury bills with maximum maturity of up to a year, by way of their partial sales the Bank could timely pay out early withdrawal of deposits in the assumed stress situations using a very conservative approach. On the other hand, when expected maturities are modified using the methodology of regrouping deposits based on their historical movements over the past 5 years, in the worst case (99% VaR), 24.74% of transaction deposits could be withdrawn during a month, while 75% comprises stable deposits (with expected maturities of over 2 years). In such an instance, the first bucket would be positive and the gap would amount to RSD 1,537,496 thousand. Given the aforesaid, the stress test revealed that, in the event of withdrawal of deposits by both 5 and 10 largest depositors, the Bank would manage to fulfill its obligations. If there were to be certain disorders in the ensuing period, i.e. if early warning indicators were to be exceeded, the Bank would respond in accordance with the Contingency Financing Plan in Liquidity Crises where both short-term and long-term measures for liquidity improvement are clearly defined Interest Rate Risk Interest rate risk reflects the uncertainty with respect to the Bank's revenues and capital due to possible fluctuations in interest rates. Interest rate risk exposure depends on the Bank's interest-bearing assets relative to its interest-bearing liabilities. The basic principle of managing interest rate risk arising from the Banking book is the principle of matching financial assets and liabilities per interest rate type (fixed or variable) and per maturity, i.e. per date of interest rate adjustment. The Bank informs the ALCO on the proportion of interest-sensitive assets and liabilities and on the compliance of the interest rate risk with the internally prescribed limits on a monthly basis. For the purpose of measuring interest rate risk exposure, the Bank uses the GAP analysis (mismatch analysis). The size of mismatch (GAP) for a certain time interval is indicative of the Bank's exposure to repricing risk. Total 52
55 RISK MANAGEMENT POLICIES (Continued) Interest Rate Risk (Continued) The following table shows the Bank's exposure to interest rate risk as of 2014: From 30 to 90 Days From 90 to 180 Days From 180 to 360 Days From 1 to 2 Years Over 2 Years Non-Interest Bearing Up to 30 Days Total Cash and cash funds held with the central bank 2,824, ,350,740 6,175,546 Fixed interest rate 2,824, ,824,806 Non-interest bearing ,350,740 3,350,740 Financial assets at fair value through profit and loss, held for trading ,732 1,732 Financial assets available for sale 836,618 1,452, , , ,362 3,964,221 Fixed interest rate 836,618 1,452, , , ,953,859 Non-interest bearing ,362 10,362 Financial assets held to maturity 21, ,609 Fixed interest rate 21, ,609 Loans and receivables due from banks and other financial institutions 2,934, ,823 3,022,812 Fixed interest rate 2,811, ,753 2,899,532 Variable interest rate 123, ,280 Loans and receivables due from customers 6,280,107 6,112,679 8,265,342 1,074, ,062 1,979, ,944 24,950,874 Fixed interest rate 1,475, , ,874 1,043, ,062 1,979, ,515 6,390,076 Variable interest rate 4,805,094 5,795,377 7,768,468 30, ,429 18,560,798 Receivables per derivatives designated as risk hedging instruments 2, ,485 Fixed interest rate 2, ,485 Other assets , ,376 Non-interest bearing , ,376 TOTAL ASSETS 12,900,614 7,565,578 9,014,221 1,989, ,062 1,979,395 4,396,977 38,275,655 Financial liabilities at fair value through profit and loss, held for trading 5, ,930 10,571 Fixed interest rate 5, ,641 Non-interest bearing ,930 4,930 Liabilities per derivatives designated as risk hedging instruments Fixed interest rate Deposits and other liabilities due to banks, other financial institutions and the central bank 393,434 19, , , ,886 Fixed interest rate 374,434 19, , ,451 Variable interest rate 19, ,000 Non-interest bearing ,435 11,435 Deposits and other liabilities due to customers 16,421,107 2,301,823 2,226,763 3,020, , , ,080 25,928,019 Fixed interest rate 14,080,608 2,301,823 2,226,763 3,020, , ,211-22,603,440 Variable interest rate 2,340, ,340,499 Non-interest bearing 984, ,080 Subordinated liabilities - 976, , ,545 Variable interest rate - 976, ,100 Non-interest bearing - - 1,445 1,445 Other liabilities , ,076 Fixed interest rate Variable interest rate Non-interest bearing , ,076 TOTAL LIABILITIES 16,820,358 3,297,760 2,353,943 3,020, , ,211 1,192,966 27,659,273 GAP at 2014 (3,919,744) 4,267,818 6,660,278 (1,030,492) (33,673) 1,468, CUMULATIVE GAP at 2014 (3,919,744) 348,074 7,008,352 5,977,860 5,944,187 7,412, GAP at 2013 (1,950,495) 1,068,663 3,953,235 (1,273,181) (478,066) (887,388) - CUMULATIVE GAP at 2013 (1,950,495) (881,832) 3,071,403 1,798,222 1,320, , As of 2014, the Bank realized total positive GAP of RSD 7,412,371 thousand. 53
56 RISK MANAGEMENT POLICIES (Continued) Interest Rate Risk (Continued) Overview of the Interest Rates of OTP Banka Srbija for 2014 Financial assets 1. Deposits due from banks RSD 5.80%-10.30% ON EUR 1) 0.10%-1.97% ON 2) 1.53%-1.71% 1W 3) 1.38%-1.56% 1M 2. Obligatory reserve interest-bearing portion 2.50% 3. Short-term loans to customers a) large-sized corporate customers from DF IR + 3% From 3M Euribor + 4.2% b) SME and entrepreneurs corporate DF IR +4.80% to DF IR +8.80% 3M Euribor+6.00% to 3M Euribor+10.00% c) small sized entities and entrepreneurs retail* DF IR +7.5% to DF IR +15.5% 3M Euribor+7.00% to 3M Euribor+15% d) retail clients private individuals 0% % 1% % 4. Long-term loans to customers a) large-sized corporate customers from DF IR + 3.5% from 3M Euribor % b) SME and entrepreneurs corporate DF IR +5.00% do DF IR +8.80% 3M Euribor+6.20% to 3M Euribor+10.80% c) small sized entities and entrepreneurs retail* DF IR +7.5% do DF IR +15.5% 3M Euribor+7.00% to 3M Euribor+15% d) retail clients private individuals 0% % 4.16% % Financial liabilities 1. Deposits due to banks 4%-10.50% ON 1) 0.05%-0.35% ON 2) 1.76% 1W 3) 1.82% 3M 2. Deposits and liabilities due to customers a) SME and large-sized entities b) JLS, AP and RS 1) from DF IR % to DF IR % (on term deposits) 2) 0.0% to 2.00% (on ON deposits) 1) discount NBS rate (on term deposits) 2) 0.0% to discount NBS rate (on demand and ON deposits) 0.80% to 2.00% (on term deposits) c) entrepreneurs from 5% to 7% (on term deposits) from 0.8% to 2% (on term deposits) d) retail clients private individuals 0-25% 0-10% Based on the GAP report on the interest-sensitive assets and liabilities, ALM and MO Unit calculates he sensitivity of the economic value of the Bank's equity to the interest rate fluctuations. The acceptable level of interest rate risk is defined by the limit of the maximum possible sensitivity of the Bank's net assets to the fluctuations in the market interest rates. The Bank examines several scenarios involving the parallel shifting of the yield curve as well as scenarios of the changes to the yield curve slopes (yield curve risk). Sensitivity to changes in interest rate risk is performed for each significant currency. 54
57 RISK MANAGEMENT POLICIES (Continued) Interest Rate Risk (Continued) Scenario Analysis In addition to the GAP analyses, interest rate risk is also monitored by way of scenario analysis i.e. by observing the impact of interest rate fluctuations on the Bank's economic value of equity. The scenario analysis includes interest bearing items from the banking book. RSD Scenario 1 Scenario 2 Scenario 3 Scenario 4 Scenario 5 Scenario 6 FX ;300;200;0;200; ;-300;-200;0;-200;-300 0;200;300;400 0;-200;-300;-400 Scenario 1 (+200) -393,199 93, ,114-22, ,420-63,606 Scenario 2 (-200) 57, , , , , ,381 Scenario 3 (+100) -325, , ,401 44, ,707 4,107 Scenario 4 (-100) -115, ,796-8, ,967 31, ,081 Scenario 5 (200; 150; 100; 0; 100; 200) -367, , ,348 3, ,653-37,839 Scenario 6 (-100; -75; -50; 0; -50; -100) -134, ,566-27, ,737 12, ,851 Scenario 7 (0; 100; 150; 200) -396,193 90, ,108-25, ,414-66,600 Scenario 8 (0; -100; -150; -200) 51, , , , , ,625 Promena EVE (najlošiji scenario) -396,193 Economic value of equity is defined as the net present value of all expected cash flows of the Bank. The process of the scenario analysis is comprised of two steps: a) Defining scenario of the change in interest rate, and b) Valuation of interest bearing items under selected scenarios. Change to the economic value of equity is calculated separately for each major currency. Major currencies are those that make above 1% of the Bank s total assets. For each major currency adequate yield curve was taken into consideration. The Bank defined the following scenarios of changes to interest rates: a) Parallel shift of each yield curve by +/- 200 bp,100 bp (except for RSD currency); b) Steep yield curve changes in the slope of the yield curve are assumed for the following periods: up to 3 months; from 3 months to 3 years; from 3 ears to 10 years; over 10 years: - for FX: 0; ±100 bp; ±150 bp; ±200 bp - for RSD: 0; ±200 bp; ±300 bp; ±400 bp c) Yield curve with amplitude changes in the slope of the yield curve are assumed for the following periods: up to 3 months; from 3 months to year; form 1 year to 3 years; from 3 to 4 years; from 4 to 10 years; over 10 years: - case 1 for FX: +200 bp; +150 bp; +100 bp; 0; +100 bp; +200 bp. - case 2 for FX: -100 bp; -75 bp; -50 bp; 0; -50 bp; -100 bp. - for RSD: ±400 bp; ±300 bp; ±200 bp; 0; ±200 bp; ±300 bp. d) 1% and 99% percentile of the changes to interest rates under review using changes within the time frame of one year and minimum 5 years of observations (only for RSD) Foreign Currency Risk Foreign currency risk is the risk from adverse effects on the Bank's financial result and its equity caused by changes in the foreign currency to dinar exchange rate. The exposure to foreign currency risk based on a certain currency represents potential changes in the value of receivables and payables of the Bank denominated in the given currency which may be ascribed to the movements in the exchange rate. Foreign currency risk arising from a certain currency is measured as the difference between the total amount of receivables and total amount of payables expressed in that currency (foreign currency gap). 55
58 RISK MANAGEMENT POLICIES (Continued) Foreign Currency Risk (Continued) The foreign currency risk ratio is the ratio of the total net foreign currency gap and the Bank's capital. The Bank is obligated to ensure that its total net foreign currency gap does not exceed 20% of its regulatory capital. Indexed EUR Indexed CHF Indexed USD Other RSD Total Item EUR CHF USD ASSETS Cash and cash funds held with the central bank 2,589,303-11, ,665-5,527 3,354,443 6,175,546 Financial assets at fair value through profit and loss, held for trading ,732 1,732 Financial assets available for sale ,964,221 3,964,221 Financial assets held to maturity ,609 21,609 Loans and receivables due from banks and other financial institutions 1,575,879-6,301-58,698-7,008 1,374,926 3,022,812 Loans and receivables due from customers 10,502,992 10,323,832 1,875,950 1,875,950 1,104, ,093-11,467,428 24,950,874 Receivables per financial derivatives designated as risk hedging instruments ,485 2,485 Intangible assets ,952 78,952 Property, plant and equipment ,768,266 1,768,266 Investment property ,261 36,261 Deferred tax assets ,264 7,264 Non-current assets held for sale and assets from discontinued operations , ,339 Other assets 97,804 75, , , ,368 TOTAL ASSETS (I) 14,765,978 10,399,678 1,893,859 1,875,950 1,381, ,093 12,535 22,640,025 40,693,729 LIABILITIES Financial liabilities at fair value through profit and loss, held for trading ,571 10,571 Liabilities per financial derivatives designated as risk hedging instruments Deposits and other liabilities due to banks, other financial institutions and the central bank 187, , , ,887 Deposits and other liabilities due to customers 14,560, , ,038-37,527 10,685,924 25,928,019 Subordinated liabilities 977, ,545 Provisions 46,446 33, , ,780 Current tax liabilities Other liabilities 32,634 2, , , ,103 TOTAL LIABILITIES (II) 15,804,528 36, , ,431-37,667 11,804,219 28,294,241 BALANCE GAP (III=I-II) (1,038,550) - 1,694, ,901 - (25,132) - - Net forward position affecting the foreign currency risk OFF- BALANCE (IV) 800,149 - (1,692,209) - (934,203) - 23, NET FOREIGN CURRENCY GAP (III+IV) as of 2014 (238,401) - 2,254 - (1,302) - (1,912) - (241,615) NET FOREIGN CURRENCY GAP (III+IV) as of 2013 (11,557) - (2,059) - 1, (13,620) The process of foreign currency risk management in the Bank is in compliance with the limits set by the National Bank of Serbia, as well as internally-prescribed limits, which are by far more rigid. The limits of foreign currency risk are set so that the Bank protects itself against significant losses contingent on the movements in foreign currency to RSD exchange rates. The Bank manages foreign currency risk in an effective manner as evidenced by the foreign currency risk ratio, which in 2014 equaled 0.79%, the average, which is within the limit prescribed by the National Bank of Serbia. On the last day of the year 2014, the foreign currency risk ratio equaled 3.46%. 56
59 RISK MANAGEMENT POLICIES (Continued) Foreign Currency Risk (Continued) Sensitivity Analysis The following table provides details of the assessed effects of the middle exchange rate rise of 3%, 5% and 10% and their application on the amount of open currency gap for each individual foreign currency and on net open currency gap and subsequently the isolated effect of the newly obtained net open currency gaps on the financial result of the Bank, its capital and foreign exchange risk ratio. In RSD Stress +3% Stress +5% Stress +10% Middle exchange Open currency Open currency Open currency Net impact on the Open currency Net impact on Open currency Net impact on rate gap (FX) gap (RSD) gap result gap the result gap the result CAD 85,7495 (2) (207) (213) (6) (217) (10) (228) (21) CHF 100, ,254 2, , , EUR 120,9583 (1,971) (238,401) (245,553) (7,152) (250,321) (11,920) (262,241) (23,840) GBP 154,8365 (11) (1,702) (1,753) (51) (1,787) (85) (1,872) (170) SEK 12, (3) (3) - (3) - (3) - USD 99,4641 (13) (1,302) (1,341) (39) (1,367) (65) (1,432) (130) Net currency gap 241, , , ,777 Gold 18,282 18,830 19,196 20,110 Net impact on the financial result (7,180) (11,967) (23,936) Financial result (cumulative) 107, ,359 95,572 83,603 % of the profit for the year 6.68% 11.13% 22.26% Capital 7,519,138 7,511,958 7,507,171 7,495,202 Foreign exchange risk ratio 3.46% 3.56% 3.64% 3.81% Based on the analysis presented in the table above, even in the instance of increase in exchange rates of 10%, the foreign exchange risk ratio would still remain far below the prescribed limit of 20% Credit Risk The Bank is exposed to credit risk when approving loans and that risk represents a possibility that the borrower shall became incapable to fulfill due obligations, partially or in full. The Bank s internal acts, business policies and procedures require identification, measurement and assessment of credit risk according to debtor s creditworthiness, profitability and regularity in settlement of obligations toward the Bank, as well as the quality of collateral. The Bank assesses the recoverable value, i.e. loss on each loan prior to its approval through analyses that are in accordance with the prescribed credit analyses, and periodically (monthly) during the business relationship. Provisions for risks of potential losses are assessed pursuant to the internal methodology in accordance with IAS 39, as well as the regulations of the National Bank of Serbia. The amount of provisions against loan losses carried at amortized cost is computed by discounting future cash flows. In accordance with its internally adopted procedures, the Bank assesses whether there is objective evidence of impairment in financial assets at each reporting date. Most common objective evidence includes: customers' significant financial difficulties, breach of contract, insolvency and liquidation. Should it be determined that there is objective evidence of impairment in financial assets, the amount of allowance for impairment is determined as the difference between the asset's carrying value and the present value of future cash flows calculated applying the effective interest rate of the financial asset. The projections of expected cash flows to be collected take into account the financial position of a customer, as well as the agreement achieved with the customer, value, quality and marketability of collaterals provided. The allowance for impairment of balance sheet assets calculated in this manner and provisions for losses on off-balance sheet items are charged to the Bank's expenses The assessment of objective evidence of impairment is carried out on individual basis for individually significant financial assets. The assets that are individually assessed for impairment with their respective allowance for impairment recorded are not taken into account in the group assessment.. 57
60 RISK MANAGEMENT POLICIES (Continued) Credit Risk (Continued) The assessment is made on a portfolio basis (group assessment) for all assets that are not individually significant and for impairments that are likely to be found in the portfolio but for which there is no objective evidence of individual impairment. Group level assessment is diversified according to criteria based on the type of debtor, type of asset and its maturity, into subgroups with similar characteristics. Special reserve for potential losses is determined in accordance with the relevant NBS regulations. Loans, receivables and other Bank exposures are classified into the categories A, B, V, G and D, in accordance with the evaluation of their collectability, depending on: the number of days the payments of principal and interest due are in arrears, evaluation of the debtor financial standing and credit worthiness and quality of collaterals. The estimated amount of special reserve for potential losses is calculated by applying the following percentages per loan category: A - 0%, B - 2%, V - 15%, G - 30% and D 100%. The amount of the required special reserve for potential losses represents the sum of determined positive differences between the reserve for estimated losses calculated according to the NBS regulations (Official Gazette of RS nos. 94/11, 57/12, 123/12, 43/13, 113/13 and 135/14) and the calculated amount of allowance for impairment of balance sheet assets and provisions for losses per off-balance sheet items determined in accordance with the Bank s internal methodology Credit Commitments Guarantees, other forms of sureties and letters of credit issued are irrevocable commitments that the Bank will make payment in case the customer is unable to settle its liabilities towards third parties when due and are therefore treated as loan equivalents. Credit commitments also represent unused portions of frame loans (revolving loans, current account overdrafts, credit cards and the like), which are treated depending on the cancellability and outstanding maturity. Given that credit risk is associated with credit commitments, the Bank may incur loss in the amount equaling total undrawn funds. However, the anticipated amount of loss is below the total undrawn funds. The Bank makes provisions and includes those within expenses for commitments according to its internal methodology for loans and receivables Maximum Credit Risk Exposure before Receiving Collaterals and other Means that Improve Securities' Credit Rating The table below represents the maximum credit risk exposure without reference to collaterals or other means that improve securities' credit rating Financial assets available for sale 4,439,967 2,736,488 Financial assets held to maturity 73,087 51,478 Loans and receivables due from banks and other financial institutions 3,369, ,238 Loans and receivables due from customers 37,806,125 33,479,325 Other assets 358, ,556 Maximum gross exposure per balance sheet assets 46,046,330 37,494,085 58
61 RISK MANAGEMENT POLICIES (Continued) Credit Risk (Continued) Maximum Credit Risk Exposure before Receiving Collaterals and other Means that Improve Securities' Credit Rating (Continued) Loans Payment guarantees 822, ,364 Performance bonds 1,581, ,774 Acceptances 14,745 14,745 Letters of credit 12,214 17,460 Irrevocable commitments 2,025, ,567 Receivables from derivatives - 2,675,383 Other off-balance sheet assets 2,937,578 1,577,775 Maximum gross exposure per off-balance sheet items 7,393,570 6,077,068 Total provisions for impairment of loans amounted to RSD 13,009,828 thousand (2013: RSD 13,061,124 thousand), out of which RSD 10,203,275 thousand represents provisions for individual impairment of loans, whereas the remaining balance of RSD 2,806,553 thousand refers to group-level provisions. Neither Due nor Impaired Due but not Impaired Impaired Impairment Allowance for Loans Impaired Individually Impairment Allowance for Loans Impaired on a Group Level Total Impairment Allowance Total Net Housing loans 2,717,670 57,943 1,777, , , ,025 3,665,755 Overdrafts 245,885 16, , , , ,039 Cash loans 5,540,044 1,707 1,477, , ,549 6,030,512 Credit cards 454,643 1, ,781 4, , , ,166 Consumer loans 11, ,023-65,538 65,538 13,091 Other consumer loans 494,993 28, , , , , ,694 SME 628,569 77,099 2,483,820 1,384, ,076 2,068,909 1,120,579 Corporate 9,387,549 62,776 11,104,151 7,617,133 97,713 7,714,846 12,839,629 Municipalities - - 1,700-1,700 1,700 - Loans to banks 2,933,137 90, , , ,169 3,023,903 At ,414, ,434 18,424,677 10,203,275 2,806,553 13,009,828 28,165,368 Neither Due nor Impaired Due but not Impaired Impaired Impairment Allowance for Loans Impaired Individually Impairment Allowance for Loans Impaired on a Group Level Total Impairment Allowance Total Net Housing loans 2,635,003 52,882 1,625, , , ,622 3,526,586 Overdrafts 267,446 4, , , , ,573 Cash loans 4,901,824 1,560 1,162, , ,173 5,325,973 Credit cards 543,042 1, ,556 4, , , ,020 Consumer loans 24, ,885-63,855 63,855 28,521 Other consumer loans 281,216 15, , , , , ,042 SME 426, ,128 2,528,500 1,384, ,349 2,062, ,758 Corporate 5,946, ,997 11,685,364 8,116, ,543 8,255,931 9,484,181 Municipalities - - 1,700-1,700 1,700 - Loans to banks 355, , , , , ,783 At ,381, ,605 18,457,525 10,530,351 2,530,773 13,061,124 21,228,438 59
62 RISK MANAGEMENT POLICIES (Continued) Loans (Continued) Loans neither Due nor Impaired The Bank improved the loan portfolio credit quality in 2014 as compared to 2013 by adequate loan monitoring, new loan approvals and decisions on write-off. Loans neither due not impaired account for 54.44% of all loans. Performing Loans Special Watch Loans Loans below Average Doubtful Loans Bad Loans Total Housing loans 2,597,850 24,992 14,642 17,588 62,598 2,717,670 Overdrafts 245, ,885 Cash loans 5,539, ,540,044 Credit cards 454, ,643 Consumer loans 11, ,596 Other consumer loans 480,540 1,849 2,929 4,645 5, ,993 SME 609,334 2,305 11,876 5, ,569 Corporate 9,382,552-4, ,387,549 Loans to banks 2,933, ,933,137 At ,255,228 29,270 34,671 27,287 67,629 22,414,085 Performing Loans Special Watch Loans Loans below Average Doubtful Loans Bad Loans Total Housing loans 2,528,910 11,836 27,335 25,849 41,073 2,635,003 Overdrafts 267, ,446 Cash loans 4,901, ,901,824 Credit cards 542, ,042 Consumer loans 24, ,458 Other consumer loans 268,719 1, ,807 7, ,216 SME 404,999-18,460 3, ,490 Corporate 5,800, ,492 2, ,946,751 Loans to banks 355, ,203 At ,094, ,484 49,206 32,694 48,398 15,381, Loans Due but not Impaired The gross amount of loans according to customer classes that are in default but are not impaired was as follows: Up to 30 Days Past Due Days Past Due Days Past Due Days Past Due Days Past Due 1-5 Years Past Due Maturing after 5 Years Total Housing loans 1, ,066 36,208 14,313 57,943 Overdrafts 16, ,665 Cash loans 1, ,707 Credit cards 1, ,422 Consumer loans Other consumer loans 6, ,552 6,697 28,047 SME 19, ,424 48,408 1,340 77,099 Corporate 22,472 36, ,813-62,776 Municipalities Loans to banks 88, ,230 90,763 At ,089 37, ,124 11, ,980 24, ,434 Collateral fair value 18,355 37, ,528 63,506 22, ,544 60
63 RISK MANAGEMENT POLICIES (Continued) Loans (Continued) Loans Due but not Impaired (Continued) Up to 30 Days Past Due Days Past Due Days Past Due Days Past Due Days Past Due 1-5 Years Past Due Maturing after 5 Years Total Housing loans ,829 45,549 2,261 52,882 Overdrafts 4, ,054 Cash loans 1, ,560 Credit cards 1, ,633 Consumer loans Other consumer loans , ,275 12,086-15,737 SME 43, ,413 7, ,128 Corporate 63,224-40, , ,997 Loans to banks 164, , ,580 At ,511 1,019 42, ,519 69,691 4, ,605 Collateral fair value 48,876 1,019 42, ,161 67,886 2, ,607 Collaterals In accordance with the regulations and the Bank's internally adopted bylaws, the Bank is under obligation to ensure a timely collateral valuation for realized loans. The fair value of the collaterals held by the Bank is provided in the table below: Collateral type Number of collaterals held by the Bank Appraised collateral value in RSD 000 Mortgage liens 4,050 34,901,010 Deposits ,772 Pledge liens ,191,159 Guarantees 11 3,947,459 Fair value of foreclosed collaterals is provided below: Year Fair value 389,602 84, Restructured Loans Loan restructuring activities are performed when it is highly unlikely that the debtor will be able to settle the liability towards the Bank in full and in accordance with the terms stipulated in the relevant loan agreement. The restructuring activities include redefining debtor-creditor relations by way of replacing all balance sheet receivables or their larger part, extending repayment dates for principal or interest, decreasing interest rate or amount receivable. If, after such reschedule, the debtor s settlement of liabilities is regular, such a loan is no longer treated as non-performing. The decision on loan rescheduling is enacted when the Bank, once having reviewed the financial standing of a customer, its program for financial consolidation and its market potential, determines that the restructuring or rescheduling of the liabilities could assist the customer in overcoming the current difficulties in operations and resume timely discharge of its financial liabilities through future business operation and financial results. In the course of 2014 the Bank restructured/rescheduled loans in the aggregate amount of EUR 31,588 thousand Risk Concentration in Financial Assets Exposed to Credit Risk The risk concentrations occur due to financial instruments with similar characteristics which are similarly influenced by the changes in economic and other conditions. 61
64 RISK MANAGEMENT POLICIES (Continued) Loans (Continued) Risk Concentration in Financial Assets Exposed to Credit Risk (Continued) a) Concentration per Region The following tables provide the breakdown of the Bank s major exposures based on the carrying values, categorized based on geographic regions at 2014 and For the purpose of preparing these tables, the Bank determined the exposures per regions of the Republic of Serbia. Vojvodina Belgrade Serbia Total Financial assets available for sale 4,218,515 99, ,670 4,439,967 Financial assets held to maturity 38,805 6,973 27,309 73,087 Loans and receivables due from banks and other financial institutions 3,368, ,369,071 Loans and receivables due from customers 17,848,029 8,307,404 11,650,692 37,806,125 Other assets 173,207 60, , ,080 Maximum exposure per balance sheet assets as of ,647,282 8,475,379 11,923,669 46,046,329 Vojvodina Belgrade Serbia Total Financial assets available for sale 2,490, , ,820 2,736,488 Financial assets held to maturity 38,805 6,973 5,700 51,478 Loans and receivables due from banks and other financial institutions 810, ,238 Loans and receivables due from customers 16,312,833 6,740,383 10,426,108 33,479,325 Other assets 172,407 76, , ,556 Maximum exposure per balance sheet assets as of ,824,989 6,945,542 10,723,553 37,494,084 62
65 RISK MANAGEMENT POLICIES (Continued) Loans (Continued) Risk Concentration in Financial Assets Exposed to Credit Risk (Continued) b) Concentration per Industry The following table presents the values of Bank s exposures per different industry sectors the Bank s customers belong to. Finance Sector Manufacture Real Estate Trade Public Sector Other Entrepreneurs Retail Bankrupt Clients Total Financial assets available for sale 1, ,846 1,337-3,920,448 9, ,066 4,439,967 Financial assets held to maturity - 33, , ,347 73,087 Loans and receivables due from banks and other financial institutions 3,369, ,369,071 Loans and receivables due from customers - 8,441, ,942 3,287,528 42,333 3,424, ,212 14,060,609 7,496,201 37,806,125 Other assets 9, ,715 12,502 26,924 4,023 8,659 22,504 32, , ,080 Maximum exposure per balance sheet assets as of ,379,865 8,809, ,753 3,315,610 3,966,804 3,442, ,716 14,093,256 7,948,002 46,046,329 Finance Sector Manufacture Real Estate Trade Public Sector Other Entrepreneurs Retail Bankrupt Clients Total Financial assets available for sale 5, ,946 1,360-2,193,000 9, ,689 2,736,488 Financial assets held to maturity - 12, , ,347 51,478 Loans and receivables due from banks and other financial institutions 810, ,238 Loans and receivables due from customers - 5,551, ,925 2,749,686 67,010 2,270, ,844 12,682,394 8,621,768 33,479,325 Other assets 11,059 87,539 19,471 40,873 4,213 10,956 31,156 60, , ,556 Maximum exposure per balance sheet assets as of ,594 5,880, ,729 2,791,716 2,264,223 2,290, ,000 12,742,437 9,108,050 37,494,084 63
66 RISK MANAGEMENT POLICIES (Continued) Operational Risk Operational risk is the risk from potential adverse effects on the Bank s financial result and equity due to (intentional or accidental) omissions or errors in the work of employees, inadequate internal procedures and processes, inadequate information and other systems in the Bank, as well as due to unforeseen external events. Operational risk also includes legal risk. The process of operational risk management in the Bank is on the following 4 pillars: a) self-assessment, b) collection of information on the operational risk events, c) scenario analysis, and d) key risk indicators and is comprised of the following stages: a. risk identification, b. risk assessment and measuring, c. risk monitoring/control, and d. risk mitigation. The main objective of operational risk management in the Bank is to ensure that the level of operational risk exposure complies with the Bank's risk management strategy and policies, i.e., minimizing losses from operational risks taking into account the costs and expenses of such minimizing. The Bank analyzes its exposure to operational risks based on data collected in the database as well as data collected in the self-assessment process, data obtained through stress testing and key risk indicator monitoring. Mitigating risks is a planned approach aiming to alleviate influences of exposures to operational risks which mainly relates to the instruments in the system of risk control. The Bank s experience in monitoring operational risk exposure according to the number of events according to their causes and lines of business, confirms that the greatest frequency of risk-weighted events is registered in the retail sector characterized by causes such as external factor, human factor, system and process factors. According to the number of events according to their causes and lines of business, the main frequency of risk-weighted events is registered in the retail sector (99.38% of events). When it comes to the amount of loss contingent on the Bank s exposure to operational risks, the statistical records from internal database show that these risks have highest records in retail operations, and the most frequent cause of loss is external factor (93.81% of all losses or 30.57% of events). The Bank applies the basic indicator approach for the calculation of capital expenses for operational risks. The capital requirement for operational risk for 2014 totals RSD 452,680 thousand. Self-Assessment Self-assessment of operational risk is performed at least annually. It entails a procedure wherein all the Bank's organizational units consider the operational risk chart and assess to what extent they are exposed to certain types of operational risks. Self-assessment allows the owners of processes to identify and evaluate risks affecting the processes under their control in a timely manner. Self-assessment is based on the process approach. Process owners are responsible for coordinating identification, assessment, monitoring and managing all risks arising from the nature of the processes within their remit. Furthermore, process owns perform self-assessment based on the methodology prescribed and supported by the Operational and Other Risk Management Unit. Self-assessment procedure is initiated by the Operational and Other Risk Management Unit at least annually. 64
67 RISK MANAGEMENT POLICIES (Continued) Operational Risk (Continued) Self-Assessment (Continued) Measuring operational risk through self-assessment entails evaluation of the operational risk exposure by the Bank's organizational units according to the chart of identified operational risks, i.e. a list of risks created by the Operational and Other Risk Management Unit based on the previous annual period experience. Self-assessment evaluates possibility, spread and frequency of events that could cause losses based on operational risks in the forthcoming annual period. The Operational and Other Risk Management Unit reports on the self-assessment results within its regular annual unit report. Scenario Analysis (Stress Test) Stress test is performed annually to assess exposure to operational risks given the possibility and frequency of their occurrence as well as their potential impact on the Bank in instances of low probability for a risk event occurrence yet possible significant losses incurrence on the part of the Bank. Scenarios are defined at the OTP Group level, adopted by the Operational Risk Management Committee and executed by the owners of processes and/or personnel appointed responsible for stress testing. The purpose of scenario analysis is to provide expert estimates with regard to operational risk events with low frequency and significant financial impact that may occur in the future. Scenario analysis was performed for the year 2014 including the following scenario groups: unauthorized activities in trading; extreme external events; attack on the IT system; unexpected problems in processes; and problems related to collateral management. Business Continuity Plan (BCP) In order to ensure the continuity of operation, the Bank's Board of Directors has adopted the Business Continuity Plan as well as the Disaster Recovery Plan, which allow unhindered and continuous functioning of all significant systems and processes and restricting losses in emergencies. The Bank manages continuity of business operations based on the impact analysis and risk assessment. Its purpose is to minimize operational, financial, legal, reputational and other material consequences brought about by interruption of operations as well as to ensure functioning of the critical business functions and/or their restoration to use within predefined timelines and enable operations for at least a month afterwards. BCP allows for normal course of operations to be established in a reasonable time frame in the instances of significant unanticipated partial or full stoppage in business operations. In 2014 the Bank adopted enhanced and more comprehensive BCP, Rulebook and action plans for all identified critical processes. Externalization Risk The Bank manages externalization risk via assessments and established control mechanisms before executing contracts with third parties or suppliers of services and undertakes the necessary protective measures against the adverse effects of externalization risk on its operation and reputation. The Bank has defined the process of managing externalization risk in more detail in its Externalization Risk Management Policy and Procedure. 65
68 RISK MANAGEMENT POLICIES (Continued) Operational Risk (Continued) New Product Introduction Risk The Bank actively manages new product introduction inasmuch as its overall risk management system includes and actively manages all risks arising from the new product introduction in such a manner that all relevant organizational units of the Bank must be informed of and familiar with the new product introduction and must provide their professional opinions within their respective competences related to the new product/service profile, its impact on the Bank's risk profile and impact on the risk management system. A new product is any product/service that requires systemic changes in the Bank's IT system and Bank's risk profile and calls for new professional knowledge and skills of the Bank's employees. Information System Risk The Bank has developed a process of information system risk management which includes risk identification measurement, assessment, mitigation, monitoring and control. The Bank manages the information system risk in such a manner that it allows for unhindered managing safety of this system, its functionality and continuity of the Bank's operations. Among other matters, the bank pays special attention to the following IT risk areas: IT management, IT strategy, application, infrastructure, information, safety, support, suppliers, development, SLA and business connecting. Due to its significance, the Bank has developed and performs methods of information system risk measurement Country Risk Country risk relates to the country of origin of the Bank s counterparty i.e. it represents the possibility of negative effects on the Bank s financial result and equity due to inability to collect receivables from abroad caused by political, economic and social conditions in the borrower s country of origin. Country risk management within the Bank is based on the general risk management principles. In order to identify, measure, assess and monitor country risk exposure, the Bank uses methodology and experiences of the OTP Group, its own assessments, analyses and the best banking practices that are not contrary to the provisions of the laws and NBS regulations governing country risk. Basis of measurement, assessment and analysis of the county risk imply the control of the extent to which the risk limit for certain countries is used. Country limits are monitored on daily, monthly, quarterly and annual bases by the Operational and Other Risk Management Unit. Risk of Trading with Counterparties The Bank operates in the interbank market with the aim to manage available funds as efficiently as possible in order to provide profitability and diversification of assets. Monitoring treasury operations in the monetary and capital market and their control by means of limits set comprise a set of activities undertaken upon assumption of risk toward counterparty in the monetary and capital market. Activities whereby the bank continuously monitors risks assumed involve determining limits toward the counterparty, monitoring and limit control, reporting on the limit extent used, etc. The main objective of monitoring operations in the monetary and capital market and limit control is preventive risk management, i.e. minimization of risks to counterparty which may have adverse effects on the Bank s own operating result. Trading limits are monitored on daily, monthly, quarterly and annual bases by the Operational and Other Risk Management Unit. 66
69 RISK MANAGEMENT POLICIES (Continued) Investment Risk The Bank's investment risks encompass risks associated with investing in other legal entities and in fixed assets. In accordance with the regulations of the National Bank of Serbia, the Risk Management Division regularly monitors the levels of permanent investments and notifies the Bank's Executive Board thereof. In this manner it is ensured that the Bank's investment in a single non-financial sector entity shall not exceed 10% of the Bank's capital and that the sum of the Bank's investments non-financial sector entities and the Bank's fixed assets shall not exceed 60% of the Bank's capital Concentration Risk In accordance with the Bank's adopted procedures, the Risk Management Division monitors the limits, i.e. concentration of investments per certain legal entities or group of related parties and entities related to the Bank and ensures that such exposures are maintained within the limits defined by the National Bank of Serbia. The Bank s investment risks include the risk of investing in other legal entities and the risk of investing in fixed assets. In accordance with the regulations of the National Bank of Serbia, the Risk Management Department regularly monitors the amounts of permanent investments and notifies thereof the Bank s Executive Board. In this manner it is ensured that the Bank s investments in a single non-financial sector entity do not exceed 10% of the Bank s equity and that the sum of the Bank s investments in non-financial sector entities and its capital expenditures do not exceed 60% of the Bank s equity Fair Value of Financial Instruments The following table provides the carrying amounts and fair values of the financial instruments. The table below does not include non-financial assets and liabilities. Carrying value Fair Unrecognized Carrying Fair value gain/loss value value Unrecognized gain/loss Financial assets 38,275,655 38,278,752 3,097 29,247,511 29,248, Cash and cash funds held with the central bank 6,175,546 6,175,546-5,837,874 5,837,874 - Financial assets at fair value through profit and loss, held for trading 1,732 1, Financial assets available for sale 3,964,221 3,964,221-2,143,264 2,143,264 - Financial assets held to maturity 21,609 21, Loans and receivables due from banks and other financial institutions 3,022,812 3,022, , ,800 - Loans and receivables due from customers 24,950,874 24,953,971 3,097 20,658,433 20,659, Receivables per financial derivatives designated as risk hedging instruments 2,485 2,485-2,946 2,946 - Other assets 136, ,376-91,194 91,194 - Financial liabilities 27,659,273 27,655,817 (3,457) 21,116,187 21,121,922 5,735 Financial liabilities at fair value through profit and loss, held for trading 10,571 10, Liabilities per financial derivatives designated as risk hedging instruments ,681 12,681 - Deposits and other liabilities due to banks, other financial institutions and the central bank 551, , , ,598 - Deposits and other liabilities due to customers 25,928,019 25,924,562 (3,457) 16,832,869 16,838,604 5,735 Subordinated liabilities 977, ,545-3,223,646 3,223,646 - Other liabilities 191, , , ,393-67
70 RISK MANAGEMENT POLICIES (Continued) Fair Value of Financial Instruments (Continued) Methods, Assumptions and Valuation Techniques Used in Determining Fair Value Given the fact that the market of the Republic of Serbia is underdeveloped, in assessing the fair value of the financial instruments the Bank used market and income approaches, i.e. information on similar financial instruments available on the market, such as the effective interest rate, maturity and sector classification. Securities available for sale are measured at fair value based on the available market information, i.e. by using the quoted market prices as at the reporting date. If such information is unavailable, other valuation techniques are used. As of 2014 the Bank assessed the fair value of securities available for sale (Note 19.1.). For liquid short-term financial assets and liabilities it is assumed that their carrying values approximate their fair values. This same assumption is applied to demand deposits, savings accounts and financial assets and liabilities with market-adjusted prices (repricing), which are products with variable interest rates. Fair value of long-term financial assets and liabilities with fixed interest rates that are measured at amortized cost is estimated by comparing market interest rates upon initial recognition to the current market interest rates applied to the similar financial instruments. The estimated fair value of deposits is based on discounted cash flows using interest rates prevailing on the monetary market for contracts with similar characteristics. The Bank used official and easily verifiable information as input for fair value measurement of those assets and liabilities that are not measured at fair value yet whose fair value is disclosed where the determined fair values differ from the carrying values. The Bank obtained the input, i.e. information on the prevailing interest rates used in contracts with similar characteristics from the official website of the National Bank of Serbia, using the following: - interest rates of banks for loans approved to retail customers and non-financial sector customers per type, maturity and purpose newly approved loans as of 2014 as input for estimating fair values of loans and receivables from customers (the Bank classified this input in Level 2); - interest rates of banks for deposits received from retail customers and non-financial sector customers per maturity balances per existing deposits as of 2014 as input for estimating fair values of deposits and other liabilities to customers (the Bank classified this input in Level 2). In both instances where the Bank determined differences between the fair values and carrying values, the market approach was applied. The Bank uses the following hierarchy upon determining and disclosing the fair value of financial instruments: Level 1: quoted prices in active markets for identical assets or liabilities (unadjusted); Level 2: inputs observable for a given asset or liability either directly or indirectly that make use of information on the similar financial instruments present in active markets, quoted prices for identical or similar assets that are inactive or other market information from which the value of financial instrument can be derived (e.g. interest rates and yield curves observable in the usual quoted intervals); and Level 3: unobservable inputs for financial assets and liabilities used unless relevant observable inputs are available; the Bank uses mark-to-model approach which deploys other than market information derived based on a theoretical model adequate for determining the value of financial instruments. In assessing the fair value of its financial instruments, the Bank used Level 2 inputs. 68
71 RISK MANAGEMENT POLICIES (Continued) Maturity Analysis of the Bank's Financial Liabilities The following table presents analysis of the Bank's liabilities per outstanding maturity as of 2014, based on the contractual non-discounted cash flows. The financial liabilities are shown per maturity outstanding with total interest accrued in advance. Up to 1 month From 1 to 3 months From 3 to 12 months From 1 to 5 years Over 5 years Without contractually defined maturity Matured Total Financial liabilities at fair value through profit and loss, held for trading ,571 10,571 Liabilities per financial derivatives designated as risk hedging instruments Deposits and other liabilities due to banks, other financial institutions and the central bank 402,394 21, , ,419 Deposits and other liabilities due to customers 16,244,815 2,527,150 5,793, , , , ,895 26,077,459 Subordinated liabilities 8,267 24,802 74,407 1,250, ,357,850 Other liabilities , ,126 Total liabilities 16,655,477 2,573,789 6,012,326 2,162, , , ,700 28,190, OPERATING SEGMENTS Review of Net Income and Expenses per Sectors 2014 Retail Corporate Other Total Net interest income 1,367, , ,679 2,397,422 Net fee and commission income 444, ,340 17, ,489 Net losses on the financial assets held for trading - - (5,459) (5,459) Net gains on the hedges against risks ,903 44,057 Net losses on the financial assets available for sale - (18,656) - (18,656) Net foreign exchange (losses)/gains and currency clause effects (427,761) 422, , ,543 Other operating income 20,440 37,303 12,152 69,895 Net losses from impairment of financial assets and credit risk-weighted offbalance sheet assets (295,321) (338,573) (1,644) (635,538) Staff costs - - (1,077,681) (1,077,681) Depreciation and amortization charge - - (244,331) (244,331) Other expenses (212,600) (909,924) (262,418) (1,384,942) Deferred tax benefits - - 1,740 1,740 Profit/(loss) for the year 897, ,944 (902,532) 107,539 69
72 OPERATING SEGMENTS (Continued) Review of Net Income and Expenses per Sectors (Continued) 2013 Retail Corporate Other Total Net interest income 1,132, , ,305 2,016,737 Net fee and commission income 425, ,492 11, ,769 Net gains on the hedges against risks - 127,643 (5,988) 121,655 Net losses on the financial assets available for sale - (8,841) (2,847) (11,688) Net foreign exchange gains and positive currency clause effects 78,679-87, ,656 Other operating income - 4,264 78,339 82,603 Net losses from impairment of financial assets and credit risk-weighted offbalance sheet assets (1,090,447) (1,484,024) (2,393,293) (4,967,764) Staff costs - - (1,065,204) (1,065,204) Depreciation and amortization charge - - (251,013) (251,013) Other expenses (200,295) (298,367) (891,454) (1,390,116) Deferred tax expenses - - (4,244) (4,244) Profit/(loss) for the year 345,462 (846,899) (4,155,172) (4,656,609) The retail sector includes domestic and foreign private individuals, as well as farmers and entrepreneurs, while the corporate sector includes public enterprises, other enterprises and non-resident legal entities. The sector other includes all sector structures as well as other income and expenses that are not encompassed by the former two groups Geographical Breakdown of Income and Non-Current Assets Region Non-Current Income Assets Income Non-Current Assets Belgrade 1,259,444, ,093,449 1,475,602, ,533,660 Serbia 2,232,171, ,505,515 2,216,495, ,769,206 Vojvodina 4,075,085,490 1,240,616,154 5,424,859,873 1,386,721,829 Total 7,566,701,903 1,871,215,118 9,116,958,003 1,923,024,695 70
73 OPERATING SEGMENTS (Continued) 49.3 Consolidated Income Statement Breakdown Total Internal Internal Settlement Consolidated Total Settlement Consolidated Net interest income 2,397, ,398,417 2,016, ,017,349 Net fee and commission income 705,489 (25) 705, ,769 (25) 645,744 Net losses on the financial assets held for trading 5,459-5, Net gains on the hedges against risks 44,057-44, , ,655 Net losses on the financial assets available for sale 18,656-18,656 11,688-11,688 Net foreign exchange gains and positive currency clause effects 255, , , ,658 Other operating income 69,895 1,106 71,001 82,603 7,143 89,746 Net losses from impairment of financial assets and credit risk-weighted off-balance sheet assets 635, ,096 4,967,764-4,967,764 TOTAL OPERATING INCOME 2,812,753 1,767 2,814,520-7,732 - TOTAL OPERATING EXPENSES ,946,032-1,938,300 Other expenses 2,706,954 9,327 2,716,281 2,706,333 15,448 2,721,781 Profit from continuing operations 105,799-98, Loss from continuing operations - 7,560-4,652,365 7,716 4,660,081 Current income tax expense Deferred tax expenses ,244-4,244 Gains on the created deferred tax assets and decrease in deferred tax liabilities 1,740-1, Net profit 107,539-99, Net loss - 7,720-4,656,609 7,716 4,664, CAPITAL MANAGEMENT The Law on Banks and relevant NBS decisions stipulate the Bank's obligation to maintain the minimum amount of capital of EUR 10 million in RSD equivalent at the official middle exchange rate and the capital adequacy ratio of no less than 12% as well as to maintain the volume and structure of its activities in compliance with the prescribed performance ratios. The Bank's actually achieved adequacy/performance indicators as of 2014 were in compliance with the ratios prescribed by the National Bank of Serbia. 71
74 CAPITAL MANAGEMENT (Continued) As of 2014, according to the calculation made by the Bank, the following adequacy indicators were achieved: Prescribed Actual Capital adequacy ratio Minimum 12% 30.77% The sum of the Bank's investments Maximum 60% 23.66% The Bank's investment in non-financial sector entities Maximum 10% 0.14% The sum of all large Bank s exposures Maximum 400% 13.65% Liquidity ratios as at December 31: - cash liquidity ratio Minimum liquidity ratio Minimum Foreign exchange risk ratio Maximum 20% 3.46% Exposure to a single entity or a group of related entities Maximum 25% 13.65% Exposure to a single entity related to the Bank Maximum 5% 1.05% Total exposure to entities related to the Bank Maximum 20% 1.15% 51. DERECOGNITION OF FINANCIAL ASSETS There were no instances of the Group ceasing to recognize financial assets due to loss of control over financial assets. 52. NON-PERFORMANCE OR VIOLATION OF OBLIGATIONS There were no instances of the Group s failure to perform its obligations or instances of the Bank violating its obligations. 53. HEDGE ACCOUNTING The Group does not use hedge accounting. 54. COLLATERALS As of 2014 the Group had no collaterals assigned for the purpose of securing repayment/discharge of its liabilities. 55. RECONCILIATION OF RECEIVABLES AND PAYABLES Pursuant to Article 18 of the law on Accounting (Official Gazette of RS no. 62/13), the Bank reconciled the balances of its receivables and payables with legal entities as of October 31, Receivables and payables were reconciled to 99.91% of the aggregate amount according to the replies to independent balance confirmation requests received from the customers. The amount of the non-reconciled receivables and payables totaled RSD 25,486 thousand. 56. EVENTS AFTER THE REPORTING PERIOD On February 24, 2015 the NBS Executive Board adopted Decision on Measures for Preservation of Financial System Stability in relation to loans indexed to foreign currency (the Decision ). The Decision identifies measures and activities that banks are obligated to apply to housing loans indexed to CHF and other loans indexed to foreign currency. According to the Decision, banks are obligated to determine the amount of funds collected based on increase in indefinable elements of variable interest rate in the period starting from unilateral interest rate increase to the beginning of applying of Law on Protection of Financial Services Users, and calculate this amount determined as early loan payment, as well to inform the borrowers of the modified loan repayment schedule. Moreover, banks are obligated to offer the users of housing loans indexed to CHF 4 prescribed models of annex to the loan agreement under which loan repayment terms will be changed. The Bank will act in the manner and within deadlines stipulated by the aforecited Decision. 72
75 OTP banka Srbija a.d. Novi Sad 2014 Annual Report February 2015
76 Notes on the following pages Vision and Mission OTP Bank Plc. (Parent company) The macroeconomic and financial environment in Business Division Risk Management The Human Resources Directorate The Bank s Management Corporate Social Responsibility The consolidated financial Indicators The Bank's Future Development... 15
77 OTP banka Srbija a.d. Novi Sad 1. Vision and Mission The Vision of OTP banka Srbija The Bank endeavors to become one of the most reliable universal banks in Serbia by means of ensuring stable growth, efficient corporate governance and a strong commitment to social responsibility. The Bank builds its success on three pillars: staff professionalism, knowledge on the local and regional markets and consciously building strong relationships with clients. The satisfaction of our clients, shareholders and employees is the major goal in the Bank s activities. The Mission of OTP banka Srbija The Bank s mission is to provide a comprehensive scope of high-quality financial services to retail and corporate clients, as well as municipalities. Harmonized and improved practice within the Bank s management enables the development of existing potentials, transparent and wise business operations and the application of a proactive approach towards innovations. Continuous profitability growth and value increase for shareholders represent the underlying measurement criteria for the Bank s success. The Bank s competitive advantage is based on the quality of its various services and its flexibility. The Bank relies on its employees professional qualities and dedicated being, whose success is highly esteemed and prized by competitive benefits based on individual results and whose professional development is supported by continuous education. History 2. OTP Bank Plc. (Parent company) The predecessor of OTP Bank, called the National Savings Bank (OTP Bank) was established in 1949 as a nationwide, state-owned banking entity providing retail deposits and loans. In the ensuing years, its activities and the scope of its authority gradually widened. First, it was authorized to enter into real estate transactions. Later, its role was extended to provide domestic foreign currency accounts and foreign exchange services; there was a subsequent diversification into providing banking services for Hungarian municipalities. Since 1989, the bank has operated as a multi-functional commercial bank. In addition to continuing its previous retail and municipal activities, the bank has been authorized to solicit corporate loan accounts and deposits, and to provide commercial loans and banking services for correspondent banking and export-import transactions. In 1990, the National Savings Bank became a public company with a share capital of HUF 23 billion. Its name was changed to the National Savings and Commercial Bank. Subsequently, non-banking activities were separated from the bank, along with their supporting organizational units. OTP Bank s privatization began in As a result of 3 public offers along with the introduction of the bank s shares into the Budapest Stock Exchange the state s ownership in the bank decreased to a single voting preference (golden) share. Currently the bank is characterized by dispersed ownership of mostly private and institutional (financial) investors. After the realization of its own privatization process, OTP Bank started its international expansion targeting countries in CEE region, which offer great economic growth potentials similar to that of its domestic (Hungarian) market. OTP Bank has completed several successful acquisitions in the past years, becoming a key player in the region. Besides Hungary, OTP Group currently operates in 8 countries of the region via its subsidiaries: in Bulgaria (DSK Bank), in Croatia (OTP banka Hrvatska), in Romania (OTP Bank Romania), in Serbia (OTP banka Srbija), in Slovakia (OTP Banka Slovensko), in the Ukraine (CJSC OTP Bank), in Montenegro (Crnogorska komercijalna banka) and in Russia (OAO OTP Bank) was milestone in OTP Bank history since it was the first time to sell one of its subsidiaries. The French Groupama S.A. acquired its insurance business line, and part of the transaction they resolved to collaborate in strategic points and cross-sell their financial and insurance products. Groupama S.A. has acquired 8% of shares of OT 1

78 OTP banka Srbija a.d. Novi Sad P Group. OTP Group provides high quality financial solutions to meet the needs of nearly 11,9 million customers through almost 1500 branches and electronic channels. Strategy OTP Group s business strategy remains focused on the maximization of shareholder value through the development of the most efficient, retail-focused universal bank in CEE. The objective of the Group is to achieve an outstanding financial performance in European terms. The OTP Group endeavors to offer customized services, constantly being improved to meet the needs of its customers, through the further strengthening of its innovative skills. In order to create value it is essential to rationalize operational processes and to improve operational and cost efficiency of the Group s members. Synergy effects within the subsidiaries can be achieved by harmonized developments and integration of several activities within the Hungarian and the international group. Highly qualified human resource is indispensable to achieve OTP Bank s and the Group s objectives. Therefore the creation and sustainment of a wellprepared sales-oriented and loyal administrative workforce is of outstanding importance in the Bank s strategy just as the creation of personalized careers in order to keep talented professionals. 3. The macroeconomic and financial environment in 2014 During 2014 the Serbian economy entered into the third recession from the beginning of the financial crisis in The domestic demand and investments carried on with a tendency of contraction recorded in 2013, along with certain deterioration in foreign trade trends in the second half of the year. Namely, after the recovery in 2013 the economic activities in the countries of the Eurozone, being Serbia s major trade partners, slowed down almost to stagnation as a result of political uncertainties. Apart from the above, the catastrophic May Floods influenced the dramatic drop of domestic energy production and the production of energy generating products, thus additionally jeopardizing the domestic export potential in 2014 and in the current year. Thus a GDP of 2% was achieved in The prospects for recovery of domestic economic activities in the coming year seem to be relatively low. Namely, the uncertainties on international markets, fueled by current political tensions, could influence a continuing trend of low export demand in the Eurozone and Russia. A potential positive influence to European business activities and the demand for domestic goods could come from a program of quantitative incentives by the ECB with the aim to inject around EUR 1,100 billion into the economy by the end of However, the tendency of decline in the domestic demand could persist due to the fact that in the last months of 2014 the Government set off the implementation of certain fiscal consolidation measures. Therefore, we expect by all odds a continuing trend of recession and economic contraction of around -0.5% in The described negative trends in trading led to the recurring tendency of current account deficits. Thus, by means of a narrowing of above 40% in 2013 and the first 11 months of 2014 this deficit showed a year-on-year growth from almost 10% (reaching EUR 1.9 billion, i.e. 6% of the GDP). On the other hand, net capital inflows were insufficient to cover the current account deficit, primarily due to strong net outflows based on the deleveraging process of banks and the NBS, substantially decreased net inflows of portfolio investments, as well as scarce net inflows from direct investments. The described external imbalance during the previous and at the beginning of the current year contributed by all means to the devaluation of the Dinar at around 6.5% in the above period. Owing to the fact that the weak fundaments of the domestic economy are going to persist in the ensuing period, it is possible that the Dinar shall continue to devaluate in the medium-term. However, the inflationary pressures due to the depreciation of the Dinar were neutralized in 2014 by the very low domestic demand, a drop in the world raw material prices and the effects of a solid agricultural season in 2013 and
79 OTP banka Srbija a.d. Novi Sad Thus the annual inflation rate was below the lower band of the NBS target corridor (4+1.5%), while the year was ended at only 1.7%. Despite the fact that the low base effect is going to be more expressed in 2015, while the depreciation could continue with possible price increases, the above mentioned inflationary pressures shall to a large extent be mitigated by low domestic demand and prospectively stable low world raw material prices. Thusly the inflation could potentially return to the targeted corridor bands during the first half of the year and remain at that level during the remainder of Despite the fact that inflation was at a low level, external pressures and the gradual depreciation of the Dinar decreased the possibility of a monetary easing by the NBS. Thus, despite of the almost deflationary circumstances, the central bank lowered the base rate for 1.5% total to a level of 8% during In the coming year there will be room for the gradual easing of monetary restrictiveness but the NBS will most likely maintain a reserved approach, taking into account the uncertainties regarding potential interest rate increases in the US, as well as the scope and mechanisms of ECB quantitative incentives. According to the Fiscal Council, the fiscal deficit most probably reached during the previous year a level of around RSD billion (around 5% of the GDP), amounting to even RSD billion (around 7% of the GDP) with the inclusion of non-budget transactions. The potential growth of budget inflows shall in 2015 be relatively limited, taking into account the likely continuation of the economic contraction spurred by the declining domestic demand. In addition, despite the fact that certain savings are planned in the current year, primarily based on the reduction of certain pension categories and public sector salaries, due to the circumstance that certain non-budget expenses are to be recorded from 2015, this year s deficit plan of around RSD 191 billion seems somewhat narrow. Bearing in mind the depicted deficit level, as well as the maturity of earlier debt issues, the state s total financing needs shall in 2015 reach the level of around EUR 5.7 billion. According to the Law on the 2015 Budget, the largest portion from this will be financed by debt issues on the domestic market (around EUR 3.6 billion), on the foreign market (around EUR 1.5 billion) and through bilateral agreements with foreign governments and institutions (around EUR 0.6 billion). Due to the fact that the state still plans to cover its needs through borrowing, it is likely that the trend of public debt growth is going to continue. Thus, having in mind the public debt growth from around EUR 2.2 billion to EUR 22.3 billion (around 67% of the GDP) in the first 11 months of 2014, a growth of around 74-75% of the GDP is possible until the end of next year. In accordance with the mentioned national and global risk aversion, as well as the Dinar s depreciation, the interest of investors in the domestic debt market has somewhat dropped in the last few months in comparison with Despite of the above, the stock of treasury bills and bonds is on a constant increase, so that in 2014 a growth of around EUR 1.5 billion was recorded, while the returns remained relatively stable. The Banking Sector Serbia is a bank-centered financial market, meaning that the analysis of concentration and competition is of utter importance. The banking market is currently weakly to moderately concentrated or mildly oligopolistic. We can expect a consolidation of the banking market in the future in terms of reducing the number of banks and strengthening the market power of the largest banks. Possible channels of consolidation are the sale of the remaining state owned banking package, takeovers between banks and the disappearance of some banks as a result of competitive selection. According to the latest available data, at the end of the third quarter in 2014 the Serbian banking sector comprised 29 banks employing 25,414 people. The assets and capital of the banking sector amounted to RSD 2,956 billion and RSD 616 billion, respectively. 21 of the banks are in foreign, while 8 in domestic ownership, six of which are state-owned (the state either being a majority shareholder or having controlling interest), while two are owned by private individuals. Banks in foreign ownership still have a dominant share in the banking sector of around 75% of the assets and capital. The largest share have the banks from Italy (with a small share drop in the assets and a slight increase in the banking sector capital), followed by banks from Austria and Greece. Banks in domestic ownership (primarily due to the contribution of state-owned banks) have a somewhat larger share in the organizational network and the number of employees in the banking sector compared with their share in the banking sector's assets and capital. 3
 2010 2011 2012 2013 2014 2) Total number of banks 34 34 33 33 32 30 29 Number of employees 32,342 31,182 29,887 29,228 28,394 26.380 25.")
80 OTP banka Srbija a.d. Novi Sad The entire banking network consists of 1,839 business units, branches, outlets and counters, which is 150 less compared to the end of The number of banks and their ownership structure ) ) Total number of banks Number of employees 32,342 31,182 29,887 29,228 28, Number of organizational units 2,711 2,635 2,487 2,383 2,243 1, The banks ownership structure foreign domestic private state-owned Source: NBS 1) Banks where the Republic of Serbia is directly or indirectly a majority individual shareholder. From 14 July 2009 Metals Banka AD Novi Sad was recapitalized by AP Vojvodina and DDOR Novi Sad rendering it a state-controlled bank. 2) end of the third quarter At the end of the third quarter of 2014 the banking sector's total net assets amounted to RSD 2,956 billion, representing an increase of 110,1 billion (3,9%) compared with the end of the previous year. Graph: Asset structure of the Serbian banking sector. Source: NBS Serbian banks are confronted with the increase of non-performing loans from 21.4% at the end of 2013 to 23% at the end of the third quarter in Such an increase was primarily sparked by the growth of non-performing loans given to corporate clients, making 60% of all non-performing loans. Sectors with the largest absolute amounts of nonperforming loans are the processing industry, trade and the construction industry. The banking sector is adequately capitalized as regards the fulfillment of regulatory requirements pertaining to capital adequacy indicators. At the end of the second quarter of 2014 the banking sector capital adequacy ratio was at 19.4% in Serbia, being far above the regulatory minimum, both according to domestic legislation (12%) and according to the Basel Accords (8%). 4

81 OTP banka Srbija a.d. Novi Sad Graph: Capital adequacy indicators of the Serbian banking sector Source: NBS The profit before taxation of the banking sector in the first six months of 2014 amounted to RSD 20,95 billion, and is higher than the level of last year's same period. The increase in net credit losses in the third quarter of 2014 compared with last year's same quarter in the amount of RSD 2.0 billion contributed substantially to the lower profit of the Serbian banking sector in the given period. Net interest incomes are still on the increase and are higher compared to last year's same period by RSD 1.3 billion, while fee and commission incomes are lower by RSD 0.1 billion. From total number of banks, 20 of them had a positive result in the total amount of RSD 26,5 billion, while 9 banks generated a loss in the total amount of RSD 5,5 billion. The profitability indicators calculated for the third quarter of 2014 the best represent the achieved results in Graph: Profitability indicators of the banking sector Source: NBS 5
NOTES TO THE CONSOLIDATED FINANCIAL STATEMENTS
 OTP banka Srbija a.d. Novi Sad NOTES TO THE CONSOLIDATED FINANCIAL STATEMENTS December 31, 2010 Consolidated legal entites: - OTP banka Srbija a.d. Novi Sad - OTP Investments d.o.o. Novi Sad Novi Sad,
KOMERCIJALNA BANKA A.D., BEOGRAD. Financial Statements Year Ended December 31, 2014 and Independent Auditors Report
 KOMERCIJALNA BANKA A.D., BEOGRAD Financial Statements Year Ended and Independent Auditors Report KOMERCIJALNA BANKA A.D., BEOGRAD CONTENTS Page Independent Auditors' Report 1 Financial Statements: Balance
KOMERCIJALNA BANKA A.D., BEOGRAD. Consolidated Financial Statements For the Year Ended December 31, 2010 and Independent Auditors Report
 Consolidated Financial Statements For the Year Ended and Independent Auditors Report CONTENT Page Independent Auditors' Report 1 Consolidated Financial Statements: Consolidated Income Statement 2 Consolidated
OTP BANKA SRBIJA A.D., NOVI SAD. Consolidated Financial Statements Year Ended December 31, 2017 and Independent Auditors Report
 Consolidated Financial Statements Year Ended and Independent Auditors Report CONTENTS Page Independent Auditors' Report 1 Consolidated Financial Statements: Consolidated Income Statement 2 Consolidated
KOMERCIJALNA BANKA A.D., BEOGRAD. Financial Statements For the Year Ended December 31, 2010 and Independent Auditors Report
 Financial Statements For the Year Ended and Independent Auditors Report CONTENT Page Independent Auditors' Report 1 Financial Statements: Income Statement 2 Balance Sheet 3 Statement of Changes in Equity
KOMERCIJALNA BANKA A.D., BEOGRAD. Unconsolidated Financial Statements Year Ended December 31, 2015 and Independent Auditors Report
 KOMERCIJALNA BANKA A.D., BEOGRAD Unconsolidated Financial Statements Year Ended and Independent Auditors Report KOMERCIJALNA BANKA A.D., BEOGRAD CONTENTS Page Independent Auditors' Report 1 Financial Statements:
NATIONAL BANK OF SERBIA. Financial Statements Year Ended December 31, 2014 and Independent Auditors Report
 Financial Statements Year Ended and Independent Auditors Report CONTENTS Page Independent Auditors Report 1 Income Statement 2 Statement of Other Comprehensive Income 3 Statement of Financial Position
mts banka a.d. BELGRADE Financial Statements as of and for the Year Ended 31 December 2016 and Independent Auditor s Report
 mts banka a.d. BELGRADE Financial Statements as of and for the Year Ended 31 December 2016 and Independent Auditor s Report mts banka a.d. Belgrade CONTENTS Page INDEPENDENT AUDITOR S REPORT 1-2 FINANCIAL
SRPSKA BANKA A.D., BEOGRAD. Financial Statements For the Year Ended December 31, 2010 and Independent Auditors Report
 Financial Statements For the Year Ended and Independent Auditors Report CONTENT Page Independent Auditors' Report 1 Financial Statements: Income Statement 2 Balance Sheet 3 Statement of Changes in Equity
UNICREDIT BANK SRBIJA A.D., BEOGRAD. Consolidated Financial Statements Year Ended December 31, 2017 and Independent Auditors Report
 UNICREDIT BANK SRBIJA A.D., BEOGRAD Consolidated Financial Statements Year Ended December 31, 2017 and Independent Auditors Report Translation of the Auditors Report issued in the Serbian language UNICREDIT
VOJVOĐANSKA BANKA A.D., NOVI SAD. Financial Statements Year Ended December 31, 2017 and Independent Auditors Report
 VOJVOĐANSKA BANKA A.D., NOVI SAD Financial Statements Year Ended December 31, 2017 and Independent Auditors Report VOJVOĐANSKA BANKA A.D., NOVI SAD CONTENTS Page Independent Auditors' Report 1 Financial
JUBMES BANKA AD, BELGRADE. Financial Statements for the year ended 31 December 2015 and Independent Auditor s Report
 JUBMES BANKA AD, BELGRADE Financial Statements for the year ended 31 December 2015 and Independent Auditor s Report This is a translation of the original Independent Auditors Report issued in the Serbian
Financial Statements. and Independent Auditors Report
 KOMERCIJALNA BANKA A.D., BEOGRAD Financial Statements Year Ended and Independent Auditors Report KOMERCIJALNA BANKA A.D., BEOGRAD CONTENTS Page Independent Auditors' Report 1-2 Income Statement 3 Statement
UNIVERZAL BANKA A.D. BEOGRAD
 UNIVERZAL BANKA A.D. BEOGRAD FINANCIAL STATEMENTS FOR THE YEAR ENDED 31 DECEMBER 2009 Univerzal banka a.d. Beograd TABLE OF CONTENTS Page Independent Auditors Report 1 Income statement 2 Balance sheet
THE LIMITED LIABILITY COMPANY FOR FINANCE LEASE INTESA LEASING d.o.o. BELGRADE
 THE LIMITED LIABILITY COMPANY FOR FINANCE LEASE INTESA LEASING d.o.o. BELGRADE Financial Statements as of and for the Year Ended 31 December 2017 and Independent Auditor s Report CONTENTS Page INDEPENDENT
JUBMES BANKA AD, BELGRADE. Financial Statements for the year ended 31 December 2017 and Independent Auditor s Report
 JUBMES BANKA AD, BELGRADE Financial Statements for the year ended 31 December 2017 and Independent Auditor s Report This is a translation of the original Independent Auditors Report issued in the Serbian
Management s Responsibility for the Financial Statements
 kpmg KPMG d.o.o. Beograd Kraljice Natalije 11 11000 Belgrade Serbia Independent Auditors Report Tel.: +381 (0)11 20 50 500 Fax: +381 (0)11 20 50 550 www.kpmg.com/rs TO THE SHAREHOLDERS OF HALKBANK A.D.
KOMERCIJALNA BANKA A.D., BEOGRAD. Consolidated Financial Statements Year Ended December 31, 2015 and Independent Auditors Report
 Consolidated Financial Statements Year Ended and Independent Auditors Report CONTENTS Page Independent Auditors' Report 1 Consolidated Financial Statements: Consolidated Consolidated Statement of Financial
ERSTE BANK A.D. NOVI SAD. UNCONSOLIDATED FINANCIAL STATEMENTS AND NOTES TO THE UNCONSOLIDATED FINANCIAL STATEMENTS Year Ended December 31, 2015
 ERSTE BANK A.D. NOVI SAD UNCONSOLIDATED FINANCIAL STATEMENTS AND NOTES TO THE UNCONSOLIDATED FINANCIAL STATEMENTS Year Ended December 31, CONTENTS Page Independent Auditors' Report 1 Income Statement for
 NOTES TO THE CONSOLIDATED FINANCIAL STATEMENTS FOR THE YEAR ENDED 31 December 2015 1. THE ESTABLISHMENT AND OPERATIONS These financial statements are consolidated financial statements of Credit Agricole
Management s Responsibility for the Financial Statements
 kpmg KPMG d.o.o. Beograd Kraljice Natalije 11 11000 Belgrade Serbia Tel.: +381 (0)11 20 50 500 Fax: +381 (0)11 20 50 550 www.kpmg.com/rs Independent Auditors Report T R A N S L A T I O N TO THE OWNERS
ERSTE BANK A.D., NOVI SAD FINANCIAL STATEMENTS FOR THE YEAR ENDED 31 DECEMBER 2014
 FINANCIAL STATEMENTS FOR THE YEAR ENDED 31 DECEMBER 2014 ERSTE BANK a.d. NOVI SAD CONTENT Page Independent Auditors' Report 1 Income statement for the year ended 31 December 2014 2 Statement of comprehensive
Management s Responsibility for the Separate Financial Statements
 kpmg KPMG d.o.o. Beograd Kraljice Natalije 11 11000 Belgrade Serbia Independent Auditors Report Tel.: +381 (0)11 20 50 500 Fax: +381 (0)11 20 50 550 www.kpmg.com/rs T R A N S L A T I O N TO THE SHAREHOLDERS
UNICREDIT BANK A.D., BANJA LUKA
 UNICREDIT BANK A.D., BANJA LUKA Financial statements Year ended December 31, and Independent Auditors Report Translation of the Auditors Report issued in the Serbian language Table of Contents Page Independent
Independent Auditor's report 1. Income Statement 2. Balance Sheet 3. Cash Flow Statement 4-5. Statement of Changes in Equity 6
 FINANCIAL STATEMENTS FOR THE PERIOD FROM 1 JANUARY TO 31 DECEMBER 2007 CONTENTS Independent Auditor's report 1 Income Statement 2 Balance Sheet 3 Cash Flow Statement 4-5 Statement of Changes in Equity
We believe that the audit evidence we have obtained is sufficient and appropriate to provide a basis for our audit opinion.
 ABCD KPMG d.o.o. Beograd Kraljice Natalije 11 11000 Belgrade Serbia Telephone: Fax: E-mail: Internet: +381 11 20 50 500 +381 11 20 50 550 info@kpmg.rs www.kpmg.rs Independent Auditors Report TO THE SHAREHOLDERS
BANCA INTESA a.d. BELGRADE. Separate Financial Statements as of and for the Year Ended 31 December 2017 and Independent Auditor s Report
 Separate Financial Statements as of and for the Year Ended 31 December 2017 and Independent Auditor s Report CONTENTS Page INDEPENDENT AUDITOR S REPORT 1-2 SEPARATE FINANCIAL STATEMENTS Separate Balance
DEPOSIT INSURANCE AGENCY, BELGRADE. Financial Statements for the Year Ended 31 December 2015 and Independent Auditor s Report
 Financial Statements for the Year Ended 31 December 2015 and Independent Auditor s Report Public Disclosure Authorized Public Disclosure Authorized Public Disclosure Authorized Public Disclosure Authorized
ALKALOID AD SKOPJE STAND ALONE FINANCIAL STATEMENTS FOR THE YEAR ENDED 31 DECEMBER 2010 AND INDEPENDENT AUDITORS REPORT
 ALKALOID AD SKOPJE STAND ALONE FINANCIAL STATEMENTS FOR THE YEAR ENDED 31 DECEMBER 2010 AND INDEPENDENT AUDITORS REPORT This is an English translation of the original report issued in Macedonian language
BANCA INTESA A.D. BEOGRAD
 FINANCIAL STATEMENTS FOR THE YEAR ENDED 31 DECEMBER 2011 TABLE OF CONTENTS PAGE INDEPENDENT AUDITOR S REPORT 1 INCOME STATEMENT 2 BALANCE SHEET 3 STATEMENT OF CHANGES IN EQUITY 4 CASH FLOW STATEMENT 5-6
We believe that the audit evidence we have obtained is sufficient and appropriate to provide a basis for our audit opinion.
 ABCD KPMG d.o.o. Beograd Kraljice Natalije 11 11000 Belgrade Serbia Telephone: Fax: E-mail: Internet: +381 11 20 50 500 +381 11 20 50 550 info@kpmg.rs www.kpmg.rs Independent Auditors Report TO THE OWNERS
Management s Responsibility for the Financial Statements
 ABCD KPMG d.o.o. Beograd Kraljice Natalije 11 11000 Belgrade Serbia Telephone: Fax: E-mail: Internet: +381 11 20 50 500 +381 11 20 50 550 info@kpmg.rs www.kpmg.rs Independent Auditors Report TO THE OWNERS
KULSKA BANKA a.d. NOVI SAD IFRS FINANCIAL STATEMENTS FOR THE YEAR ENDED 31 DECEMBER 2006
 KULSKA BANKA a.d. NOVI SAD IFRS FINANCIAL STATEMENTS FOR THE YEAR ENDED 31 DECEMBER 2006 Page(s) Independent Auditor s Report 1 Income Statement 2 Balance Sheet 3 Statement of Changes in Equity 4 Cash
ZEPTER BANKA A.D., BEOGRAD. Financial Statements December 31, 2006 and Independent Auditors Report
 Financial Statements and Independent Auditors Report CONTENTS Page Independent Auditors Report 1 2 Statement of Income 3 Balance Sheet 4 Statement of Changes in Equity 5 Statement of Cash Flows 6 Notes
Intesa Sanpaolo Banka d.d. Bosna i Hercegovina
 Intesa Sanpaolo Banka d.d. Bosna i Hercegovina Financial Statements as at 2016 Intesa Sanpaolo Banka, d.d. Financial statements as at 2016 Contents Management Board s Report 2 Responsibilities of the Management
KOMERCIJALNA BANKA A.D., BEOGRAD. Consolidated Financial Statements December 31, 2006 and Independent Auditors Report
 KOMERCIJALNA BANKA A.D., BEOGRAD Consolidated Financial Statements and Independent Auditors Report CONTENTS Page Independent Auditors Report 1 2 Consolidated Statement of Income 3 Consolidated Balance
ERSTE BANK A.D. NOVI SAD. SEPARATE FINANCIAL STATEMENTS AND NOTES TO THE SEPARATE FINANCIAL STATEMENTS Year Ended December 31, 2016
 ERSTE BANK A.D. NOVI SAD SEPARATE FINANCIAL STATEMENTS AND NOTES TO THE SEPARATE FINANCIAL STATEMENTS Year Ended December 31, 2016 ERSTE BANK a.d., NOVI SAD CONTENTS Page Independent Auditors' Report 1
UNIVERZAL BANKA a.d. Beograd FINANCIAL STATEMENTS FOR THE YEAR ENDED 31 DECEMBER 2007
 UNIVERZAL BANKA a.d. Beograd FINANCIAL STATEMENTS FOR THE YEAR ENDED 31 DECEMBER 2007 TABLE OF CONTENTS Independent Auditors Report 1 Income statement 2 Balance sheet 3 Cash Flow Statement 4 Statement
KULSKA BANKA GROUP IFRS CONSOLIDATED FINANCIAL STATEMENTS FOR THE YEAR ENDED 31 DECEMBER 2006
 IFRS CONSOLIDATED FINANCIAL STATEMENTS FOR THE YEAR ENDED 31 DECEMBER 2006 CONTENTS Page Report of Independent Auditors 1 Consolidated Income Statement 2 Consolidated Balance Sheet at 31 December 2006
METALAC A.D., GORNJI MILANOVAC. Consolidated Financial Statements Year Ended December 31, 2010 and Independent Auditors Report
 Consolidated Financial Statements Year Ended and Independent Auditors Report CONTENTS Page Independent Auditors Report 1 Consolidated Financial Statements: Consolidated Income Statement 2 Consolidated
Phihong Technology Co., Ltd. Financial Statements for the Years Ended December 31, 2015 and 2014 and Independent Auditors Report
 Phihong Technology Co., Ltd. Financial Statements for the Years Ended, 2015 and 2014 and Independent Auditors Report INDEPENDENT AUDITORS REPORT The Board of Directors and Stockholders Phihong Technology
Shihlin Electric & Engineering Corp. Financial Statements for the Years Ended December 31, 2013 and 2012 and Independent Auditors Report
 Shihlin Electric & Engineering Corp. Financial Statements for the Years Ended and 2012 and Independent Auditors Report INDEPENDENT AUDITORS REPORT The Board of Directors and Stockholders Shihlin Electric
KOMERCIJALNA BANKA AD SKOPJE. Separate Financial Statements and Independent Auditors Report for the year ended December 31, 2017
 Separate Financial Statements and Independent Auditors Report for the year ended CONTENTS Page Independent Auditors Report Separate Statement of Profit and Loss and Other Comprehensive Income 1 Separate
INVEST BANKA MONTENEGRO A.D., PODGORICA. Financial Statements For the Year Ended December 31, 2009 and Independent Auditors Report
 INVEST BANKA MONTENEGRO A.D., PODGORICA Financial Statements For the Year Ended and Independent Auditors Report English Translation of the Financial Statements Issued in Montenegrin Language CONTENTS Page
Sirtec International Corp. and Subsidiaries
 Sirtec International Corp. and Subsidiaries Consolidated Financial Statements for the Years Ended, 2014 and 2013 and Independent Auditors Report INDEPENDENT AUDITORS REPORT The Board of Directors and Stockholders
Yageo Corporation and Subsidiaries. Consolidated Financial Statements for the Years Ended December 31, 2015 and 2014 and Independent Auditors Report
 Yageo Corporation and Subsidiaries Consolidated Financial Statements for the Years Ended December 31, 2015 and 2014 and Independent Auditors Report INDEPENDENT AUDITORS REPORT The Board of Directors and
OTP Mortgage Bank Ltd. December 31, 2013
 OTP Mortgage Bank Ltd. Separate Financial Statements in accordance with International Financial Reporting Standards as adopted by the European Union and Independent Auditors Report December 31, 2013 CONTENTS
KOMERCIJALNA BANKA AD SKOPJE. Consolidated financial statements and Independent Auditors Report for the year ended December 31, 2014
 Consolidated financial statements and Independent Auditors Report for the year ended CONTENTS Page Independent Auditors Report Consolidated statement of profit or loss and other comprehensive Income 1
SERBIAN EXPORT AND INSURANCE AGENCY j.s.c., UŽICE. Restated Financial Statements for the Year Ended 31 December 2013 and Independent Auditor s Report
 SERBIAN EXPORT AND INSURANCE AGENCY j.s.c., UŽICE Restated Financial Statements for the Year Ended 31 December 2013 and Independent Auditor s Report This version of our report/ the accompanying documents
(Convenience translation of a report and financial statements originally issued in Turkish) BİM Birleşik Mağazalar Anonim Şirketi
 BİM Birleşik Mağazalar Anonim Şirketi") (Convenience translation of a report and financial statements originally issued in Turkish) BİM Birleşik Mağazalar Anonim Şirketi Interim consolidated financial statements for the period between January
(Convenience translation of a report and financial statements originally issued in Turkish) BİM Birleşik Mağazalar Anonim Şirketi Interim consolidated financial statements for the period between January
KOMERCIJALNA BANKA AD SKOPJE. Consolidated financial statements and Independent Auditors Report For the year ended December 31, 2017
 Consolidated financial statements and Independent Auditors Report For the year ended CONTENTS Page Independent Auditors Report Consolidated statement of profit or loss and other comprehensive Income 1
MF BANKA A.D. BANJA LUKA. Financial Statements Year Ended December 31, 2014 and Independent Auditors Report
 Financial Statements and Independent Auditors Report CONTENTS Page Independent Auditors' Report 1 Financial Statements: Statement of Profit and Loss and Other Comprehensive Income 2 Statement of Financial
MF BANKA A.D. BANJA LUKA. Financial Statements Year Ended December 31, 2015 and Independent Auditors Report
 Financial Statements and Independent Auditors Report CONTENTS Page Independent Auditors' Report 1 Financial Statements: Statement of Profit and Loss and Other Comprehensive Income 2 Statement of Financial
Consolidated Financial Statements. Independent Auditors Report
 KOMERCIJALNA BANKA A.D., BEOGRAD Consolidated Financial Statements Year Ended and Independent Auditors Report CONTENTS Page Independent Auditors' Report 1-2 Consolidated Financial Statements: Consolidated
 STATEMENT OF PROFIT OR LOSS For the year ended 31 December 2014 Financial statements Note 2014 2013 Interest income Cash and cash equivalents 893,744 506,424 Loans to customers 1,020,693 440,642 Amounts
Bank SinoPac. Financial Statements for the Years Ended December 31, 2013 and 2012 and Independent Auditors Report
 Bank SinoPac Financial Statements for the Years Ended 2013 and and Independent Auditors Report INDEPENDENT AUDITORS REPORT The Board of Directors and Stockholders Bank SinoPac We have audited the accompanying
Financial statements and Independent Auditors Report. TTK Banka AD Skopje. 31 December 2010
 Financial statements and Independent Auditors Report TTK Banka AD Skopje 31 December 2010 This is an English translation of the original Report issued in Macedonian, in case of any discrepancies between
Ameriabank cjsc. Financial Statements For the second quarter of 2016
 Financial Statements For the second quarter of Contents Statement of profit or loss and other comprehensive income... 3 Statement of financial position... 4 Statement of cash flows... 5 Statement of changes
Financial supplement NPM/CNP. Compagnie Nationale à Portefeuille Nationale PortefeuilleMaatschappij
 Financial supplement 2004 NPM/CNP Compagnie Nationale à Portefeuille Nationale PortefeuilleMaatschappij CONSOLIDATED ANNUAL ACCOUNTS Page Statutory auditor's report 2 Consolidated income statement 4 Consolidated
SOCIETE GENERALE YUGOSLAV BANK a.d. BEOGRAD FINANCIAL STATEMENTS AS OF AND FOR THE YEAR ENDED 31 DECEMBER 2005
 SOCIETE GENERALE YUGOSLAV BANK a.d. BEOGRAD FINANCIAL STATEMENTS AS OF AND FOR THE YEAR ENDED 31 DECEMBER 2005 CONTENTS Page(s) Independent Auditor s Report 1 Income Statement 2 Balance Sheet 3 Statement
CREDO BANKA D.D., SPLIT FINANCIAL STATEMENTS FOR THE YEAR ENDED 31 DECEMBER 2010 TOGETHER WITH INDEPENDENT AUDITOR S REPORT
 CREDO BANKA D.D., SPLIT FINANCIAL STATEMENTS FOR THE YEAR ENDED 31 DECEMBER 2010 TOGETHER WITH INDEPENDENT AUDITOR S REPORT Contents Page Statement of the Management's Responsibility 1 Independent Auditor's
Annual Report for the year ended June 30, 2014 FINANCIAL STATEMENTS
 Annual Report FINANCIAL STATEMENTS 33 34 Mughal Iron & Steel Industries Limited Annual Report 35 AUDITORS REPORT TO THE MEMBERS We have audited the annexed balance sheet of MUGHAL IRON & STEEL INDUSTRIES
OPPORTUNITY BANKA A.D. NOVI SAD
 OPPORTUNITY BANKA A.D. NOVI SAD Financial Statements For the year ended 31 December 2008 Prepared in accordance with International Financial Reporting Standards Belgrade, 13 March 2009 FINANCIAL STATEMENTS
KOMERCIJALNA BANKA A.D., BUDVA
 KOMERCIJALNA BANKA A.D., BUDVA Financial Statements for the year ended and Independent Auditor s Report Contents Page INDEPENDENT AUDITORS' REPORT 1-2 Income statement from January 1 to 3 Statement of
Consolidated financial statements
 Consolidated financial statements Annual report 2016 Contents 1 Consolidated financial statements 4 Consolidated balance sheet 6 Consolidated statement of comprehensive income 8 Consolidated statement
FERTIL d.o.o., Bačka Palanka Financial Statements Year Ended December 31, 2012 and Independent Auditors Report
 FERTIL d.o.o., Bačka Palanka Financial Statements Year Ended and Independent Auditors Report This is a translation of the original Auditors Report issued in the Serbian language FERTIL d.o.o., Bačka Palanka
Advantech Co., Ltd. and Subsidiaries
 Advantech Co., Ltd. and Subsidiaries Consolidated Financial Statements for the Three Months Ended March 31, 2015 and 2014 and Independent Auditors Review Report INDEPENDENT AUDITORS REVIEW REPORT The Board
METALAC A.D., GORNJI MILANOVAC. Consolidated Financial Statements Year Ended December 31, 2011 and Independent Auditors Report
 Consolidated Financial Statements Year Ended and Independent Auditors Report CONTENTS Page Independent Auditors Report 1 Consolidated Income Statement 2 Consolidated Balance Sheet 3 Consolidated Statement
INVEST BANK MONTENEGRO AD, PODGORICA FINANCIAL STATEMENTS YEAR ENDED DECEMBER 31, 2014 AND INDEPENDENT AUDITORS REPORT
 INVEST BANK MONTENEGRO AD, PODGORICA FINANCIAL STATEMENTS YEAR ENDED DECEMBER 31, AND INDEPENDENT AUDITORS REPORT CONTENTS Page Independent auditors report 1-2 Income Statement 3 Balance Sheet 4 Statement
CRNOGORSKA KOMERCIJALNA BANKA AD, PODGORICA. Financial Statements For the Year Ended December 31, 2016 and Independent Auditors Report
 CRNOGORSKA KOMERCIJALNA BANKA AD, PODGORICA Financial Statements For the Year Ended and Independent Auditors Report CONTENTS Page Responsibility for the financial statements 1 Independent Auditors Report
Financial statements and Independent Auditor's Report. Ohridska Banka A.D., Ohrid. 31 December 2009
 Financial statements and Independent Auditor's Report Ohridska Banka A.D., Ohrid 31 December 2009 Contents Page Independent Auditors Report 1 Income statement 3 Statement of comprehensive income 4 Statement
EVA AIRWAYS CORP. Parent-Company-Only Financial Statements December 31, 2015 and 2014 (With Independent Auditors' Report Thereon)
") Parent-Company-Only Financial Statements December 31, 2015 and 2014 (With Independent Auditors' Report Thereon) Address: No. 376, Sec. 1, Hsin-nan Road, Luchu Dist., Taoyuan City, Taiwan Telephone No.:
Parent-Company-Only Financial Statements December 31, 2015 and 2014 (With Independent Auditors' Report Thereon) Address: No. 376, Sec. 1, Hsin-nan Road, Luchu Dist., Taoyuan City, Taiwan Telephone No.:
Converse Bank closed joint stock company. Consolidated Financial Statements. 31 December 2017
 Converse Bank closed joint stock company Consolidated Financial Statements 31 December 2017 1 Converse Bank CJSC Consolidated financial statements as at 31 December 2017 Contents Consolidated statement
Pou Chen Corporation and Subsidiaries
 Pou Chen Corporation and Subsidiaries Consolidated Financial Statements for the Three Months Ended and and Independent Auditors Review Report INDEPENDENT AUDITORS REVIEW REPORT The Board of Directors and
S.C. LIBRA INTERNET BANK S.A. FINANCIAL STATEMENTS FOR THE YEAR ENDED DECEMBER 31, 2011
 FINANCIAL STATEMENTS FOR THE YEAR ENDED DECEMBER 31, 2011 PREPARED IN ACCORDANCE WITH INTERNATIONAL FINANCIAL REPORTING STANDARDS TOGETHER WITH THE INDEPENDENT AUDITOR S REPORT CONTENTS PAGE INDEPENDENT
Wowprime Co., Ltd. and Subsidiaries. Consolidated Financial Statements for the Years Ended December 31, 2015 and 2014 and Independent Auditors Report
 Wowprime Co., Ltd. and Subsidiaries Consolidated Financial Statements for the Years Ended, 2015 and 2014 and Independent Auditors Report INDEPENDENT AUDITORS REPORT The Board of Directors and Stockholders
Converse Bank closed joint stock company
 Converse Bank closed joint stock company Consolidated Financial Statements 30 September 2016 Consolidated financial statements as at 30 September 2016 Contents Consolidated statement of financial position...
Converse Bank Closed Joint Stock Company Consolidated financial statements. Year ended 31 December 2016 together with independent auditor s report
 Consolidated financial statements Year ended 31 December 2016 together with independent auditor s report 2016 Consolidated financial statements Contents Independent auditor s report Consolidated statement
JSC MICROFINANCE ORGANIZATION FINCA GEORGIA. Financial statements. Together with the Auditor s Report. Year ended 31 December 2010
 JSC MICROFINANCE ORGANIZATION FINCA GEORGIA Financial statements Together with the Auditor s Report Year ended 31 December 2010 JSC MICROFINANCE ORGANIZATION FINCA Georgia FINANCIAL STATEMENTS Contents:
MF BANKA A.D. BANJA LUKA. Financial Statements Year Ended December 31, 2016 and Independent Auditors Report
 Financial Statements and Independent Auditors Report CONTENTS Page Independent Auditors' Report 1 Financial Statements: Statement of Profit and Loss and Other Comprehensive Income 2 Statement of Financial
Advantech Co., Ltd. and Subsidiaries
 Advantech Co., Ltd. and Subsidiaries Consolidated Financial Statements for the Six Months Ended, 2016 and 2015 and Independent Auditors Review Report INDEPENDENT AUDITORS REVIEW REPORT The Board of Directors
FOR THE YEAR ENDED 31 DECEMBER
 CONSOLIDATED FINANCIAL STATEMENTS IN ACCORDANCE WITH INTERNATIONAL FINANCIAL REPORTING STANDARDS AS ADOPTED BY THE EUROPEAN UNION AND INDEPENDENT AUDITORS REPORT FOR THE YEAR ENDED 31 DECEMBER 2017 CONSOLIDATED
Independent Auditors Report - to the members 1. Consolidated Statement of Financial Position 2. Consolidated Statement of Comprehensive Income 3
 AND ITS SUBSIDIARIES CONTENTS Independent Auditors Report - to the members 1 Page FINANCIAL STATEMENTS Consolidated Statement of Financial Position 2 Consolidated Statement of Comprehensive Income 3 Consolidated
Taiwan Semiconductor Manufacturing Company Limited
 Taiwan Semiconductor Manufacturing Company Limited Parent Company Only Financial Statements for the Years Ended 2015 and 2014 and Independent Auditors Report - 99 - - 100 - - 101 - Taiwan Semiconductor
CONSOLIDATED ANNUAL FINANCIAL STATEMENTS FOR 2012
 CONSOLIDATED ANNUAL FINANCIAL STATEMENTS FOR 2012 Gornji Milanovac, 20.05.2013. Pursuant to the Art. 50 and 51 of the Law on the Capital Market (Official Gazette of the Republic of Serbia No. 31/2011)
CONSOLIDATED FINANCIAL STATEMENTS Guacolda Energía S.A. and Subsidiary For the years ended December 31, 2015 and 2014
 CONSOLIDATED FINANCIAL STATEMENTS Guacolda Energía S.A. and Subsidiary For the years ended and This document includes the following sections: - Independent Auditor s Report - Consolidated Statements of
Advantech Co., Ltd. and Subsidiaries
 Advantech Co., Ltd. and Subsidiaries Consolidated Financial Statements for the Nine Months Ended 2018 and and Independent Auditors Review Report INDEPENDENT AUDITORS REVIEW REPORT The Board of Directors
WE HAVE A SOUND FINANCIAL BASIS!
 WE HAVE A SOUND FINANCIAL BASIS! The Consolidated Financial Statements presented as follows have been prepared in accordance with the International Financial Reporting Standards (IFRS) as adopted by the
OTP MORTGAGE BANK LTD.
 UNCONSOLIDATED FINANCIAL STATEMENTS IN ACCORDANCE WITH INTERNATIONAL FINANCIAL REPORTING STANDARDS AS ADOPTED BY THE EUROPEAN UNION FOR THE YEAR ENDED CONTENTS Page Independent Auditors Report Unconsolidated
Annual Financial Statements 2017
 Annual Financial Statements 2017 For the year ended March 31, 2017 Contents 02 Consolidated Statement of Income 02 Consolidated Statement of Comprehensive Income 03 Consolidated Statement of Financial
ČEZ, a. s. FINANCIAL STATEMENTS
 ČEZ, a. s. FINANCIAL STATEMENTS PREPARED IN ACCORDANCE WITH INTERNATIONAL FINANCIAL REPORTING STANDARDS AS OF DECEMBER 31, 2017 ČEZ, a. s. BALANCE SHEET AS OF DECEMBER 31, 2017 in CZK Millions ASSETS:
C ONSOLIDATED FINANCIAL STATEMENTS. Algeco Scotsman Global S.à r.l. Years Ended December 31, 2012, 2011 and 2010 With Report of Independent Auditors
 C ONSOLIDATED FINANCIAL STATEMENTS Algeco Scotsman Global S.à r.l. Years Ended December 31, 2012, 2011 and 2010 With Report of Independent Auditors Table of Contents Consolidated Statements of Comprehensive
TAIPEI FUBON COMMERCIAL BANK Co., Ltd. and Subsidiary
 TAIPEI FUBON COMMERCIAL BANK Co., Ltd. and Subsidiary Consolidated Financial Statements for the Six Months Ended June 30, 2013 and 2012 and Independent Auditors Report INDEPENDENT AUDITORS REPORT The Board
Ladysmith & District Credit Union Consolidated Financial Statements December 31, 2017
 Consolidated Financial Statements December 31, 2017 Contents Page Management's Responsibility Independent Auditors' Report Consolidated Financial Statements Consolidated Statement of Financial Position...
INVEST BANKA MONTENEGRO A.D., PODGORICA
 INVEST BANKA MONTENEGRO A.D., PODGORICA Financial Statements For the Year Ended and Independent Auditors Report English Translation of the Auditors Report and Financial Statements issued in the Language
ADVANCED CERAMIC X CORPORATION
 Stock Code:3152 ADVANCED CERAMIC X CORPORATION Financial Statements and Independent Auditors Review Report For the Six Months Ended June 30, 2018 and 2017 Address:NO.16, Tzu Chiang Road, Hsinchu Industrial
KOMERCIJALNA BANKA A.D. BANjA LUKA
 FINANCIAL STATEMENTS FOR THE YEAR ENDED 31 DECEMBER 2011 WITH INDEPENDENT AUDITORS RERORT KOMERCIJALNA BANKA A.D. BANjA LUKA Banja Luka, March 2012 Financial Statements for the year ended 31 December 2011
OTP BANK PLC. FOR THE YEAR ENDED 31 DECEMBER 2016
 CONSOLIDATED FINANCIAL STATEMENTS IN ACCORDANCE WITH INTERNATIONAL FINANCIAL REPORTING STANDARDS AS ADOPTED BY THE EUROPEAN UNION AND INDEPENDENT AUDITORS REPORT FOR THE YEAR ENDED 31 DECEMBER 2016 CONSOLIDATED
1
 0 0 1 2 3 4 5 6 7 9 10 11 14 15 CONSOLIDATED AND SEPARATE INCOME STATEMENT Dalekovod Group Dalekovod d.d. (all amounts are expressed in thousands of HRK) Note 2016 2015 2016 2015 Sales revenue
Income statement 3. Balance sheet 4. Cash Flow Statement 6-7. Notes to the Financial Statements 8 67
 MARFIN BANK A.D., BEOGRAD FINANCIAL STATEMENTS FOR THE YEAR ENDED 31 DECEMBER 2009 TABLE OF CONTENTS Page Independent Auditor s report 1-2 Income statement 3 Balance sheet 4 Statement of Changes in Equity