OTP BANKA SRBIJA A.D., NOVI SAD. Consolidated Financial Statements Year Ended December 31, 2017 and Independent Auditors Report
|
|
|
- Esther Chapman
- 5 years ago
- Views:
Transcription
1 Consolidated Financial Statements Year Ended and Independent Auditors Report
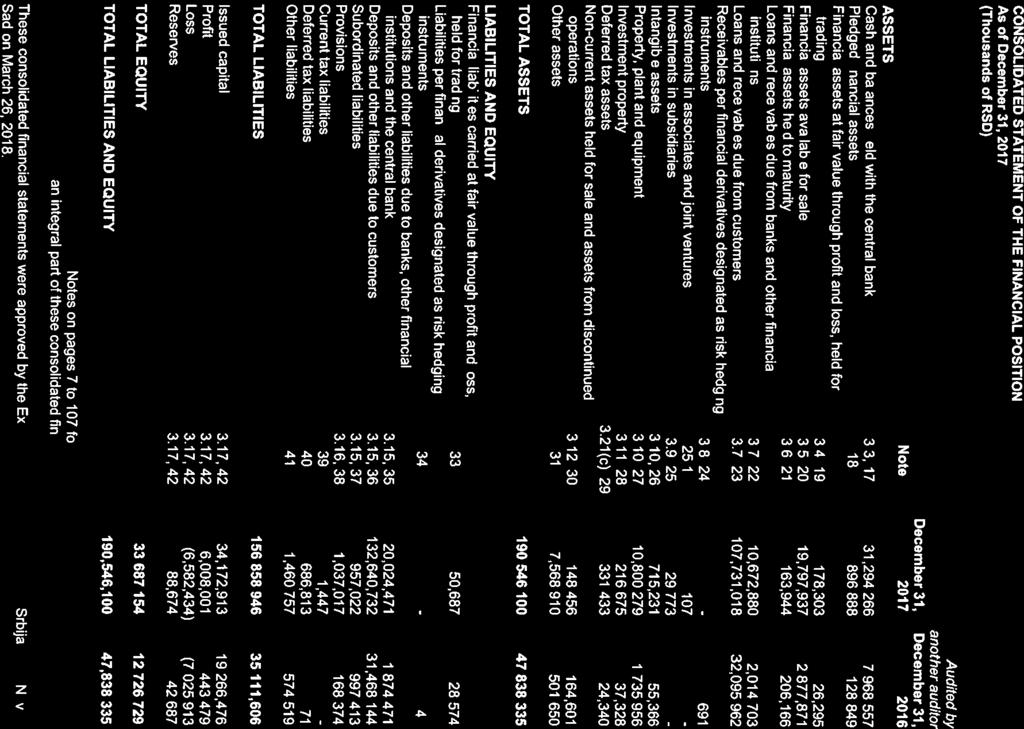
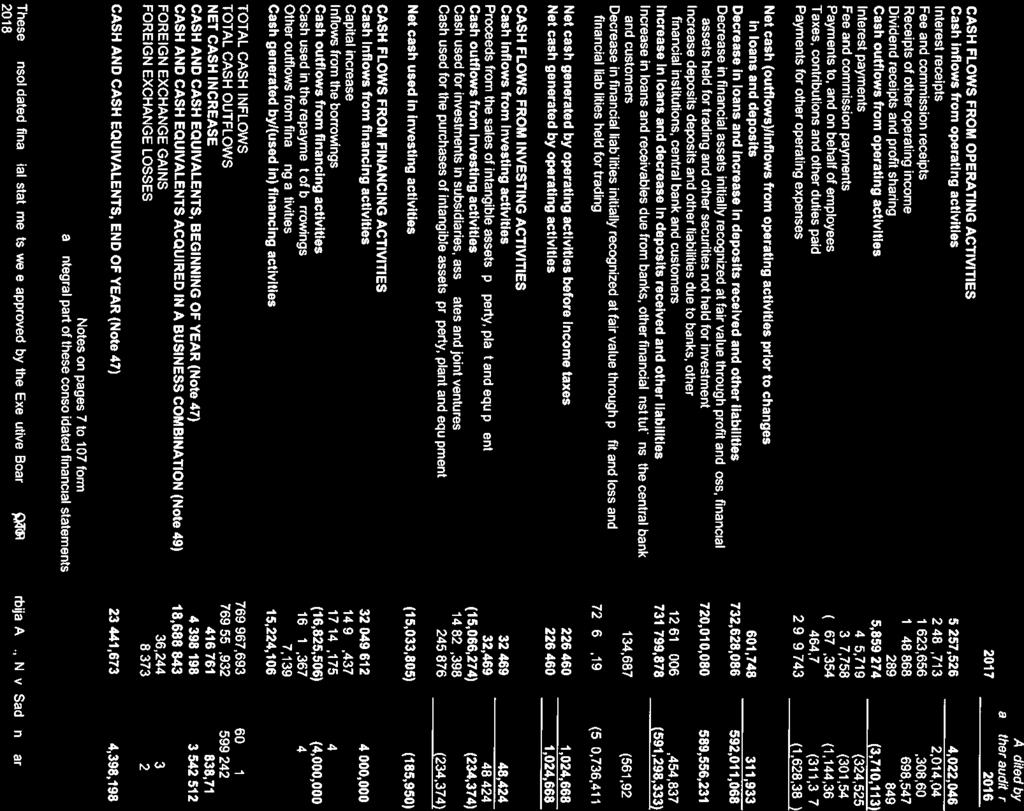
2 CONTENTS Page Independent Auditors' Report 1 Consolidated Financial Statements: Consolidated Income Statement 2 Consolidated Statement of Other Comprehensive Income 3 Consolidated Statement of the Financial Position 4 Consolidated Statement of Cash Flows 5 Consolidated Statement of Changes in Equity 6 Notes to the Consolidated Financial Statements Appendix: Consoldiated Annual Report

 and its subsidiaries (hereinafter: the Group ), enclosed on pages 2 to 107, which comprise the consolidated statement of the financial position as of and the related")
3 Deloitte d.o.o. Beograd Terazije Belgrade Republic of Serbia Tax Identification Number: Registration Number: Tel: +381 (0) Fax: +381 (0) INDEPENDENT AUDITORS REPORT To the Board of Directors and Founders of OTP Banka Srbija A.D., Novi Sad We have audited the accompanying consolidated financial statements of OTP banka Srbija A.D., Novi Sad (hereinafter: the Bank ) and its subsidiaries (hereinafter: the Group ), enclosed on pages 2 to 107, which comprise the consolidated statement of the financial position as of and the related consolidated income statement, consolidated statement of other comprehensive income, consolidated statement of changes in equity and consolidated statement of cash flows for the year then ended, and a summary of significant accounting policies and other consolidated explanatory notes. Management s Responsibility for the Consolidated Financial Statements Management is responsible for the preparation and fair presentation of these consolidated financial statements in accordance with the International Financial Reporting Standards, as well as for such internal control as management determines is necessary to enable the preparation of consolidated financial statements that are free from material misstatement, whether due to fraud or error. Auditors Responsibility Our responsibility is to express an opinion on these consolidated financial statements based on our audit. We conducted our audit in accordance with the Law on Audit and standards on auditing applicable in the Republic of Serbia. Those standards require that we comply with ethical requirements and plan and perform the audit to obtain reasonable assurance whether the consolidated financial statements are free from material misstatement. An audit involves performing procedures to obtain audit evidence about the amounts and disclosures in the consolidated financial statements. The procedures selected depend on the auditor s judgment, including the assessment of the risks of material misstatement of the consolidated financial statements, whether due to fraud or error. In making those risk assessments, the auditor considers internal control relevant to the entity s preparation and fair presentation of the consolidated financial statements in order to design audit procedures that are appropriate in the circumstances, but not for the purpose of expressing an opinion on the effectiveness of the entity s internal control. An audit also includes evaluating the appropriateness of accounting policies used and the reasonableness of accounting estimates made by management, as well as evaluating the overall presentation of the consolidated financial statements. We believe that the audit evidence we have obtained is sufficient and appropriate to provide a basis for our audit opinion. Opinion In our opinion, the consolidated financial statements present fairly, in all material respects, the financial position of OTP banka Srbija A.D., Novi Sad and its subsidiaries as at, and their financial performance and cash flows for the year then ended in accordance with the International Financial Reporting Standards. Report on Other Legal and Regulatory Requirements Management of the Bank is responsible for the preparation of the consolidated annual business report in accordance with the requirements of the Law on Accounting of the Republic of Serbia. In accordance with the Law on Audit of the Republic of Serbia and Decision on Amendments and Supplements to the Decision on External Audit of Banks, it is our responsibility to express an opinion on the compliance of the accompanying consolidated annual business report for the year 2017 with the consolidated financial statements for the same financial year. In our opinion, the consolidated financial information disclosed in the consolidated annual business report for 2017 is consistent with the audited consolidated financial statements for the year ended. Other Matter The Group s consolidated financial statements as of and for the year ended 2016 were audited by another auditor, whose report dated March 17, 2017 expressed an unqualified opinion. Belgrade, March 27, 2018 Nataša Milojević Certified Auditor Deloitte refers to one or more of Deloitte Touche Tohmatsu Limited, a UK private company limited by guarantee, and its network of member firms, each of which is a legally separate and independent entity. Please see for a detailed description of the legal structure of Deloitte Touche Tohmatsu Limited and its member firms Deloitte d.o.o. Beograd


4


5


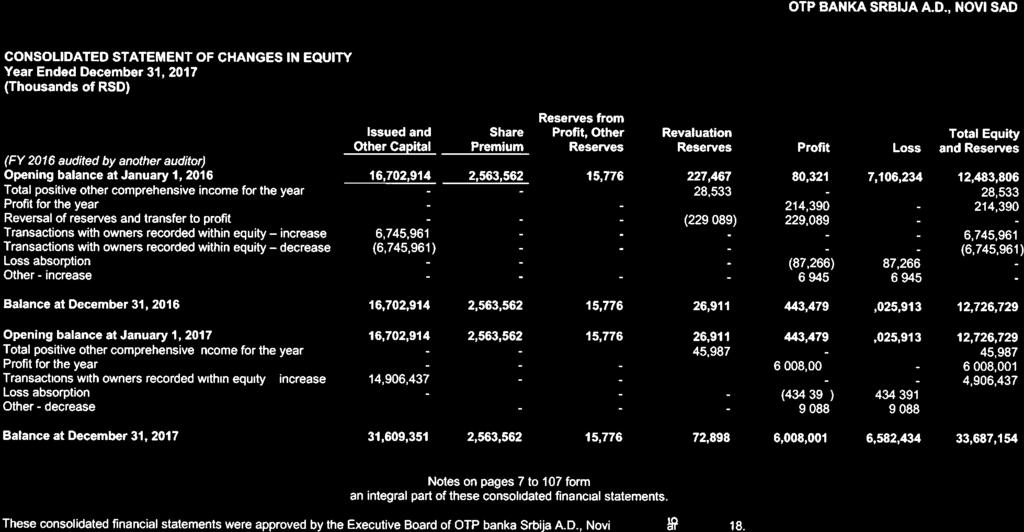
6


7


8
9 1. BANK S ESTABLISHMENT AND ACTIVITY OTP Banka Srbija a.d., Novi Sad (hereinafter: the Bank ) is a direct legal successor of Kulska banka a.d., Novi Sad. Kulska banka a.d., Novi Sad was registered as a shareholding company with the Commercial Court of Sombor, in accordance with May 17, 1995 Decision No. Fi 488/95. Pursuant to the Serbian Business Registers Agency Decision number BD 32735/2007 as of May 18, 2007, the name Kulska banka a.d., Novi Sad was changed into OTP banka Srbija a.d., Novi Sad. Simultaneously, the status change of merger and acquisition was registered, whereby Zepter banka a.d., Beograd and Niška banka a.d., Niš were merged with and acquired by Kulska banka a.d. Novi Sad as the Acquirer; through the aforesaid status change Zepter banka a.d., Beograd and Niška banka a.d., Niš ceased to exist and were deleted from the Business Register. The Bank is registered in the Republic of Serbia to provide banking services of payment transfers, lending and depositary and other activities in accordance with the Law on Banks. The Bank's registered Head Office address is Novi Sad, at no. 80 Bulevar Oslobođenja Street. The Bank is the parent entity of a group comprised of the Bank and its subsidiaries OTP Investments d.o.o. Novi Sad, Vojvođanska banka a.d. Novi Sad, OTP Lizing d.o.o. Beograd and OTP Services d.o.o. Beograd (hereinafter collectively the: Group ). As of, the Group had 2,184 employees ( 2016: 662 employees). The Bank is a member of OTP Group. OTP Bank Plc. Budapest is the majority owner of the Bank holding 97.92% of the Group s share capital. As at, the Bank consisted of the Head Office in Novi Sad, at no. 80 Bulevar Oslobođenja Street, 3 regional affiliates, 50 branches and 2 sub-branches. As at, the Bank had 673 employees ( 2016: 662 employees). The Bank s tax identification number is OTP Investments d.o.o., Novi Sad is a legal successor of the company KB-NS Investments d.o.o. KB- NS Investments d.o.o. was established pursuant to the Decision of Foundation dated January 19, 2006 as a limited liability company. The Company was registered with the Serbian Business Registers Agency in Novi Sad under Decision No. BD /2006. The Company s core business activities are factoring and consulting. The Bank is the sole owner of the Company. As of, the Company had 1 employee (2016: 1 employee). The tax identification number of OTP Investments is Vојvоđаnskа bаnkа a.d., Nоvi Sаd was established on 1989 through transformation of Vojvođanska banka Udružena banka [Associated Bank], Novi Sad. In 1995 the Bank changed its legal form into a joint stock company and became Vojvođanska banka a.d., Novi Sad. On December 30, 2001, in accordance with its Articles of Incorporation and the Decision of the Bank s General Assembly, the Bank merged with Srpska razvojna banka a.d., Beograd and Užička banka a.d., Užice. In December 2006, in accordance with the terms of the Agreement on the Purchase and Sale of Share Capital, the National Bank of Greece, Athens became the major owner of the Bank by acquiring an equity interest of 99.43%. The aforementioned acquisition was duly registered with the Central Securities Depository and Clearing House on December 12, On October 25, 2007 the National Bank of Greece, Athens, conducted the squeeze-out on the remaining 1,727 shares and became the sole owner of the Bank. On December 7, 2007, the Bank was excluded from the Belex list at its own request. The Bank is registered in the Republic of Serbia as a joint stock company for provision of banking services associated with payment transfers, credit and deposit activities in the country and abroad, and it operates in accordance with the Republic of Serbia s Law on Banks. In accordance with the Decision brought by the Bank s Assembly on January 3, 2008, the Bank merged with the National Bank of Greece a.d., Beograd. The aforementioned status change of merger by absorption of the National Bank of Greece a.d., Belgrade was registered in the Serbian Business Registers Agency on February 14, 2008 under the number BD 6190/2008 (removal of the business entity the National Bank of Greece a.d., Belgrade as the acquired bank), as well as the change in equity structure of the Bank (Decision number BD 6210/2008). The National Bank of Greece a.d., Belgrade was entirely owned by the National Bank of Greece, Athens and continued its operations under the name of Vojvođanska banka a.d., Novi Sad. 7
10 1. BANK S ESTABLISHMENT AND ACTIVITY (Continued) On December 1, 2017 ОТP bаnkа Srbiја а.d., Nоvi Sаd (hereinafter the Bank ) became the sole (100%) owner of Vојvоđаnska bаnka а.d., Nоvi Sаd. Since December 1, 2017 the Bank has been a member of ОТP Group. The Bank s Head Office is located in Novi Sad, at no. 7, Trg Slobode. As of, the Bank operated through its Head Office located in Novi Sad and 105 branches ( 2016: 106 branches). As of, the Bank had 1,473 employees ( 2016: 1,468 employees). The Bank s corporate ID number is Its tax ID number (fiscal code) is The Financial Leasing Company OTP Lizing d.о.о., Bеоgrаd, which operated until March 28, 2007 under the legal name of TBI Leasing d.o.o. was founded and registered with the Commercial Court in Belgrade pursuant to the December 16, 2003 Decision numbered IX-Fi-13250/2003 in accordance with the Company s Articles of Incorporation dated December 2, The Company s initial founder was TBIF Financial Services B.V. Amsterdam, Netherlands with a 100% equity investment. The Company commenced its operations in The change in the business name, as well as the change of founder, was duly registered with the Serbian Business Registers Agency under the number BD 9148/2007 as of March 28, 2007, when NBG Bank of Greece S.A. Aelou 86, Athens, Greece became the sole owner of the Company. In 2017 the Company underwent another change or the legal name and founder. Under Decision of the Serbian Business Registers Agency no. BD /2017 dated December 26, 2017, the Company s name was changed to OTP Lizing d.о.о., Beograd, with its new sole (100%) owner OTP Banka Srbija а.d., Nоvi Sаd. The Company is principally involved in finance lease activities As of, the Company had 18 employees ( 2016: 19 employees). Pursuant to Article 13a, paragraph 3 and Article 13d, paragraph 2 of the Law on Financial Leasing (RS Official Gazette, No. 55/03 and 61/05), with reference to the issuance of licenses and approvals by the National Bank of Serbia (RS Official Gazette, No. 81/05), on January 25, 2006, the Governor of the National Bank of Serbia issued an operating license to the Company whereby the Company was allowed to perform finance lease business activity. The Company s corporate ID number is , whereas its tax identification number (fiscal code) is The Company is headquartered in Belgrade, at no. 88, Omladinskih brigada Street. The limited liability company OTP Services d.o.o., Beograd (hereinafter: the Company ), was registered with the Serbian Business Registers Agency in Belgrade under Decision number BD /2007 dated September 3, The Company s initially registered predominant activity involved other advertising and marketing services. Pursuant to the March 21, 2008 Decision of the Serbian Business Registers Agency no. BD 14565/2008, the Company s core activity was changed and ever since it has been rental of automobiles. Under Decision of the Serbian Business Registers Agency no. BD /2017 dated December 26, 2017 the Company registered a change of its legal name into OTP Services d.o.o., Beograd. The Company is headquartered in Belgrade, at the street address of Novi Beograd, Omladinskih Brigada 88. The Company s founder is OTP Lizing d.о.о., Bеоgrаd - a business entity involved in finance leasing. The Company is registered as a 100% privately owned domestic company (a single member company). The total subscribed and paid-in capital amounts to EUR (in words: five hundred Euro) in RSD equivalent. The Company s tax identification number is Its corporate ID number is , whereas the activity code is
11 1. BANK S ESTABLISHMENT AND ACTIVITY (Continued) According to the criteria defined by the Law on Accounting, the Company is classified as a small-sized legal entity. The Company s governing body is the Company Director. The functions of the Assembly are performed by the founder since this is a single-member company. As of, the Company had 19 employees ( 2016: 19 employees). 2. BASIS OF PREPARATION AND PRESENTATION OF THE CONSOLIDATED FINANCIAL STATEMENTS AND ACCOUNTING CONVENTION 2.1. Basis of Preparation and Presentation of the Consolidated Financial Statements Legal entities and entrepreneurs incorporated in Serbia are required to maintain their books of account, to recognize and value assets and liabilities, income and expenses, and to present, submit and disclose financial statements in conformity the Law on Accounting (hereinafter referred to as the Law, RS Official Gazette, No. 62/2013). As a large legal entity and in accordance with the Law on Accounting, the Bank is required to apply International Financial Reporting Standards ( IFRS ), which as per the aforementioned law comprise the following: the Framework for the Preparation and Presentation of Financial Statements (the Framework ), International Accounting Standards ( IAS ), International Financial Reporting Standards ( IFRS ), as well as the related interpretations issued by the International Financial Reporting Interpretations Committee ( IFRIC ) and additional amendments to the standards and related interpretations issued by the International Accounting Standards Board ( IASB ), the translations of which to the Serbian language were approved and published by the competent Ministry of Finance. In addition, in accordance with the Amendments and Supplements to the Law on Banks (RS Official Gazette, No. 14/2015), upon preparation of the annual financial statements, banks in the Republic of Serbia are obligated to apply the International Financial Reporting Standards, subsequent revisions and amendments thereto and related interpretations as from their issue date by the competent authorities. The accompanying consolidated financial statements are presented in the format prescribed under the Decision on the Forms and Contents of the Items in the Forms of the Financial Statements of Banks (RS Official Gazette, No. 71/2014 and 135/2014). The consolidated financial statements include the unconsolidated (standalone) financial statements of OTP banka Srbija a.d. Novi Sad and the financial statements of the below listed entities: Legal name of the subsidiary Address Corporate ID Equity interest OTP Investments d.o.o., Novi Sad Novi Sad, Bulevar Oslobođenja % Vojvođanska Banka a.d., Novi Sad Novi Sad, Trg slobode % OTP Lizing d.o.o., Beograd Beograd, Omladinskih brigada % OTP Services d.o.o., Beograd Beograd, Omladinskih brigada % As of, the financial statements of the subsidiary IMOS a.d., Šid were not included in the consolidated financial statements of OTP banka Srbija a.d., Novi Sad (Note 25) as this subsidiary is immaterial to the Group s financial statements. Based on the Bank s equity holdings in the subsidiaries, the criteria were met for consolidation and preparation of the consolidated financial statements in accordance with the International Financial Reporting Standards. The Bank prepares its consolidated financial statements under the full consolidation method given that it has control over the subsidiaries in accordance with IFRS 10 Consolidated Financial Statements. The Bank prepared and issued the consolidated financial statements as of the same date as the unconsolidated (stand alone) financial statements in accordance with the International Financial Reporting Standards. In accordance with IFRS 10 Consolidated Financial Statements, the Group achieves control over its consolidated subsidiaries if the Group has: 1) power over the subsidiary; 2) exposure, or rights, to variable returns from its involvement with the subsidiary; 3) the ability to use its power over the subsidiary to affect the amount of the Group s returns. 9
12 2. BASIS OF PREPARATION AND PRESENTATION OF THE CONSOLIDATED FINANCIAL STATEMENTS AND ACCOUNTING CONVENTION (Continued) 2.1. Basis of Preparation and Presentation of the Consolidated Financial Statements (Continued) The Group reassesses whether it actually controls its subsidiaries if circumstances arise indicating that any of the above listed three elements of control has changed. Consolidation of a subsidiary commences from the Group s establishment of control over a subsidiary and ceases when the Group loses such control. In other words, income and expenses of the subsidiary are included in the consolidated statement of profit or loss and other comprehensive income from the date of the Group s acquisition of control over the subsidiary up to the date of the Group s loss of control over the subsidiary. These accompanying consolidated financial statements (the consolidated financial statements or financial statements ) were prepared at historical cost principle, except for the measurement of the following significant balance sheet items: financial assets available for sale stated at fair value; derivative financial instruments stated at fair value; financial assets and liabilities held for trading stated at fair value and investment property stated at fair value. Historical cost is generally based on the fair value of consideration paid in exchange for goods and services. Fair value is the price that would be received to sell an asset or paid to transfer a liability in an orderly transaction between the market participants at the measurement date under current market conditions regardless of whether that price is directly observable or estimated using another valuation technique. Upon estimating the fair value of assets or liabilities, the Group takes into account characteristics of assets or liabilities that other market participants would also consider upon determining the price of assets or liabilities at the measurement date. Fair value for measurement and/or disclosure purposes in the accompanying financial statements was determined in the aforesaid manner, except for leasing transactions, which are in the scope of IAS 17, and measurements that have some similarities to fair value but are not fair value, such as the net realizable value in IAS 2 or value in use in IAS 36. In addition, for financial reporting purposes, fair value measurements are categorized into Level 1, 2 or 3 based on the degree to which the inputs to the fair value measurements are observable and the significance of the inputs to the fair value measurement in its entirety, which are described as follows: Level 1 inputs are quoted prices (unadjusted) in active markets for identical assets or liabilities that the entity can access at the measurement date; Level 2 inputs are inputs other than quoted prices included within Level 1 that are observable for the asset or liability, either directly or indirectly; and Level 3 inputs are unobservable inputs for the asset or liability. In the preparation of the accompanying consolidated financial statements, the Bank adhered to the accounting policies described in Note 3. All amounts ofassets, liabilities, equity, income, expenses and cash flows arising from the mutual transactions of the Group members were fully eliminated upon consolidation. The Group s consolidated financial statements are stated in thousands of dinars unless it is otherwise stated. Dinar (RSD) is the official presentation currency in the Republic of Serbia Initial Application of New Amendments to the Existing Standards Effective for the Current Reporting Period The following new amendments to the existing standards issued by the International Accounting Standards Board (IASB) have been effective over the current reporting period: Amendments to IAS 7 Statement of Cash Flows Disclosure Initiative (effective for annual periods beginning on or after January 1, 2017); 10
13 2. BASIS OF PREPARATION AND PRESENTATION OF THE CONSOLIDATED FINANCIAL STATEMENTS AND ACCOUNTING CONVENTION (Continued) 2.2. Initial Application of New Amendments to the Existing Standards Effective for the Current Reporting Period (Continued) Amendments to IAS 12 Income Taxes - Recognition of Deferred Tax Assets for Unrealized Losses (effective for annual periods beginning on or after January 1, 2017); and Amendments to IFRS 12 due to Improvements to IFRSs (cycle ) resulting from the annual improvement project of IFRS (IFRS 1, IFRS 12 and IAS 28) primarily with a view to removing inconsistencies and clarifying wording (amendments to IFRS 12 are to be applied for annual periods beginning on or after January 1, 2017). Adoption of these amendments to the existing standards has not led to any material changes in the Group s consolidated financial statements New Standards and Amendments to the Existing Standards in Issue not yet Adopted At the date of approval of these consolidated financial statements the following new standards, amendments to the existing standards and new interpretations were in issue but not yet effective: IFRS 9 Financial Instruments (effective for annual periods beginning on or after January 1, 2018); IFRS 15 Revenue from Contracts with Customers and further amendments (effective for annual periods beginning on or after January 1, 2018); IFRS 16 Leases (effective for annual periods beginning on or after January 1, 2019); IFRS 17 Insurance Contracts (effective for annual periods beginning on or after January 1, 2021); Amendments to IFRS 2 Share-based Payment - Classification and Measurement of Share-based Payment Transactions (effective for annual periods beginning on or after January 1, 2018); Amendments to IFRS 4 Insurance Contracts - Applying IFRS 9 Financial Instruments with IFRS 4 Insurance Contracts (effective for annual periods beginning on or after January 1, 2018or when IFRS 9 Financial Instruments is applied first time); Amendments to IFRS 9 Financial Instruments - Prepayment Features with Negative Compensation (effective for annual periods beginning on or after January 1, 2019); Amendments to IFRS 10 Consolidated Financial Statements and IAS 28 Investments in Associates and Joint Ventures - Sale or Contribution of Assets between an Investor and its Associate or Joint Venture and further amendments (effective date deferred indefinitely until the research project on the equity method has been concluded); Amendments to IAS 19 Employee Benefits Plan Amendment, Curtailment or Settlement (effective for annual periods beginning on or after January 1, 2019), Amendments to IAS 28 Investments in Associates and Joint Ventures - Long-term Interests in Associates and Joint Ventures (effective for annual periods beginning on or after January 1, 2019); Amendments to IAS 40 Investment Property - Transfers of Investment Property (effective for annual periods beginning on or after January 1, 2018); Amendments to IFRS 1 and IAS 28 due to Improvements to IFRSs (cycle ) resulting from the annual improvement project of IFRS (IFRS 1, IFRS 12 and IAS 28) primarily with a view to removing inconsistencies and clarifying wording (amendments to IFRS 1 and IAS 28 are to be applied for annual periods beginning on or after January 1, 2018); Amendments to various standards due to Improvements to IFRSs (cycle ) resulting from the annual improvement project of IFRS (IFRS 3, IFRS 11, IAS 12 and IAS 23) primarily with a view to removing inconsistencies and clarifying wording (effective for annual periods beginning on or after January 1, 2019); IFRIC 22 Foreign Currency Transactions and Advance Consideration (effective for annual periods beginning on or after January 1, 2018); and IFRIC 23 Uncertainty over Income Tax Treatments (effective for annual periods beginning on or after January 1, 2019). The Bank s management has elected not to adopt these new Standards, amendments to existing Standards and new interpretations in advance of their effective dates. The management anticipates that the adoption of these Standards, amendments to existing Standards and new interpretations will have no material impact on the consolidated financial statements of the Group in the period of initial application. 11
14 2. BASIS OF PREPARATION AND PRESENTATION OF THE CONSOLIDATED FINANCIAL STATEMENTS AND ACCOUNTING CONVENTION (Continued) 2.4. Comparative Information Comparative information in the accompanying consolidated financial statements comprise the data from the Group s consolidated financial statements for As from December 1, 2017, the Group includes Vojvođanska banka a.d. Novi Sad, OTP Lizing d.o.o. Beograd and OTP Services d.o.o. Beograd Use of Estimates Preparation of the consolidated financial statements in accordance with IFRS requires the Group s management to make the best possible estimates and reasonable assumptions that affect the application of the accounting policies and the reported amounts of assets and liabilities, as well as income and expenses arising during the accounting period. Actual amounts of assets and liabilities may vary from these estimates. These estimations and underlying assumptions are subject to regular review. The revised accounting estimates are presented for the period in which they are revised as well as for the ensuing periods Going Concern The Group s consolidated financial statements have been prepared on a going concern basis, which entails that the Group will continue to operate in the foreseeable future Statement of Compliance The Group's accompanying consolidated financial statements have been prepared in accordance with the International Financial Reporting Standards ( IFRS ) issued by the International Accounting Standards Board ( IASB ) First-Time Adoption of IFRS 9 The Group analyzed the estimated impact of the application of IFRS 9 in accordance with IAS 8, paragraphs and presented it in the Group's consolidated financial statements as follows: IFRS 9 Financial Instruments replaces IAS 39 "Financial Instruments: Recognition and Measurement" for annual reporting periods commencing on or after January 1, It contains changes to the requirements relating to the recognition and measurement, impairment, derecognition and hedge accounting. The Group started its preparation for IFRS 9 actively in 2016, led by the Bank s Risk Management and Finance Divisions, and during 2017 much of the preparation was finalized. The preparations covered the key challenges that the Group faces with the new standard adoption. The amended hedge accounting model, as one of the changes introduced by IFRS 9 was not included in the Group s project since hedge accounting is not applicable to the Group. Classification and measurement IFRS 9 introduced a new approach for classification of financial assets driven by cash flow characteristics and the business model in which an asset is held. The Group recognizes the financial liabilities at amortized cost except in those cases when the standard requires otherwise, or at the fair value option, when the entity choses to recognize a financial instrument at the fair value through profit or loss. Preliminary analyses of the business models and contractual cash flows of the Group members significant portfolios were performed to determine, by product segments, those financial instruments that would be measured at amortized cost (AC), at fair value through profit or loss (FVTPL), or at fair value through other comprehensive income (FVTOCI). As of January 1, 2018, the Group had no loans measured at fair value. 12
15 2. BASIS OF PREPARATION AND PRESENTATION OF THE CONSOLIDATED FINANCIAL STATEMENTS AND ACCOUNTING CONVENTION (Continued) 2.8. First-Time Adoption of IFRS 9 (Continued) Impairment IFRS 9 introduces an expected-loss impairment model instead of the previously applied incurred loss model that requires a more timely recognition of credit losses. The standard requires legal entities to account for expected credit losses from the moment the financial instruments are first recognized. The use of a new, three-stage model was implemented for IFRS 9 purposes. The new impairment methodology is used to classify financial instruments in order to determine whether credit risk has significantly increased since initial recognition and be able to identify credit-impaired assets. For instruments with credit impairment or significant increase of credit risk, lifetime expected losses will be recognized. The increased credit impairment is identified by transactions on the basis of predetermined conditions and beyond this the estimation is made on a portfolio level. Assets where no significant increase of credit risk has been identified, will be provisioned based on a 12-month expected loss methodology. For purchased or originated credit-impaired financial assets, the same lifetime expected loss methodology was extended in order to be able to capture the cumulative changes in lifetime expected credit losses since the initial recognition as a credit-impaired instrument. The Group chose the use of the simplified impairment approach for trade receivables and contract assets. Together with the Parent OTP Group, the Group started to further improve its risk management definitions, processes and methodological analysis in line with the expectations of IFRS 9. The Group has started developing the methodology using the behavioral scoring model for the identification of significant increase of credit risk and the calculation of expected credit losses through the use of IFRS 9 compliant risk parameters. Based on the gap analyses and the changes in methodology, the main principles regarding IT solutions for IFRS 9 implementation were laid down. Preliminary specifications were prepared and IT implementation was mostly completed in 2017, although there are ongoing aspects such as rating/scoring models for significant portfolios, where the developments have not yet been finished. The IFRS 9 implementation project was driven by the OTP Group Headquarters. The unified methodology and the initial parameter estimation was developed and delivered centrally, at the level of OTP Group. The rollout of the calculations to the subsidiaries is ongoing and at the issue date of these consolidated financial statements was not yet completed. Due to the foregoing, the Bank s management was unable to estimate the probale impact of IFRS 9 implementation, 3. SUMMARY OF SIGNIFICANT ACCOUNTING POLICIES The Group has consistently applied the adopted accounting policies to all periods presented in these consolidated financial statements. The basic accounting policies applied by the Bank in preparation of the consolidated 2017 financial statements are provided hereunder Foreign Exchange Translation Assets and liabilities denominated in foreign currencies at the reporting date are translated into dinars at official middle exchange rates of the National Bank of Serbia effective at that date. Gains or losses arising on the translation of receivables and payables are credited or charged to income statement. Transactions denominated in foreign currencies are translated into dinars at official exchange rates effective at the date of each transaction. Net foreign exchange positive or negative effects arising upon the translation of transactions, and the assets and liabilities denominated in foreign currencies are credited or charged to the income statement as foreign exchange gains or losses. 13
16 3. SUMMARY OF SIGNIFICANT ACCOUNTING POLICIES (Continued) 3.1. Foreign Exchange Translation (Continued) Commitment and contingent liabilities in foreign currencies are translated into dinars at official middle exchange rates of the National Bank of Serbia effective as at the reporting date. The exchange rates for major currencies used in the translation of statement of financial position components into dinars were as follows: Currency Official middle exchange rate at Official middle exchange rate at 2016 USD CHF EUR Financial Instruments a) Recognition and Initial Measurement A financial instrument is each contract based on which a financial asset of one entity and a financial liability or an equity instrument of another entity arise. A financial asset or liability is measured initially at fair value plus transaction costs, except for financial assets and liabilities held for trading, whose measurement does not include these costs. The Group initially recognizes financial instruments at the settlement date. Upon initial recognition the Group classifies its financial assets into the following categories: - loans and receivables; - financial assets at fair value through profit or loss; - financial assets available for sale; and - financial assets held to maturity. Upon initial recognition the Group classifies its financial liabilities as measured at amortized cost or as held for trading. b) Amortized Cost Measurement The amortized cost of a financial asset or liability is the amount at which the financial asset or liability is measured at initial recognition, minus principal repayments, plus or minus the cumulative amortization using the effective interest method of any difference between the initial amount recognized and the maturity amount, minus any allowance for impairment. c) Fair Value Measurement Fair value is the price that would be received to sell an asset or paid to transfer a liability in an orderly transaction in the principal (or most advantageous) market at the measurement date under current market conditions (output price) regardless of whether that price is directly observable or estimated using another valuation technique. Upon assessment of an asset s or a liability s fair value, the Group takes into account characteristics of the asset or the liability that the other market participants would consider in determining the prices of the said instruments at the measurement date. Upon fair value calculation for the items measured at fair value under the adopted accounting policies, the Group takes into account fair value hierarchy rules prescribed by IFRS 13. The Group discloses information on the fair values of assets and liabilities for which there is official market information in instances of the significant differences between the fair and carrying values of assets and liabilities. In accordance with IFRS 13, financial instruments measured at fair value are categorized in three levels of fair value hierarchy, as follows: 14
17 3. SUMMARY OF SIGNIFICANT ACCOUNTING POLICIES (Continued) 3.2. Financial Instruments (Continued) c) Fair Value Measurement (Continued) 1) Level 1 inputs are quoted prices (unadjusted) in active markets for identical assets or liabilities that the Group can access at the measurement date. A price quoted in an active market provides the most reliable evidence of fair value and is used without adjusting in fair value measurement whenever available. 2) Level 2 inputs are inputs other than the quoted prices included in Level 1 that are observable for the asset or liability, either directly or indirectly. 3) Level 3 inputs are unobservable inputs for the asset or liability. Unobservable inputs are used in fair value measurement to the extent that the relevant observable inputs are unavailable. In the accompanying consolidated financial statements, for valuation and/or disclosure purposes, the fair values were determined in the above described manner except for share-based payment transactions, which are in the scope of IFRS 2, lease transactions, which are in the scope of IFRS 17 and measurements that are similar to but are not fair value measurements, such as the net realizable value under IAS 2 or value in use under IAS 36. d) Offsetting Assets and liabilities are not offset except when offsetting is required or permitted under provisions of certain IAS/IFRS. Income and expenses are presented separately, as their offsetting is not permitted. The Group applies the following exemptions from the aforesaid rules: - Presentation of assets decreased by impairment allowance is not deemed to be offsetting; - Financial assets and liabilities are offset and the net amount presented in the statement of financial position when, and only when, the Group has a legal right to offset the recognized amounts and it intends either to settle on a net basis or to realize the asset and settle the liability simultaneously; - Offsetting of income and expenses reflecting the substance of a transaction or event (e.g., foreign exchange gains and losses or gains and losses arising from financial instruments held for trading). However, such income and expenses are reported separately if, due to their volume, nature and frequency, separate disclosure is required. e) Reclassification of Financial Assets Under IAS 39 it is permitted to reclassify securities initially classified as carried at fair value through profit and loss held for trading to the category of assets available for sale. A financial asset ought to be reclassified at its fair value at the reclassification date. Upon reclassification, the effect of adjusting the asset to its fair market value up to reclassification is recorded within the income statements and after reclassification within the statement of financial position and charged or credited to the Group's equity. None of the gains or losses recognized within profit and loss should be cancelled. During 2017 the Group did not reclassify its financial assets. f) Derecognition Financial Assets The Group derecognizes a financial asset when the contractual rights to the cash flows from the financial asset expire, or when it transfers the financial asset in a transaction in which substantially all the risks and rewards of ownership of the financial asset are transferred or in which the Group neither transfers nor retains substantially all the risk and rewards of ownership and it does not retain control of the financial asset. Any interest in transferred financial assets that qualifies for derecognition that is created or retained by the Group is recognized as a separate asset or liability in the statement of financial position. On derecognition of a financial asset, the difference between the carrying amount of the asset and the sum of the consideration received (including any new asset obtained less any new liability assumed) and any cumulative gain or loss that had been recognized in other comprehensive income is recognized in profit or loss. 15
18 3. SUMMARY OF SIGNIFICANT ACCOUNTING POLICIES (Continued) 3.2. Financial Instruments (Continued) f) Derecognition (Continued) Financial Liabilities The Group derecognizes a financial liability when its contractual obligations are discharged or cancelled or have expired. g) Impairment of Financial Assets At each reporting date the Group assesses whether there is objective evidence that financial assets not carried at fair value through profit or loss are impaired. A financial asset or a group of financial assets are impaired when objective evidence demonstrates that (a) loss event(s) has(ve) occurred after the initial recognition of the asset, and that the loss event has an impact on the future cash flows on the asset that can be estimated reliably. The most common objective evidence of impairment includes the following: significant financial difficulties of the client or issuer (deterioration in key performance indicators), breach of contract in terms of default or delinquency in settlement of principal and interest payment or failure to fulfill other terms and conditions, insolvency, possibility of instigating bankruptcy, liquidation or any other form of financial reorganization over the client, etc. Assessment of the existence of objective evidence of impairment is performed on and individual basis for individually significant financial assets. Assets assessed and recognized as impaired on an individual basis are not subject to collective or group-level assessment for impairment. Collective or group-level impairment assessment is performed for financial assets that are not individually significant and for impairment probably present in the portfolio, yet for which there is no objective evidence on an individual level. Group-level impairment assessment is diversified according to the criteria such as debtor type, loan type and loan maturity into subgroups with similar characteristics. If there is objective evidence of impairment of loans and receivables measured at amortized cost on an individual basis, the impairment loss is determined as the difference between the carrying value of the asset and the present value of the expected future cash flows discounted by the original effective interest rate of the financial asset. The amount of the loss is recognized within the income statement as an expense, while it is recorded on the account of balance sheet items impairment allowance in the statement of financial position or on the account of provisions for potential losses per off-balance sheet assets. When a subsequent event causes the amount of impairment loss to decrease, the decrease in impairment loss is reversed through profit or loss. If objective evidence of impairment of financial instruments available for sale is determined, the cumulative impairment loss recognized within other comprehensive income is transferred to profit and loss. The cumulative loss that is reclassified from other comprehensive income to profit or loss is the difference between the acquisition costs, net of any principal repayment and amortization, and the current fair value, less any impairment loss previously recognized in profit or loss. If, in a subsequent period, the fair value of an impaired available-for-sale debt security increases and the increase can be objectively related to an event occurring after the impairment loss was recognized in profit or loss, the impairment loss is reversed, with the amount of the reversal recognized in profit or loss. However, any subsequent recovery in the fair value of an impaired available-for-sale equity security is recognized in other comprehensive income. Impairment allowance of financial assets is made under the Procedure for Assessing Impairment of Balance Sheet Assets and Probable Losses per Off-Balance Sheet Items in accordance with IFRS/IAS, as part of the Group s acconting policy, which is described in detail in Note Receivables are written off only when all available sources of collection have been exhausted (e.g., completed bankruptcy and enforcement procedures, completed foreclosure of all available collateral, completed checkups of the client s personal property or the property of the guarantors and it has been established that they do not possess real estate properties in the territory of the Republic of Serbia), when the client is no longer able to settle the liabilities or when the proceeds from the sales of collaterals will not be sufficient for repayment of the entire exposure. 16
19 3. SUMMARY OF SIGNIFICANT ACCOUNTING POLICIES (Continued) 3.2. Financial Instruments (Continued) g) Impairment of Financial Assets (Continued) Receivables may be written off in case of debt settlement agreement executed with the client/guarantor or mortgage debtor if it is concluded that the terms of such an agreement ensure better collection of receivables than the sales of property, if any. In such cases the Bank may agree on the write-off of the portion of the receivables remaining after debt settlement under the relevant debt settlement agreement. Write-off of irrecoverable receivables is made based on the court ruling or the relevant decision of the competent Bank s body in accordance with the Rules on the Decision Making Levels, when there is no possibility of collection and when all the collaterals have been activated, or in case of debt settlement under the relevant debt settlement agreement. The Group writes off the gross carrying value of a financial asset if there are no reasonable expectations of its collection or full or partial recovery of the asset s cash flows. Write-off is an event resulting in derecognition. The Group s internal bylaws provide more detailed definitions of criteria and conditions for write-off of receivables, in accordance with the regulations prevailing in the Republic of Serbia, current banking industry and the Group s practices and OTP Group s rules. In accordance with the regulations effective in the Republic of Serbia, the Group makes partial write-off in line with OTP Group s rules. The Group s internal bylaws provide more detailed definitions of the partial write-off procedures. Corporate and retail loans and receivables meeting the criteria for write-off may be subject to: Accounting write-off and transfer to the off-balance sheet items; and Debt release. The accounting write-off entails write-off and transfer of uncollected receivable to the Bank's off-balance sheet items and derecognition of loan and receivables or part thereof from the Group's statement of financial position. The transfer to the Bank's off-balance sheet items means that the Group will continue with collection activities. In such cases, the Bank also defines the tax treatment of the accounting writeoff if it has not been previously considered. Direct accounting write-off is made if the impairment allowance amounts to 100% of the balance sheet exposure of the loans and receivables. Debt release represents derecognition from the Group's off-balance sheet items in the event that all collection sources have been exhausted and the receivables cannot be collected in any manner whatsoever, i.e., they are regarded as irrecoverable. Loans and receivables and the relating impairment allowances are fully derecognized (written off) when a financial assets are deemed irrecoverable Cash and Balances Held with the Central Bank Cash and balances held with the central bank include cash on hand in local and in foreign currencies, and balances on the current accounts held with the National Bank of Serbia, including the obligatory RSD and foreign currency reserves. This item also includes gold and other precious metals initially measured at cost and subsequently carried at their market value. The market value is determined based on the price of precious metals quoted on the global market. The increase in the market value is recognized as income while the decrease is included in expenses on the income statement. Cash and cash equivalents as presented in the statement of the cash flows include cash on hand, balances on the current accounts held with the National Bank of Serbia, gold and other precious metal and funds held on the foreign currency accounts (Note 45). 17
20 3. SUMMARY OF SIGNIFICANT ACCOUNTING POLICIES (Continued) 3.4. Financial Assets Carried at Fair value through Profit and Loss This category comprises financial assets held for trading and financial assets carried at fair value through profit and loss. Upon initial recognition, no financial assets were classified into the category of financial assets carried at fair value through profit and loss. Financial assets held for trading are those securities held by the Group for the purpose of their sale with the objective of generating a profit from short-term fluctuations in their market prices. The Group uses the settlement date calculation upon recording transactions of purchasing securities held for trading. Transaction costs are not included in the value thereof but presented within the expenses of the period. Following the trading date, when the transaction is settled (settlement date), the resulting financial assets shall be recognized within the statement of financial position at market value of the consideration paid for acquisition of securities increased by the changes in the market value of the contract arisen since the trading date. Market value is determined based on the valuation techniques, fair value hierarchies and inputs of the certain fair value hierarchy levels in accordance with the provisions of the relevant IFRS/IAS. As of the reporting date, the Group had only derivatives held for trading in its portfolio. The Group initially recognizes financial derivatives at the contractually agreed value (cost) within off-balance sheet items. The cost of a financial derivative represents fair value of the consideration paid or received, with each adjustment to the market value at the reporting date recorded within the statement of financial position and profit and loss. Derivatives held for trading include currency swaps (Note 44) Financial Assets Available for Sale Financial assets available for sale are those non-derivative financial assets that are designated as available for sale or are not classified as: loans and receivables, investments held to maturity or financial assets at fair value through profit and loss. Available-for-sale financial assets are those intended to be held for an indefinite period of time, which may be sold in response to needs for liquidity or changes in interest rates, exchange rates or equity prices. Unquoted equity instruments (shares) whose fair value cannot be reliably measured are stated at cost. All other available-for-sale financial assets are measured at fair market value. Market value is determined based on the valuation techniques, fair value hierarchies and inputs of the certain fair value hierarchy levels in accordance with the provisions of the relevant IFRS/IAS. Interest income from securities available for sale is recognized in profit or loss using the effective interest method. Dividend income from securities available for sale is recognized in profit or loss when the Group becomes entitled to the dividend. Unrealized gains and losses arising from changes in the market value of available-for sale investments are stated as reserves within equity until such a financial asset is sold, collected or otherwise disposed of or until it is determined to have suffered impairment. Upon sales derecognition of these securities adequate amounts of previously formed revaluation reserves are stated in the income statement as net gains or losses on securities. Impairment allowance of financial assets available for sale is made under the Group's accounting policy described in detail in Note 3.2 (g) and defined in the Procedure for Assessing Impairment of Balance Sheet Assets and Probable Losses per Off-Balance Sheet Items in accordance with IFRS/IAS Financial Assets Held to Maturity Financial assets held to maturity are non-derivative financial assets with fixed or determinable payments and fixed maturity that the Group has the positive intention and the ability to hold to maturity. 18
21 3. SUMMARY OF SIGNIFICANT ACCOUNTING POLICIES (Continued) 3.6. Financial Assets Held to Maturity Held-to-maturity instruments are carried at amortized cost using the effective interest method less any impairment losses assessed. The amortized cost is calculated taking into account all discounts or premiums earned upon the purchase over the maturity period. Interest accrued as of the balance sheet date is credited to income in the profit and loss account using the effective interest method. Any sale prior to maturity as a change of the Group's intention or ability to hold a significant portion of held-to-maturity assets to maturity requires reclassification of the entire category of held-to-maturity instruments to financial assets available for sale for at least two years. Decision on the sale prior to maturity of the securities originally classified as held to maturity is made by the Bank s Executive Board. Impairment allowance of financial assets measured at amortized cost is made when their recoverability is no longer certain under the Group's accounting policy described in detail in Note 3.2 (g) and defined in the Procedure for Assessing Impairment of Balance Sheet Assets and Probable Losses per Off-Balance Sheet Items in accordance with IFRS/IAS Loans and Receivables Loans and receivables are non-derivative financial assets with fixed or determinable payment that are not quoted on an active market. Loans originated by the Group are recognized within the statement of financial position upon the transfer of loan funds to the borrower. Loans are initially recorded at the price representing the market value of the cash funds disbursed as loans, including all transaction costs; loans are subsequently measured at amortized cost using effective interest method. Impairment allowance of financial assets measured at amortized cost is made when their recoverability is no longer certain under the Group's accounting policy described in detail in Note 3.2 (g) and defined in the Procedure for Assessing Impairment of Balance Sheet Assets and Probable Losses per Off-Balance Sheet Items in accordance with IFRS/IAS Derivatives Held as Hedges against Risks In its loan portfolio the Group has loans linked to the retail price index (officially published) contracted and approved in prior periods. Income and expenses arising from such loans are recorded as gains and losses on hedges against risks (Note 7). Such retail price index-linking of loans represents embedded derivatives closely related to the host contracts, which are recorded separately from the host contracts as derivatives held as hedges against risks Investments in Subsidiaries Investments in the Group s subsidiaries are recorded in the Group's financial statements at cost less impairment, if any. The Group recognizes income from the investment only if the subsidiary has distributed profit, i.e. if the subsidiary has enacted a decision on profit distribution. Such income is recorded within the income statement. Investments in subsidiaries are immaterial from the viewpoint of the consolidated financial statements of the Group (Note 25) Intangible Assets, Property, Plant and Equipment The Group s property, plant and equipment and intangible assets are recognized at cost (historical cost) less any accumulated depreciation and amortization and impairment. Such items are subsequently carried at cost less any accumulated depreciation and amortization and impairment losses. Expenditures representing intangible assets for periods of over a year are recognized as intangible assets within the statement of financial position, whereas expenditures over periods of less than a year are stated as expenses of the current period. Intangible assets are amortized on a straight-line basis over the period of 5 years, except for the assets with contractually defined period of use, when they are amortized over the periods stipulated by the relevant contracts. 19
22 3. SUMMARY OF SIGNIFICANT ACCOUNTING POLICIES (Continued) Intangible Assets, Property, Plant and Equipment (Continued) Depreciation of property, plant and equipment is calculated on a straight-line basis at the following annual rates in order to write off the cost of assets over their estimated useful lives: Buildings 1% 1.32% Computers 20% Calculators, typewriters and money handling machines 15.5% Passenger vehicles 15.5% Communications equipment 10% Heating equipment 16.5% Copying equipment 14.3% Furniture 12.5% IT equipment 10 20% Mobile phones 33.33% Other equipment 11-20% Intangible assets 0 50% In accordance with the relevant Leasehold improvements lease agreement terms Useful lives of assets are reviewed and adjusted, as appropriate, at each reporting date. Changes in the estimated useful lives of assets are accounted for as changes in the accounting estimates. Gains or losses arising on retirement or disposal of items of intangible assets, property, plant and equipment are credited or charged to the other operating income/expenses within the income statement Intangible assets, property, plant and equipment are periodically reviewed in order to determine indicators of impairment, if any Investment Property The Group s investment property is property held to earn rental income and/or for capital appreciation. An investment property item is measured at its market fair value, with all movements in the market value recorded in the income statement. The Group's investment property is not depreciated Non-Current Assets Held for Sale In accordance with IFRS 5 Non-Current Assets held for Sale and Discontinued Operations the Group classifies a non-current asset as an asset held for sale if its carrying value can be recovered primarily through a sale transaction rather than permanent use. Assets classified as non-current assets held for sale must available for immediate sale in their current condition and the sale must be highly probable. Upon reclassification of a portion of assets into non-current assets held for sale, assets are measured at the lower of their carrying value and fair value less costs to sell. If the carrying value is lower, the asset is stated at its carrying value whereas in the case of the lower fair value, revaluation surplus accrued for that particular asset is reversed, and the amount in excess of such surplus is charged to expenses of the given period as impairment of assets. Impairment losses are transferred to losses on the sale in case such an asset is reclassified into the category of assets held for sale and sold in the same year. In case of reclassification from investment property carried at fair value, the rules of measurement need not be applied. In order to reclassify and asset from investment property to non-current assets held for sale, not only a relevant decision on the sale is to be made but also the capital expenditure of reclassification of such an asset. Non-current assets held for sale are not depreciated Assets Acquired in Lieu of Debt Collection and Held for Sale Tangible assets received/acquired in lieu of debt collection are classified as assets held for sale and presented within the line item of other assets. Assets held for sale are measured at the lower of cost and net realizable value in accordance with IAS 2 Inventories. 20
23 3. SUMMARY OF SIGNIFICANT ACCOUNTING POLICIES (Continued) Finance Lease Long-term finance lease investments are stated in the amount of net investments in the lease. Finance income, i.e., interest income is recognized based on a pattern reflecting a constant periodic rate of return on the lessor s net investment in the finance lease. Based on the existing indication that the long-term finance lease investments may have suffered impairment (finance lease payments over 60 days past due), the long-term investments are impaired on an individual basis, per each and every lessee. Impairment allowance of the long-term finance lease investments is made taking into account the appraised value of the assets leased. The Leasing Company s management assesses the fair values of assets leased considering information from various sources, including: - Current active market prices for identical to or assets with characteristics similar to the assets leased; and - Recently achieved prices for assets with characteristics identical or similar to those of the assets leased, adjusted in such a manner that they reflect changes in the economic conditions since the date of the transactions performed at those prices Borrowings and Due Deposits Liabilities arising from borrowings and due deposits are recognized within the statement of financial position when the respective funds are received. Upon initial recognition, borrowings and deposits are measured at fair value less directly attributable transaction costs. Subsequent to initial recognition, liabilities per borrowings and deposits are measured at amortized cost by applying the effective interest method. Foreign currency deposits are stated in RSD equivalent using the middle exchange rates effective as of the reporting date Provisions, Contingent Liabilities and Contingent Assets Equity Provisions are recognized if, as a result of a past event, the Group has a present legal or constructive obligation that can be estimated reliably, and it is probable that an outflow of economic benefits will be required to settle the obligation. Contingent liabilities are not recognized in the consolidated financial statements. Contingent liabilities are disclosed in the notes to the consolidated financial statements (Note 43), unless the probability of an outflow of resources containing economic benefits is very remote. Contingent assets are not recognized in the financial statements. Contingent assets are disclosed in the notes to the financial statements, when an inflow of economic benefits is probable. The Group's equity is comprised of: issued (share) capital, share issue premium, reserves, retained earnings and current year s profit. The Group's share capital is formed from the monetary contributions made by the Bank's founders. For funds invested, shareholders receive a proportionate number of shares or receipts as defined in the Law on the Capital Market (RS Official Gazette No. 31/11 and 112/15). Shareholders cannot withdraw funds invested in the Group s share capital. The Group uses capital to perform banking operations and cover operating risks. The structure of and changes in the Group's equity are disclosed in Note Financial Guarantees Financial guarantee represent contracts whereby the Group is obligated to make the designated payment to the guarantee holder for the loss incurred due to the designated debtor s failure to make the relevant payment in timely manner in accordance with the debt instrument terms. Financial guarantees are presented under contingent liabilities within off-balance sheet items (Note 45). 21
24 3. SUMMARY OF SIGNIFICANT ACCOUNTING POLICIES (Continued) Managed Funds The Group manages funds on behalf of and for the account of third parties and charges fees for these services. These items are not included in the Group s statement of financial position and are presented within off-balance sheet items (Note 45) Income and Expense Recognition (a) Interest Income and Expenses Interest income and expenses are recognized in the income statement for all interest-bearing financial instruments following the effective interest method. The effective interest rate is the rate that precisely discounts the estimated future cash disbursement or payment through the expected duration of the financial instrument or, where appropriate, a shorter period, on the net carrying value of financial assets or financial liabilities. Interest income and expenses are recorded in the Group s income statement in the period to which they belong by applying the matching principle and following the requirements delineated in the agreement signed between a customer and the Group members. Loan origination fees, as part of the effective interest rate, are credited to profit and loss account as interest income, i.e., as part of the effective return on loans disbursed proportionately to the past period of loan usage. Interest income from performing and risk-free loans whose collection is certain is fully recognized. Interest income from impaired loans and receivables is recognized and calculated based on the net amounts of loans using the effective interest method. The Group continues to calculate the interest on such loans and receivables for full records of total interest receivables but interest calculated in this manner does not affect interest income as it is recorded within the Group s off-balance sheet items. Penalty or default interest income is recognized when such interest is collected. (b) Fee and Commission Income Fee and commission income arise from banking services (payment transactions, issuance of guaranties and other sureties, letters of credit, purchase and sale of foreign currencies and other banking services) when such services are invoiced and rendered. Fees and commission charged for guarantees, sureties and letters of credit issued are deferred and recognized as income proportionately over their maturity periods. Fee and commission income and expenses that are integral part of the effective interest rate of a financial asset or liability are recognized within interest income and expenses. (c) Net Gains/(Losses) on the Financial Assets Held for Trading Net gains/(losses) on the financial assets held for trading comprise all gains and losses arising on the changes in fair values of derivatives held for trading. (d) Net Gains/(Losses) on Hedges against Risks Net gains/(losses) on the hedges against risks include all gains and losses on changes in fair values of derivatives designated as risk hedging instruments. (e) Dividend Income Dividend income from investments in shares of and equity interest held other legal entities is recognized when the Group s entitlement to dividend receipt is established. 22
25 3. SUMMARY OF SIGNIFICANT ACCOUNTING POLICIES (Continued) Taxes and Contributions (a) Current Income Tax Current income tax represents an amount that is calculated by applying the prescribed income tax rate of 15% (2016: 15%) to the taxable base comprised of the taxable income and capital gains. Taxable income includes the profit shown in the statutory statement of income, as adjusted for certain permanent and temporary differences that are specifically defined under statutory tax rules. Current income tax is calculated and paid in accordance with the Corporate Income Tax Law and other relevant fiscal regulations prevailing in the Republic of Serbia. The monthly advance income tax payment is paid on monthly basis while the adjustment of the sum of advance payments is made at the year-end, i.e. upon submission of the tax statement and the annual income tax return to the tax authorities for advance/final assignment of the corporate income tax. (b) Indirect Taxes and Contributions Indirect taxes and contributions include property taxes, value added tax, payroll taxes and contributions and various other taxes and contributions payable pursuant to the effective republic and local tax regulations. These taxes and contributions are included in profit and loss within operating expenses and staff costs. VAT may be presented within certain statement of financial position items if relating to procurements that do not represent expenses but certain statement of financial position items according to IAS. (c) Deferred Taxes Deferred income taxes are provided for temporary differences arising between the tax bases of assets and liabilities and their carrying values in the Group's financial statements in accordance with IAS 12 Income Taxes. Deferred tax liabilities are recognized for all taxable temporary differences as at the reporting date between the tax bases of assets and liabilities and their carrying values used for financial reporting purposes, which will result in taxable amounts in the future periods. Deferred tax assets are income tax amounts recoverable in the future periods which pertain to all deductible temporary differences and all unused tax credits and losses available for carryforward. Deferred tax assets and liabilities are determined at the tax rate expected to be applied in the period of the relevant asset realization/liability settlement, based on the currently enacted or tax rates expected to be enacted up to the balance sheet date. As at, deferred tax assets and liabilities were provided at the rate of 15% (2016: 15%). In 2017 the Group recognized deferred tax assets based on the temporary differences between the taxpurpose and financial reporting purpose depreciation and amortization of fixed assets, provisions for retirement benefits calculated in accordance with IAS 19 Employee Benefits, impairment of assets, unpaid public duties payable and provisions for litigations. The Group did not recognize deferred tax assets based on the stated tax losses and unused tax credit in accordance with IAS 12 paragraf 24 Income taxes Employee Benefits The Group does not have defined benefit plans or share-based remuneration options and consequently had no liabilities recognized in this respect as of Key Accounting Estimates and Assumptions (1) Impairment of Financial Assets Assessment of the impairment losses on the Group members credit risk exposed portfolios is the most significant source of estimate uncertainty. 23
26 3. SUMMARY OF SIGNIFICANT ACCOUNTING POLICIES (Continued) Key Accounting Estimates and Assumptions (Continued) (1) Impairment of Financial Assets (Continued) At each reporting date the Group assesses whether there is objective evidence that a financial asset or a group of financial assets has been impaired. A financial asset or a group of financial assets are impaired when objective evidence demonstrates that a loss event has occurred after the initial recognition of the assets, and that the loss event has an impact on the future cash flows of the financial assets that can be estimated reliably. All individually significant financial assets are assessed for impairment on an individual level. Collective or group-level assessment of imapirment is made for financial assets that are not individually significant and for impairment probably present in the portfolio but no objective evidence of impairment on an individual level is yet identifiable. Collective or group-level assessment for impairment is diversified according to the criteria such as borrower type, loan/receivable type and maturity, similar characteristics sub-groups, etc. (2) Fair Value Fair value of the financial instruments traded in an active market is based on quoted market prices at the reporting date. Fair value of the financial instruments that are not quoted in an active market is determined using certain valuation techniques, which entail using judgement in fair value assessment. Valuation models reflect the current market conditions at the fair value measurement date and need not represent the market conditions prevailing before or after the measurement date. Therefore, valuation techniques are periodically reviewed so as to adequately reflect the market conditions. Methods, assumptions and valuation techniques used in determining fair value of the Group s financial instruments are explained in detail in Note Accounting for Business Combinations Each of the Group's business combinations is accounted for using the acquisition method. Application of the acquisition method requires: a) identification of the acquirer; b) determination of the acquisition date; c) recognition and measurement of identifiable assets and liabilities assumed and any non-controlling interest held in the acquired entity; and d) recognition and measurement of goodwill or bargain purchase gains. The acquisition date is the date on which the acquirer gains control over the acquired entity. Goodwill, representing a residual acquisition-relating cost after gaining control over the acquired entity against the fair value of the acquired assets and assumed liabilities and contingent liabilities, is recognized as an intangible asset at cost less accumulated impairment in the consolidated statement of the financial position. Goodwill arising on a business combination is an asset representing future economic benefits arising from other assets acquired in the business combination that are not individually identifiable and cannot be recognized separately. Future economic benefits may result from the synergies of the acquired identifiable assets or assets that individually do not qualify for recognition in the financial statements. Goodwill recognized in a business combination is periodically assessed for indications of impairment, if any. A bargain purchase gain ( negative goodwill ) is recognized in the consolidated income statements within other income if the net value of the identifiable assets acquired and liabilities assumed exceeds the consideration transferred at the acquisition date. 24
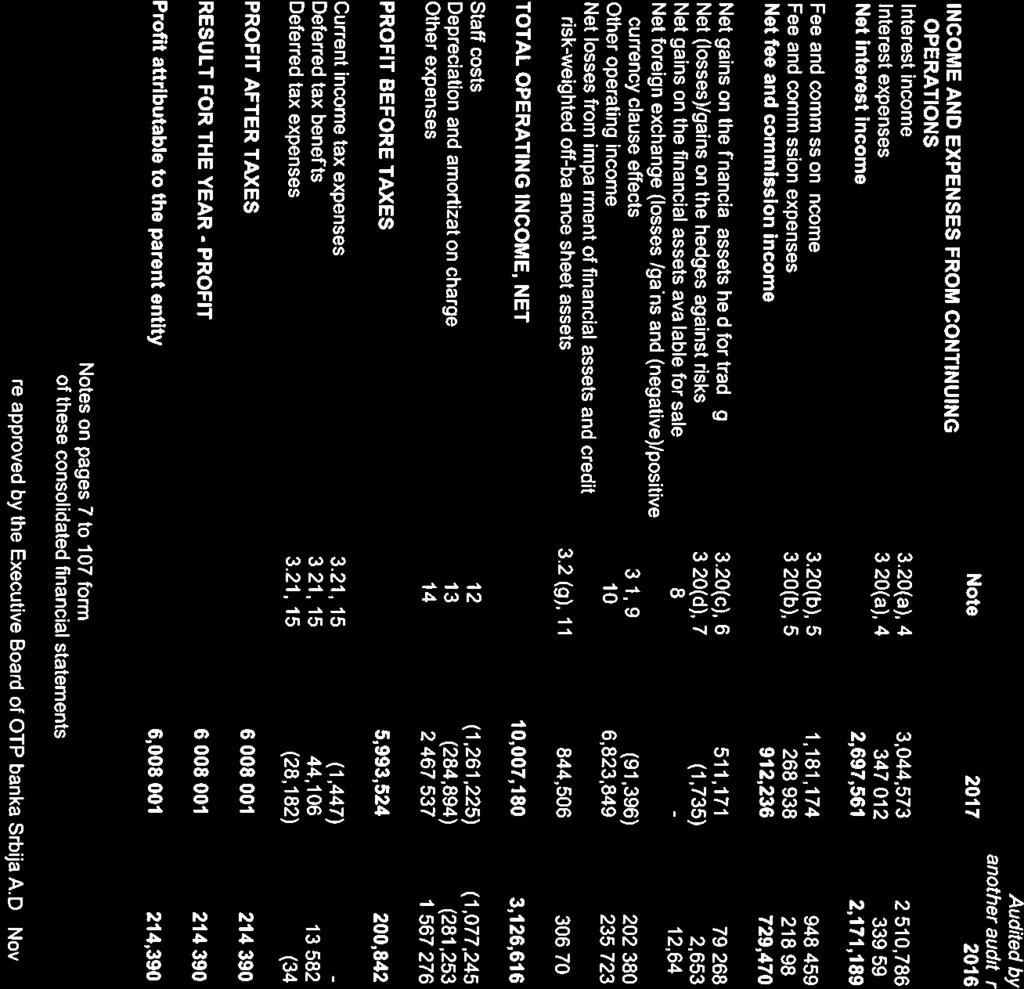
27 4. INTEREST INCOME AND EXPENSES Year Ended Interest income from: Cash and balances held with the central bank 77,003 90,502 Financial assets available for sale 181, ,653 Financial assets held to maturity 6,007 6,190 Loans and receivables due from banks and other financial institutions 58,953 86,636 Loans and receivables due from customers 2,691,746 2,182,522 Other assets 29,832 8,283 Total interest income 3,044,573 2,510,786 Interest expenses from Cash and balances held with the central bank (44) (57) Deposits and other liabilities due to banks, other financial institutions and the central bank (69,979) (37,194) Deposits and other liabilities due to customers (236,741) (262,267) Foreign currency overnight deposits (1,798) (224) Subordinated liabilities (36,661) (38,219) Other liabilities (1,789) (1,636) Total interest expenses (347,012) (339,597) Net interest income 2,697,561 2,171,189 Interest expenses from other liabilities of RSD 1,636 thousand mainly relate to dividends per cumulative preference shares calculated for the year The following tables present data on the calculated and collected interest income: Interest income Collected interests Interest income from impaired receivables Collected interest on impaired receivables Per customer segment Retail loans and receivables Housing loans 235, , ,716 95,020 Consumer and cash loans 1,182, , , ,336 Transaction accounts and credit cards 176, ,227 64,485 51,923 Other receivables 51,808 35,000 13,970 9,600 Corporate loans and receivables Large entities 495, , , ,026 Small and medium-sized entities 406, , ,066 82,497 Micro entities and entrepreneurs 117,139 76,860 62,638 36,867 Agricultural estates, farmers 92,508 58,445 22,027 18,565 Public companies 101,690 83,866 16,587 15,030 Receivables from other customers 184,933 20,099 16,363 14,809 Per receivable category Performing 2,684,426 2,227, , ,737 of which restructured loans 17,596 16,518 12,148 11,196 Non-performing 360, , , ,936 of which restructured loans 181, , , ,521 Total for ,044,573 2,505, , ,673 25
28 4. INTEREST INCOME AND EXPENSES (Contiued) Interest income Collected interests Interest income from impaired receivables Collected interest on impaired receivables Per customer segment Retail loans and receivables Housing loans 190, ,310 34,812 17,234 Consumer and cash loans 849, ,174 46,797 56,844 Transaction accounts and credit cards 162, ,025 19,299 20,989 Other receivables 32,341 29,051 11,746 11,308 Corporate loans and receivables Large entities 404, ,120 22,356 29,044 Small and medium-sized entities 302, ,481 76,760 19,294 Micro entities and entrepreneurs 120,367 49,184 66,446 16,942 Agricultural estates, farmers 71,736 48,691 5,874 4,108 Public companies 217, ,911 22,534 22,377 Receivables from other customers 158,543 3,101 11, Per receivable category Performing 2,179,850 1,808,954 35,980 29,522 of which restructured loans 35,070 35, Non-performing 330, , , ,983 of which restructured loans 123,247 56, ,614 37,177 Total for ,510,786 2,014, , ,505 Interest income from impaired loans and receivables (unwinding) amounted to RSD 97,704 thousand in 2017 (2016: RSD 145,942 thousand). 5. FEE AND COMMISSION INCOME AND EXPENSES Year Ended Fee and commission income from - From lending operations 1, Current account maintenance 278, ,073 - Payment card transactions 291, ,050 - Payment transfer operations 390, ,031 - Electronic banking 49,200 7,089 - Guarantees issued 59,033 47,926 - Other fees and commissions 109,597 66,290 Total 1,181, ,459 Fee and commission expenses - Payment transfer operations (50,565) (27,598) - Payment card transactions (163,008) (148,901) - Per foreign guarantees (13) - - Other fees and commissions (55,352) (42,490) Total (268,938) (218,989) Net fee and commission income 912, , NET GAINS ON FINANCIAL ASSETS HELD FOR TRADING Year Ended Gains on the fair value changes of derivatives held for trading 1,370, ,548 Losses on the fair value changes of derivatives held for trading (859,149) (671,280) Net gains on the financial assets held for trading 511,171 79,268 26
29 7. NET (LOSSES)/GAINS ON THE HEDGES AGAINST RISKS Year Ended Gains on the valuation of loans and receivables changes in retail prices 4 9 Gains on the valuation of loans and receivables gains on changes in the value of gold and other precious metals - 2,648 Losses on the valuation of loans and receivables changes in retail prices - (4) Losses on the valuation of loans and receivables losses on changes in the value of gold and other precious metals (1,739) - Net (losses)/gains on the hedges against risks (1,735) 2, NET GAINS ON THE FINANCIAL ASSETS AVAILABLE FOR SALE Year Ended Gains on the sale of securities and other financial assets available for sale - 12,640 Net gains on the financial assets available for sale - 12, NET FOREIGN EXCHANGE (LOSSES)/GAINS AND (NEGATIVE)/POSITIVE CURRENCY CLAUSE EFFECTS Year Ended Foreign exchange gains Unrealized foreign exchange gains 2,400,545 1,030,027 Realized foreign exchange gains 748, ,231 On valuation of loans, receivables and liabilities 984, ,277 Total foreign exchange gains 4,133,890 2,130,535 Foreign exchange losses Unrealized foreign exchange losses (1,335,887) (1,345,608) Realized foreign exchange losses (440,404) (157,247) On valuation of loans, receivables and liabilities (2,448,995) (425,300) Total foreign exchange losses (4,225,286) (1,928,155) Net foreign exchange (losses)/gains and (negative)/positive currency clause effects (91,396) 202, OTHER OPERATING INCOME Year Ended Gains on the sale of other receivables and investments ,117 Other income from operations 14,666 11,301 Reversal of unreleased provisions for liabilities (litigations) 1,477 73,396 Gains on the sale of property, plant, equipment and intangible assets 3,669 16,226 Write-off of liabilities 4,258 66,439 Dividend income and profit sharing 1, Surpluses 4,755 2,325 Bargain purchase gain 6,659,138 - Payment card operations 6,241 2,454 Rental income 50,430 - Collected receivables previously provided for 25,023 - Other income 52,761 39,616 Total other operating income 6,823, ,723 27
30 10. OTHER OPERATING INCOME (Continued) As of the acquisition date, the Group determined and recognized a gain from bargain purchase as the difference between the consideration transferred and the net amount of identifiable acquired assets and liabilities assumed in accordance with IFRS 3 at the acquisition date (Note 49). 11. NET LOSSES FROM IMPAIRMENT OF FINANCIAL ASSETS AND CREDIT RISK-WEIGHTED OFF-BALANCE SHEET ITEMS Year Ended Impairment losses on loans and receivables (Note 32) (2,914,117) (2,454,159) Provisions for off-balance sheet items (69,988) (58,673) Write-off of irrecoverable receivables (1,184) (2,171) (2,985,289) (2,515,003) Reversal of impairment losses on loans and receivables (Note 32) 2,034,358 2,063,249 Reversal of provisions for off-balance sheet items 94, ,993 Collected receivables previously written off 12,114 13,054 2,140,783 2,208,296 Net losses from impairment of financial assets and credit risk-weighted off-balance sheet items (844,506) (306,707) 12. STAFF COSTS Year Ended Net salaries 934, ,851 Net salary compensations 15,648 3,432 Taxes on salaries and compensations 102,743 84,667 Contributions to salaries and compensations 206, ,195 Considerations to temporary and seasonal employees 1,157 1,125 Other staff costs 25,424 16,113 Provisions for retirement and other employee benefits 2,736 10,132 Reversal of provisions for unused employee annual leaves, provisions for retirement, pension and other employee benfits (28,034) (270) Total staff costs 1,261,225 1,077,245 The largest portion of other staff costs in 2017 refers to the provisions for employee benefits made in accordance with IAS 19 in the amount of RSD 14,098 thousand in the commenced process of integration with Vojvođanska banka a.d., Novi Sad, which is a member of OTP Group. 13. DEPRECIATION AND AMORTIZATION CHARGE Year Ended Depreciation charge property owned by the Group 29,274 15,560 Depreciation charge leasehold improvements 42,208 40,336 Amortization charge intangible assets 27,818 83,516 Depreciation charge computer equipment 59,824 52,902 Depreciation charge office equipment and devices 16,699 17,342 Depreciation charge other equipment 108,531 71,597 Depreciation charge leased equipment Depreciation charge investment property Total depreciation and amortization charge 284, ,253 28
31 14. OTHER EXPENSES Year Ended Losses on the sale of other loans and investments Cost of materials 104, ,124 Cost of production services 699, ,368 Non-material costs 742, ,158 Taxes payable 119,093 73,113 Contributions payable 208, ,588 Other costs and charges 22,739 26,317 Provisioning charge litigation provisions (Note 38) 98,664 91,789 Provisioning charge restructuring (Note 38) 403,967 - Losses on impairment of assets acquired in lieu of debt collection 20,464 - Losses on the sales of property, plant, equipment and intangible assets 8, Losses on retirement, disposal and write-off of property, plant, equipment and intangible assets 12 7 Shortages and damages 671 1,212 Other expenses 37,967 12,728 Losses on impairment of building properties - 1,594 Total other expenses 2,467,537 1,567, INCOME TAXES a) Components of Income Taxes Year Ended Current income tax expense (1,447) - Deferred tax benefits 44,106 13,582 Deferred tax expenses (28,182) (34) Total tax benefits 14,477 13,548 b) Numerical Reconciliation between the Total Tax Expense Stated in the Income Statement and the Profit before Taxes Multiplied by the Applicable Tax Rate Year Ended Profit before tax 5,993, ,842 Income tax at the statutory tax rate of 15% 899,029 30,126 Effects of tax expenses and benefits not recognized for tax purposes 34,398 (2,375) Capital losses utilized (708) (2,912) Business combination effect (998,871) - Tax losses carried forward 76, Utilization of tax loss carryforwards - (33,160) Other 3,964 21,085 Income tax benefits 14,477 13,548 29
32 15. INCOME TAXES (Continued) c) Structure of Deferred Tax Assets/(Liabilities) Year Ended Deferred tax assets Deferred tax assets per provisions for litigations 50,812 16,010 Temporary differences between the net book values of propery, equipment, intangible assets and investment property calculated for accounting and for tax purposes 7,483 (2,071) Per provisions for employee benefits in accordance with IAS 19 73,491 1,273 Per impairment of financial and non-financial assets 5,284 8,324 Temporary differences arising from unpaid taxes Unused tax losses 192,820 - Deferred tax assets per reserves within equity in respect of actuarial losses 1,487 - Total deferred tax assets at 331,433 24,340 Year Ended Deferred tax liabilities Temporary differences between the net book values of propery, equipment, intangible assets and investment property calculated for accounting and for tax purposes (176,029) (71) Deferred tax liabilities per reserves within equity in respect of actuarial losses (5,837) - Deferred tax liabilities per revaluation reserves from changes in the fair value of financial assets available for sale (34,992) - Deferred tax liabilities per business combination effects and harmonization with the Group s accounting policies (469,955) - Total deferred tax liabilities at (686,813) (71) d) Movements on Deferred Tax Assets/(Liabilities) Movements on Deferred Tax Assets Year Ended Balance of deferred tax assets at January 1 24,340 10,758 Deferred tax assets arising from the business combination effects 264,611 - Deferred tax benefits 44,106 13,582 Other movements (1,624) - Balance of deferred tax assets at December ,433 24,340 Movements on Deferred Tax Liabilities Year Ended Balance of deferred tax liabilities at January Deferred tax liabilities arising from the business combination effects 655,834 - Deferred tax expenses 28, Deferred tax liabilities presented in the statement of other comprehensive income 4,350 - Other movements (1,624) - Balance of deferred tax liabilities at December ,
33 15. INCOME TAXES (Continued) e) Unused Tax Losses and Capital Losses at the Consolidated Level Year of tax loss inception Tax loss amount Tax loss amount utilized Year of utilization Remaining tax loss amount Year of expiry ,384 11, , ,984, , , 2014, 2015, ,201, ,636, ,636, , , , , , , ,003, ,003, Total 10,411, ,727 9,618,163 Year of capital loss inception Capital loss amount Capital loss amount utilized Year of utilization Remaining capital loss amount Year of expiry ,976 7, ,274 16, , , , , Total 29,771 24,134 5,637 31
34 16. CLASSIFICATION OF FINANCIAL ASSETS AND FINANCIAL LIABILITIES The table below presents reconciliation of the statement of financial position items and categories of the financial instruments as of : Held for trading Available for sale Held to maturity Loans and receivables Other instruments measured at amortized cost Total Cash and balances held with the central bank ,294,266-31,294,266 Pledged financial assets , ,888 Financial assets at fair value through profit and loss, held for trading 178, ,303 Financial assets available for sale - 19,797, ,797,937 Financial assets held to maturity , ,944 Loans and receivables due from od banks and other financial institutions ,672,880-10,672,880 Loans and receivable due from customers ,731, ,731,018 Other assets ,504,849-6,504,849 Total assets as of 178,303 19,797, , ,099, ,240,085 Financial liabilities at fair value through profit and loss, held for trading 50, ,687 Deposits and other liabilities due to banks, other financial liabilities and the central banks ,024,471 20,024,471 Deposits and other liabilities due to customers ,640, ,640,732 Subordinated liabilities , ,022 Other liabilities ,038,266 1,038,266 Total liabilities as of 50, ,660, ,711,178 32
35 16. CLASSIFICATION OF FINANCIAL ASSETS AND FINANCIAL LIABILITIES (Continued) The table below presents reconciliation of the statement of financial position items and categories of the financial instruments as of 2016: Held for trading Available for sale Held to maturity Loans and receivables Other instruments measured at amortized cost Total Cash and balances held with the central bank ,968,557-7,968,557 Pledged financial assets , ,849 Financial assets at fair value through profit and loss, held for trading 26, ,295 Financial assets available for sale - 2,877, ,877,871 Financial assets held to maturity , ,166 Loans and receivables due from od banks and other financial institutions ,014,703-2,014,703 Loans and receivable due from customers ,095,962-32,095,962 Receivables per financial derivatives designated as risk hedging instruments Other assets , ,222 Total assets as of ,295 2,877, ,166 42,485,984-45,596,316 Financial liabilities at fair value through profit and loss, held for trading 28, ,574 Liabilities per financial derivatives designated as risk hedging instruments Deposits and other liabilities due to banks, other financial liabilities and the central banks ,874,471 1,874,471 Deposits and other liabilities due to customers ,468,144 31,468,144 Subordinated liabilities , ,413 Other liabilities , ,912 Total liabilities as of , ,812,980 34,841,554 33
36 17. CASH AND BALANCES HELD WITH THE CENTRAL BANK In RSD Gyro account 11,184,040 2,115,706 Cash on hand 3,204, ,662 Deposited RSD liquid asset surpluses 3,124,812 1,460,101 Total cash funds in RSD 17,513,096 4,457,469 In foreign currencies Cash on hand 3,386,010 1,053,002 Other cash funds 5,523 24,320 Obligatory foreign currency reserve held with NBS 10,354,513 2,412,649 Total cash funds in foreign currencies 13,746,046 3,489,971 Gold and other precious metals 35,124 21,117 Total cash and balances held with the central bank 31,294,266 7,968,557 The obligatory RSD reserve represents the minimum RSD reserve set aside in accordance with the NBS Decision on Required Reserves of Banks with the National Bank of Serbia (RS Official Gazette, Nos. 3/11, 31/12, 57/12, 78/12, 87/12, 107/12, 62/13, 125/14, 135/14, 4/2015, 78/2015 and 102/2015). Pursuant to the aforesaid Decision, the obligatory reserve is to be calculated at the rate of 5% on the portion of the RSD base comprised of liabilities maturing within 2 years, i.e. within 730 days, and at the rate of 0% on the portion of the dinar base comprised of liabilities with maturities of over 2 years, i.e. over 730 days. The Banks within the Group meet all the criteria in accordance with the said Decision, based on the parameters reported in their standalone financial statements. The RSD base for the calculation of the obligatory reserve is the amount of average daily balance of RSD liabilities during the preceding calendar month, except RSD liabilities indexed to a currency clause as follows: - non-indexed liabilities arising from RSD deposits, borrowings, securities and other RSD liabilities to domestic legal entities and retail bank clients; - non-indexed liabilities arising from RSD deposits, borrowings and other RSD liabilities to foreign creditors. A portion of the obligatory foreign currency reserve was converted into obligatory RSD reserve at the rates of 38% and 30% for the obligatory reserves of up to and over 2 years, respectively. As at the Banks within the Group were in full compliance with the regulations of the National Bank of Serbia with regard to the calculation and allocation of the obligatory RSD reserve. The obligatory foreign currency reserve represents the minimum foreign currency reserve set aside in accordance with the NBS Decision on Required Reserves of Banks with the National Bank of Serbia (RS Official Gazette, Nos. 3/11, 31/12, 57/12, 78/12, 87/12, 107/12, 62/13, 125/14, 135/14, 4/2015, 78/2015 and 102/2015), which prescribes that banks calculate the obligatory foreign currency reserve at the following rates: - 20% on the portion of the foreign currency reserve comprised of liabilities maturing within 2 years, i.e. up to 730 days, and exceptionally at the rate of 100% on the portion of the foreign currency reserve comprised of RSD liabilities indexed to a currency clause maturing within 2 years, i.e. up to 730 days; - 13% on the portion of the foreign currency reserve comprised of liabilities with maturities of over 2 years, i.e. over 730 days, and exceptionally at the rate of 100% on the portion of the foreign currency reserve comprised of RSD liabilities indexed to a currency clause with maturities of over 2 years, i.e. over 730 days. The foreign currency base for the calculation of required reserve is the amount of average daily balance of foreign currency liabilities during the preceding calendar month and the amount of average daily balance of RSD liabilities from the preceding calendar month indexed to a currency clause as follows: - liabilities arising from deposits, borrowings, securities and other foreign currency liabilities to foreign creditors; - liabilities arising from deposits, borrowings, securities and other foreign currency liabilities to domestic legal entities and other liabilities; - foreign currency savings deposits held with other banks; 34
37 17. CASH AND BALANCES HELD WITH THE CENTRAL BANK (Continued) - indexed liabilities arising from deposits, borrowings, securities and other RSD liabilities as well as indexed RSD deposits received through transactions the banks perform on behalf of and for the account of third parties if they exceed the amounts of loans the banks disbursed from these deposits. The Group member Banks deposit the obligatory foreign currency reserve onto the foreign currency account with the National Bank of Serbia. As at the Group member Banks were in full compliance with the regulations of the National Bank of Serbia with regard to the calculation and allocation of the obligatory foreign currency reserve. In 2017 the liquid asset surpluses were deposited with the National Bank of Serbia for a period from 1 to 5 days at the interest rate equal to 2.5% p.a. at the beginning of the year. During 2017, it was decreased twice by 25 basis points each time so that from October 9, 2017 the interest rate was 2% p.a. 18. PLEDGED FINANCIAL ASSETS In foreign currency Financial assets for securitizing liability settlement 896, ,849 Total pledged financial assets 896, ,849 As of, the Group's pledged financial assets included the amount of RSD 109,027 thousand (2016: RSD 128,849 thousand) relates to the deposit placed as collateral by the Group as a member of VISA International Service Association. The deposit was placed for an unspecified period and interest-free. The Group pledged bonds issued by the Republic of Serbia classified as available for sale and amounting to RSD 787,861 thousand to securitize liabilities per deposits received from customers. The Republic of Serbia bonds were pledged for a period of 3 months. 19. FINANCIAL ASSETS AT FAIR VALUE THROUGH PROFIT AND LOSS HELD FOR TRADING Receivables per derivatives held for trading currency swap 178,303 26,295 Total financial assets at fair value through profit and loss held for trading 178,303 26, FINANCIAL ASSETS AVAILABLE FOR SALE Securities and other financial assets available for sale 20,288,687 3,367,870 Impairment allowance (490,750) (489,999) Total financial assets available for sale 19,797,937 2,877, Investments in financial assets available for sale Shares of public companies - 37,018 Shares of other financial institutions 69,352 1,075 Other corporate shares 31,830 20,607 Treasury bills and public sector bonds 19,718,437 2,876,704 Shares of other customers 468, ,389 Shares of other customers - reclassified Financial assets available for sale 20,288,687 3,367,870 Impairment allowance (490,750) (489,999) Total financial assets available for sale 19,797,937 2,877,871 35
38 21. FINANCIAL ASSETS HELD TO MATURITY Government bonds 102, ,166 Other securities held to maturity 2,174 2,174 Discounted bills of exchange 74,354 48,694 Financial assets held to maturity 179, ,034 Impairment allowance (Note 32) (15,483) (50,868) Total financial assets held to maturity 163, , LOANS AND RECEIVABLES DUE FROM BANKS AND OTHER FINANCIAL INSTITUTIONS In RSD: Loans per repo transactions 2,500,365 - Loans for working capital and liquidity maintenance 229,414 - Other RSD loans 187, ,268 Other receivables 524 1,743 Interest and fees per deposits and off-balance sheet items 1, Balance at December 31 2,919, ,076 In foreign currencies: Foreign currency accounts 5,633, ,391 Cheques 5,728 - Overnight loans and deposits 1,040,877 - Other foreign currency loans 344, ,699 Other general-purpose foreign currency deposits 1,078,713 1,518,957 Earmarked foreign currency deposits received in accordance with the regulations 4,739 4,939 Other earmarked foreign currency deposits 4,439 - Other foreign currency receivables 1,686 1,757 Interest and fees per deposits and off-balance sheet items Balance at December 31 8,114,760 2,234,897 Impairment allowance (361,302) (409,269) Total loans and receivables as at December 31 10,672,880 2,014,703 Based on the Decision on the Conditions and Manner of Implementing Open Market Operations (RS Official Gazette, Nos. 45/2011 and 34/2013), the Group member Banks invest portion of their RSD liquid asset surpluses, through reverse repo transactions conducted with the National Bank of Serbia. The subject of repo transactions are treasury bills issued by NBS. The National Bank of Serbia has the obligation to repurchase the treasury bills before their maturity, and transactions are contracted for periods of 5 to 9 days. As of 2015 the Group member Bansk had contracted repo transactions of NBS treasury bills amounting to RSD 2,500 million ( 2016: none). The total income from interest accrued per reverse repo transactions in 2017 amounted to RSD 30,599 thousand (2016: RSD 49,473 thousand), and during the year the transactions were realized at interest rates ranging from 2.54% to 2.98% p.a. (2016: from 2.52% to 3.02% p.a.). As of, other general-purpose foreign currency deposits of RSD 1,078,712 thousand were placed with domestic commercial banks and the Parent Bank, OTP Bank Hungary, for periods from 7 days to 6 months at interest rates from 0.10% to 1.25% p.a. As of, foreign currency overnight deposits of RSD 1,040,877 thousand (USD 10.5 million) were placed with the Parent Bank, OTP Bank Hungary, at an annual interest rate of 1.91%. 36
39 23. LOANS AND RECEIVABLES DUE FROM CUSTOMERS Loans and receivables due from customers breakdown per product In RSD: Loans per transaction accounts 2,493, ,300 Consumer loans 50,072 59,467 Loans for liquidity maintenance and working capital 33,867,862 11,152,195 Investment loans 10,624,012 3,863,656 Housing loans 18,545,935 5,159,275 Cash loans 33,142,137 8,088,476 Other RSD loans 11,655,479 12,126,561 Receivables from factoring 6,570 9,604 Receivables for acceptances, bills of exchange and payments per guarantees called on 482, ,223 Other loans and receivables 141,925 19,066 Interest and fees per deposits and off-balance sheet items 80,953 85,699 Balance at December ,091,147 42,126,522 In foreign currencies: Loans for payment of imported goods and services 3,226, ,417 Loans for payment of imported goods and services 410,779 - Other foreign currency loans 316,400 78,940 Other foreign currency receivables 18,459 1,657 Receivables for acceptances, bills of exchange and payments per guarantees called on 4,428 - Interest and fees per deposits and off-balance sheet items 2, Balance at December 31 3,979, ,934 Impairment allowance (7,339,204) (10,225,494) Total loans and receivables as at December ,731,018 32,095, Loans and receivables due from customers breakdown per industry Holding companies Public companies 4,993,889 2,368,063 Corporate customers 46,198,742 15,151,842 Entrepreneurs 1,131, ,258 Public sector 92, ,111 Retail customers 51,412,657 11,687,379 Non-residents 333,082 9,038 Agricultural producers 1,343,075 1,035,118 Other customers 2,225,436 1,363,153 Total loans and receivables as at December ,731,018 32,095,962 During 2017 corporate customers in the large and commercial client segment the Group approved loans for working capital, investments, current account overdrafts, etc. The major portion of the loans approved pertains to working capital loans, which was a trend from 2016 continued in Over the entire 2017 the market of the Republic of Serbia recorded decline in interest rates. The largest pressure on the level of interest rates occurred in the second half of This downward trend in interest rates pertained to all types of loans, i.e., RSD loans, RSD loans with a currency clause index and EURdenominated loans. 37
40 23. LOANS AND RECEIVABLES DUE FROM CUSTOMERS (Continued) Loans and receivables due from customers breakdown per industry (Continued) Large corporate loans approved in RSD with a currency clause index and in foreign currencies were approved at an interest rate of 2.79% per annum. The average interest rate applied to RSD loans approved to large corporate customers equaled 4.51% per annum. In the year ended retail loans were mostly approved as cash loans, current account overdrafts, credit card loans and housing loans. Long-term cash loans were approved at interest rates ranging from 6.23% to 21.47% annually, about 9.7% on the average. Current account overdrafts were approved at interest rates between 23.30% and 34.49% annually. Long-term housing loans were approved at interest rates ranging from 2.53% to 9.48% per annum. In 2017 loans to entities and entrepreneurs within SME segment were mostly approved as working capital loans (up to 2 years) and current account overdrafts (within a year). Working capital loans were disbursed at annual interest rates ranging from 2.95% to 15.5% for RSD loans, and from 2.07% to 6.95% for loans with EUR-clause index, while approved current account overdrafts were extended at interest rates between 4.6% and 21% p.a. (RSD loans). 24. RECEIVABLES PER FINANCIAL DERIVATIVES DESIGNATED AS RISK HEDGING INSTRUMENTS With contracted risk hedges retail price index Receivables per financial derivatives designated as risk hedging instruments Total receivables per financial derivatives designated as risk hedging instruments INVESTMENTS IN SUBSIDIARIES Equity investments in subsidiaries 62,488 - Impairment allowance (32,715) - Total investments in subsidiaries 29,773 - As of, through acquisition of Vojvođanska banka a.d., Novi Sad and NBG Lizing d.o.o., Beograd, the Bank also acquired an equity investment in IMOS AD ŠID of %, which is immaterial. The equity of IMOS AD ŠID as of totaled RSD 85,372 thousand, while the loss for the year ended amounted RSD 9,757 thousand INVESTMENTS IN ASSOCIATES AND JOINT VENTURES Investments in associates and joint ventures Total investments in associates and joint ventures OTP Lizing d.o.o., Beograd holds an equity interest of RSD 107 thousand in the Association of Leasing Companies in Serbia, Belgrade, initially measured at cost less any subsequent impairment. Association of Leasing Companies in Serbia, Belgrade is a business association of lessors established in 2004 through the joint equity investment of nine lease companies. OTP Lizing d.o.o., Beograd does not hold majority interest in this entity. 38
41 26. INTANGIBLE ASSETS Investments in development of intangible assets 42,264 - Licenses 236, ,683 Software 461, ,291 Investments in the model usage rights 494,981 - Intangible assets in progress 5,158 - Total intangible assets 1,240, ,974 Accumulated amortization of intangible assets (524,828) (496,608) Intangible assets, net book value as at December ,231 55, PROPERTY, PLANT AND EQUIPMENT Land 8, Buildings 7,763,282 1,287,221 Equipment 4,276,500 1,619,005 Works of art 11,412 - Equipment in progress 41,582 68,452 Vehicles acquired under finance lease Leasehold improvements 446, ,685 Total property, plant and equipment 12,548,636 3,346,502 Accumulated depreciation of property, plant and equipment (1,748,357) (1,610,564) Property, plant and equipment, net book value as at December 31 10,800,279 1,735, Movements on property, plant and equipment and intangible assets: Land and Buildings Equipment and Other Assets Equipment in Progress Intangible Assets (Note 26) Cost Balance, January 1, ,659,045 1,619,005 68, ,974 3,898,476 Cost of acquired entities 6,483,417 2,629,147 6, ,417 9,790,648 Additions 49, ,205 86,960 21, ,760 Transfers from investments in progress 45,866 74,631 (120,497) - - Disposals and retirements (12,418) (156,524) - (2,905) (171,847) Other (6,594) (9) - (1,739) (8,342) Balance, 8,218,599 4,288,455 41,582 1,240,059 13,788,695 Accumulated depreciation and amortization Balance, January 1, ,592 1,176, ,608 2,107,154 Charge for the year 69, ,753-28, ,894 Disposals and retirements (6,102) (107,113) - - (113,215) Other (5,648) (5,648) Balance, 491,763 1,256, ,828 2,273,185 Net book value as of 7,726,836 3,031,861 41, ,231 11,515,510 Total 39
42 27. PROPERTY, PLANT AND EQUIPMENT (Continued) Movements on property, plant and equipment and intangible assets (Continued): Land and Buildings Equipment and Other Assets Equipment in Progress Intangible Assets (Note 26) Cost Balance, January 1, ,711,925 1,533,177 61, ,733 3,813,921 Additions 5,532 6, ,289 46, ,093 Transfers from investments in progress 13, ,946 (162,923) 3,788 3,788 Disposals and retirements (72,389) (69,177) - (5,760) (147,326) Balance, ,659,045 1,619,005 68, ,974 3,898,476 Accumulated depreciation and amortization Balance, January 1, ,247 1,103, ,852 1,928,114 Charge for the year 55, ,841-83, ,253 Disposals and retirements (30,146) (67,902) - (5,760) (103,808) Impairment 1, ,594 Balance, ,592 1,176, ,608 2,107,154 Net book value as of ,225, ,051 68,452 55,366 1,791,322 As of, the Group had no mortgages instituted over its property and equipment to securitize repayment of borrowings. Due to incomplete Cadaster records, as of the Bank had no proper title deeds or cadastral excerpts of building properties in its possession with the total net book value of RSD 128,717 thousand. Total 28. INVESTMENT PROPERTY Cost Balance, January 1 37,328 37,067 Business combination effects 178,941 - Additions Effects of impairment determined upon appraisal (176) - Other movements (91) - Balance at December ,947 37,328 Accumulated depreciation Balance, January Charge for the year Balance at December Investment property, net book value at December ,675 37,328 Due to incomplete Cadaster records, as of the Bank had no proper title deeds or cadastral excerpts of investment properties in its possession with the total net book value of RSD 15,790 thousand. 40
43 29. DEFERRED TAX ASSETS Deferred tax assets 331,433 24,340 Deferred tax assets as at December ,433 24,340 Deferred tax amount Deferred tax assets per provisions for litigations 50,812 Temporary differences between the net book values of propery, equipment, intangible assets and investment property calculated for accounting and for tax purposes 7,483 Per provisions for employee benefits in accordance with IAS 19 73,491 Per impairment of financial and non-financial assets 5,284 Temporary differences arising from unpaid taxes 56 Unused tax losses 192,820 Deferred tax liabilities per reserves within equity in respect of actuarial losses 1,487 Total balance at 331, NON-CURRENT ASSETS HELD FOR SALE AND ASSETS FROM DISCONTINUED OPERATIONS Non-current assets held for sale 148, ,601 Non-current assets held for sale as at December , ,601 Non-current assets held for sale as of comprise the following: Building properties Area Amount Building in Novi Sad, Bulevar oslobođenja m² 18,170 Business premises, Knjaževačka bb., Niš 15.16m² 987 Residential property, Slatinski venac 5a, Vrnjačka Banja 1,346.68m² 129,299 Total: 148,456 Properties classified as non-current assets held for sale are available for immediate sale in their current condition. For the property located in Niš, the Group has been receiving advance payments and after the complete payment of the selling/purchase price, the sale of the property will be completed. The property in Novi Sad has been actively present in the market at a reasonable price in comparison to its current fair value and the Group is dedicated to this property sale plan. The sale of this property was not completed within a year from the classification as a non-current asset held for sale due to events out of the Group's control. 41
44 31. OTHER ASSETS In RSD RSD fee and commission receivables per other assets 44,949 24,859 RSD trade receivables from sales 12,662 57,081 Interest receivables per other assets Total receivables for fees, sales, and other assets 57,747 82,056 Impairment allowance (25,846) (72,852) Receivables for fees, sales, and other assets, net 31,901 9,204 Receivables per advances paid to suppliers 37,033 13,994 Receivables per advances paid for property and equipment 5,705 9,088 RSD receivables from employees 1, Receivables arising from prepaid taxes and contributions 165,495 16,281 Other RSD receivables from operations 410, ,114 Suspense and temporary accounts 393,321 (3,502) Receivables in settlement 400, ,009 Total other receivables and advances paid 1,413, ,449 Impairment allowance (177,484) (119,941) Other receivables and advances paid, net 1,236, ,508 Other investments 15,172 - Total other investments 15,172 - Impairment allowance (1) - Other investments, net 15,171 - Inventories 30, Inventories of spare parts 9 - Assets acquired in lieu of debt collection 213,923 30,461 Tools and fixtures in use 41,719 2,012 Total inventories 286,183 32,927 Impairment allowance (62,182) (2,012) Inventories, net 224,001 30,915 In foreign currencies Receivables for interest accrued on loans, deposits and other receivables in foreign currencies 2,584 - Foreign currency fee and commission receivables per other assets Receivables for interest accrued on other assets in foreign currencies Other receivables from regular operations for determining foreign currency income 6,617 6,842 Total other receivables 9,617 6,842 Impairment allowance (7,820) (6,621) Other receivables, net 1, Receivables per advances paid to suppliers 18, Receivables per advances paid for property and equipment 5,069 5,774 Foreign currency receivables from employees 2,192 2,284 Other foreign currency receivables from operations 75,044 4,430 Foreign currency suspense and temporary accounts (3,169) (11,347) Foreign currency receivables in settlement 54,713 35,795 Total other receivables and advances paid 152,137 36,990 Impairment allowance (63,564) (5,639) Other receivables and advances paid, net 88,573 31,351 RSD finance lease receivables 5,388 - Foreign currency finance lease receivables 5,478,491 - Deferred income per finance lease receivables (24,267) - Total finance lease receivables 5,459,612 - Other investments 1,721 - Total other investments 1,721 - Impairment allowance - - Other investments, net 1,721 - Deferred other RSD expenses 454, ,282 Other RSD prepayments 41,861 2,918 Deferred foreign currency interest expenses Deferred other foreign currency expenses 11,902 8,956 Other foreign currency prepayments 1, Total deferred receivables 509, ,451 Total other assets as at December 31 7,568, ,650 42
45 31. OTHER ASSETS (Continued) Movements on tangible assets acquired in lieu of debt collection Types of assets acquired in lieu of debt collection Residential property Other property Other assets Total Gross carrying value, beginning of year 18,983 7,729 3,749 30,461 Acquired during the year 172,112 1, ,794 Sold during the year (2,113) (5,508) (2,047) (9,668) Gross carrying value, end of year 193,208 14,919 5, ,923 Accumulated loss (impairment) 7,053 10,513 2,897 20,463 of which: charge for the year 7,053 10,513 2,897 20,463 Net book value at 186,155 4,406 2, ,460 Types of assets acquired in lieu of debt collection Residential property Other property Other assets Total Gross carrying value, beginning of year 15,984 6,569 3,749 26,302 Acquired during the year 2,999 1,584-4,583 Sold during the year - (424) - (424) Gross carrying value, end of year 18,983 7,729 3,749 30,461 Net book value at ,983 7,729 3,749 30,461 Due to incomplete Cadaster records, as of the Bank had no proper title deeds or cadastral excerpts of its other assets acquired in lieu of debt collection with the total net book value of RSD 43,912 thousand. Finance lease receivables 2017 Long-term finance lease receivables 3,664,079 Short-term finance lease receivables - Current portion of long-term finance lease receivables 1,751,658 - Short-term finance lease receivables 10,668 5,406,405 Matured uncollected finance lease receivables 72,086 Other finance lease receivables 5,388 Less: Deferred income for finance lease receivables (24,267) Total finance lease receivables at 5,459,612 Finance lease receivables relate to the leasing of vehicles and equipment for the periods ranging from 1 to 5 years, payable in monthly installments, at interest rates ranging between 2.99% and 6.99% annually. All investments related to finance lease are originated with a currency clause, i.e., indexed to the movements in EUR to RSD exchange rate. 43
46 32. IMPAIRMENT ALLOWANCE PER BALANCE SHEET ITEMS Impairment allowance of: - Financial assets available for sale (Note 20) 490, ,999 - Financial assets held to maturity (Note 21) 15,483 50,868 Loans and receivables due from banks and other financial institutions (Note 22) 361, ,269 - Loans and receivables due from customers (Note 23) 7,339,204 10,225,494 - Other assets (Note 31) 134, ,540 Total at December 31 8,341,648 11,379,170 Impairment allowance per customer segment Loans and receivables due from retail customers Housing loans 1,020,329 1,007,590 Consumer and cash loans 1,535,046 1,395,698 Transaction account overdrafts and credit cards 472, ,525 Other receivables 30,138 72,617 Loans and receivables due from corporate customers Large entities 1,481,370 1,540,659 Small and medium-sized entities 2,015,655 3,754,822 Micro entities and entrepreneurs 1,211,783 2,308,536 Agricultural estates, farmers 354, ,349 Public companies 2,263 69,182 Loans and receivables due from other customers 218, ,192 Total exposure 8,341,648 11,379,170 Impairment allowance per category of loans and receivables Performing loans and receivables 671, ,917 Of which: restructured loans 2,824 9,025 Non-performing loans and receivables 7,670,188 11,217,253 Of which: restructured loans 2,551,310 2,852,483 Total exposure 8,341,648 11,379,170 44
47 32. IMPAIRMENT ALLOWANCE PER BALANCE SHEET ITEMS (Continued) Movements on the impairment allowance account in 2017 were as follows: Cumulative impairment allowance, opening balance Cumulative impairment allowance of acquired entities at December 1, 2017 Transfer to another category Impairment allowance charge for the current year Reversal of impairment allowance during the year Debt release and sale of receivables Interest income adjustment for collectively impaired loans Unwinding FX differences Cumulative impairment allowance, closing balance Per customer segment Loans and receivables due from retail customers Housing loans 1,007,590 82, ,777 (223,916) (328,351) 2,246 (15,518) (33,072) 1,020,329 Consumer and cash loans 1,395, , ,443 (767,282) 11,946 26,938 - (3,617) 1,535,046 Transaction account overdrafts and credit cards 654,525 20,416 (225) 104,046 (198,971) (109,337) 2,614 - (581) 472,487 Other receivables 72, ,534 (22,819) (46,418) 153 (219) (2,356) 30,138 Loans and receivables due from corporate customers - Large entities 1,540,659 20,979 39,286 40,083 (37,769) (51,406) - (3,929) (66,533) 1,481,370 Small and medium-sized entities 3,754,822 51,063 (325,955) 836,651 (483,400) (1,722,748) 212 (49,191) (45,799) 2,015,655 Micro entities and entrepreneurs 2,308,536 3, , ,500 (148,691) (1,643,297) 675 (25,624) (24,680) 1,211,783 Agricultural estates, farmers 219,349 5,521 (334) 265,919 (115,500) (11,025) 1,592 (1,791) (9,380) 354,351 Public companies 69,182 3,482 (43,052) 1,096 (28,372) (251) 2,263 Loans and receivables due from other customers 356,192 5,852 (66,886) 61,068 (7,638) (120,045) 36 (1,432) (8,921) 218,226 Total exposure 11,379, ,650-2,914,117 (2,034,358) (4,020,503) 34,466 (97,704) (195,189) 8,341,648 Per category of loans and receivables Performing loans and receivables 161, ,604 1,553, ,491 (649,349) (1,445,367) 2,076 (1,942) (26,995) 671,461 Of which: restructured loans 9, (3,869) 3,327 (7,119) (99) 2,824 Non-performing loans and receivables 11,217,253 20,046 (1,553,026) 2,177,626 (1,385,009) (2,575,136) 32,390 (95,762) (168,195) 7,670,187 Of which: restructured loans 2,852,483 10,676 (608,071) 788,854 (419,338) (2,963) 6,625 (43,892) (33,064) 2,551,310 Total exposure 11,379, ,650-2,914,117 (2,034,358) (4,020,503) 34,466 (97,704) (195,190) 8,341,648 45
48 32. IMPAIRMENT ALLOWANCE PER BALANCE SHEET ITEMS (Continued) Movements on the impairment allowance account in 2016 were as follows: Cumulative impairment allowance, opening balance Impairment allowance charge for the current year Reversal of impairment allowance during the year Debt release and sale of receivables Interest income adjustment for collectively impaired loans FX differences Cumulative impairment allowance, closing balance Unwinding Per customer segment Loans and receivables due from retail customers Housing loans 931, ,397 (240,028) (371) 2,489 (15,835) 6,978 1,007,590 Consumer and cash loans 1,250, ,828 (506,071) (3,880) 44, ,395,698 Transaction account overdrafts and credit cards 662, ,184 (162,479) (11,611) 14,437 (1) ,525 Other receivables 77,489 17,239 (22,608) (142) 41 (313) ,617 Loans and receivables due from corporate customers - Large entities (including banks) 1,558, ,093 (71,079) (105,917) - (18,370) 21,114 1,540,659 Small and medium-sized entities 5,114, ,738 (609,336) (1,287,484) 406 (55,007) 16,248 3,754,822 Micro entities and entrepreneurs 3,141, ,966 (226,201) (909,963) 1,422 (42,798) 10,378 2,308,536 Agricultural estates, farmers 231, ,797 (133,212) (329) 2,472 (2,435) 2, ,349 Public companies 94,508 1,666 (26,539) (514) ,182 Loans and receivables due from other customers 416, ,251 (65,696) (155,336) 99 (11,183) 4, ,192 Total exposure 13,480,141 2,454,159 (2,063,249) (2,475,547) 65,594 (145,942) 64,014 11,379,170 Per category of loans and receivables Performing loans and receivables 184, ,654 (427,451) (84,918) 1,733 (4,622) ,917 Of which: restructured loans 1,735 18,739 (11,548) - 9 (81) 171 9,025 Non-performing loans and receivables 13,295,604 1,962,505 (1,635,798) (2,390,629) 63,861 (141,320) 63,030 11,217,253 Of which: restructured loans 2,616, ,655 (606,980) (3,736) 11,840 (61,238) 8,795 2,852,483 Total exposure 13,480,141 2,454,159 (2,063,249) (2,475,547) 65,594 (145,942) 64,014 11,379,170 46
49 32. IMPAIRMENT ALLOWANCE PER BALANCE SHEET ITEMS (Continued) Required Reserve for Estimated Losses Based on the categorization of loans and receivables in accordance with the regulations of the National Bank of Serbia, the Group member Banks calculated the reserve for estimated losses based on their total exposure to credit risk as of. Calculated reserve for estimated losses in accordance with the Decision of the National Bank of Serbia per: OTP banka Srbija a.d. Novi Sad Balance sheet assets 10,527,767 15,603,822 Off-balance sheet items 32,140 28,901 Total 10,559,907 15,632,723 Vojvođanska banka a.d., Novi Sad 2017 Balance sheet assets 470,793 Off-balance sheet items 24,506 Total 495,299 Impairment allowance and provisions calculated in accordance with the internally adopted methodology (IAS 39): Impairment allowance of balance sheet assets 8,341,648 11,379,170 Provisions for losses per off-balance sheet items 50,946 53,153 Total 8,392,594 11,432,323 Pursuant to the NBS Decision on the Classification of Balance Sheet Assets and Off-Balance Sheet Items, the sum of positive differences between the reserve for estimated losses calculated in accordance with the aforecited Decision and the amount of impairment allowance of balance sheet assets and provisions for losses per off-balance sheet items in accordance with the internally adopted methodology represents the amount of the required reserve for estimated losses. If the amount of impairment allowance for balance sheet assets and off-balance sheet items exceeds the amount of the reserve for potential losses as calculated for an individual borrower, the Group member Banks are under no obligation to calculate the required reserve for potential losses per balance sheet assets and off-balance items. OTP banka Srbija a.d. Novi Sad Required reserve for estimated losses per balance sheet assets and off-balance sheet items 3,132,868 4,377,481 Total required reserve for estimated losses at December 31 3,132,868 4,377,481 47
50 32. IMPAIRMENT ALLOWANCE PER BALANCE SHEET ITEMS (Continued) Required Reserve for Estimated Losses (Continued) Vojvođanska banka a.d., Novi Sad 2017 Required reserve for estimated losses per balance sheet assets and off-balance sheet items 3,648,126 Reduction of the required reserve for estimated losses using the reduction coefficient (3,648,126) Total required reserve for estimated losses at December 31 - As of Vојvоđаnskа banka a.d. Novi Sad reduced the calculated required reserve for estimated losses in full amount based on the NPL ratio decrease to below 10% in accordance with NBS Decision. The aforesaid reduction of the required reserve for estimated losses based on NPL ratio decrease in accordance with NBS Decision by RSD 3,648,126 thousand compared to June 30, 2017 so that its required reserve for estimated losses per balance sheet assets and off-balance sheet items amounted to RSD 0 thousand as of. 33. FINANCIAL LIABILITIES AT FAIR VALUE THROUGH PROFIT AND LOSS HELD FOR TRADING Currency swap 50,687 28,574 Total financial liabilities at fair value through profit and loss held for trading as at December 31 50,687 28, LIABILITIES PER FINANCIAL DERIVATIVES DESIGNATED AS RISK HEDGING INSTRUMENTS With contracted risk hedges retail price index Liabilities per financial derivatives designated as risk hedging instruments - 40 Total liabilities per financial derivatives designated as risk hedging instruments as at December
51 35. DEPOSITS AND OTHER LIABILITIES DUE TO BANKS, OTHER FINANCIAL INSTITUTIONS AND THE CENTRAL BANK In RSD Transaction deposits 260,167 57,769 Deposits securitizing approved loans - 30,000 Earmarked deposits 17,454 5,055 Other deposits 1,936, ,856 Overnight deposits 210,009 - Other financial liabilities 251,416 96,287 RSD deposits and other liabilities 2,675, ,967 In foreign currencies Transaction deposits 1,295,078 46,440 Earmarked deposits 21,759 - Other deposits 7,593, ,690 Overnight deposits 545, ,728 Borrowings 7,851,055 - Other financial liabilities 42,421 8,646 Foreign currency deposits and other liabilities 17,348,972 1,578,504 Total deposits and other liabilities as at December 31 20,024,471 1,874,471 In 2016 the received foreign currency overnight deposits totaling RSD 544,679 thousand, mostly relate to deposits placed by the Parent Bank, OTP Bank Hungary, in the amount of USD 3,150,000 (RSD 368,976 thousand) at the interest rate of 1.65% p.a. while USD 1,500,000 (RSD 175,703 thousand) represents overnight deposits placed with the Group member Banks by domestic commercial banks at the interest rate of 1.60% p.a. As of 2016 other foreign currency deposits mostly comprise deposits placed by the Parent Bank, OTP Bank Hungary, in the amount of CHF 1,350,000 (RSD 155,044 thousand) for periods from 7 days to 2 months at an average interest rate of -0.49% p.a., in the amount of EUR 1 million (RSD 123,472 thousand) for a period of 2 months at an annual interest rate of 0.08% and in the amount of USD 1 million (RSD 117,135 thousand) for a period of 2 months at an annual interest rate of 1.63%. Other deposits received from domestic banks amounted to USD 3 million (RSD 351,406 thousand) and were placed for periods of one week at an average weighted interest rate of 0.625% p.a. In 2017 the Group received short-term RSD deposits from insurance companies, investment fund management companies and other non-banking financial institutions, which were deposited for periods from 2 months to a year at interest rates ranging from 2% to 4.1%. As of the insurance companies' deposits totaled RSD 720,000 thousand, while deposits of other non-banking financial institutions totaled RSD 1,019,300 thousand. In addition, as of, insurance companies had long-term deposits in the amount of RSD 170,000 thousand placed with the Group for a period of 13 months at interest rates ranging from 3.8% to 4.1% p.a. As of, other short-term foreign currency deposits totaling USD 20,800 thousand (RSD 2,061,602 thousand) were placed by domestic commercial banks for a period of 7 days at the interest rates ranging from 1.25% to 1.70% p.a. and an overnight deposit placed by domestic banks in the amount of USD 5,500 thousand (RSD 545,135 thousand). As of, other foreign currency deposits placed by non-residents mostly comprised deposits placed by the Parent Bank, OTP Bank Hungary, in the amount of EUR 31,000 thousand for periods from 3 to 6 months at the interest rates ranging from -0.35% to 0.10%. p.a. Under the Revolving Credit Agreement that Vojvođanska bаnkа ad Novi Sad executed with the European Bank for Reconstruction and Development (EBRD), London in October 2013, during 2017 the Bank drew down seven tranches of the loan in the aggregate amount of EUR 42,850 thousand, each with a threemonth maturity and with an interest rate equal to 3-month EURIBOR plus 0.6 percentage points. During 2017, EUR 32,350 was repaid. The balance of this liability totaled EUR 20,350 thousand as of December 31, In April 2017 the total loan amount limit per the Bank Issuer Agreement and the Revolving Credit Agreement was increased from ЕUR 10 million to ЕUR 30 million. As of, the Group member Banks were in full compliance with the prescribed performance indicators and all covenants stipulated by the relevant loans agreements. 49
52 35. DEPOSITS AND OTHER LIABILITIES DUE TO BANKS, OTHER FINANCIAL INSTITUTIONS AND THE CENTRAL BANK (Continued) OTP Lizing d.o.o. Beograd had repayment liabilities per a long-term borrowing obtained from OTP Financing Malta in the amount of EUR 32,700 at the interest rate of 1-month ЕURIBOR plus 0.88% p.a. and another borrowing of EUR 3,000,000 approved at the interest rate of 3-month ЕURIBOR plus 0.72% p.a. 36. DEPOSITS AND OTHER LIABILITIES DUE TO CUSTOMERS Deposits and other liabilities due to customers breakdown per product In RSD Transaction deposits 30,052,023 8,304,605 Savings deposits 4,218, ,965 Deposits securitizing approved loans 101, ,735 Earmarked deposits 953, ,769 Other deposits 18,370,456 2,652,623 Overnight deposits 598, ,391 Other financial liabilities 774,278 83,256 RSD deposits and other liabilities 55,068,837 12,722,344 In foreign currencies Transaction deposits 19,565,140 6,802,668 Savings deposits 53,188,063 8,638,498 Deposits securitizing approved loans 2,270,436 1,049,229 Earmarked deposits 810, ,798 Other deposits 1,255,988 1,314,376 Other financial liabilities 481, ,231 Foreign currency deposits and other liabilities 77,571,895 18,745,800 Total deposits and other liabilities due to customers as at December ,640,732 31,468, Deposits and other liabilities due to customers breakdown per customer segment Holding companies 2,314 - Public companies 7,802,160 5,304,963 Corporate customers 25,883,050 7,532,976 Entrepreneurs 3,496, ,401 Public sector 1,042, ,039 Retail customers 74,383,780 14,347,998 Non-residents 3,282,095 1,351,966 Agricultural producers 1,091, ,749 Other customers 15,656, ,052 Total deposits and other liabilities due to customers as at December ,640,732 31,468,144 Demand depostis of large corporate customers in RSD and foregin currencies did not accrue interest, except in instance of special arrangements, which are defined by separate contracts with significant clients. In 2017, the Group paid interest on corporate transaction deposits at the rates between 0% and 3% p.a. and between 0% and 0.13% p.a. for RSD ad foreign currency transaction deposits, respectively. The Group paid no interest on the retail current accounts. 50
53 36. DEPOSITS AND OTHER LIABILITIES DUE TO CUSTOMERS (Continued) RSD term deposits of large commercial clients of the corporate segments accrued interest at rates dependent on the deposit maturity and amount deposited. Rates of interest payable on RSD term deposits are adjusted to the market trends. In 2017 interest rates on RSD term deposits of corporate customers ranged from 0.25% to 4.2% per annum. The Group paid interest on foreign currency term deposits of corporate customers at the rates dependent on the deposit currency, maturity and amount. Rates of interest payable on foreign currency term deposits are adjusted to the market trends. In 2017 interest rates on foreign currency term deposits of corporate customers ranged from 0.05% to 0.5% per annum. During 2017 general purposes term deposits in foreign currencies of retail customers (the largest share of which belongs to EUR term deposits) were placed at interest rates ranging from 0% to 0.6% annually. 37. SUBORDINATED LIABILITIES Subordinated liabilities in foreign currencies 956, ,387 Deferred interest payable per subordinated liabilities in foreign currencies 980 1,026 Total subordinated liabilities as at December , ,413 A subordinated liability of EUR 8,069,722 was contracted and remained unchanged throughout 2016 and 2017: Amount agreed EUR 8,069,722 Creditor OTP Financing Netherlands Debt balance at, 2016 EUR 8,069,722 Ultimate maturity September 5, 2018 Annual interest rate 3-month EURIBOR % 38. PROVISIONS Provisions for potential litigation losses 338, ,737 Provisions for losses per off-balance sheet items 50,946 53,153 Provisions for retirement benefits 243,358 8,484 Restructuring provisions (Note 14) 403,967 - Provisions as at December 31 1,037, ,374 Movements on provisions are presented in the table below: Provisions for potential litigation losses Balance as at January 1 106, ,437 Provisions for acquired entities 228,839 - Charge for the year (Note 14) 98,664 91,789 Reversal of provisions reversal of provision surplus (1,477) (73,393) Release of provisions payment (86,833) (39,096) Foreign exchange effects (7,184) - Balance as at December , ,737 51
54 38. PROVISIONS (Continued) Movements on provisions are presented in the table below Provisions for losses per off-balance sheet items Balance as at January 1 53, ,456 Provisions for acquired entities 20,111 - Change for the year (Napomena 11) 69,988 58,673 Reversal of provisions (94,311) (131,993) Foreign exchange effects 2, Balance as at December 31 50,946 53,153 Provisions for retirement benefits Balance as at January 1 8,484 9,582 Provisions for acquired entities 272,668 - Change for the year Directly paid assets (2,208) - Actuarial gains (9,234) (391) Release of provisions payment of benefits (27,997) (707) Foreign exchange effects Balance as at December ,358 8,484 In 2017 the Group made provisions of RSD 403,967 thousand under IAS 37 and in accordance with the Plan for the Network and Staff Reorganization and Restructuring in the commenced process of integration with Vojvođanska banka a.d., Novi Sad, a member of OTP Group. Upon calculating provisions for retirement benefits in 2016, the Bank used the following assumptions: (1) Discount rate the Group used the rate for EUR bonds traded in the primary and secondary markets and arrived at the discount rate for 20-year period of 6.48% using the extrapolation method; (2) Estimated annual salary growth rate of 1.5% annually; and (3) Estimated number of employee survivorship up to the retirement. Provisions for employee retirement benefits were made based on the independent actuary s report as of and were stated at the present value of the expected future payments. As of the reporting date, the Group made provisions for retirement benefits (adjusted for the amount of the retirement benefits paid to the employees who, under the restructuring scheme, opted for early retirement) under the following assumptions: Discount rate 6.25% 7.20% - Inflation rate 2.50% 4.00% - Average salary growth rate 3.50% 5.50% 39. CURRENT TAX LIABILITIES Current tax liabilities 1,447 - Total current tax liabilities as at December 31 1,447-52
55 40. DEFERRED TAX LIABILITIES Deferred tax liabilities 686, Total deferred tax liabilities as at 686, Deferred tax amount Temporary differences between the net book values of propery, equipment, intangible assets and investment property calculated for accounting and for tax purposes 176,029 Deferred tax liabilities per reserves within equity in respect of actuarial losses 5,837 Deferred tax liabilities per revaluation reserves from changes in the fair value of financial assets available for sale 34,992 Deferred tax liabilities per business combination effects 469,955 Total balance at 686, OTHER LIABILITIES In RSD Fees and commission payable per other liabilities 4,071 3,544 Trade payables 278,263 75,635 Advances received 46,057 14,602 Finance lease liabilities 26 - Dividend payment liabilities (Note 41.2) 173, ,589 Other liabilities from operations 451,248 23,893 Liabilities in settlement 48,440 34,378 Temporary and suspense accounts 18,572 - Total other liabilities 1,019, ,641 Net salaries - 6 Payroll contributions 1 3 Liabilities to seasonal and temporary employees 3 98 Other liabilities to employees 4, Taxes payable (Note 41.1) 14,564 14,331 Total liabilities for salaries, taxes and contributions 19,200 14,629 Accrued liabilities for other expenses 253, ,993 Deferred interest income 11,253 1,088 Deferred other income 49,285 17,775 Other accruals 3, Total accruals 318, ,145 In foreign currencies Fees and commission payable per other liabilities 9,477 9,280 Trade payables 18,162 2,126 Advances received 27,899 26,742 Liabilities per managed funds Other liabilities from operations 9,665 1 Liabilities in settlement 17,909 2,274 Temporary and suspense accounts 7 6 Total other liabilities 83,380 41,180 Accrued liabilities for other expenses 12,467 12,265 Deferred other income 7,223 1,636 Other accruals Total accruals 20,131 13,924 Total other liabilities as at December 31 1,460, ,519 53
56 41. OTHER LIABILITIES (Continued) Taxes Payable Value added tax payable 13,596 12,913 Payroll taxes charged to the Group Payroll contributions charged to the Group Other contributions municipal business sign display charge 44 3 Tax payable on retail savings interest Personal income tax payables Other taxes and contributions payable Total taxes payable as at December 31 14,564 14, Dividend Payment Liabilities Payment of dividend preferred shares Payment of dividend preferred shares for prior years (prior to 2003) Payment of dividend preferred shares for Payment of dividend preferred shares for Payment of dividend preferred shares for ,849 8,849 Payment of dividend preferred shares for ,282 47,282 Payment of dividend preferred shares for ,282 47,282 Payment of dividend preferred shares for ,282 47,282 Payment of dividend preferred shares for ,750 7,750 Payment of dividend preferred shares for ,924 4,924 Payment of dividend preferred shares for ,636 1,636 Payment of dividend preferred shares for ,636 1,636 Payment of dividend preferred shares for ,636 1,636 Payment of dividend preferred shares for ,636 1,636 Payment of dividend preferred shares for ,636 1,636 Payment of dividend preferred shares for ,636 - Total dividend payment liabilities as at December , ,589 Dividend payables based on preferred shares for 2017 were recognized in the Group's income statement for the year 2017 in the amount of RSD 1,636 thousand. 54
57 42. EQUITY The Group's equity is includes issued capital, reserves, share issue premium, retained earnings and accumulated losses. The Group's share capital is comprised of regular (common stock) shares and preferred cumulative shares ISSUED CAPITAL Ordinary shares 31,553,264 16,646,827 Cumulative preferred shares 54,544 54,544 Total 31,607,808 16,701,371 Other capital 1,543 1,543 Share issue premium 2,563,562 2,563,562 Total issued capital 34,172,913 19,266,476 RESERVES Revaluation reserves from changes in fair value of securities available for sale 58,462 20,344 Statutory reserves 15,776 15,776 Total revaluation reserves 74,238 36,120 Unrealized losses on securities available for sale (2,504) (2,524) Actuarial gains per defined employee benefit plans 16,940 9,091 Total unrealized losses 14,436 6,567 Total reserves 88,674 42,687 RETAINED EARNINGS Prior years retained earnings - 229,089 Current year s retained earnings 6,008, ,390 Total retained earnings 6,008, ,479 Current year s loss - - Prior years accumulated losses (6,582,434) (7,025,913) Equity as at December 31 33,687,154 12,726,729 Based on the Decision enacted by the Bank's Assembly on December 14, 2016 and Decision of the Serbian Business Registers Agency no. BD /2016 dated December 21, 2016, the Group issued the 30th share issue without any impact on the amount of the total issued capital of 136,172 common stock shares with the par value of RSD 49,540 thousand per share for the simultaneous capital increase by RSD 6,745,961 thousand and capital decrease by the same amount (RSD 6,745,961 thousand) through withdrawal and cancellation of 136,172 non-cumulative preferred shares with the consolidated par value of RSD 49,540 per share. Based on the Decision enacted by the Bank's Assembly and Business Registers Agency no. BD /2017 dated December 14, 2017, the Group issued the 31st share issued of 300,897 common stock shares with the consolidated par value of RSD 49,540 per share, totaling RSD 14,906,437 thousand. As of 2016 the Bank had 336,028 ordinary shares with the par value of RSD 49,540 per share as well as 1,101 cumulative preferred shares with the par value of RSD 49,540 per share. All the Bank s shares issued and subscribed were fully paid. As of the Bank had 636,925 ordinary shares with the par value of RSD 49,540 per share as well as 1,101 cumulative preferred shares with the par value of RSD 49,540 per share. All the Bank s shares issued and subscribed were fully paid in. 55
58 42. EQUITY (Continued) Holders of the common stock shares are entitled to dividend payment after disbursement of dividend on preferred shares in full amount according to the relevant decision of the Bank s Assembly on profit distribution. Common stock shareholders also have voting rights at the Assembly meetings in accordance with the law and the Statute. The Group recognizes cumulative preferred shares as complex financial instruments in accordance with IAS 32. Holders of the Group s preferred cumulative shares are entitled to the priority dividend payment and priority over the ordinary shareholders in collection of dividend disbursed as specified by the relevant Bank Assembly s decisions as well as to the replacement of the preferred with common stock shares in 1:1 ratio, in accordance with the effective legislation and the Bank s Statute. Revaluation reserves were formed from changes in the fair value (fair value adjustments) of financial assets available for sale. Shareholder structure As of, the Group had the total of 62 shareholders ( 2016: 64 shareholders). The shareholders structure as of with interest of over 1% and data on the number of shares as registered in the Central Securities Depository and Clearing House were as follows: Ordinary shares Shareholder Book Value in RSD 000 Share Count % of Interest OTP Bank Rt. Budapest, Hungary 31,252, , Total 31,252, , Other shareholders 300,857 6, Total ordinary shares 31,553, , Preferred cumulative shares Shareholder Book Value in RSD 000 Share Count % of Interest Republic of Serbia 27, AIK Niš d.o.o., Niš 8, OTP Bank Rt. Budapest, Hungary 8, FAM ad Kruševac 2, Ambalažno staklo d.o.o, Paraćin 1, Mladost a.d. Odžaci 1, Kompanija Vojvodinaput a.d., Novi Sad. 1, SL Mitros a.d., Sremska Mitrovica in bankruptcy Total 50,680 1, Other shareholders 3, Total preferred cumulative shares 54,544 1,
59 43. COMMITMENTS AND CONTINGENT LIABILITIES The Group s commitments as of December 31 comprise: Guarantees and issued 8,112,361 3,893,715 Letters of credit issued 83,855 26,172 Total guarantees and other sureties issued 8,196,216 3,919,887 Commitments for undrawn RSD loans and facilities, irrevocable without prior notice 3,703,335 1,615,154 Other irrevocable commitments in RSD 88,996 45,872 Sureties for foreign currency liabilities to EBRD 17,771 - Total irrevocable commitments 3,810,102 1,661,026 Commitments for undrawn loans and facilities, revocable 26,439,978 7,049,817 Total commitments as of December 31 38,446,296 12,630,730 In 2017, for commitments and contingent liabilities recorded within the off-balance sheet items, the Group assessed and made provisions charged to profit and loss in the amount of RSD 50,946 thousand (2016: RSD 53,153 thousand), presented as the provisions for losses per off-balance sheet items. Breakdown of the Group s irrevocable commitments for undrawn facilities is provided in the table below: Framework facilities (overdrafts) per corporate current accounts 532,870 52,854 Framework facilities (overdrafts) per retail current accounts 1,742, ,596 Framework facilities per retail credit cards 1,248,661 41,539 Framework facilities guarantees for short-term loans 42,521 6,808 Framework facilities guarantees for long-term loans 136,762 1,242,357 Total irrevocable commitments for undrawn facilities as of December 31 3,703,335 1,615, Commitments per operating lease arrangements The Group leases business premises through operating lease arrangements. Future operating lease payments under lease arrangements involving the Group as a lessee on the consolidated level are provided in the table below: Operating lease payments - within a year 413, ,226 - From 1 to 5 years 962, ,533 - After 5 years 229,748 58,166 Total 1,606, , DERIVATIVES RECORDED WITHIN OFF-BALANCE SHEET ITEMS Derivatives held for trading at contractual price forward sales of currencies 3,570,549 - Derivatives held for trading at contractual price - swaps 23,695,461 11,118,701 Total derivatives as at December 31 27,266,010 11,118,701 As of, the Group had contracted currency swap transactions with its Parent Bank OTP Bank Hungary, with Piraeus Bank S.A. and NBS. 57
60 44. DERIVATIVES RECORDED WITHIN OFF-BALANCE SHEET ITEMS (Continued) The following table provides fair values of derivatives presented as assets or liabilities within the statement of financial position and their nominal (contracted) values: Contracted nominal amount 2016 Fair value Fair value Financial Receivables Receivables liabilities per financial per financial carried at fair derivatives derivatives value through Contracted designated as held for profit and loss, nominal risk hedging trading held for trading amount instruments Financial liabilities carried at fair value through profit and loss, held for trading Derivatives held for trading Forward sales of currencies 3,570,549 2, Currency swaps 23,695, ,991 49,932 11,118, ,574 Total 27,266, ,303 50,687 11,118, ,574 Currency swaps entail simultaneous purchase and sale of two currencies in two different time periods (with both currencies at fixed interest rate). The Group executes contracts on currency swaps for periods of up to a year. 45. OTHER OFF-BALANCE SHEET ASSETS Managed funds 736,771 81,104 Received financial asset collaterals 896, ,849 Received tangible asset collaterals 87,172,906 37,038,907 Guarantees and other sureties received 147,666,436 2,594,078 Savings bonds 5,191,864 3,959,509 Repo transactions 2,500,000 - Suspended interest 14,698,173 9,134,988 Accounting write-off under NBS Decision 11,246,511 - Approved framework lines of credit - EBRD 1,125,491 - Cross border loans 26,011,528 - Other off-balance sheet items 1,736, ,656 Total other off-balance sheet assets as of December ,983,402 53,343,091 EBRD Trade Facilitation Programme executed in 2013 was used in the amount of RSD 2,428,690 thousand as of. The used portion of EBRD credit arrangement refers to loan disbursements in the amount of RSD 2,410,919 thousand (Note 35) and guarantees in the amount of RSD 17,771 thousand. As of the unused portion of EBRD facility amounted to RSD 1,125,491 thousand. As of, in accordance with NBS Decision on the Accounting Write-Off, the Group transferred from on-balance sheet assets to the off-balance sheet items assets with low likelihood of recoverability in the amount of RSD 11,246,511 thousand. 58
61 46. STATEMENT OF OTHER COMPREHENSIVE INCOME During 2016 and 2017 the Group made no adjusting reclassifications related to the components of other comprehensive income. 47. CASH AND CASH EQUIVALENTS In RSD: Gyro account 11,184,040 2,115,706 Cash on hand 3,204, ,662 Total RSD 14,388,284 2,997,368 In foreign currencies: Foreign currency accounts 5,626, ,391 Cash on hand in foreign currencies 3,386,010 1,053,002 Other monetary items in foreign currencies 5,523 24,320 Total cash funds in foreign currencies 9,018,266 1,379,713 Gold and other precious metals 35,124 21,117 Total cash and cash equivalents as at December 31 23,441,673 4,398,198 For the purposes of the statement of cash flows, the Group incudes the above listed items in cash and cash equivalents. 48. RELATED PARTY TRANSACTIONS Transactions with related parties take the form of founder s contributions, loans and deposits, provision and purchase of services within regular operating transactions with subsidiaries and associates in which the Group holds significant equity interest or where the Group has relations with the Parent Bank OTP Bank Hungary or an entity related to the Parent Bank OTP Bank Hungary. Related part transactions are performed at arm s length. 59
62 48. RELATED PARTY TRANSACTIONS (Continued) The following table presents the Group s total receivables and payables to and from related parties as of : OTP Factoring d.o.o. Novi Sad OTP Bank LTD Budapest OTP Financing Netherlands DSK Bank Plc MOL Serbia JSC OTP Banka Russia IMOS ad Šid OTP banka Hrvatska d.d. R.E.Four OTP Malta Receivables Financial assets at fair value through profit and loss, held for trading - 138, Loans and receivables due from banks and other financial institutions 185,776 1,146, Loans and receivables due from customers Investments in subsidiaries ,773 - Other assets Total receivables 185,777 1,286, ,779 - Liabilities Financial liabilities carried at fair value through profit and loss, held for trading - 42, Deposits and other liabilities due to banks, other financial institutions and the central bank 26 5,713,006-1, ,439, Deposits and other liabilities due to customers , , ,967 - Subordinated liabilities , Provisions Other liabilities 3,075 14, , ,791 Total liabilities 3,101 5,770, ,022 1,329 71, ,259-5,439,168 8,967 1,791 Equity Share capital - 31,260, Total equity - 31,260, Total equity and liabilities 3,101 37,030, ,022 1,329 71, ,259-5,439,168 8,967 1,791 Total net 182,676 (35,743,866) (957,022) (1,329) (71,445) (716,998) 491 (5,439,168) 20,812 (1,791) Guarantees and other sureties issued , Derivatives held for trading at contractual price - 12,062, Other off-balance sheet items spot transactions - 9,133, Other off-balance sheet items guarantees and other sureties received - 35, , Other off-balance sheet items revocable commitments 24, , , Total off-balance sheet items 24,700 21,743, ,709 10,000 61,
63 48. RELATED PARTY TRANSACTIONS (Continued) The following table presents the Group s total receivables and payables to and from related parties as of 2016: OTP Factoring d.o.o. Novi Sad OTP Bank LTD Budapest OTP Financing Netherlands DSK Bank Plc R.E.Four MOL Serbia Receivables Financial assets at fair value through profit and loss, held for trading - 22, Loans and receivables due from banks and other financial institutions 156,033 41, Loans and receivables due from customers , Investments in subsidiaries Other assets - 1, Total receivables 156,033 65, , Liabilities Financial liabilities carried at fair value through profit and loss, held for trading - (26,934) Deposits and other liabilities due to banks, other financial institutions and the central bank (569) (800,620) - (13,916) - - Deposits and other liabilities due to customers (1,490) (674,328) Subordinated liabilities - - (997,413) Provisions (88,641) - Other liabilities (2,988) (5,582) - - (2,159) (545) Total liabilities (3,557) (833,136) (997,413) (13,916) (92,290) (674,873) Equity Share capital - (16,353,898) Total equity - (16,353,898) Total equity and liabilities (3,557) (17,187,034) (997,413) (13,916) (92,290) (674,873) Total net 152,476 (17,121,529) (997,413) (13,916) (85,801) (674,705) Guarantees and other sureties issued ,000 Derivatives held for trading at contractual price - 10,344, Other off-balance sheet items spot transactions - 1,170, Other off-balance sheet items guarantees and other sureties received , Other off-balance sheet items revocable commitments 24, ,075 - Total off-balance sheet items 24,050 11,515, ,208 4,075 16,000 61
64 48. RELATED PARTY TRANSACTIONS (Continued) Income and expenses arising from related party transactions in the period from January 1 to were as follows: OTP Factoring d.o.o. Novi Sad OTP Bank LTD Budapest OTP Financing Netherlands DSK Bank Plc MOL Serbia JSC OTP Banka Russia OTP Malta IMOS Šid R.E. Four Income Interest income 14,089 11, Fee and commissions income 75 2, , Other operating income - 1, Reversal of impairment of financial assets and credit risk-weighted off-balance sheet items Gains on the financial assets held for trading - 1,332, Foreign exchange gains ,012 47,209 1,043 4,192 20, ,306 - Total income 14,189 1,977,930 47,209 1,055 5,144 29, ,306 - Expenses Interest expenses - (2,824) (36,660) - (99) (6,718) - (1,718) (30) Fee and commissions expenses - (7,836) (10) (65) - Losses from impairment of financial assets and credit risk-weighted off-balance sheet items (92) (15) Other expenses (28,620) (19,485) - - (23,039) (11,054) Losses on the financial assets held for trading - (422,090) Foreign exchange losses - (413,804) (6,737) - (545) (638) (116) (538) - Total expenses (28,620) (866,039) (43,397) - (23,775) (18,425) (126) (2,321) (30) Total, net (14,431) 1,111,891 3,812 1,055 (18,631) 11,119 (103) 28,985 (30) 62
65 48. RELATED PARTY TRANSACTIONS (Continued) Income and expenses arising from related party transactions in the period from January 1 to 2016 were as follows: OTP Factoring d.o.o. Novi Sad OTP Bank LTD Budapest OTP Financing Netherlands DSK Bank Plc R.E. Four MOL Serbia Income Interest income 13,835 1, Fee and commissions income 84 3, ,407 Other operating income ,026 - Reversal of impairment of financial assets and credit riskweighted off-balance sheet items Gains on the financial assets held for trading - 685, Foreign exchange gains 9 271,609 9, ,404 Total income 13, ,869 9, ,349 22,187 Expenses Interest expenses - (7,672) (38,219) - (13) (6,509) Fee and commissions expenses - (5,060) Losses from impairment of financial assets and credit riskweighted off-balance sheet items (909) (376) Other expenses (22,038) (16,500) - - (111,485) (11,180) Losses on the financial assets held for trading - (555,065) Foreign exchange losses (1) (284,068) (24,065) - (390) (2,615) Total expenses (22,039) (868,365) (62,284) - (112,797) (20,680) Total, net (8,111) 93,504 (53,142) 2 (110,448) 1,507 63
66 48. RELATED PARTY TRANSACTIONS (Continued) In 2017 and 2016, the members of the Executive Board and Board of Directors were remunerated as follows: Gross salaries of Executive Board members 44,843 50,801 Net salaries of Executive Board members 37,977 43,188 Rental costs for Executive Board members 228 2,871 Use of company automobiles by the Executive Board members 1,287 1,350 Reimbursement of expenses incurred by the Executive Board members Mobile phone costs of Executive Board members Gross remuneration to the Board of Directors 10,975 10,069 Net remuneration to the Board of Directors 8,314 7, BUSINESS COMBINATIONS 49.1 Acquisition of Subsidiaries In 2017 the Group acquired the below listed subsidiaries: Core activity Acquisition date Equity interest Ownership Consideration transferred (%) (RSD '000) 2017 Vojvođanska banka a.d., Novi Sad Bank 1/12/ % Direct 14,369,818 NBG Lizing d.o.o., Beograd Finance leasing 1/12/ % Direct 450,580 NBG Services d.o.o., Beograd Leasing of automobiles and light motor vehicles 1/12/ % Indirect - 14,820,398 Through purchase of NBG Lizing d.o.o. Beograd, the Group acquired indirect ownership of NBG Services d.o.o. Beograd. On August 4, 2017, the Bank and the National Bank of Greece ( NBG ) executed an agreement on takeover of the entire (100%) ownership of Vojvođanska banka a.d., Novi Sad and NBG Lizing d.o.o., Beograd. The financial transaction was finalized on December 1, 2017, whereby the Bank acquired the sole ownership of Vojvođanska banka a.d., Novi Sad amounting to RSD 14,369,818 thousand and the sole ownership of NBG Lizing d.o.o., Beograd amounting to RSD 450,580 thousand. Under Decision of the Serbian Business Register Agency no /2017 dated December 26, 2017, these entities changed their legal names into OTP Lizing d.o.o. and OTP Services d.o.o. By this acquisition the Group and OTP Group fulfilled their respective strategic goals of market share increases in Serbia and countries of the Group s operations Consideration Transferred Vojvođanska banka a.d., Novi Sad NBG Lizing d.o.o., Beograd Cash 14,369, ,580 The acquisition-related costs totaling RSD 429,501 thousand were eliminated from the consideration transferred and recognized as expenses within the current year's income statement. 64
67 49. BUSINESS COMBINATIONS (Continued) Fair values of the acquired assets and liabilities assumed at the acquisition date Vojvođanska banka a.d., Novi Sad OTP Lizing d.o.o. Beograd Total ASSETS Cash and balances held with the central bank 20,754, ,702 20,946,059 Financial assets at fair value through profit and loss, held for trading 38,139-38,139 Financial assets available for sale 16,279,653-16,279,653 Financial assets held to maturity 144, ,614 Loans and receivables due from banks and other financial institutions 6,325, ,930 6,968,065 Loans and receivables due from customers 72,755,032-72,755,032 Associates and join ventures Investments in subsidiaries - 18,443 18,443 Intangible assets 669,918 1, ,417 Property, plant and equipment 6,902,761 2,216,470 9,119,231 Investment property 178, ,941 Deferred tax assets 1,300,334 5,655,775 6,956,109 Other assets 20,754, ,702 20,946,059 LIABILITIES Financial liabilities carried at fair value through profit and loss, held for trading 11,805-11,805 Deposits and other liabilities due to banks, other financial institutions and the central bank 6,316,057 7,395,880 13,711,937 Deposits and other liabilities due to customers 96,108, ,898 96,684,799 Provisions 519,123 2, ,618 Deferred tax liabilities 550, , ,834 Other liabilities 1,221,226 53,666 1,274,892 Net amount 20,885, ,277 21,479,536 Non-controlling interests Bargain purchase gain 6,515, ,697 6,659,138 Consideration transferred 14,369, ,580 14,820,398 Net cash outflow included in the consolidated statement of cash flows relating to acquisition of the subsidiaries Vojvođanska banka a.d., Novi Sad OTP Lizing d.o.o., Beograd Total Cash consideration transferred for the acquisition (14,369,818) (450,580) (14,820,398) Cash acquired 18,688, ,573 19,527,268 Net cash outflow 4,318, ,993 4,706,870 The OTP Lizing d.o.o. Beograd data are presented as consolidated figures that include both the figures of OTP Lizing d.o.o. Beograd and NBG Services d.o.o. Beograd. Within the consolidated statement of cahs flows, the acquired cash and cash equivalents amounting to RSD 18,688,843 thousand as of the acquisition date relate to the acquired cash of RSD 19,527,268 thousand decreased by the intercompany transactions and balances in the amount of RSD 838,425 thousand. 65
68 50. RISK MANAGEMENT Liquidity Risk Liquidity risk is associated with the adverse effects of the Group s inability to settle its liabilities when due on the Group s financial result and capital. Liquidity risk is vital to the Group's prudent and safe business operation. Liquidity risk management is an integral part of the Group's Policy for Asset and Liability Management. The basic goal of liquidity management is to minimize the liquidity risk through planning inflows and outflows of monetary assets, monitoring liquidity and taking adequate measures for preventing and eliminating the causes of nonliquidity, i.e. avoiding possible adverse effects of the Group's inability to settle its liabilities as they fall due on the Group s financial result and capital. The Group continuously monitors its exposure to liquidity risk and its compliance with the set limits. During 2017 the Group's liquidity was within the limits prescribed by NBS (liquidity ratio, quick ratio and liquidity coverage ratio). The Group maintains the portfolio comprised of highly liquid securities (issued by the Republic of Serbia, denominated in RSD and EUR) and diversified assets that are easily convertible into cash in case of unforeseen and adverse fluctuations in the cash flows. The Banks within the Group also maintain the required level of RSD and foreign currency reserve as required by the National Bank of Serbia. In addition, financing at the Group level is obtained from diversified sources, which include corporate and retail customer deposits, interbank deposits and borrowings received from other banks and financial institutions. The Banks within the Group may call on liquid assets of their Parent Bank OTP Bank Hungary and, therefore, in case of deteriorating liquidity due to the financial market crisis they may bridge its liquidity gap by borrowing from the Parent Bank OTP Bank Hungary. For the purposes of liquidity monitoring and measurement, the Group measures and monitors net cash flows, by keeping track of assets and liabilities according to their outstanding maturities, by measuring and comparing cash inflows and outflows, i.e. through the GAP analysis. 66
69 50. RISK MANAGEMENT (Continued) Liquidity Risk (Continued) Total liquidity gap between the outstanding contractual maturities of the Group-level financial assets and liabilities as of was as follows: Up to a Month From 1 to 3 Months From 3 to 12 Months From 1 to 5 Years Over 5 Years Without Contractua/ lly Defined Maturity Matured Total Cash and balances held with the central bank 31,288, ,523 31,294,266 Pledged financial assets - 787, , ,888 Financial assets at fair value through profit and loss, held for trading 162,468 15, ,303 Financial assets available for sale 26,064 3,071,473 1,917,915 14,701, ,667 19,797,937 Financial assets held to maturity 36,616 57,861 51, , ,944 Loans and receivables due from banks and other financial institutions 9,474, , , ,075 11,616 10,672,880 Loans and receivables due from customers 3,542,648 8,360,270 30,052,213 42,104,611 19,842,361 3,396, , ,731,018 Other assets 1,084, ,207 1,234,713 3,478, , ,778 4,556 6,504,849 Total assets 45,615,914 13,298,119 33,796,586 60,284,974 20,007,895 3,593, , ,240,085 Financial liabilities at fair value through profit and loss, held for trading 50, ,687 Deposits and other liabilities due to banks, other financial institutions and the central bank 6,204,076 3,873,653 2,891,212 5,235,013-4,170 1,816,347 20,024,471 Deposits and other liabilities due to customers 94,621,626 8,202,616 25,782,508 3,446, , ,413 37, ,640,732 Subordinated liabilities , ,022 Other liabilities 818,205 11,012 8, ,316-9,361 22,698 1,038,266 Total liabilities 101,694,594 12,087,281 29,638,436 8,849, , ,944 1,877, ,711,178 Liquidity gap as of (56,078,680) 1,210,838 4,158,150 51,435,180 19,569,586 3,468,062 (1,234,229) 22,528,907 Liquidity gap as of (11,868,472) 850,840 3,508,788 10,871,082 4,180,409 3,032, ,975 10,754,762 The structure of asset and liability maturities as at is indicative of maturity mismatch between the outstanding maturities of assets and those of liabilities in the bucket of up to a month, primarily due to the maturity structure of deposits, i.e. significant share of demand and short-term deposits in the total deposits due to banks and customers. However, based on the historical data and experience, a significant portion of demand deposits may be regarded as a long-term of financing given the transactions and withdrawals realized. In addition, a significant portion of term deposits are commonly renewed, i.e., placed for another term immediately upon maturity. At the same time, the Group is in possession of highly liquid instruments - securities that can be pledged with the National Bank of Serbia at any time, as well as MM line of credit limit approved by its Parent Bank OTP Bank Hungary, available at any time Interest Rate Risk Interest rate risk is a risk of adverse effects of changes in market interest rates on the Group s financial performance and capital. Interest rate risk exposure depends on the Group's interest-bearing assets relative to its interest-bearing liabilities. The basic principle of managing interest rate risk arising from the banking book is the principle of matching financial assets and liabilities per interest rate type (fixed or variable) and per maturity, i.e. per date of interest rate adjustment. For the purpose of measuring interest rate risk exposure, the Group uses the GAP analysis (mismatch analysis). The size of the mismatch (GAP) for a certain time interval (bucket) is indicative of the Group's exposure to repricing risk. 67
70 50. RISK MANAGEMENT (Continued) Interest Rate Risk (Continued) The following table shows the Group's exposure to interest rate risk as of : Up to 30 days From 30 to 90 days From 90 to 180 days From 180 to 360 days From 1 to 2 years Over 2 years Non-Interest bearing Total Cash and balances held with the central bank 14,309, ,984,357 31,294,266 Pledged financial assets - 787, , ,888 Financial assets at fair value through profit and loss, held for trading 162,468 15, ,303 Financial assets available for sale 26,064 3,062,495 1,026, ,917 8,507,403 6,063, ,121 19,797,937 Financial assets held to maturity 156,095 5, , ,944 Loans and receivables due from banks and other financial institutions 7,977, , ,922 38,503 38, ,809,867 10,672,880 Loans and receivables due from customers 35,273,873 53,117,915 2,911,218 2,787,219 1,571,227 9,127,543 2,942, ,731,018 Other assets 5,483, ,020,970 6,504,849 TOTAL ASSETS 63,390,008 57,404,750 4,332,138 3,716,639 10,116,640 15,191,686 23,088, ,240,085 Financial liabilities at fair value through profit and loss, held for trading 50, ,687 Deposits and other liabilities due to banks, other financial institutions and the central bank 15,849,690 1,189,466 1,689,575 81, ,214,740 20,024,471 Deposits and other liabilities due to customers 67,414,379 6,629,411 9,480,745 15,501,345 1,902, ,411 31,310, ,640,732 Subordinated liabilities , ,022 Other liabilities ,037,863 1,038,266 TOTAL LIABILITIES 83,316,139 8,774,919 11,170,320 15,582,345 1,902, ,411 33,563, ,711,178 GAP at (19,926,131) 48,629,831 (6,838,182) (11,865,706) 8,214,052 14,790,275-33,004,139 CUMULATIVE GAP at (19,926,131) 28,703,700 21,865,518 9,999,812 18,213,864 33,004, GAP at 2016 (7,320,732) 11,930,912 (584,516) (2,470,943) 469,362 2,052,179-4,076,262 KUMULATIVNI GAP at 2016 (7,320,732) 4,610,180 4,025,664 1,554,721 2,024,083 4,076, As of, the Group realized cumulative positive GAP of RSD 33,004,139 thousand. Interest rate risk is also monitored through scenario anlyses, i.e., by observing the impact of the changes in interest rates on the Group s income and expenses, as presented in the table below: 2017 Change by percentage point Profit or loss sensitivity Increase in percentage points 1% 402,804 Decrease in percentage points -1% (396,714) Foreign Exchange Risk Foreign exchange (foreign) currency risk is a risk of adverse effects on the Group's financial result and its capital caused by changes in the foreign currency to RSD exchange rates. The exposure to foreign currency risk based on a certain currency represents potential changes in the value of receivables and payables of the Group denominated in the given currency which may be ascribed to the movements in the exchange rate. Foreign currency risk arising from a certain currency is measured as the difference between the total amount of receivables and total amount of payables expressed in that currency (foreign currency open position). 68
71 50. RISK MANAGEMENT (Continued) Foreign Exchange Risk (Continued) Item EUR CHF USD Other RSD Total Cash and balances held with the central bank 12,567, , , ,823 17,548,221 31,294,266 Pledged financial assets , , ,888 Financial assets at fair value through profit and loss, held for trading , ,303 Financial assets available for sale 10,024, ,773,880 19,797,937 Financial assets held to maturity , ,944 Loans and receivables due from banks and other financial institutions 4,703, ,743 2,372, ,681 2,918,741 10,672,880 Loans and receivables due from customers 54,024,217 4,703,381 1,576,983-47,426, ,731,018 Other assets 5,547,423-5, ,680 6,504,849 Total assets 86,865,964 5,438,210 4,517, ,514 79,749, ,240,085 Financial liabilities at fair value through profit and loss, held for trading ,687 50,687 Deposits and other liabilities due to banks, other financial institutions and the central bank 13,990,199 39,493 3,315,425 3,855 2,675,499 20,024,471 Deposits and other liabilities due to customers 72,355,129 2,245,589 2,894, ,575 54,503, ,640,732 Subordinated liabilities 957, ,022 Other liabilities 99,641 4, ,980 1,038,266 Total liabilities 87,401,991 2,289,671 6,211, ,525 58,162, ,711,178 BALANCE GAP (536,027) 3,148,539 (1,693,691) 23,989 21,586,097 22,528,907 OFFSET OFF-BALANCE SHEET ITEMS (2,429,996) (3,115,727) 1,652,656 (17,764) 1,171,923 (2,738,908) OPEN LONG POSITION as of - 32,812-23, OPEN SHORT POSITION as of 2,966,023-41,035 17, OPNE POSITION as of ,043 (13,384) 11, ,998 The process of foreign currency risk management by the Banks within the Group is in compliance with the limits set by the National Bank of Serbia, as well as internally prescribed limits. The limits of foreign currency risk are set so that the Banks within the Group protect themselves against significant losses contingent on the movements in foreign currency to RSD exchange rates. Sensitivity Analysis The sensitivity analysis presented in the table below, assessed the effects of the assumed middle foregin exchange rates by 3%, 5% and 10% on the open position amount for each significant currency and effects on the net open position, and, in turn, isolated effect of the newly obtained net open positions on the Group s financial result (profi or loss) and capital. RSD 000 Stress +3% Stress +5% Stress +10% Net impact Net impact Middle FS Open position Open position Open on the profit or Open on the profit or Net impact Open on the profit rate (FX) (RSD) position loss position loss position or losst CHF ,812 33, ,453 1,641 36,093 3,281 EUR (25,035) (2,966,023) (3,055,004) (88,981) (3,114,324) (148,301) (3,262,625) (296,602) USD (414) (41,035) (42,266) (1,231) (43,087) (2,052) (45,139) (4,104) Gold 32,245 33,212 33,857 35,470 Net impact on the profti or loss (89,227) (148,712) (297,425) Capital 25,271,375 25,182,148 25,122,663 24,973,950 69
72 50. RISK MANAGEMENT (Continued) Credit Risk Credit risk represents a possibility that the borrower may become unable to settle the liabilities to the Bank, partially or in full within according to the contractually agreed schedule. The Group's business policies require and provide for the maximum protection of the Bank in respect of its credit risk exposure. The Group's credit risk policy defines in detail the credit risk management process, which involves the organization of the credit risk management process, credit risk identification, measurement, alleviation and monitoring. This policy also deals with the concentration risk management and the system of internal controls of the credit risk management process as well as definition of credit risk limits used for monitoring credit risk exposure. The Group's credit risk management policy is adopted on an annual basis and represents a framework for credit risk management as part of the uniform risk management system. The Group manages credit risk at the level of individual loans and at the level of the entire loan portfolio. In order to manage credit risk, the Group had defined the crediting process that involves exposure approval and credit risk management as two separate processes. The exposure approval process comprises the following steps: exposure initiation credit exposure, customer segmentation, customer assessment, collateral appraisal, exposure approval and loan disbursement. The Group assesses credit risk based on the quantitative and qualitative criteria taking into account characteristics of a specific borrower and loan, which enable clear loan rating and classification into appropriate risk categories according to their collectability. In order to identify the credit risk level, in order to alleviate the credit risk identified and improve the overall credit risk management, the Group has developed it internal customer rating system, applied to all clients, through adoption of the Rules of Client Rating. Credit rating assists in the decision making process. Different assessment models are used for different customer types. The purpose of customer assessment is to enable structural estimates of the customer creditworthiness and solvency. The client assessment provides support to the loan approval procedure and assistance in preparation of analyses and decision making. The Rules on Collateral Assessment defines the acceptable collateral types, the manner of collateral appraisal and conditions for acceptance and realization of collaterals. All collaterals have accepted values which may depart form their market values depending on the level of risks related to the specific collateral. The loan approval process id described in detail in the Group s rulebooks on loan approval to corporate, SME and retail customers. It is a process shared by the two divisions Business Division and Risk Management Division in accordance with the four-eye control principle. Exposure analyses for Business Division s clients are performed by the Risk Management Division as it is responsible for calculation of credit limits per client, independent risk assessment and making decisions on risk acceptance through loan approval. Exposure approval limits are specified by the Rulebook on Decision-Making Levels. This Rulebook also defines competences and amount limits up to which certain Group s departments or authorized persons may decide on the loans, amendments to the agreed loan terms, departures from the standard terms of business, collection, sale, write-off of receivables, investments of the Group s assets and borrowings and other matters that need to be decided on during the regular course of banking business. The credit risk management process involves four phases: credit risk identification, measurement, alleviation and monitoring. In order to set up an effective and efficient credit risk management process, the Group has defined the key responsibilities in the process. The Board of Directors has the ultimate authority and responsibility for the risk management function. It approves of policies and principles related to the risk management and adopts quarterly reports on the current risk management. After loan disbursement, the monitoring process commences. Monitoring involves a series of activities through which the Group constantly oversees the risks assumed, economic activities of the borrower, the borrower's assets, financial situation, solvency, readiness of the borrower to fulfil its contractual obligations, changes in the borrower's legal status, the condition and value of collateral obtained, etc. 70
73 50. RISK MANAGEMENT (Continued) Credit Risk (Continued) Constant loan portfolio monitoring activities allow the Group to identify any change that could affect collection of its receivables and to intervene in order to protect its interests. Monitoring is primarily performed in accordance with the monitoring tasks defined for each borrower/loan. The early warning system is an integral part of the monitoring process and early warning signals are identified through realization of the monitoring tasks. Implementation of the monitoring activities is supervised by the Placement Monitoring and Controlling, Collateral Management and Risk Modeling Department, which operates within the Risk Management Division. Based on and using the results of the monitoring tasks realized, other sources of information and tools developed, the aforesaid Department analyzes borrower/loan risks. The monitoring system also involves customer analyses performed by the Monitoring Committee, which analyzes significant exposures within the active loan portfolios of the Group member Banks on a monthly basis. The Group has established loan monitoring based on the updated information on the financial situation and creditworthiness of debtors and market values of collaterals obtained, which allow the Group to undertake timely action to alleviate credit risk in instances of deteriorated financial situation and/or creditworthiness of the debtor or credit protection provider. In addition to the debtor-level monitoring, the Group's Risk Management Division/Portfolio and Risk Management Directorate perform portfolio-level monitoring on monthly and quarterly bases and reports to the Executive Board, Audit Committee and Board of Directors. Impairment Allowance and Provisioning Methodology Provisions for risks of potential losses are assessed pursuant to the internal methodology in accordance with IAS 39, as well as the National Bank of Serbia Guidelines for IAS 39. At each reporting date the Group assesses whether there is objective evidence of impairment of its financial assets. Most common objective evidence of impairment includes: significant financial difficulties of the customer, breach of contract, insolvency and liquidation. The Group assesses financial assets for impairment on an individual level and on a group (portfolio) level. Individual Assessment of Impairment Allowance The assessment of objective evidence of impairment is carried out on individual basis for individually significant financial assets, the amounts of which exceed the internally defined amount if such objective evidence exists. The amount of allowance for impairment is determined as the difference between the asset's carrying value and the present value of future cash flows calculated applying the effective interest rate of the financial asset. The projections of expected cash flows to be collected take into account the financial position of the customer, as well as the agreement achieved with the customer, value, quality and marketability of collaterals provided. The allowance for impairment of balance sheet assets calculated in this manner and provisions for losses on off-balance sheet items are charged to the Group's expenses. Group-Level Assessment of Impairment Allowance The assessment of impairment allowance is made on a portfolio basis (group assessment) for all assets that are not individually significant. Group level assessment is diversified according to criteria based on the type of debtor, type of asset and its maturity, into subgroups with similar characteristics. Group-level impairment allowance, i.e., impairment losses are determined based on the migration matrices and calculation of expected losses resulting from the probability of default as well as actual losses incurred. 71
74 50. RISK MANAGEMENT (Continued) Credit Risk (Continued) Special Reserve for Estimated Losses Special reserve for estimated losses is determined in accordance with the relevant NBS regulations. Loans, receivables and other Group members exposures are classified into the categories A, B, V, G and D, in accordance with the estimate of their collectability, depending on: the number of days the payments of principal and interest due are in arrears, assessment of the debtor financial standing and credit worthiness and quality of collaterals. The estimated amount of special reserve for estimated (potential) losses is calculated by applying the following percentages per loan category: A - 0%, B - 2%, V - 15%, G - 30% and D 100%. The amount of the required special reserve for potential losses represents the sum of determined positive differences between the reserve for estimated losses calculated according to the NBS regulations and the calculated amount of allowance for impairment of balance sheet assets and provisions for losses per offbalance sheet items determined in accordance with the Group s internal methodology Credit Commitments Guarantees, other forms of sureties and letters of credit issued are irrevocable commitments that the Group will make payment in case the customer is unable to settle its liabilities towards third parties when due and are therefore treated as loan equivalents. Credit commitments also represent unused portions of frame loans (revolving loans, current account overdrafts, credit cards and the like), which are treated depending on the cancellability and outstanding maturity. Given that credit risk is associated with credit commitments, the Group may incur loss in the amount equal to total undrawn funds. However, the expected loss amount is below the total undrawn funds. The Group makes provisions and includes those within expenses for commitments according to its internal methodology for loans and receivables. 72
75 50. RISK MANAGEMENT (Continued) Credit Risk (Continued) Credit Risk Exposures, Gross and Net, Presented per Balance Sheet Assets and Off-Balance Sheet Items The tables below present the data on the Group s credit risk exposures, gross and net per balance sheet assets and off-balance sheet items: Assets per which the Group is exposed to credit risk Gross exposure Accumulated impairment allowances / provisions Assets per which the Group is not exposed to credit risk Reported in the balance sheet at 2017 Net exposure Cash and balances held with the central bank ,294,266 31,294,266 Pledged financial assets 109, , , ,888 Financial assets at fair value through profit and loss, held for trading , ,303 Financial assets available for sale 490, ,750-19,797,937 19,797,937 Financial assets held to maturity 76,528 15,483 61, , ,944 Loans and receivables due from banks and other financial institutions 8,528, ,302 8,167,152 2,505,728 10,672,880 Loans and receivables due from customers 115,070,222 7,339, ,731, ,731,018 Investments in associates and joint ventures Investments in subsidiaries ,773 29,773 Intangible assets , ,231 Property, plant and equipment ,800,279 10,800,279 Investment property , ,675 Deferred tax assets Non-current assets held for sale and assets from discontinued operations , ,456 Other assets 5,730, ,909 5,595,781 1,973,129 7,568,910 Total on-balance sheet exposure 130,005,671 8,341, ,664,023 68,882, ,546,100 Guarantees and sureties issued 8,198,852 12,199 8,186, ,187,381 Commitments 3,792,331 22,295 3,770,036 6,395,298 10,165,334 Other off-balance sheet exposures 17,025,509 16,452 17,009,057 64,880,675 81,889,732 Total off-balance sheet exposure 29,016,692 50,946 28,965,746 71,276, ,242,447 Maximum exposure at 159,022,363 8,392, ,629, ,158, ,788,547 73
76 50. RISK MANAGEMENT (Continued) Credit Risk (Continued) Credit Commitments (Continued) Credit Risk Exposures, Gross and Net, Presented per Balance Sheet Assets and Off-Balance Sheet Items (Continued) Assets per which the Group is exposed to credit risk Gross exposure Accumulated impairment allowances / provisions Assets per which the Group is not exposed to credit risk Reported in the balance sheet at Net exposure Cash and balances held with the central bank ,968,557 7,968,557 Pledged financial assets 128, , ,849 Financial assets at fair value through profit and loss, held for trading ,295 26,295 Financial assets available for sale 454, ,149-2,877,871 2,877,871 Financial assets held to maturity 50,868 50, , ,166 Loans and receivables due from banks and other financial institutions 2,419, ,120 1,973,915 40,788 2,014,703 Loans and receivables due from customers 42,318,655 10,225,495 32,093,160 2,802 32,095,962 Receivables per financial derivatives designated as risk hedging instruments Intangible assets ,735,956 1,735,956 Property, plant and equipment ,328 37,328 Investment property ,340 24,340 Deferred tax assets Non-current assets held for sale and assets from discontinued operations , ,601 Other assets 296, ,538 92, , ,650 Total on-balance sheet exposure 45,668,013 11,379,170 34,288,843 13,549,492 47,838,335 Guarantees and sureties issued 3,919,887 3,599 3,916,288-3,916,288 Commitments 1,661, ,660,071-1,660,071 Other off-balance sheet exposures 7,049,817 48,599 7,001,218 64,461,792 71,463,010 Total off-balance sheet exposure 12,630,730 53,153 12,577,577 64,461,792 77,039,369 Maximum exposure at ,298,743 11,432,323 46,866,420 78,011, ,877,704 74
77 50. RISK MANAGEMENT (Continued) Credit Risk (Continued) Loans and Receivables Credit Risk Exposures, Gross and Net, Presented per Customer Segment and Loan Category a) Per impairment assessment, maturity and collateral value Per customer segment Unimpaired Impaired Accumulated impairment allowances Due Undue Individually Collectively Total gross loans and receivables Individually Collectively Total net loans and receivables Collateral values Unimpaired loans and receivables Impaired loans and receivables Retail loans and receivables 48,380,571 2,116,563 1,040,770 3,258,222 54,796, ,653 2,596,286 51,725,187 15,008,755 1,507,865 Housing loans 16,118, ,678 1,026, ,494 18,555, , ,350 17,535,099 14,785,802 1,472,722 Consumer and cash loans 29,990,268 1,527,279 4,304 1,732,867 33,254, ,534,971 31,719,672 70,027 6,092 Transaction account overdrafts and credit cards 1,868, ,870 1, ,334 2,527, ,756 2,053, Other receivables 403,811 3,736 8,674 42, ,748 4,779 34, , ,864 29,051 Corporate loans and receivables 57,703,019 3,560,349 6,833, ,991 69,008,973 3,975,187 1,077,295 63,956,491 20,830,673 4,305,220 Large entities 18,857,701 2,355,925 1,736,359 10,002 22,959,987 1,135, ,582 21,478,619 5,899, ,297 Small and medium-sized entities 26,481,767 1,033,703 3,269, ,235 31,095,766 1,633, ,487 29,080,111 11,101,690 2,352,534 Micro entities and entrepreneurs 2,206, ,052 1,592, ,261 4,280,556 1,094, ,364 3,068, , ,257 Agricultural estates, farmers 5,171,423 59, , ,157 5,673, , ,922 5,332,337 2,043, ,740 Public companies 4,985,323 3,166 10, ,998, ,940 4,996,651 1,256,544 5,392 Other customer loans and receivables 5,767, , ,803 21,353 6,200, ,007 33,220 5,982,345 1,307,134 49,867 Total exposure at 111,851,460 5,875,458 8,087,187 4,191, ,005,671 4,634,847 3,706, ,664,023 37,146,562 5,862,952 Per category of loans and receivables 111,851,460 5,875,458 8,087,187 4,191, ,005,671 4,634,847 3,706, ,664,023 37,146,562 5,862,952 Performing loans and receivables 111,135,451 5,606, ,086 1, ,100,107 7, , ,428,570 36,940, ,222 Of which: restructured loans 387,961 4, ,848-2, , ,458 - Non-performing loans and receivables 716, ,101 7,730,101 4,190,353 12,905,564 4,627,459 3,042,652 5,235, ,988 5,600,730 Of which: restructured loans 168,128 92,425 3,884, ,297 4,542,665 2,267, ,169 1,991, ,095 2,449,403 75
78 50. RISK MANAGEMENT (Continued) Credit Risk (Continued) Loans and Receivables (Continued) Credit Risk Exposures, Gross and Net, Presented per Customer Segment and Loan Category (Continued) a) Per impairment assessment, maturity and collateral value (Continued) Per customer segment Unimpaired Impaired Accumulated impairment allowances Due Undue Individually Collectively Total gross loans and receivables Individually Collectively Total net loans and receivables Collateral values Unimpaired loans and receivables Impaired loans and receivables Retail loans and receivables 10,820, ,909 1,399,448 2,477,327 14,822, ,288 2,259,475 11,691,795 3,281,079 1,036,277 Housing loans 3,368,477 73,848 1,337, ,092 5,162, , ,333 4,155,378 3,093,489 1,018,167 Consumer and cash loans 6,739,719 9,880-1,411,396 8,160,995-1,395,698 6,765,297 7,501 - Transaction account overdrafts and credit cards 519,884 30,650 5, ,197 1,212,012 4, , , Other receivables 192,794 10,531 56,615 26, ,582 51,395 21, , ,897 18,110 Corporate loans and receivables 19,249, ,234 9,566, ,519 29,831,182 7,001, ,429 21,938,967 8,878,921 4,489,558 Large entities 8,520, ,309 1,442,716 9,362 10,273,000 1,246, ,226 8,732,341 2,773, ,345 Small and medium-sized entities 6,558, ,661 4,746, ,947 11,671,201 3,400, ,878 7,916,379 3,105,442 2,325,971 Micro entities and entrepreneurs 1,011,569 37,440 3,061, ,528 4,229,073 2,205, ,100 1,920, ,608 1,508,076 Agricultural estates, farmers 912,230 55, , ,376 1,254, , ,901 1,035, , ,658 Public companies 2,246,789 3, , ,403,196 31,859 37,324 2,334,013 2,079,368 68,508 Other customer loans and receivables 168,463 95, ,544 23,286 1,014, ,750 19, , ,955 Total exposure at ,239, ,123 11,692,523 2,963,132 45,668,013 8,209,824 3,169,346 34,288,843 12,160,898 5,955,790 Per category of loans and receivables Performing loans and receivables 29,341, , ,743 10,083 30,331,267 24, ,573 30,169,350 11,633, ,321 Of which: restructured loans 567,407 2,559 7, ,485 4,345 4, , ,817 5,186 Non-performing loans and receivables 898, ,694 11,340,780 2,953,049 15,336,746 8,185,480 3,031,773 4,119, ,609 5,686,469 Of which: restructured loans 319,014 7,309 4,345, ,605 4,964,928 2,624, ,485 2,112, ,624 2,576,635 76
79 50. RISK MANAGEMENT (Continued) Credit Risk (Continued) Loans and Receivables (Continued) Credit Risk Exposures, Gross and Net, Presented per Customer Segment and Loan Category (Continued) b) Per impairment status and number of days past due Per customer segment Undue Up to 30 days past due Unimpaired days past due days past due Over 90 days past due Undue Up to 90 days past due Impaired days past due days past due Over 360 days past due Total Retail loans and receivables 48,200,136 1,388, , , ,595 12, , ,072 3,093,143 54,796,126 Housing loans 16,104, , , ,897-55,486 12, ,374 49,645 1,271,865 18,555,429 Consumer and cash loans 29,817,505 1,145, , , , , ,936 1,272,148 33,254,718 Transaction account overdrafts and credit cards 1,875,250 78,228 15,338 6, ,128 9, ,380 2,527,231 Other receivables 402,885 1,588 1,197 1, ,582 1,869 43, ,748 Corporate loans and receivables 60,046, , ,419 34,949 94,254 1,054,215 58, ,405 57,069 5,909,889 69,008,973 Large entities 21,197, , ,727-32,078-1,237,555 22,959,987 Small and medium-sized entities 26,502, , ,929 15,743 93, ,313 58, ,451 22,172 2,814,333 31,095,766 Micro entities and entrepreneurs 2,215,908 82,531 15,103 1, , ,456 10,761 1,552,175 4,280,556 Agricultural estates, farmers 5,141,306 66,677 19,352 3,590-43,780-69,370 24, ,539 5,673,750 Public companies 4,988, , ,998,914 Other customer loans and receivables 5,965, ,879 6,200,572 Total exposure at 114,212,219 2,223, , ,446 94,699 1,113,819 70,936 1,592, ,141 9,236, ,005,671 Per category of loans and receivables 114,212,219 2,223, , ,446 94,699 1,113,819 70,936 1,592, ,141 9,236, ,005,671 Performing loans and receivables 113,488,322 2,183, , , ,114 12,499 1,139 11, ,100,107 Of which: restructured loans 386,816 5, ,848 Non-performing loans and receivables 723,897 39,758 44,554 82,189 94, ,705 58,437 1,591, ,595 9,236,910 12,905,564 Of which: restructured loans 145,381 24,583 26,828 63, ,356 42, ,575 36,681 3,382,463 4,542,665 77
80 50. RISK MANAGEMENT (Continued) Credit Risk (Continued) Loans and Receivables (Continued) Credit Risk Exposures, Gross and Net, Presented per Customer Segment and Loan Category (Continued) b) Per impairment status and number of days past due (continued) Per customer segment Undue Up to 30 days past due Unimpaired days past due days past due Over 90 days past due Undue Impaired Up to 90 days past days days due past due past due Over 360 days past due Total Retail loans and receivables 10,592,854 85,597 75,963 54, ,408 18,557 7, , ,424 3,405,077 14,822,558 Housing loans 3,297,958 6,509 5,738 10, ,207 18,321 7,614 71, ,491 1,492,281 5,162,969 Consumer and cash loans 6,600,390 47,272 62,652 39, , ,798 1,197,614 8,160,995 Transaction account overdrafts and credit cards 510,090 31,013 6,965 2, ,505 10, ,593 1,212,012 Other receivables 184, ,297 15, ,506 1,162 80, ,582 Corporate loans and receivables 19,651,064 62,918 8,414 13,330 66, , ,647 30, ,520 9,091,380 29,831,182 Large entities 8,790,379 30, ,123-20,298-1,394,657 10,273,000 Small and medium-sized entities 6,696,449 7, ,543 2, ,669 41,473 2, ,999 4,477,582 11,671,201 Micro entities and entrepreneurs 1,035,151 2,588 3,128 1,284 6,858 75,550 82,174 1,383 96,944 2,924,013 4,229,073 Agricultural estates, farmers 878,985 22,500 5,003 4,503 56, ,204 16, ,187 1,254,712 Public companies 2,250, , ,941 2,403,196 Other customer loans and receivables 263, ,787 1,014,273 Total exposure at ,507, ,050 84,517 68, , , , , ,944 13,246,244 45,668,013 Per category of loans and receivables Performing loans and receivables 29,692, ,150 74,081 59, ,131 36,195 23,632 10,803 41,064 30,331,266 Of which: restructured loans 566,902 1,170 1, , ,485 Non-performing loans and receivables 814,713 5,900 10,436 9, , ,967 95, , ,141 13,205,180 15,336,746 Of which: restructured loans 295,798 2,642 6,715 6,153 15, ,234 87,623 76, ,449 3,896,834 4,964,927 78
81 50. RISK MANAGEMENT (Continued) Credit Risk (Continued) Loans and Receivables (Continued) Undue and unimpaired loans and receivables The Group improved the loan portfolio credit quality in 2017 as compared to 2016 by adequate loan monitoring, new loan approvals, portfolio sales and decisions on writeoff, which is evident in the increased volume of performing loans year on year. Performing loans Special watch loans Loans below average Doubtful loans Bad loans Total loans Collateral value Retail loans and receivables 48,178, ,855 54,607 4, ,380,571 14,590,124 Housing loans 16,102,809 5,601 8,756 1,314-16,118,480 14,369,349 Consumer and cash loans 29,812, ,423 43,640 2, ,990,268 67,986 Transaction account overdrafts and credit cards 1,861,475 5,190 1, ,868, Other receivables 401, , , ,727 Corporate loans and receivables 57,441,726 25,979 5,189 9, ,483 57,703,019 20,343,266 Large entities 18,787, ,171 68,760 18,857,701 5,884,471 Small and medium-sized entities 26,318,299 2,397 2,593 6, ,710 26,481,767 10,652,189 Micro entities and entrepreneurs 2,199,160 5,935-1, ,206, ,369 Agricultural estates, farmers 5,151,174 17,647 2, ,171,423 2,023,693 Public companies 4,985, ,985,323 1,256,544 Other customer loans and receivables 5,767, ,767,870 1,306,893 Total exposure at 111,387, ,834 59,796 14, , ,851,460 36,240,283 79
82 50. RISK MANAGEMENT (Continued) Credit Risk (Continued) Loans and Receivables (Continued) Undue and unimpaired loans and receivables (Continued) Performing loans Special watch loans Loans below average Doubtful loans Bad loans Total loans Collateral value Retail loans and receivables 10,590, ,075 51,516 26,021 33,230 10,820,874 3,197,452 Housing loans 3,299,075 7,254 10,454 24,569 27,125 3,368,477 3,019,942 Consumer and cash loans 6,598, ,766 37, ,739,719 7,219 Transaction account overdrafts and credit cards 508,961 8,748 1, , Other receivables 183,742 1,307 2, , , ,114 Corporate loans and receivables 19,043,244 15,734 3,053 12, ,687 19,249,898 8,775,945 Large entities 8,488, ,742 8,520,613 2,772,960 Small and medium-sized entities 6,415, ,221 6,558,697 3,057,026 Micro entities and entrepreneurs 1,007,859 1,249-2,461-1,011, ,249 Agricultural estates, farmers 884,704 14,485 3,053 8,264 1, , ,342 Public companies 2,246, ,246,789 2,079,368 Other customer loans and receivables 168, , Total exposure at ,801, ,809 54,569 38, ,917 30,239,235 11,974,295 80
83 50. RISK MANAGEMENT (Continued) Credit Risk (Continued) Loans and Receivables (Continued) Past due but unimpaired loans and receivables The gross amount of loans according to customer classes in default but not impaired was as follows: 0 days past due 1-30 days past due days past due days past due days past due days past due 1-5 years past due Maturing after 5 years Total Collateral value Retail loans and receivables 37,551 1,312, , , ,116, ,631 Housing loans 3, , , , , ,453 Consumer and cash loans 5,001 1,087, ,148 98, ,527,279 2,041 Transaction account overdrafts and credit cards 27,912 62,420 11,644 5, ,870 - Other receivables 1,555 1, , Corporate loans and receivables 2,394, , ,499 32, , ,560, ,406 Large entities 2,340, , ,355,925 15,012 Small and medium-sized entities 24, , ,905 15, , ,033, ,501 Micro entities and entrepreneurs 20,378 71,391 14,968 1, ,052 2,642 Agricultural estates, farmers 6,153 41,763 10, ,503 20,251 Public companies 3, ,166 - Other customer loans and receivables 197, , Total exposure at 2,629,499 2,108, , , , ,875, ,278 81
84 50. RISK MANAGEMENT (Continued) Credit Risk (Continued) Loans and Receivables (Continued) Past due but unimpaired loans and receivables (continued) 0 days past due 1-30 days past due days past due days past due days past due days past due 1-5 years past due Maturing after 5 years Total Collateral value Retail loans and receivables 33,056 5,044 4,137 3, ,854 46,555 18, ,909 83,626 Housing loans 3, ,712 39,090 18,369 73,848 73,547 Consumer and cash loans 2,698 2,001 2,900 2, , Transaction account overdrafts and credit cards 26,264 2, , Other receivables ,142 7,465-10,531 9,782 Corporate loans and receivables 446,902 35,896 3,530 10, ,654 8,709 43, , ,976 Large entities 269,789 30, ,309 1,029 Small and medium-sized entities 143,712 1, , , ,661 48,415 Micro entities and entrepreneurs 27, ,038 1, ,388 4,447 37,440 6,358 Agricultural estates, farmers 2,568 3,523 1,208 1,449-2,654 7,321 36,790 55,513 47,174 Public companies 3, ,311 - Other customer loans and receivables 95, ,980 - Total exposure at ,263 41,475 7,807 13, ,508 55,264 62, , ,602 82
85 50. RISK MANAGEMENT (Continued) Credit Risk (Continued) Loans and Receivables (Continued) Movements on the impaired loans and receivables Gross carrying value, beginning of year Gross carrying value of acquired entities Impairment reversed during the Impaired during the year year Of which: Of which: impaired impaired individually individually FX effect Other changes Gross carrying value, end of year Net carrying value, end of year Retail loans and receivables 3,876, , ,334 18,077 (985,524) (532,511) 47,669 20,287 4,298,992 1,710,743 Housing loans 1,720, , ,796 17,873 (573,732) (479,688) 45,294 (1,208) 1,959,271 1,078,010 Consumer and cash loans 1,411, , ,166 - (184,748) (6) 1,487 (866) 1,737, ,646 Transaction account overdrafts and credit cards 661,478 5,807 34, (172,619) (4,569) 54 22, ,349 97,360 Other receivables 83,257 1,431 20,104 - (54,425) (48,248) ,201 11,727 Corporate loans and receivables 10,029,050 1,254, , ,714 (4,365,478) (4,294,599) 3,172 (43,332) 7,745,605 3,325,145 Large entities 1,452, , (123,351) (123,203) (64,535) (17,418) 1,746, ,810 Small and medium-sized entities 4,956, , , ,495 (2,432,409) (2,409,220) 29,155 (22,431) 3,580,296 1,775,835 Micro entities and entrepreneurs 3,180, ,289 82,063 60,679 (1,610,224) (1,587,277) 29,507 (2,000) 1,965, ,748 Agricultural estates, farmers 286,969 67, ,845 50,779 (50,504) (25,950) 7,494 (1,483) 442, ,928 Public companies 153,096-4,768 4,696 (148,990) (148,949) 1,551-10,425 9,824 Other customer loans and receivables 749,830 37,834 15,961 15,618 (576,708) (574,186) 7,425 (186) 234,156 31,502 Total exposure at 14,655,655 2,106,962 1,408, ,409 (5,927,710) (5,401,296) 58,266 (23,231) 12,278,753 5,067,390 83
86 50. RISK MANAGEMENT (Continued) Credit Risk (Continued) Loans and Receivables (Continued) Movements on the impaired loans and receivables (continued) Gross carrying value, beginning of year Impaired during the year Of which: impaired individually Impairment reversed during the year Of which: impaired individually FX effect Gross carrying value, end of year Net carrying value, end of year Retail loans and receivables 3,765, , ,971 (353,857) (122,374) (14,466) 3,876, ,829 Housing loans 1,698, , ,704 (133,714) (105,121) (12,512) 1,720, ,156 Consumer and cash loans 1,295, ,998 - (143,858) - (1,009) 1,411,396 75,947 Transaction account overdrafts and credit cards 671,408 44, (54,233) (1,433) (22) 661,478 10,614 Other receivables 100,223 6,009 1,247 (22,052) (15,820) (923) 83,257 11,112 Corporate loans and receivables 13,265, , ,319 (4,142,929) (3,572,192) (20,340) 10,029,050 2,611,012 Large entities 1,908,485 9,854 8,082 (486,316) (480,601) 20,055 1,452, ,288 Small and medium-sized entities 7,020, , ,976 (2,328,277) (2,029,668) (23,028) 4,956,843 1,347,159 Micro entities and entrepreneurs 3,801, , ,874 (1,112,805) (890,541) (12,308) 3,180, ,494 Agricultural estates, farmers 276,970 56,548 16,879 (43,694) (557) (2,855) 286,969 74,140 Public companies 258,599 68,538 68,508 (171,837) (170,825) (2,204) 153, ,931 Other customer loans and receivables 629, , ,242 (250,423) (216,725) (4,419) 749, ,687 Total exposure at ,660,444 1,781,645 1,336,532 (4,747,209) (3,911,291) (39,225) 14,655,655 3,820,528 84
87 50. RISK MANAGEMENT (Continued) Credit Risk (Continued) Loans and Receivables (Continued) Non-performing and performing loans and receivables For additional monitoring of the asset quality, and in accordance with NBS Decision on Classification of Bank Balance Sheet Assets and Off-Balance Sheet Items and Guidelines for IAS 39, the Group classifies as non-performing loans and receivables that meet at least one of the following criteria: 1. The borrower is over 90 days past due in liability settlement per a single loan (except for settlement of liabilities per fees due to the Group, where days past due do not contaminate the other loans of the same borrower); 2. Based on the assessment of the financial situation (credit quality) of the borrower, the Group estimates that the borrower will not be able to settle the liabilities to the Group in full without collateral foreclosure, irrespective of the number of days past due in loan repayment; 3. The loan has been assessed for impairment and the impairment amount has been determined either through individual or group-level assessment; 4. The borrower is in the default status. The Group classifies loans and receivables into non-performing (NPL) and performing (PL) and the following tables present these in 2017 and 2016 per several criteria. Non-performing loans and receivables Total gross value Accumulated impairment allowances, total Gross value of NPLs Of which: restructured loans Accumulated impairment allowances of NPLs Share (%) of NPLs Collateral values per NPLs Retail loans and receivables 54,796,126 3,070,939 4,601, ,606 2,608, ,642,851 Housing loans 18,555,429 1,020,330 2,112, , , ,605,984 Consumer and cash loans 33,254,718 1,535,046 1,877, ,797 1,224, ,334 Transaction account overdrafts and credit cards 2,527, , , , Other receivables 458,748 41,988 52,721 16,311 39, ,533 Corporate loans and receivables 64,263,181 4,099,759 7,071,816 3,628,369 3,972, ,941,559 Industry sector A 4,219, , , , , ,790 Industry sectors B, C and E 20,747,095 2,248,168 3,475,144 2,245,306 2,194, ,956,029 Industry sector D 1,720,171 1, Industry sector F 4,608, , , , , ,526 Industry sector G 20,527, ,408 1,970, , , ,225,784 Industry sectors H, I and J 8,526, , , , , ,749 Industry sectors L, M and N 3,914, , , , , ,681 Other customer loans and receivables 10,946,364 1,170,950 1,232,244 32,690 1,088, ,308 Total exposure at 130,005,671 8,341,648 12,905,564 4,542,665 7,670, ,806,718 85
88 50. RISK MANAGEMENT (Continued) Credit Risk (Continued) Loans and Receivables (Continued) Non-performing and performing loans and receivables (Continued) Total gross value Accumulated impairment allowances, total Gross value of NPLs Of which: restructured loans Accumulated impairment allowances of NPLs Share (%) of NPLs Collateral values per NPLs Retail loans and receivables 14,822,558 3,130,763 4,118, ,355 3,040, ,188,038 Housing loans 5,162,969 1,007,590 1,860, , , ,149,183 Consumer and cash loans 8,160,995 1,395,698 1,482, ,857 1,339, Transaction account overdrafts and credit cards 1,212, , , , Other receivables 286,582 72, ,789 18,354 72, ,565 Corporate loans and receivables 26,439,898 7,131,355 9,928,408 4,255,892 7,068, ,778,210 Industry sector A 1,706, ,491 1,073, , , ,058 Industry sectors B, C and E 9,136,754 3,151,065 4,465,460 2,733,552 3,093, ,221,831 Industry sector D 153, Industry sector F 2,437, , , , , ,492 Industry sector G 8,997,004 2,115,098 2,717, ,864 2,112, ,291,383 Industry sectors H, I and J 3,197, , , , , ,815 Industry sectors L, M and N 811, , , , , ,631 Other customer loans and receivables 4,405,557 1,117,052 1,289,726 34,681 1,108, ,830 Total exposure at 45,668,013 11,379,170 15,336,746 4,964,928 11,217, ,214,078 Industry sector A Industry sectors B, C and E Industry sector D Industry sector F Industry sector G Industry sectors H, I and J Industry sectors L, M and N Electricity, gas, steam and air conditioning supply Construction industry Agriculture, forestry and fisheries Mining and quarrying, manufacturing and processing industry, water supply, waste water management, waste disposal control and similar activities Wholesale and retail trade and repair of motor vehicles and motorcycles Transport and storage, hotel and restaurant services, information and communications Real estate, professional, scientific and technical activities, arts, entertainment and leisure 86
89 50. RISK MANAGEMENT (Continued) Credit Risk (Continued) Loans and Receivables (Continued) Non-performing and performing loans and receivables (Continued) Movements on non-preforming loans Gross carrying value, beginning of year Gross carrying value of acquired entities New NPLs Total decrease Decrease in NPLs Of which: collected Of which: sold Of which: written off FX effect Other changes Gross carrying value, end of year Net carrying value, end of year Retail loans and receivables 4,118,612 1,021, ,160 (1,055,385) (367,952) - (555,794) 49,405 (6,635) 4,601,504 1,992,513 Housing loans 1,860, , ,631 (620,670) (165,404) - (363,192) 46,676 (14,748) 2,112,057 1,221,346 Consumer and cash loans 1,482, , ,088 (190,349) (143,984) - (12,742) 1,512 (12,279) 1,877, ,523 Transaction account overdrafts and credit cards 671,448 12,260 40,433 (185,696) (50,421) - (130,947) 55 20, , ,722 Other receivables 103,789 1,432 5,008 (58,670) (8,143) - (48,913) 1,162-52,721 12,922 Corporate loans and receivables 10,468,068 1,412, ,781 (4,378,048) (1,028,104) - (3,348,409) 3,808 (3,008) 8,069,574 3,211,116 Large entities 1,927, ,699 77,248 (334,809) (283,380) - (51,415) (64,506) 14 2,104, ,683 Small and medium-sized entities 4,859, , ,507 (2,228,697) (224,238) - (2,004,438) 28,148 (3,616) 3,548,614 1,624,148 Micro entities and entrepreneurs 3,201, ,570 54,022 (1,628,709) (355,003) - (1,273,555) 29, ,959, ,876 Agricultural estates, farmers 344, ,333 38,226 (54,718) (40,443) - (12,926) 9, , ,927 Public companies 134,160-2,778 (131,115) (125,040) - (6,075) 1,119-6,942 6,482 Other customer loans and receivables 750,066 40,575 16,125 (576,777) (419,039) - (157,492) 7,423 (2,926) 234,486 31,824 Total exposure at 15,336,746 2,474,895 1,056,066 (6,010,210) (1,815,095) - (4,061,695) 60,636 (12,569) 12,905,564 5,235,453 87
90 50. RISK MANAGEMENT (Continued) Credit Risk (Continued) Loans and Receivables (Continued) Non-performing and performing loans and receivables (Continued) Movements on non-preforming loans (Continued) Gross carrying value, beginning of year New NPLs Total decrease Decrease in NPLs Of which: collected Of which: sold Of which: written off FX effect Gross carrying value, end of year Net carrying value, end of year Retail loans and receivables 4,039, ,791 (366,284) (221,628) - (16,881) (16,570) 4,118,612 1,077,914 Housing loans 1,869, ,343 (140,978) (59,938) - (385) (14,393) 1,860, ,369 Consumer and cash loans 1,363, ,179 (145,148) (99,404) - (4,098) (1,024) 1,482, ,606 Transaction account overdrafts and credit cards 688,394 45,418 (62,343) (44,582) - (12,290) (21) 671,448 20,359 Other receivables 117,885 4,851 (17,815) (17,704) - (108) (1,132) 103,789 31,580 Corporate loans and receivables 13,461, ,698 (3,846,887) (1,963,053) (152,681) (1,730,892) (21,473) 10,468,068 2,647,657 Large entities 1,967, ,768 (261,487) (160,524) (123) (100,840) 20,071 1,927, ,302 Small and medium-sized entities 7,080,067 75,144 (2,272,271) (1,194,033) (138,867) (939,341) (23,039) 4,859,901 1,131,565 Micro entities and entrepreneurs 3,849, ,915 (1,132,937) (428,770) (13,679) (690,364) (12,651) 3,201, ,896 Agricultural estates, farmers 306,534 50,271 (8,343) (7,968) - (347) (3,649) 344, ,709 Public companies 258,614 49,600 (171,849) (171,758) (12) - (2,205) 134, ,185 Other customer loans and receivables 632, ,859 (247,046) (207,338) (4,415) (35,270) (4,420) 750, ,922 Total exposure at ,134,078 1,705,348 (4,460,217) (2,392,019) (157,096) (1,783,043) (42,463) 15,336,746 4,119,493 88
91 50. RISK MANAGEMENT (Continued) Credit Risk (Continued) Loans and Receivables (Continued) Non-performing and performing loans and receivables (Continued) Credit quality of performing loans and their collateral values Credit quality of performing loans Collateral value* High Medium Low Non-performing loans Performing loans Non-performing loans Retail loans and receivables 49,325, , ,876 4,601,504 14,873,769 1,642,851 Housing loans 16,165, ,319 92,983 2,112,057 14,652,540 1,605,984 Consumer and cash loans 30,813, , ,245 1,877,834 69,785 6,334 Transaction account overdrafts and credit cards 1,945,180 16,561 6, , Other receivables 402,213 2,764 1,050 52, ,382 30,533 Corporate loans and receivables 49,446,690 10,190,851 1,301,858 8,069,574 21,021,893 4,114,000 Large entities 17,968,885 2,872,196 14,580 2,104,326 5,899, ,294 Small and medium-sized entities 21,572,255 4,975, ,729 3,548,614 11,285,425 2,168,799 Micro entities and entrepreneurs 1,742, ,458 61,220 1,959, , ,614 Agricultural estates, farmers 3,658,222 1,487,302 78, ,783 2,037, ,394 Public companies 4,504, , ,886 6,942 1,258,037 3,899 Other customer loans and receivables 5,446, , ,486 1,307,134 49,867 Total exposure at 104,219,178 11,352,195 1,528,734 12,905,564 37,202,796 5,806,718 * Market or fair value up to the gross value of the impaired loan 89
92 50. RISK MANAGEMENT (Continued) Credit Risk (Continued) Loans and Receivables (Continued) Non-performing and performing loans and receivables (Continued) Credit quality of performing loans and their collateral values (Continued) Credit quality of performing loans Collateral value* High Medium Low Non-performing loans Performing loans Non-performing loans Retail loans and receivables 10,466, , ,618 4,118,612 3,129,318 1,188,038 Housing loans 3,209,969 6,959 85,622 1,860,419 2,962,473 1,149,183 Consumer and cash loans 6,546,031 96,403 35,605 1,482,956 7, Transaction account overdrafts and credit cards 528,785 9,402 2, , Other receivables 181, , ,442 38,565 Corporate loans and receivables 19,279,728 50,789 32,598 10,468,068 8,772,394 4,596,085 Large entities 8,315,017 30,303-1,927,680 2,581, ,140 Small and medium-sized entities 6,782, ,910 4,859,901 3,250,018 2,181,394 Micro entities and entrepreneurs 1,024,367 2, ,201, ,116 1,528,568 Agricultural estates, farmers 888,595 17,299 4, , , ,410 Public companies 2,269, ,160 2,098,304 49,573 Other customer loans and receivables 264, , ,955 Total exposure at ,010, , ,222 15,336,746 11,902,610 6,214,078 * Market or fair value up to the gross value of the impaired loan 90
93 50. RISK MANAGEMENT (Continued) Credit Risk (Continued) Loans and Receivables (Continued) Risk concentration in financial assets exposed to credit risk Risk concentration arises on the financial instruments with similar characteristics, which are affected in the similar way by the changes in economic and other circumstances. The following tables provide breakdown of the Group s exposures per category of loans and receivables, geographic region and industry sector. The Group classified its exposures per regions of the Republic of Serbia. Vojvodina Nonperforming Performing Belgrade Nonperforming Performing Sumadija and Western Serbia Nonperforming Performing Southern and Eastern Serbia Kosovo and Metohija Foreign countries Total Nonperforming Non- Non- Nonperforming Performing performing Performing performing Performing Performing Retail loans and receivables 18,638, ,892 14,442,657 1,713,077 11,044,659 1,326,787 6,020, ,960 32,735 7,191 15,181 4,597 50,194,622 4,601,504 Housing loans 5,703, ,043 6,143, ,264 3,453, ,970 1,118, ,188 10, ,526-16,443,372 2,112,057 Consumer and cash loans 11,957, ,550 7,647, ,620 7,160, ,071 4,588, ,552 21,802 5, ,376,884 1,877,834 Transaction account overdrafts and 1,968,339 credit cards 880, , , , , , , , , , ,892 Other receivables 96,602 3, ,962 14,900 24,680 24,070 9,781 9, ,027 52,721 Corporate loans and receivables 18,495,704 1,859,553 26,808,881 3,185,179 8,779,911 1,541,076 2,789, , ,893 59,740 57,191,365 7,071,816 Industry sector A 2,703,341 95, , , ,784 31,628 45,505 45, ,854, ,983 Industry sectors B, C and E 6,979, ,606 3,499,301 2,305,635 6,025, , , , ,271,951 3,475,144 Industry sector D 207, ,512, ,719, Industry sector F 1,723, ,050 1,832, , ,820 69, ,034 46, ,096, ,073 Industry sector G 5,429, ,962 10,123, ,387 1,785, ,778 1,218, , ,711 18,557,221 1,970,449 Industry sectors H, I and J 546, ,638 6,805,509 28, , , ,554 11, ,097, ,403 Industry sectors L, M and N 906,681 17,351 2,167, ,216 22, , ,576 15, ,403-3,594, ,401 Other customer loans and receivables 745, ,110 1,791, , , , , , ,811, ,931 9,714,120 1,232,244 Total exposure at ,879,979 3,124,555 43,043,180 5,094,216 20,045,172 3,055,135 8,954,800 1,216,183 33,079 7,207 7,143, , ,100,107 12,905,564 91
94 50. RISK MANAGEMENT (Continued) Credit Risk (Continued) Loans and Receivables (Continued) Risk concentration in financial assets exposed to credit risk Vojvodina Nonperforming Performing Belgrade Nonperforming Performing Sumadija and Western Serbia Nonperforming Performing Southern and Eastern Serbia Kosovo and Metohija Foreign countries Total Nonperforming Non- Non- Non- Performing performing Performing performing Performing performing Performing Retail loans and receivables 2,187, ,999 4,268,206 1,501,359 1,868,059 1,143,070 2,375, ,998 4,411 92, ,523 10,703,946 4,118,612 Housing loans 837, ,543 1,681, , , , ,532 92,974-86,555-10,174 3,302,550 1,860,419 Consumer and cash loans 1,166, ,376 2,360, ,153 1,315, ,516 1,831, ,804 4,138 4, ,678,039 1,482,956 Transaction account overdrafts and credit cards 73, , , ,697 72, , , , , , , ,448 Other receivables 110,396 7,996 42,633 59,872 18,566 24,836 11,195 10, , ,789 Corporate loans and receivables 4,817,667 2,278,985 7,598,614 4,180,036 3,216,067 2,416, , , , ,948 16,511,490 9,928,408 Industry sector A 40 12, , , ,747 1,591 87, ,530 1,073,447 Industry sectors B, C and E 883, ,412 1,196,944 2,433,581 2,468,244 1,042, , , ,671,294 4,465,460 Industry sector D 152, , Industry sector F 1,116, , ,129 81,165 86,720 92,254 18,757 66,961-24, ,602, ,508 Industry sector G 2,167, ,017 3,199, , , , , , ,948 6,279,898 2,717,106 Industry sectors H, I and J 102, ,513 2,156,163 45, , , ,383 34, ,647, ,776 Industry sectors L, M and N 394,076 56,550 34,013 82,890 1, ,522 94,314 19, , ,070 Other customer loans and receivables 942, ,870 1,495, , , , , , , ,712 3,115,831 1,289,726 Total exposure at ,948,316 3,414,854 13,361,832 5,875,002 5,226,079 3,738,186 3,358,080 1,698,850 4, , , ,183 30,331,267 15,336,746 92
95 50. RISK MANAGEMENT (Continued) Credit Risk (Continued) Loans and Receivables (Continued) Security instruments For additional asset quality monitoring, the following tables present quality of security instruments per several criteria: 1. per LTV ratio LTV ratio* Value of loans and receivables securitized with mortgages over real estate Below 50% 7,273,507 50% to 70% 6,128,420 70% to 90% 6,152,337 90% to 100% 2,297, % to 120% 1,826, % to 150% 1,878,934 Above 150% 6,163,954 Total at 31,720,341 Average LTV ratio *LTV ratio represents the gross value of loan/receivables relative to the market value of the real estate securitizing the loan/receivable LTV ratio* Value of loans and receivables securitized with mortgages over real estate Below 50% 4,162,029 50% to 70% 2,478,237 70% to 90% 3,411,747 90% to 100% 787, % to 120% 2,159, % to 150% 964,612 Above 150% 5,707,773 Total at ,670,751 Average LTV ratio *LTV ratio represents the gross value of loan/receivables relative to the market value of the real estate securitizing the loan/receivable 93
96 50. RISK MANAGEMENT (Continued) Credit Risk (Continued) Loans and Receivables (Continued) Security instruments (Continued) 2. per type and value of security instruments and guarantee issuers per customer segment and loan category Per customer segment Deposits Residential property Other property Types of security instruments* Guarantee** issuer Other assets Government Group Entity related to the borrower Total Retail loans and receivables 60,508 16,122, , ,516,620 Housing loans 8,870 15,999, , ,258,524 Consumer and cash loans 24,453 49,203 2, ,119 Transaction account overdrafts and credit cards Other receivables 27,123 74,257 80, ,915 Corporate loans and receivables 1,444,392 1,369,991 13,620,770 7,521, , ,306 49,378 25,135,893 Large entities - 45,616 4,398,292 2,146, ,590,781 Small and medium-sized entities 1,068,503 1,032,423 6,579,199 4,522, ,306 49,378 13,454,224 Micro entities and entrepreneurs 373, , ,877 16, ,521,268 Agricultural estates, farmers 2,011 86,820 1,466, , ,307,684 Public companies ,323 83, , ,261,936 Other customer loans and receivables 13,000 16,430 33,437 1,294, ,357,001 Total exposure at 1,517,900 17,509,117 13,987,620 8,815, , ,306 49,378 43,009,514 Per category of loans and receivables Performing loans and receivables 1,500,964 15,186,553 10,535,084 8,800, , ,306 49,378 37,202,796 Of which: restructured loans - 174, , ,458 Non-performing loans and receivables 16,936 2,322,564 3,452,536 14, ,806,718 Of which: restructured loans ,893 1,890,886 7, ,594,498 94
97 50. RISK MANAGEMENT (Continued) Credit Risk (Continued) Loans and Receivables (Continued) Security instruments (continued) 2. per type and value of security instruments and guarantee issuers per customer segment and loan category (continued) Per customer segment Deposits Types of security instruments* Guarantee** issuer Residential Entity related to the property Other property Government borrower Total Retail loans and receivables 45,787 4,005, , ,317,356 Housing loans 9,831 3,913, , ,111,656 Consumer and cash loans 7, ,501 Transaction account overdrafts and credit cards Other receivables 28,263 91,718 78, ,007 Corporate loans and receivables 920,067 1,157,358 9,216,905 1,950, ,616 13,368,479 Large entities 200,000 12,439 3,011, ,224,333 Small and medium-sized entities 469, ,295 4,058, ,616 5,431,413 Micro entities and entrepreneurs 250, ,466 1,462, ,968,684 Agricultural estates, farmers - 90, , ,173 Public companies - 18, ,407 1,950,533-2,147,876 Other customer loans and receivables , , ,853 Total exposure at ,752 5,199,706 9,876,081 1,950, ,616 18,116,688 Per category of loans and receivables Performing loans and receivables 748,250 3,128,026 5,952,185 1,950, ,616 11,902,610 Of which: restructured loans 2, , , ,003 Non-performing loans and receivables 218,502 2,071,680 3,923, ,214,078 Of which: restructured loans 200, ,444 2,026, ,837,259 * Market or fair value up to the gross value of the securitized loan ** Guarantee amount up to the gross value of the securitized loan 95
98 50. RISK MANAGEMENT (Continued) Credit Risk (Continued) Loans and Receivables (Continued) Security instruments (continued) Collaterals In accordance with the regulations and the internally adopted bylaws, the Group is under obligation to ensure a timely collateral valuation for loans approved. The fair values of the collaterals held by the Group are provided in the table below: Collateral type Number of collaterals held by the Group Appraised collateral value Mortgage liens 10,240 76,122,224 Deposits 572 2,623,748 Pledge liens ,398,839 Guarantees 25 5,020,455 Aggregate fair value of foreclosed collaterals is provided below: Restructured loans Year Fair value 703, ,824 Restructuring entails approval of concessions on repayment of individual loans and receivables due to borrower s financial difficulties, which would not otherwise be allowed, regardless of the maturity, impairment or default status of the receivables in accordance with the decision governing capital adequacy of banks, in at least one of the following ways: - modification of the original terms of the loan and/or receivable, particularly if the subsequently agreed terms of repayment are more favorable than the original terms (reduction of the interest rate, write-off of a portion pf the principal outstanding, entailing derecognition of that portion in the balance sheet assets, write-off of a portion of the accrued interest, release of a portion of the amount due, extension of the maturity of the principal and/or interest, etc.) or than the terms that would be approved to another borrower with the same or similar risk level at the time of the modification of terms; - refinancing of the loan where a new receivable is originated from a loan approved to settle a portion of or the entire amount of the borrower s liability to the Bank or another entity to which the receivable due from the borrower has been assigned. For better asset quality monitoring, the Group presents the following information on the restructured loans and receivables: 96
99 50. RISK MANAGEMENT (Continued) Credit Risk (Continued) Loans and Receivables (Continued) Restructured loans (Continued) 1. Breakdown of restructured loans Total gross carrying value Accumulated impairment allowances, total Restructured loans, gross Of which: nonperforming loans Accumulated impairment allowances, restructured loans Share (%) of restructured loans Collateral value securing restructured loans Retail loans and receivables 54,796,126 3,070,939 1,147, , , ,023 Housing loans 18,555,429 1,020, , , , ,745 Consumer and cash loans 33,254,718 1,535, , , , Transaction account overdrafts and credit cards 2,527, , Other receivables 458,748 41,988 17,335 16,311 10, ,202 Corporate loans and receivables 64,263,181 4,099,759 3,755,189 3,628,370 2,101, ,283,445 Industry sector A 4,219, , , ,429 60, ,658 Industry sectors B, C and E 20,747,096 2,248,168 2,245,308 2,245,307 1,453, ,247,808 Industry sector D 1,720,171 1, Industry sector F 4,608, , , , , ,154 Industry sector G 20,527, , , , , ,056 Industry sectors H, I and J 8,526, , , , , ,350 Industry sectors L, M and N 3,914, , , ,760 85, ,419 Other customer loans and receivables 10,946,364 1,170,950 32,689 32,689 25, ,488 Total exposure at 130,005,671 8,341,648 4,935,513 4,542,665 2,554, ,900,956 * Market or fair value up to the gross value of the securitized loan Total gross carrying value Accumulated impairment allowances, total Restructured loans, gross Of which: nonperforming loans Accumulated impairment allowances, restructured loans Share (%) of restructured loans Collateral value securing restructured loans Retail loans and receivables 14,822,558 3,130, , , , ,032 Housing loans 5,162,969 1,007, , , , ,046 Consumer and cash loans 8,160,995 1,395, , , , Transaction account overdrafts and credit cards 1,212, , Other receivables 286,582 72,409 20,146 18,354 3, ,800 Corporate loans and receivables 26,439,898 7,131,355 4,582,873 4,255,892 2,474, ,721,839 Industry sector A 1,706, , , , , ,118 Industry sectors B, C and E 9,136,754 3,151,065 2,798,736 2,733,552 1,790, ,528,082 Industry sector D 153, Industry sector F 2,437, , , , , ,555 Industry sector G 8,997,004 2,115, , , , ,663 Industry sectors H, I and J 3,197, , , , , ,655 Industry sectors L, M and N 811, , , ,641 78, ,766 Other customer loans and receivables 4,405,557 1,117,052 34,681 34,681 17, ,391 Total exposure at ,668,013 11,379,170 5,542,413 4,964,928 2,861, ,186,262 * Market or fair value up to the gross value of the securitized loan 97
100 50. RISK MANAGEMENT (Continued) Credit Risk (Continued) Loans and Receivables (Continued) Restructured loans (continued) 2. Movements on restructured loans Gross carrying value, beginning of year Carrying value, acquired entities Loans restructured during the year Ceased to be treated as restructured during the year Other changes Gross carrying value, end of year Net carrying value, end of year FX effect Retail loans and receivables 924, ,737 96,577 (293,689) 26, ,147, ,737 Housing loans 580, ,042 43,239 (212,431) 25,204 1, , ,884 Consumer and cash loans 324,002 99,695 53,223 (77,755) 478 (692) 398, ,578 Other receivables 20, (3,503) ,336 7,275 Corporate loans and receivables 4,308, ,040 93,448 (1,454,459) 34,535 (22,988) 3,642,965 1,659,772 Large entities 1,263, ,191 - (393,792) (1,509) (19,391) 1,326, ,794 Small and medium-sized entities 1,687, ,501 91,959 (563,070) 14,874 (2,326) 1,358, ,137 Micro entities and entrepreneurs 1,243,679-1,489 (395,785) 19, , ,880 Agricultural estates, farmers 9,662 77,348 - (1,378) 173 (1,271) 84,534 77,243 Public companies 103, (100,434) 1,119-3,900 3,718 Other customer loans and receivables 309, (170,344) 6, , Total exposure at 5,542,413 1,076, ,025 (1,918,492) 66,887 (22,097) 4,935,513 2,381,379 Gross carrying value, beginning of year Loans restructured during the year Ceased to be treated as restructured during the year FX effect Gross carrying value, end of year Net carrying value, end of year Retail loans and receivables 906, ,962 (89,188) (8,594) 924, ,161 Housing loans 569,549 51,825 (32,508) (8,155) 580, ,043 Consumer and cash loans 318,911 61,611 (56,299) (221) 324, ,915 Other receivables 18,219 2,526 (381) (218) 20,146 16,203 Corporate loans and receivables 4,419, ,369 (903,364) (18,886) 4,308,389 1,975,076 Large entities 966, ,814 (20,317) - 1,263, ,224 Small and medium-sized entities 1,912, ,452 (414,867) (8,882) 1,687, ,067 Micro entities and entrepreneurs 1,006, ,034 (51,093) (6,181) 1,243, ,810 Agricultural estates, farmers 10, (343) (151) 9,662 8,792 Public companies 523,631 - (416,744) (3,672) 103, ,183 Other customer loans and receivables 272,534 93,683 (54,459) (2,593) 309, ,670 Total exposure at ,598,483 1,021,014 (1,047,011) (30,073) 5,542,413 2,680,907 98
101 50. RISK MANAGEMENT (Continued) Credit Risk (Continued) Loans and Receivables (Continued) Restructured loans (continued) 3. Restructuring measures Interest rate decrease Repayment period Capitalization extension of arrears Refinancing Partial write-off Other measures Total Retail loans and receivables 65, , ,168 64, ,879 1,147,635 Housing loans 62, , ,121 27, , ,348 Consumer and cash loans 3, ,091 96,733 36,250-22, ,951 Other receivables - 2,134 12, ,888 17,336 Corporate loans and receivables 448,011 1,711,818 8,667 1,301,905 1, ,596 3,642,965 Large entities 447, , ,326,384 Small and medium-sized entities - 380, ,437 1, ,817 1,358,886 Micro entities and entrepreneurs , , ,261 Agricultural estates, farmers - 32,088 8, ,779 84,534 Public companies - 3, ,900 Other customer loans and receivables - 85,350-59, ,913 Total exposure at 513,695 2,272, ,835 1,425,709 1, ,475 4,935,513 Interest rate decrease Repayment period extension Capitalization of arrears Refinancing Other measures Total Retail loans and receivables - 232, ,370 74, , ,859 Housing loans - 78, ,308 35, , ,711 Consumer and cash loans - 150, ,887 39,128 26, ,002 Other receivables - 4,119 13,175-2,852 20,146 Corporate loans and receivables 16,506 2,301,494 9,662 1,688, ,298 4,308,389 Large entities - 1,126,620-20, ,967 1,263,885 Small and medium-sized entities 15, ,999-1,069, ,331 1,687,948 Micro entities and entrepreneurs , ,321-1,243,679 Agricultural estates, farmers - - 9, ,662 Public companies - 103, ,215 Other customer loans and receivables - 180, , ,165 Total exposure at ,506 2,714, ,032 1,891, ,772 5,542,413 99
102 50. RISK MANAGEMENT (Continued) Operational Risk Operational risk is the risk from potential adverse effects on the Group s financial result and capital due to (intentional or accidental) omissions or errors in the work of employees, inadequate internal procedures and processes, inadequate management of information and other systems in the Group, as well as due to unforeseen external events. Operational risk also includes legal risk. The process of operational risk management in the Group is on the following 4 pillars: a) collection of information on the operational risk events, b) operational risk identification and assessment, c) scenario analysis, and d) key risk indicators The main objective of operational risk management in the Bank members of the Group is to ensure that the level of operational risk exposure complies with the Group's risk management strategy and policies. Collection of information on the operational risk events The Group has a system in place for reporting from each of its organizational units, where reporting officers collect data on operational risk events occurred. Such events are reported through the internally developed operational risk database. There are limits set up for entry of the events into the operational risk database as well as for additional measures to address and overcome operational risks the Group is exposed to. The Group performs quarterly analyses of the operational risk events reported. Operational risk identification and assessment Operational risk identification and assessment are performed at least annually and entail a procedure where the Group s organizational units determine their participation in individual predefined processes in the Group and identify and assess operational risks they are exposed to. The main objective of the operational risk identification and assessment is to identify the operational risks the Group is exposed to and define additional measures for minimization of the Group s operational risk exposure. Scenario analysis Scenario analysis is performed once a year. The main purpose of the scenario analysis is to determine the Group s operational risk exposure based on the predefined scenarios, i.e., to determine the probability and potential financial effects of the occurrence of the said predefined scenarios. Scenario analysis is intended to encompass operational risks that are less likely to occur but produce greater potential negative financial effects. The analysis is also performed for definition of additional measures for addressing and overcoming operational risks. Key risk indicators The Group has developed a system of the key risk indicators used for monitoring of the Group s exposure to individual operational risks, with defined limits for such risks. The set up limits represent the tolerance thresholds for acceptance of operational risks. In case the set limits are exceeded, additional measures for addressing and overcoming of operational risks are defined. Business continuity plan (BCP) In order to ensure the continuity of operation, the Group's Board of Directors has adopted the Business Continuity Plan. The Group manages continuity of business operations based on the impact analysis and risk assessment. Its purpose is to minimize operational, financial, legal, reputational and other material consequences brought about by interruption of operations as well as to ensure functioning of the critical business functions and/or their restoration to use within predefined timelines and enable operations for at least a month afterwards. BCP allows for normal course of operations to be established in a reasonable time frame in the instances of significant unanticipated partial or full stoppage in business operations. The Group tests its BCP on a regular basis, at least annually. 100
103 50. RISK MANAGEMENT (Continued) Operational Risk (Continued) Externalization risk The Group manages externalization risk via assessments and established control mechanisms before executing contracts with third parties or suppliers of services and undertakes the necessary protective measures against the adverse effects of externalization risk on its operation and reputation. New product introduction risk The Group actively manages new product introduction inasmuch as its overall risk management system includes and actively manages all risks arising from the new product introduction. Information system risk The Group has developed a process of information system risk management which includes risk identification measurement, assessment, mitigation, monitoring and control. The Group manages the information system risk in such a manner that it allows for unhindered managing safety of this system, its functionality and continuity of the Group's operations. Among other matters, the Group pays special attention to the following IT risk areas: IT management, IT strategy, application, infrastructure, information, safety, support, suppliers, development, SLA and business connecting. Due to its significance, the Group has developed and performs methods of information system risk measurement Country Risk Country risk relates to the country of origin of the Group s counterparty, i.e., it represents a possibility of negative effects on the Group s financial result and capital due to its inability to collect receivables from abroad caused by political, economic and social conditions in the borrower s country of origin. The Group manages the country risk by analyzing the borrowers countries of origin, monitoring the credit ratings of these countries, setting up country risk exposure limits for certain countries and monitoring its exposures to certain countries and compliance with the limits set. Counterparty risk For the purpose of counterparty risk management, the Group performs counterparty analyses, sets up limits on counterparty exposures per type and maturity of products/arrangements. Counterparty exposures and compliance with the set up limits are monitored on a daily basis Investment Risks The Group's investment risks encompass risks associated with the Bank s equity investments in other legal entities and investments made in its own fixed assets, which are made and monitored in accordance with the regulations of the National Bank of Serbia Concentration Risk In accordance with the Bank's adopted procedures, the Risk Management Division monitors the concentration of the Group member Banks exposures to certain single legal entities or groups of related entities and entities related to the Group member Banks and ensures that such exposures are maintained within the limits defined by NBS. The Group member Banks exposure to a single entity or a group of related entities may not exceed 25% of the Group member Banks capital. The sum of the large Group member Banks exposures cannot exceed 400% of its capital. As of the Group did not exceed any of the prescribed limits. 101
104 51. CAPITAL MANAGEMENT The capital management framework is intended for provision of sufficient capital to support the Group in basic risk management and achievement of regulatory objectives and management's objectives regarding the credit rating. Capital management refers to the definition of the optimum capital the Group needs to maintain taking into account the existing quality of assets and future crediting strategies. The Group s Capital Management Plan defines and ensures the following: Effective capital planning taking into account the prescribed capital adequacy, risk profile and the Group s business objectives; Manner of achieving and maintaining adequate regulatory and internally available capital and capital adequacy ratios in order to secure feasible operations of the Group in the event of unexpected losses and avoid exceeding regulatory limits. As the Bank s regulator, the National Bank of Serbia defines and supervises compliance with the regulations on the Group member Banks regulatory capital and capital adequacy. In December 2016 the National Bank of Serbia adopted and issued regulations to introduce Basel III Standards in the Republic of Serbia effective as from June 30, The most significant novel stipulations of the Basel III Standards are as follows: Improvement of the capital quality and strengthening of the capital requirements; Introduction of the minimum standards for liquidity risk management and minimum liquidity ratios; Improvement of the risk management process to ensure adequate capital coverage of all risks; Introduction of the leverage ratio as an additional indicator of a bank s performance not based on the risk-weighted assets; and Introduction of a number of measures for creation of adequate capital buffers to be available in crisis periods. The Bank reports on the capital adequacy to the National Bank of Serbia on a quarterly basis. The Group monitors the capital adequacy ratios on a monthly basis. In accordance with Basel III Standards, the Group is required to calculate the following ratios: the common equity Tier 1 capital ratio, which represents the Bank s common equity capital relative to its total risk-weighted assets, expressed as a percentage; the core Tier 1 capital adequacy ratio, which represents the Group member Bank s core (Tier 1) capital relative to its total risk-weighted assets, expressed as a percentage; and the total capital adequacy ratio, which represents the Group member Bank s total capital relative to its total risk-weighted assets, expressed as a percentage. The Group member Bank is required to maintain its capital adequacy ratios listed above at the following minimum prescribed levels: the common equity Tier 1 capital ratio (CET 1 ratio) minimum of 4.5%; the core capital adequacy ratio (T1 ratio) minimum of 6%;and the total capital adequacy ratio (CAR) minimum of 8%. The Group is required to maintain the minimum amount of capital in RSD equivalent to EUR 10 million at the official middle exchange rate. The Group is required to maintain at all times its capital at a level required for covering all the risks to which it is exposed or may be exposed in its operations. The Group member Bank s regulatory capital is the sum of the core (Tier 1) capital and supplementary (Tier 2) capital, where the core (Tier 1) capital is comprised of the common equity Tier 1 capital (CET 1) and additional Tier 1 capital. 102
105 51. CAPITAL MANAGEMENT (Continued) The Group member Bank s regulatory capital elements and capital adequacy ratios are presented in the table below: REGULATORY CAPITAL Basel III Basel II Core capital Face value of shares paid in except for preferred cumulative shares 31,553,265 16,646,827 Share premium 2,563,562 2,563,562 Prior years accumulated losses (6,582,435) (7,025,913) Goodwill (93,765) - Intangible assets (715,231) (55,366) Unrealized losses on securities available for sale (2,524) (2,524) Regulatory adjustment of the common equity Tier 1 capital (33,347) - Deferred tax assets dependent on the future profitability (192,820) - Amount of the required reserve for estimated losses on the Bank s balance sheet assets and off-balance sheet items 1,409,791 (4,377,481) Common equity Tier 1 capital 25,086,914 - Additional Tier 1 capital - - Core capital Tier 1 25,086,914 7,764,881 Face value of preferred cumulative shares paid in 54,544 54,544 Portion of revaluation reserves - 25,020 Qualifying subordinated liabilities 129, ,277 Supplementary Tier 2 capital 184, ,841 Total deductible items - - Total common equity Tier 1 capital 25,086,914 - Total additional Tier 1 capital - - Total core capital Tier 1 25,086,914 7,764,881 Total supplementary Tier 2 capital 184, ,841 Total regulatory capital at December 31 25,271,375 8,043,722 Risk-weighted assets Risk-weighted credit risk exposures 105,710,068 3,576,694 Risk-weighted foreign exchange risk exposures 951,413 62,873 Risk-weighted market risk exposures 181,304 5,153 Risk-weighted operational risk exposures 20,348, ,044 Risk-weighted adjusted credit risk exposures 14,775 - Common Equity Tier 1 capital ratio (CET1 ratio) at December % - Tier 1 capital ratio (T1 ratio) at December % - Total capital adequacy ratio at December % 23.19% Total capital buffer requirements (%) 4.16% - 103
106 51. CAPITAL MANAGEMENT (Continued) As of the Banking Group achieved the following adequacy indicators in compliance with the regulations of the National Bank of Serbia, as provided in the table below: Amount of the Bank s capital Prescribed 2017 EUR 213,310 thousand 2016 EUR 65,146 thousand EUR 10 million Minimum 8 % (2016 minimum 12%) 19.87% 23.19% Total capital adequacy ratio Core capital Tier 1 ratio Minimum 6% 19.72% - Common equity Tier 1 capital ratio Minimum 4.5% 19.72% - The sum of the Bank's investments Maximum 60% 34.75% 21.94% Investments in non-fsi entities Maximum 10% 0.15% 0.15% Sum of all large Bank s exposures Maximum 400% 4.46% 88.83% Liquidity ratios at December 31 - quick liquidity ratio Minimum liquidity ratio Minimum Foreign exchange risk ratio Maximum 20% 4.64% 6.51% Exposure to a single entity/a group of related entities Maximum 25% 13.26% 20.30% The Group monitors and controls the above listed adequacy indicators prescribed by NBS at the Banking Group level on an ongoing basis. In 2017 as well as in 2016, the Group was in full compliance with the values of adequacy/performance indicators prescribed for the Banking Group. In accordance with NBS Decision on Consolidated Supervision of the Banking Group, the members of the Banking Group are FSI entities, i.e., the above presented calculation does not entail consolidation of OTP Service d.o.o., Beograd. Since there is no legally prescribed obligation for the said entity to calculate the above ratios, based on the accompanying consolidated financial statements including the Bank, Vojvođanska banka a.d. Novi Sad, OTP Lizing d.o.o. Beograd and OTP Investments d.o.o. Novi Sad, the Banking Group adequacy ratios are presented here. 52. FAIR VALUES OF THE FINANCIAL INSTRUMENTS Fair value is the price that would be received to sell an asset or paid to transfer a liability in an orderly transaction between market participants at the measurement date. Fair value is calculated based on the market information available as of the reporting date using valuation models. Methods, Assumptions and Valuation Techniques Used in Determining Fair Value Given the fact that the market of the Republic of Serbia is underdeveloped, in assessing the fair value of the financial instruments the Group used market and income approaches, i.e. information on similar financial instruments available on the market, such as the effective interest rate, maturity and sector classification. The Group uses the following hierarchy upon determining and disclosing the fair value of financial instruments: Level 1: quoted prices in active markets for identical assets or liabilities (unadjusted); Level 2: inputs observable for a given asset or liability either directly or indirectly that make use of information on the similar financial instruments present in active markets, quoted prices for identical or similar assets that are inactive or other market information from which the value of financial instrument can be derived (e.g. interest rates and yield curves observable in the usual quoted intervals); and Level 3: unobservable inputs for financial assets and liabilities used unless relevant observable inputs are available; the Group uses mark-to-model approach which deploys other than market information derived based on a theoretical model adequate for determining the value of financial instruments. In assessing the fair value of its financial instruments, the Group used Level 2 inputs. 104
107 52. FAIR VALUES OF THE FINANCIAL INSTRUMENTS (Continued) Financial instruments measured at fair value Financial assets available for sale are measured at fair value based on the available market inputs, i.e., using quoted market prices at the reporting date. If no such information is available, other valuation techniques are used to arrive at the fair value of these instruments. Upon assessing the fair value of the Treasury bills and Government bonds, the Group used valuation techniques that it believed were adequate in the circumstances and for which there were sufficient inputs available for fair value measurement. The Group made maximum use of the relevant observable inputs, minimizing the use of unobservable ones. The Group elected to apply the combined market and income approaches and based its fair value assessment on the Level 2 inputs. The fair values were determined based on: prices available at the primary/secondary market in the period under observation, which is considered relevant for trading in these securities (a two-week period); prices obtained for specific maturities. Fair value of currency swaps are calculated based on the discounting of the expected future cash flows. The Groupk uses market-prevailing interest rates for discounting the cash flows of financial instruments with the same remaining maturities. Financial instruments with far values approximate to their carrying values For highly liquid financial assets and liabilities with short-term maturities (up to a year) it is assumed that their carrying values approximate their fair values. This assumption is also used for demand deposits, savings deposits and financial assets and liabilities with market-adjusted prices (subject to repricing, products at variable interest rates). Financial instruments measured at other than fair value Far value of long-term financial assets and liabilities at fixed interest rates carried at amortized cost is assessed by comparing the market interest rates upon initial recognition to the current interest rates prevailing on the market for financial instruments with similar characteristics. The assessed fair values of deposits are based on the cash flows discounted using the interest rate prevailing on the money market for financial instruments with similar credit risk characteristics and maturities. The tables below present the fair values of financial instruments measured and recognized at fair value in the Group s financial statements: Level 1 Level 2 Level 3 Total Level 1 Level 2 Level 3 Total Financial assets Financial assets at fair value through profit and loss, held for trading - 178, ,303-26,295-26,295 Financial assets available for sale 90,829 19,705,740 1,168 19,809,266-2,876,703 1,168 2,877,871 Receivables per financial derivatives designated as risk hedging instruments Financial liabilities Financial liabilities at fair value through profit and loss, held for trading - 50,687-50,687-28,574-28,574 Liabilities per financial derivatives designated as risk hedging instruments In fair value assessment of the instruments that are measured at other than fair values but whose fair values are disclosed, whereby the fair values depart from the carrying value of instruments, the Group used as inputs official and easily verifiable data. 105
108 52. FAIR VALUES OF THE FINANCIAL INSTRUMENTS (Continued) Financial instruments measured at other than fair value (Continued) The Group obtained the inputs, i.e., data on the prevailing interest rates applicable to the contracts with similar characteristics, from the official website of the National Bank of Serbia, using: a) interest rates applied by banks to the retail/non-fsi loans per type, maturity and purpose newly approved loans as of, interest rates used by the competitor banks as inputs for assessment of fair values of loans and receivables due form customers; the Group classified such information as Level 2 inputs. b) interest rates applied by banks to the retail/non-fsi deposits, per maturity newly received deposits as of, interest rates used by the competitor banks as inputs for assessment of fair values of deposits and other liabilities to form customers; the Group classified such information as Level 2 inputs. In both cases where the Group determined departures form the fair values, the market approach was applied. The following tables provide comparison of the carrying values and fair values of the financial instruments. Non-financial assets and liabilities are not included: Level 1 Level 2 Level 3 Total Carrying value Cash and balances held with the central bank - 31,294,266-31,294,266 31,294,266 Pledged financial assets ,888 Financial assets held to maturity ,944 Loans and receivables due from banks and other financial institutions ,672,880 10,672,880 10,672,880 Loans and receivables due from customers ,721, ,721, ,731,018-31,294, ,393, ,688, ,758,996 Deposits and other liabilities due to banks, other financial institutions and the central bank ,024,471 20,024,471 20,024,471 Deposits and other liabilities due to customers ,656, ,656, ,640, ,680, ,680, ,665, Level 1 Level 2 Level 3 Total Carrying value Cash and balances held with the central bank - 7,968,557-7,968,557 7,968,557 Pledged financial assets 128, , ,849 Financial assets held to maturity , , ,166 Loans and receivables due from banks and other financial institutions - - 2,014,703 2,014,703 2,014,703 Loans and receivables due from customers ,098,934 32,098,934 32,095,962 Other assets , , ,222-8,097,406 34,597,025 42,694,431 42,691,459 Deposits and other liabilities due to banks, other financial institutions and the central bank - - 1,874,471 1,874,471 1,874,471 Deposits and other liabilities due to customers ,465,458 31,465,458 31,468,144 Subordinated liabilities , , ,413 Other liabilities , , , ,810,254 34,810,254 34,812,


109
110 Annual Report for 2017 Consolidated
111 Consolidated Annual Report for 2017 TABLE OF CONTENT 1. OTP Group OTP banka a.d. Novi Sad The macroeconomic environment and banking sector Development and financial position of OTP Bank in Serbia Risk management Plans for the future Corporate social responsibility and environmental protection Significant events after the end of the business year Organization of the Banking Group... 15
 investors.")

112 Consolidated Annual Report for OTP Group OTP Bank's privatization began in Currently the Bank is characterized by dispersed ownership of mostly private and institutional (financial) investors. OTP Group, as the key player in the banking market in Hungary and Central Europe, provides outstanding quality financial services to almost 15.1 million clients in nine countries. In the past few years, OTP Bank has completed several acquisitions, making itself a key player in the region. Besides Hungary, OTP Group currently operates in 8 countries of the region: Bulgaria (DSK Bank), Croatia (OTP Bank Croatia, Splitska banka), Romania (OTP Bank Romania), Serbia (OTP Bank Serbia, Vojvođanska banka a.d., Novi Sad), Slovakia (OTP Bank Slovensko), Ukraine (OTP Bank AD), Montenegro (Crnogorska komercijalna banka) and Russia (OAO OTP Bank). The predecessor of OTP Bank Plc (hereafter OTP Bank ), called the National Savings Bank (OTP Bank) was established in 1949 as a nation-wide, state-owned banking entity providing retail deposits and loans. First, it was authorized to enter into real estate transactions. Later, its role was extended to provide domestic foreign currency accounts and foreign exchange services; there was a subsequent diversification into providing banking services for Hungarian municipalities. Since 1989, the Bank has operated as a multi-functional commercial bank. In addition to continuing its previous retail and municipal activities, the Bank has been authorized to solicit corporate loan accounts and deposits, and to provide commercial loans and banking services for correspondent banking and export-import transactions. In 1990, the National Savings Bank became a public company with a share capital of HUF 23 billion. Its name was changed to the National Savings and Commercial Bank. Subsequently, non-banking activities were separated from the Bank, along with their supporting organizational units. 1
113 Consolidated Annual Report for OTP bank a.d. Novi Sad Corporate data OTP banka Srbija a.d., Novi Sad was officially formed on May 21, 2007 by merging three Serbian banks. On this date, the process of legal and operational collection of banks and the creation of a stable banking institution - OTP banka Srbija. OTP Bank from Budapest signed a contract for the purchase of Niška banka in December 2005, and in March 2006 it officially became the owner of Niška banka a.d. Niš. Takeover of the majority share package of Zepter banka a.d. Belgrade and purchase of Kulska banka, contracted in July, were successfully completed in October 2006 and December In August 2017, OTP Bank Serbia signed an agreement with the NBG Group to take over the sole (100%) ownership of Vojvođanska banka and NBG Lizing. On December 1, 2017, OTP Bank Serbia announced completion of the acquisition. OTP Bank Serbia and Vojvođanska banka will continue to operate independently until the spring of Until that period, the Bank will be equally committed to its clients, provision of high-quality services, realization of plans and achievement of positive results, and to the process of merging the two banks. OTP Bank Serbia and Vojvođanska banka are proud members of various business organizations and associations, including the Association of Serbian Banks, Chamber of Commerce and industry of Serbia, Belgrade Chamber of Commerce and industry, Regional Chamber of Commerce and industry of Novi Sad, Chamber of Commerce and industry of Vojvodina, American Chamber of Commerce, Forum for Responsible Businesses, Serbian Association of Economists, Association of Economists of Vojvodina, NALED, ACI Serbia, Belibor Panel, as well as the United Nations Global Compact in Serbia. Since June 2017, Vojvođanska banka has been a proud member of the "UNICEF Friends' Club". During 2017, OTP Bank Serbia continued to promote its socially responsible business in Serbia with its investment, because its corporate and social responsibility stems from a firm and deep conviction and the need to repay society for the given trust. The Vision of OTP Bank Serbia OTP banka Srbija a.d. Novi Sad endeavors to become one of the most reliable universal banks in Serbia by means of ensuring stable growth, efficient corporate governance and a strong commitment to social responsibility. The Bank builds its success on three pillars: staff professionalism, knowledge on the local and regional markets and conscious building of strong relationships with clients. The satisfaction of our clients, shareholders and employees is the major goal in all the Bank's activities. The Mission of OTP bank Serbia The Bank's mission is to provide a comprehensive scope of high-quality financial services to retail and corporate clients, as well as municipalities. Harmonized and improved practice within the Bank's management enables development of existing potentials, transparent and smart business operations and a proactive approach towards innovations. Continuous profitability growth and value increase for the shareholders represent the underlying measurement criteria for the Bank's success. The Bank's competitive advantage is based on the quality of its various services and its flexibility. The Bank relies on its employees' professional qualities and dedication. The employee performance is highly appreciated and rewarded by competitive benefits based on individual achievement and their professional development is supported by continuous education. 2
114 Consolidated Annual Report for The macroeconomic environment and banking sector Economic developments at the global level were better than expected, resulting in a revision of gross domestic product growth in the countries of the Euro Zone, Japan and developing countries. Growth in the Euro Zone, driven primarily by domestic demand, primarily for investment due to weaker monetary conditions, accelerated in the second quarter and continued such a move even in the third quarter of Due to the appreciation of the euro, the projection of inflation growth in the euro zone was revised downwards for 2018 and Economic activity continued its expansion in the second quarter with GDP growth of 0.7% yoy. Considering growth in most euro zone countries, it can be characterized as sustainable. A slightly slower pace of growth was recorded in Germany and Italy, while in France it was slightly accelerated compared to T1. GDP in the United States rose to T2, thanks to accelerated growth in private consumption and investment recovery, and to a lesser extent a positive contribution to net exports. Private consumption was the main driver of GDP growth in the countries of Central and Southeastern Europe as well. Most central banks kept interest rates at historically low levels. The Fed did not change the target range of the reference interest rate (1.00% %), but its balance has started to decline from October. Increased interest of foreign investors for investments in Serbia has contributed to the continuation of appreciation pressures on the domestic foreign exchange market. In 2017, the NBS Executive Board reduced the reference interest rate twice, which was further reflected in the decline in interest rates on the interbank money market and the price of government securities. Mitigation of monetary policy, a fall in country risk premium, increased competition among banks, growth in economic activity and recovery in the labor market, as well as low interest rates in the euro area contributed to the acceleration of credit activity to 5.0%, yoy, in September. After excluding the effect of write-offs of nonperforming loans in the last year, the yoy growth of total loans accelerated to 9.8%. The share of non-performing loans, calculated on gross basis, declined to 12.2% in September, the lowest level since January Positive fiscal developments continued in the third quarter, so that since the beginning of the year, a surplus of 2,6% of GDP was realized. When interest expenditures are excluded, at the general government level, a primary surplus of 5.8% of GDP was realized. Business and investment environment in Serbia has been significantly improved which was confirmed by the progress of Serbia on the World Bank's list of business conditions (Doing Business 2018) for the third year in a row - to the 43rd position. According to the latest World Economic Forum's Competitiveness Report, as in the previous year, Serbia has made the most progress within the macroeconomic environment indicator (by 31), mostly contributing to low and stable inflation, the reduction of the budget deficit, the increase in the share of national savings in GDP and a more favorable credit rating of the country. Following the inflation, Serbia maintained its first position in 2017, which it shares with 35 countries. Economic activity According to the National Bank projection, growth of the gross domestic product in 2017 should amount to about 2%, while in 2018 and 2019 it is expected to accelerate to about 3.5%. Private investments and growth of net exports contributed positively to growth, owing to the growth of exports and the reduction in imports, as well as the continued recovery in household consumption. Despite the good performance in the manufacturing industry, the growth of GDP has also contributed to the continuation of recovery in the mining and energy sector. 3

115 Consolidated Annual Report for 2017 Monetary policy * projections of the Ministry of Finance Inflation Since the beginning of 2017, inflation has moved within the target range of 3 ± 1.5%. Deceleration of inflation was largely due to lower year-on-year growth in energy and food prices, due to the effect of base effect on oil derivatives and meat. During the third quarter, both core and total inflation slowed down, more than expected. At the same time, the expectations of the financial sector and the economy are further reduced, which only indicates that inflationary pressures remain low. In addition, the effects of drought on inflation were lower than anticipated, and low inflation was also supported by lower import prices expressed in dinars. During 2017, the NBS reduced the key policy rate by 0.5%, taking into account the mid-term inflation projection, as well as new information and projections of economic development on the domestic and international market. The reference interest rate was last decreased in October to 3.5%. The decrease of the key policy rate was reflected in the decline in the average repo rate, or the drop in interest rates on the interbank market. Exchange rate The appreciation of the dinar was influenced by good export results, a high inflow of foreign direct investments, increased interest of foreign investors for investing in state dinar securities, relatively high purchase of effective foreign currency and growth of currency indexed assets of banks. In the course of 2017, in the end of October, the dinar strengthened against the euro, by 3.5%, and against the dollar by 14.3%. This effect is primarily due to the strengthening of the euro against the dollar. In the first half of 2018, inflation will be slowed down by a high base in the prices of oil derivatives and other products that increased at the beginning of 2017 on a one-off basis, which will cause inflation to be below the central target value. Growing prices of primary agricultural products and aggregate demand will work in the opposite direction. The risks of the inflation projection are symmetrical and relate to further developments in the global financial and commodity markets, and to a certain extent the growth of regulated prices. 4


116 Consolidated Annual Report for 2017 Fiscal deficit and current account deficit From the beginning of the year, ending with the third quarter of 2017, a surplus was achieved at the general government level of 82 billion dinars compared to the deficit of 4.3 billion dinars in the same period of the previous year. The quantitative criterion of the arrangement with the IMF for this period, according to the seventh revision of the arrangement, provided for the balanced fiscal outcome of the general government, and for the entire 2017 deficit to 1.1% of GDP. Excluding interest expenses, a surplus of 5.8% of GDP was achieved at the general government level. Compared to the same period of the previous year, total revenues were higher by 3.9% at September end. This is the result of the increase in income from corporate income tax due to the higher profitability of enterprises in the previous year, the more isolated social security contributions due to the recovery of the labor market, as well as the growth of revenues from value added tax due to more economic activity and better collection. Compared to the same period last year, expenditures were lower by 2.3% in real terms, thanks to lower repayment of interest rates. production capacities resulting from investments from previous years. External debt and public debt At the end of September 2017, the public debt of the central government amounted to EUR 24.1 billion, which is more than EUR 700 million less than at the end of The share of debt in the projected GDP amounted to 64.6%, versus 71.9% at the end of The largest portion of the public debt is still in foreign currency, of which 40.5% in euros, 31.4% in dollars, 22.3% in dinars, 3.3% in special drawing rights, 0.5% in Swiss francs and 2.1% in other currencies. The state budget of Serbia recorded a surplus of about 66.6 billion dinars for the first 9 months of Revenues amounted to billion dinars, while expenditures amounted to billion, according to preliminary data of the Public Debt Administration for Q Foreign trade In 2017, concluding with Q3, growth in exports of goods and services was recorded, and unlike Q1, imports of goods and services were reduced to Q3, resulting in a positive contribution to net exports to GDP growth of 0.7 pp. Strong external demand positively influenced the growth of domestic exports. The growth of exports was also favorable by the expansion of 5
. At the end of September 2017, the total net balance assets of the banking sector of Serbia amounted to RSD 3,293.")
117 Consolidated Annual Report for 2017 Banking sector At the end of the third quarter of 2017, the banking sector accounted for 30 banks with an organizational network of 1,671 business units in which 23,342 persons were employed (505 less in comparison with 2016). At the end of September 2017, the total net balance assets of the banking sector of Serbia amounted to RSD 3,293.3 billion, while the total capital was RSD billion. share in the total liabilities is 69.4%. Own sources of financing of banks amount to 20.1%, while received loans account for 7.1% of liabilities. Total deposits at the end of the third quarter amounted to RSD 2,286 billion, an increase of 2.7% from Q The share of foreign currency and foreign currency indexed deposits amounted to 69.1% in total deposits. Demand deposits continue to dominate in total deposits from 60.7%, while deposits with maturity up to 1 year account for 31.7% and deposits with maturity over 1 year account for only 7.6%. The net profit before tax of the banking sector in the first nine months of 2017 amounts to 53.5 billion dinars, representing a growth of 63.1% compared to the same period of the previous year. A positive result was recorded in 25 banks, in the total amount of 54.7 billion dinars, while 5 banks operated with a loss of 1.2 billion dinars. Total gross non-performing loans at the end of the third quarter of 2017 decreased by 67.9 billion dinars and at the end of September amounted to billion dinars. Changes in the key elements of the profitability of the banking sector (RSD mill) Change Net interest 93,162 91,713-2% Net fee 25,903 28,193 9% Loan loss 15,629 2,159-86% FX effect 6,501 5,750-12% Result 32,782 53,458 63% ROA in the third quarter amounted to 2.18% (0.7 percentage points more than in Q3 2016), while ROE was 11.01% (4.2 percentage points higher than 2016). At the end of the third quarter of 2017, total net loans of the banking sector of Serbia increased by 4.2% compared to the previous quarter. Foreign currency and foreign exchange indexed loans account for 69.1% of total loans. The primary source of financing of the banking sector in Serbia is still deposits received, whose At the end of the third quarter of 2017, the coverage of total gross NPL loans calculated by the estimated loss on balance sheet positions amounted to 127.2%, while 62.2% of the NPLs were covered by the corrections to the value of loans made in accordance with the International Financial Reporting Standards. The banking sector of Serbia still has significant surpluses of liquid assets. At the end of the third 6
. standards (8%). In the structure of regulatory capital, 95.6% occupies the share capital, while the additional capital; share is 4.4%. The banking sector of Serbia is adequately capitalized.")
118 Consolidated Annual Report for 2017 quarter of 2017, the average monthly liquidity indicator amounted to 2.21% (the prescribed minimum is 1%), while the narrow liquidity ratio was 1.84% (the prescribed minimum is 0.7%). standards (8%). In the structure of regulatory capital, 95.6% occupies the share capital, while the additional capital; share is 4.4%. The banking sector of Serbia is adequately capitalized. At the end of September 2017, the average value of capital adequacy indicators at the banking sector level was 22.46%, which is significantly above the regulatory minimum (12%) and the minimum according to Basel 7
119 Consolidated Annual Report for Development and financial position of OTP Bank in Serbia in RSD 000 PROFIT AND LOSS STATEMENT Net interest income 2,697,561 2,171,189 Net fee income 912, ,470 Operating expenses (4,013,656) (2,925,774) Gain from bargain purchase 6,659,138 - Protit/loss before tax 5,993, ,842 Profit/loss after tax 6,008, ,390 Adjusted net result* 2,440, ,390 BALANCE SHEET Cash and balances with the CB 31,294,266 7,968,557 Loans and receivables 118,403,898 34,110,665 Available-for-sale and held-to-maturity financial assets 20,140,184 3,110,332 Other assets 20,707,752 2,648,781 Total assets 190,546,100 47,838,335 Deposits and other liabilities toward banks, other financial institutions, central bank and other clients 152,665,203 33,342,615 Provisions 1,037, ,374 Subordinated liabilities 957, ,413 Other liabilities 2,199, ,204 Total obligations 156,858,946 35,111,606 Total equity 33,687,154 12,726,729 Total liabilities 190,546,100 47,838,335 Key performance indicators Capital adequacy ratio 19.9% 23.2% ROA (adjusted)* 3.9% 0.4% ROE (adjusted)* 16.9% 1.7% Number of employees 2, Total number of branches Market share 5.4%** 1.5% *the result and indicators for 2017 have been adjusted for gain from bargain purchase and costs related to the integration process **projection based on data for the banking sector for the third quarter of
120 Consolidated Annual Report for 2017 Total assets of the Bank amounted to RSD 190,546 million as of. OTP Bank became the sole (100%) owner of Vojvođanska banka and OTP Lizing on significantly increasing total assets on consolidated level. Estimated market share will be ~5,4% on consolidated level. RSD mln 4,000 3,000 2,000 1,000 Total interest income 2,751 2,511 3,045 The takeover process of Vojvođanska bank and OTP Lizing by the OTP Group during 2017 resulted in a one-time increase in expenditures (harmonization of the operations of Vojvođanska bank with the Group's standards and integration costs). On the other hand, on the consolidated level, revenue arose from the bargain purchase gain, resulting in a high positive business result. If these one-off revenues and expenditures were excluded, the Bank's profit would have amounted to RSD ~2,440 million. In 2017 the Bank aligned the capital adequacy calculation with Basel III standards and with the balance as of the capital adequacy ratio equaled 19.87%, which is above the minimum prescribed by the National Bank of Serbia (8%). Profit and loss statement In 2017, the Bank achieved a positive operating result (pre-tax and provisions, as well as without bargain purchase gains) at the consolidated level in the amount of RSD 154 million. Income Mitigation of monetary policy through the reference interest rate reflected in the decline of average repo rate as well as the decline in interest rates on the banking market. The market trend in the interest rate reduction affected decrease in the Bank's total interest income in 2017, but the effect was offset with increased revenues from the accumulated evidential interest in comparison to the previous year. 0 Interest income on loans and securities is the largest part of total interest income. Portfolio of securities in 2017 increased in average compared to 2016 which resulted in an increase in interest income from securities by ~31%. Interest income from loans recorded growth of 23% in 2017 compared to 2016 due to significant activities leading to increased sales of primarily cash loans. 8% 6% 7% 33% Fee and commission income in 2017 in the amount of RSD 1,181 million increased for 25% compared to This was primarily a result of the increase in income from payment transactions made by large clients (public enterprises, etc.). Expenses % 2% 40% Consumer and cash loans Small, middle and large entities Housing loans Micro, enterpreneurs and agriculture Overdraft and credit cards Public enterprises Other receivables Total interest expenses increased for 2% in 2017 compared to
121 Consolidated Annual Report for 2017 RSD mln Total interest expense RSD mln 25,000 20,000 15,000 10,000 5,000 0 Available for sales financial assets 19,798 2,878 1, The largest portion of interest expense relates to interest expense on deposits. Interest on term and savings deposits accounts for the largest share of interest expenses on deposits. Operating costs with the share of ~61% are the largest part of total operating expenses. Wages, salaries and other personal expenses account for 31% of total operating expenses, while depreciation costs account for 7%. Loans and receivables due from banks and other financial institutions Net loans and receivables due from banks and other financial institutions increased more than five times in 2017 in line with the increased level of activities of the Treasury Directorate on the market aiming to achieve greater profitability of total business. 61% 31% 7% Personal expenses Depreciation Other expenses RSD mln 15,000 10,000 5,000 Loans and receivables from banks and other financial institutions 3,263 2,015 10, Balance sheet With the takeover of Vojvođanska banka and OTP Lizing in 2017 the Bank increased its balance sheet assets approximately by four times on consolidated level, thus improving its position on the banking market (it is estimated that the consolidated bank will be among the six largest banks in Serbia). Available-for-sale financial assets The balance of available-for-sale financial assets as of was ~7 times higher compared to 2016 while the average volume of this type of securities was higher than in previous year. Loans and receivables due from customers The Bank increased the level of gross loans and receivables from customers in relation to the previous year by nearly three times on consolidated level. This is primarily due to the takeover of Vojvođanska banka and OTP Lizing by OTP Bank. The reduction in gross loans that has occurred in each bank is a consequence of the implementation of the Decision on the accounting write-off of balance sheet assets issued by the NBS. Non-performing loans 100% provisioned were transferred to off-balance sheet. 10
122 Consolidated Annual Report for 2017 RSD mln 120, ,000 80,000 60,000 40,000 20,000 Loans and receivables 115,070 41,340 42, ,731 29,025 32, % 1.3% 0.9% Saving deposits 0.5% Transaction deposits 14.8% Other deposits 43.3% Deposits based on given loans Special purpose deposits 37.4% Other financial liabilities Overnight deposits Liquidity and working capital loans and cash loans represent 29% of the gross loans each. Housing loans account for 16% of total loans at the consolidated level. Foreign currency deposits represent 58% of total customer deposits with the largest portion referring to FX term deposits of households. On the other side, RSD funds are mostly deposited by legal entities. 10.8% 2.2% 9.2% 3.2% 0.3% Liquidity and working capital loans 29.4% Cash loans Housing loans Other loans in RSD Investment loans 16.1% Import loans 28.8% Overdraft Other Gross customer loans to customer deposits ratio was 87% as of. Deposits As a result of the takeover of Vojvođanska banka and OTP Lizing by OTP Bank, the Bank increased the level of deposits in 2017 on consolidated level by approximately four times in comparison to the previous year. RSD mln 160, ,000 80,000 40,000 0 Total deposits of the Bank 152,665 20,024 30,671 33, ,641 2,220 1,874 28,451 31, Deposits and other liabilities toward banks, other financial organizations and the central bank Deposits and other liabilities toward other customers Transaction deposits represent 37% of the total customer deposits, while savings deposits accounting for the largest share of 43%. 11
123 Consolidated Annual Report for Risk management General framework Risk management activities at all organizational levels were guided by a value-sharing mission for shareholders by optimizing the yield and risk ratio, taking into account the interests of clients and employees in a way that is in line with best practice and in compliance with regulatory requirements, as well as with business strategy and policies of the Bank. With the support of OTP Group risk management bodies, the Bank has established a comprehensive risk management system that is in line with the Group's principles. The structure of risk management is organized in accordance with the provisions of the Law on Banks, the valid decisions of the National Bank of Serbia, which define the areas of risk management and capital adequacy of the Bank, as well as the provisions of the Bank's Risk Management Strategy. The Bank's risk management strategy sets the foundations on which the Bank builds a risk management culture (risk appetite, terminology, principles, policies and procedures and represents its relationship to risk management). The Bank has established and constantly improves the risk management system in order to adequately identify, evaluate, measure and monitor risk exposure in its operations. Through the risk management system, the Bank defines the objectives and principles of governance, as well as policies, methodologies and procedures. Risk management in the Bank, i.e. identification, measurement, assessment, monitoring and adoption of risk mitigation measures are carried out systematically and in accordance with the regulations. Risk management is currently taking place in each Bank separately with the aim to make detailed harmonization during the integration period, both between OTP and Vojvodjanska bank, as well as with the standards of the Group. 12
124 Consolidated Annual Report for Plans for the future The Bank defined the following strategic goals for the period : Successful implementation of integration process (OTP Bank, Vojvođanska banka and OTP Lizing); Increase in the market share - with the emphasis on maintaining a profitable and stable business model; Improving operational efficiency - with an emphasis on increasing the quality of the services provided to the customers. 13
125 Consolidated Annual Report for Corporate social responsibility and environmental protection The principles of the corporate social responsibility have been accepted throughout OTP Group, and since its arrival in Serbia, OTP Bank, as a member of an international group, has had the obligation and pleasure to observe the principles of corporate social responsibility and implement them in the course of its operations through a number of activities contributing to the life of the entire community it is active in and has become a part of. Through socially responsible projects, OTP Bank seeks to recognize the needs of the community it operates in and support socially important initiatives, such as cultural and sports events, healthcare advancement, environmental protection and numerous other projects. By such involvements it actively participates in the solution of critical social problems. By donating computer equipment, we have been able to improve the quality of work for many primary and secondary schools in Serbia. OTP Bank has also donated funds for the purchase of packages for children of socially vulnerable parents in Belgrade. The Bank has already traditionally provided scholarships for 15 students and thus contributed to the investment of young people and their development, and was also sponsored by the Cultural Center of the city of Novi Sad, the city where the head office is located and which will be the European Capital of Culture for OTP Bank sponsored the Kayak Association of Serbia in 2017, supported young athletes in the Red Star Chess Club, also supported the organization of the international handball tournament in Kanjiža and many other projects. During 2017, OTP Bank had numerous activities that showed a high degree of social responsibility. In the following period, the Bank will participate in numerous projects, with the aim of building a responsible company that promotes human relations, protects the environment and creates equal chances for all. During 2017, Vojvođanska banka continued to pursue its efforts to promote socially responsible business in Serbia. It is an integral part of its longterm business strategy. By establishing cooperation with stakeholders from the public and non-profit sector, the Bank tends to act directly toward problem solving, all in order to achieve the benefits for the community it operates in. During 2017, Vojvođanska banka signed the fifth consecutive sponsorship contract with the Olympic Committee of Serbia, in order to provide our athletes with the best possible conditions for preparations and performances at the Olympic Games competitions, the highlight of which will be the Olympic Games in Tokyo Since March 2016, Vojvođanska banka has been the general donor of the project for social inclusion of children without parental care "Be your own", implemented by the "Join" Foundation with the support of the Ministry of Labor, Employment, Veterans' Affairs and Social Affairs and the Ministry of Youth and Sports. Vojvođanska banka allocates funds for the implementation of this project on a monthly basis. In March 2017, Diplomacy & Commerce Magazine awarded Vojvodjanska banka the Business & Art Award for cooperation with the Gallery of Matica Srpska, while at the 170th anniversary of its founding in October 2017, the Gallery itself for the second time ranked Vojvodjanska banka among the "Friends of the Gallery of Matica Srpska". Since June 2017, Vojvođanska banka has been a proud member of the UNICEF Friends' Club. The Bank decided to allocate funds for the work of this important international organization in Serbia on a monthly basis. Also, the Bank has enabled its clients to help UNICEF themselves via the standing money transfer order service. The Bank has waived all fee earnings per such payments. As additional support to UNICEF in Serbia, Vojvođanska banka donated RSD 3 million to UNICEF's "Sports for All" program in December 2017, which will be used for the implementation of this project in 3 municipalities in Serbia. 14

126 Consolidated Annual Report for Significant events after the end of the business year There were no significant events and additional information after the reporting date that would require adjustment to or disclosures in the financial statements at the consolidated level for Organization of the Banking Group Consolidated financial statements include standalone financial statements of OTP banka Srbija a.d., Novi Sad, and financial statements of its subsidiaries: Vojvođanska banka a.d. Novi Sad, OTP Investments d.o.o. Novi Sad and OTP Lizing d.o.o. Beograd. The Bank, as the parent company of subsidiaries, prepares consolidated financial statements. Vojvođanska banka a.d. Novi Sad, started its business in 1868 as a credit union when the first branch in Sombor was opened. The name Privredna banka, which was years old, was changed in 1973 to Vojvođanska banka. The Bank changed its legal form into a joint-stock company in 1995 and became Vojvođanska banka a.d. Novi Sad. The Company s core business activity is factoring and consulting. The Bank's holds a 100% equity interest therein. The Company has a current account opened and an earmarked deposit placed with the Bank. The Bank leases out business premises and vehicles to the Company and earns rental income in this respect. The Chairman of the Supervisory Board of OTP Investment is a member of the Executive Board of the Bank. OTP Lizing d.o.o., Beograd is a limited liability company. The main activity of the company is financial leasing. OTP Lizing d.o.o., Beograd was registered with the Commercial Court in Belgrade under the name TBI Lizing doo in December The founder was TBIF Financial Services B.V. Amsterdam, with a sole (100%) equity stake. TBI Lizing doo started its operations in The next change of founders and change of name was registered in 2007 when the National Bank of Greece became the sole owner of NBG Lizing. On December 1, 2017, OTP Bank purchased a 100% equity interest in OTP Lizing. Organizational chart of the Banking Group: At the end of 2006, Vojvođanska banka was acquired by the National Bank of Greece Group and in 2008 the National Bank of Greece, which operated under that name in the Serbian market, was joined to Vojvođanska bank ad. Novi Sad. On December 1, 2017, OTP Bank Serbia announced completion of the acquisition of 100% ownership of Vojvođanska banka, which thus became a member of the OTP Group. Subsidiary OTP Investments d.o.o. Novi Sad is a legal successor of KB-NS Investments d.o.o. KB- NS Investments d.o.o. was established by the Decision on Incorporation on January 19, 2006 as a limited liability company. The Company was registered with the Serbian Business Registers Agency in Novi Sad under Decision no. BD /
VOJVOĐANSKA BANKA A.D., NOVI SAD. Financial Statements Year Ended December 31, 2017 and Independent Auditors Report
 VOJVOĐANSKA BANKA A.D., NOVI SAD Financial Statements Year Ended December 31, 2017 and Independent Auditors Report VOJVOĐANSKA BANKA A.D., NOVI SAD CONTENTS Page Independent Auditors' Report 1 Financial
OTP BANKA SRBIJA A.D., NOVI SAD. Consolidated Financial Statements Year Ended December 31, 2014 and Independent Auditors Report
 Consolidated Financial Statements Year Ended 2014 and Independent Auditors Report CONTENTS Page Independent Auditors' Report 1 Consolidated Financial Statements: Consolidated Income Statement 2 Consolidated
UNICREDIT BANK SRBIJA A.D., BEOGRAD. Consolidated Financial Statements Year Ended December 31, 2017 and Independent Auditors Report
 UNICREDIT BANK SRBIJA A.D., BEOGRAD Consolidated Financial Statements Year Ended December 31, 2017 and Independent Auditors Report Translation of the Auditors Report issued in the Serbian language UNICREDIT
KOMERCIJALNA BANKA A.D., BEOGRAD. Financial Statements Year Ended December 31, 2014 and Independent Auditors Report
 KOMERCIJALNA BANKA A.D., BEOGRAD Financial Statements Year Ended and Independent Auditors Report KOMERCIJALNA BANKA A.D., BEOGRAD CONTENTS Page Independent Auditors' Report 1 Financial Statements: Balance
ERSTE BANK A.D. NOVI SAD. UNCONSOLIDATED FINANCIAL STATEMENTS AND NOTES TO THE UNCONSOLIDATED FINANCIAL STATEMENTS Year Ended December 31, 2015
 ERSTE BANK A.D. NOVI SAD UNCONSOLIDATED FINANCIAL STATEMENTS AND NOTES TO THE UNCONSOLIDATED FINANCIAL STATEMENTS Year Ended December 31, CONTENTS Page Independent Auditors' Report 1 Income Statement for
Financial Statements. and Independent Auditors Report
 KOMERCIJALNA BANKA A.D., BEOGRAD Financial Statements Year Ended and Independent Auditors Report KOMERCIJALNA BANKA A.D., BEOGRAD CONTENTS Page Independent Auditors' Report 1-2 Income Statement 3 Statement
KOMERCIJALNA BANKA A.D., BEOGRAD. Unconsolidated Financial Statements Year Ended December 31, 2015 and Independent Auditors Report
 KOMERCIJALNA BANKA A.D., BEOGRAD Unconsolidated Financial Statements Year Ended and Independent Auditors Report KOMERCIJALNA BANKA A.D., BEOGRAD CONTENTS Page Independent Auditors' Report 1 Financial Statements:
NOTES TO THE CONSOLIDATED FINANCIAL STATEMENTS
 OTP banka Srbija a.d. Novi Sad NOTES TO THE CONSOLIDATED FINANCIAL STATEMENTS December 31, 2010 Consolidated legal entites: - OTP banka Srbija a.d. Novi Sad - OTP Investments d.o.o. Novi Sad Novi Sad,
OTP BANKA SRBIJA A.D., NOVI SAD. Consolidated Financial Statements of the Banking Group. Year Ended December 31, 2017 and Independent Auditors Report
 OTP BANKA SRBIJA A.D., NOVI SAD Consolidated Financial Statements of the Banking Group Year Ended December 31, 2017 and Independent Auditors Report Translation of the Auditors Report issued in the Serbian
We believe that the audit evidence we have obtained is sufficient and appropriate to provide a basis for our audit opinion.
 ABCD KPMG d.o.o. Beograd Kraljice Natalije 11 11000 Belgrade Serbia Telephone: Fax: E-mail: Internet: +381 11 20 50 500 +381 11 20 50 550 info@kpmg.rs www.kpmg.rs Independent Auditors Report TO THE SHAREHOLDERS
SRPSKA BANKA A.D., BEOGRAD. Financial Statements For the Year Ended December 31, 2010 and Independent Auditors Report
 Financial Statements For the Year Ended and Independent Auditors Report CONTENT Page Independent Auditors' Report 1 Financial Statements: Income Statement 2 Balance Sheet 3 Statement of Changes in Equity
mts banka a.d. BELGRADE Financial Statements as of and for the Year Ended 31 December 2016 and Independent Auditor s Report
 mts banka a.d. BELGRADE Financial Statements as of and for the Year Ended 31 December 2016 and Independent Auditor s Report mts banka a.d. Belgrade CONTENTS Page INDEPENDENT AUDITOR S REPORT 1-2 FINANCIAL
BANCA INTESA A.D. BEOGRAD
 FINANCIAL STATEMENTS FOR THE YEAR ENDED 31 DECEMBER 2011 TABLE OF CONTENTS PAGE INDEPENDENT AUDITOR S REPORT 1 INCOME STATEMENT 2 BALANCE SHEET 3 STATEMENT OF CHANGES IN EQUITY 4 CASH FLOW STATEMENT 5-6
Management s Responsibility for the Separate Financial Statements
 kpmg KPMG d.o.o. Beograd Kraljice Natalije 11 11000 Belgrade Serbia Independent Auditors Report Tel.: +381 (0)11 20 50 500 Fax: +381 (0)11 20 50 550 www.kpmg.com/rs T R A N S L A T I O N TO THE SHAREHOLDERS
 NOTES TO THE CONSOLIDATED FINANCIAL STATEMENTS FOR THE YEAR ENDED 31 December 2015 1. THE ESTABLISHMENT AND OPERATIONS These financial statements are consolidated financial statements of Credit Agricole
KOMERCIJALNA BANKA A.D., BEOGRAD. Consolidated Financial Statements For the Year Ended December 31, 2010 and Independent Auditors Report
 Consolidated Financial Statements For the Year Ended and Independent Auditors Report CONTENT Page Independent Auditors' Report 1 Consolidated Financial Statements: Consolidated Income Statement 2 Consolidated
KOMERCIJALNA BANKA A.D., BEOGRAD. Consolidated Financial Statements Year Ended December 31, 2015 and Independent Auditors Report
 Consolidated Financial Statements Year Ended and Independent Auditors Report CONTENTS Page Independent Auditors' Report 1 Consolidated Financial Statements: Consolidated Consolidated Statement of Financial
JUBMES BANKA AD, BELGRADE. Financial Statements for the year ended 31 December 2015 and Independent Auditor s Report
 JUBMES BANKA AD, BELGRADE Financial Statements for the year ended 31 December 2015 and Independent Auditor s Report This is a translation of the original Independent Auditors Report issued in the Serbian
BANCA INTESA a.d. BELGRADE. Separate Financial Statements as of and for the Year Ended 31 December 2017 and Independent Auditor s Report
 Separate Financial Statements as of and for the Year Ended 31 December 2017 and Independent Auditor s Report CONTENTS Page INDEPENDENT AUDITOR S REPORT 1-2 SEPARATE FINANCIAL STATEMENTS Separate Balance
Management s Responsibility for the Financial Statements
 kpmg KPMG d.o.o. Beograd Kraljice Natalije 11 11000 Belgrade Serbia Independent Auditors Report Tel.: +381 (0)11 20 50 500 Fax: +381 (0)11 20 50 550 www.kpmg.com/rs TO THE SHAREHOLDERS OF HALKBANK A.D.
JUBMES BANKA AD, BELGRADE. Financial Statements for the year ended 31 December 2017 and Independent Auditor s Report
 JUBMES BANKA AD, BELGRADE Financial Statements for the year ended 31 December 2017 and Independent Auditor s Report This is a translation of the original Independent Auditors Report issued in the Serbian
Consolidated Financial Statements. Independent Auditors Report
 KOMERCIJALNA BANKA A.D., BEOGRAD Consolidated Financial Statements Year Ended and Independent Auditors Report CONTENTS Page Independent Auditors' Report 1-2 Consolidated Financial Statements: Consolidated
KOMERCIJALNA BANKA A.D., BEOGRAD. Financial Statements For the Year Ended December 31, 2010 and Independent Auditors Report
 Financial Statements For the Year Ended and Independent Auditors Report CONTENT Page Independent Auditors' Report 1 Financial Statements: Income Statement 2 Balance Sheet 3 Statement of Changes in Equity
UNICREDIT BANK A.D., BANJA LUKA
 UNICREDIT BANK A.D., BANJA LUKA Financial statements Year ended December 31, and Independent Auditors Report Translation of the Auditors Report issued in the Serbian language Table of Contents Page Independent
UNIVERZAL BANKA A.D. BEOGRAD
 UNIVERZAL BANKA A.D. BEOGRAD FINANCIAL STATEMENTS FOR THE YEAR ENDED 31 DECEMBER 2009 Univerzal banka a.d. Beograd TABLE OF CONTENTS Page Independent Auditors Report 1 Income statement 2 Balance sheet
ERSTE BANK A.D., NOVI SAD FINANCIAL STATEMENTS FOR THE YEAR ENDED 31 DECEMBER 2014
 FINANCIAL STATEMENTS FOR THE YEAR ENDED 31 DECEMBER 2014 ERSTE BANK a.d. NOVI SAD CONTENT Page Independent Auditors' Report 1 Income statement for the year ended 31 December 2014 2 Statement of comprehensive
Financial statements and Independent Auditor's Report. Ohridska Banka A.D., Ohrid. 31 December 2009
 Financial statements and Independent Auditor's Report Ohridska Banka A.D., Ohrid 31 December 2009 Contents Page Independent Auditors Report 1 Income statement 3 Statement of comprehensive income 4 Statement
Independent Auditor's report 1. Income Statement 2. Balance Sheet 3. Cash Flow Statement 4-5. Statement of Changes in Equity 6
 FINANCIAL STATEMENTS FOR THE PERIOD FROM 1 JANUARY TO 31 DECEMBER 2007 CONTENTS Independent Auditor's report 1 Income Statement 2 Balance Sheet 3 Cash Flow Statement 4-5 Statement of Changes in Equity
FOR THE YEAR ENDED 31 DECEMBER
 CONSOLIDATED FINANCIAL STATEMENTS IN ACCORDANCE WITH INTERNATIONAL FINANCIAL REPORTING STANDARDS AS ADOPTED BY THE EUROPEAN UNION AND INDEPENDENT AUDITORS REPORT FOR THE YEAR ENDED 31 DECEMBER 2017 CONSOLIDATED
ERSTE BANK A.D. NOVI SAD. SEPARATE FINANCIAL STATEMENTS AND NOTES TO THE SEPARATE FINANCIAL STATEMENTS Year Ended December 31, 2016
 ERSTE BANK A.D. NOVI SAD SEPARATE FINANCIAL STATEMENTS AND NOTES TO THE SEPARATE FINANCIAL STATEMENTS Year Ended December 31, 2016 ERSTE BANK a.d., NOVI SAD CONTENTS Page Independent Auditors' Report 1
INDEPENDENT AUDITOR S REPORT AND FINANCIAL STATEMENTS FOR THE PERIOD ENDING 31 DECEMBER 2013 (According IFRS) Skopje, March 2014
 Skopje, March 2014") INDEPENDENT AUDITOR S REPORT AND FINANCIAL STATEMENTS FOR THE PERIOD ENDING 31 DECEMBER 2013 (According IFRS) Skopje, March 2014 These reports are translation from the official ones issued on macedonian
INDEPENDENT AUDITOR S REPORT AND FINANCIAL STATEMENTS FOR THE PERIOD ENDING 31 DECEMBER 2013 (According IFRS) Skopje, March 2014 These reports are translation from the official ones issued on macedonian
OTP Bank Annual Report. Financial Statements
 OTP Bank Annual Report Financial Statements 2017 89 90 OTP Bank Annual Report 2017 IFRS consolidated financial statements 91 92 OTP Bank Annual Report 2017 IFRS consolidated financial statements 93 94
THE LIMITED LIABILITY COMPANY FOR FINANCE LEASE INTESA LEASING d.o.o. BELGRADE
 THE LIMITED LIABILITY COMPANY FOR FINANCE LEASE INTESA LEASING d.o.o. BELGRADE Financial Statements as of and for the Year Ended 31 December 2017 and Independent Auditor s Report CONTENTS Page INDEPENDENT
YFY Inc. and Subsidiaries
 YFY Inc. and Subsidiaries Consolidated Financial Statements for the Three Months Ended 2018 and and Independent Auditors Review Report INDEPENDENT AUDITORS REVIEW REPORT The Board of Directors and Shareholders
KOMERCIJALNA BANKA AD SKOPJE. Separate Financial Statements and Independent Auditors Report for the year ended December 31, 2017
 Separate Financial Statements and Independent Auditors Report for the year ended CONTENTS Page Independent Auditors Report Separate Statement of Profit and Loss and Other Comprehensive Income 1 Separate
TAIPEI FUBON COMMERCIAL BANK Co., Ltd. and Subsidiaries
 TAIPEI FUBON COMMERCIAL BANK Co., Ltd. and Subsidiaries Consolidated Financial Statements for the Six Months Ended and 2015 and Independent Auditors Report TAIPEI FUBON COMMERCIAL BANK CO., LTD. AND SUBSIDIARIES
KOMERCIJALNA BANKA AD SKOPJE. Consolidated financial statements and Independent Auditors Report For the year ended December 31, 2017
 Consolidated financial statements and Independent Auditors Report For the year ended CONTENTS Page Independent Auditors Report Consolidated statement of profit or loss and other comprehensive Income 1
Financial statements and Independent Auditors Report. TTK Banka AD Skopje. 31 December 2010
 Financial statements and Independent Auditors Report TTK Banka AD Skopje 31 December 2010 This is an English translation of the original Report issued in Macedonian, in case of any discrepancies between
SERBIAN EXPORT AND INSURANCE AGENCY j.s.c., UŽICE. Restated Financial Statements for the Year Ended 31 December 2013 and Independent Auditor s Report
 SERBIAN EXPORT AND INSURANCE AGENCY j.s.c., UŽICE Restated Financial Statements for the Year Ended 31 December 2013 and Independent Auditor s Report This version of our report/ the accompanying documents
POSCO Separate Financial Statements December 31, 2017 and (With Independent Auditors Report Thereon)
") Separate Financial Statements December 31, 2017 and 2016 (With Independent Auditors Report Thereon) Table of Contents Page Independent Auditors Report... 1 Separate Financial Statements Separate Statements
Separate Financial Statements December 31, 2017 and 2016 (With Independent Auditors Report Thereon) Table of Contents Page Independent Auditors Report... 1 Separate Financial Statements Separate Statements
We believe that the audit evidence we have obtained is sufficient and appropriate to provide a basis for our audit opinion.
 ABCD KPMG d.o.o. Beograd Kraljice Natalije 11 11000 Belgrade Serbia Telephone: Fax: E-mail: Internet: +381 11 20 50 500 +381 11 20 50 550 info@kpmg.rs www.kpmg.rs Independent Auditors Report TO THE OWNERS
UNIVERZAL BANKA a.d. Beograd FINANCIAL STATEMENTS FOR THE YEAR ENDED 31 DECEMBER 2007
 UNIVERZAL BANKA a.d. Beograd FINANCIAL STATEMENTS FOR THE YEAR ENDED 31 DECEMBER 2007 TABLE OF CONTENTS Independent Auditors Report 1 Income statement 2 Balance sheet 3 Cash Flow Statement 4 Statement
UNIVERSAL INVESTMENT BANK AD - Skopje. INDEPENDENT AUDITOR S REPORT AND FINANCIAL STATEMENTS FOR THE PERIOD ENDING 31 DECEMBER 2017 (According IFRS)
") UNIVERSAL INVESTMENT BANK AD - Skopje INDEPENDENT AUDITOR S REPORT AND FINANCIAL STATEMENTS FOR THE PERIOD ENDING 31 DECEMBER 2017 (According IFRS) Skopje, March 2018 Universal Investment Bank, AD Skopje
UNIVERSAL INVESTMENT BANK AD - Skopje INDEPENDENT AUDITOR S REPORT AND FINANCIAL STATEMENTS FOR THE PERIOD ENDING 31 DECEMBER 2017 (According IFRS) Skopje, March 2018 Universal Investment Bank, AD Skopje
NALCOR ENERGY MARKETING CORPORATION FINANCIAL STATEMENTS December 31, 2017
 FINANCIAL STATEMENTS December 31, 2017 Deloitte LLP 5 Springdale Street, Suite 1000 St. John's NL A1E 0E4 Canada Tel: (709) 576-8480 Fax: (709) 576-8460 www.deloitte.ca Independent Auditor s Report To
National Settlement Depository. Financial Statements for the year ended December 31, 2010
 National Settlement Depository Financial Statements for the year ended NATIONAL SETTLEMENT DEPOSITORY TABLE OF CONTENTS Page STATEMENT OF MANAGEMENT S RESPONSIBILITIES FOR THE PREPARATION AND APPROVAL
Renesa cjsc. Financial Statements for the year ended 31 December 2013
 Financial Statements for the year ended 31 December 2013 Contents Independent Auditors Report... 3 Statement of profit or loss and other comprehensive income... 5 Statement of financial position... 6 Statement
Consolidated Financial Statements and Independent Auditor's Report
 72 Consolidated Financial Statements and Independent Auditor's Report Table of Contents Independent Auditor s Report p. 74 Consolidated Financial Statements: Consolidated Statement of Financial Position
CRNOGORSKA KOMERCIJALNA BANKA AD, PODGORICA. Financial Statements For the Year Ended December 31, 2016 and Independent Auditors Report
 CRNOGORSKA KOMERCIJALNA BANKA AD, PODGORICA Financial Statements For the Year Ended and Independent Auditors Report CONTENTS Page Responsibility for the financial statements 1 Independent Auditors Report
BELGAZPROMBANK. Financial Statements and Independent Auditors' Report For the year ended 31 December 2014
 BELGAZPROMBANK Financial Statements and Independent Auditors' Report For the year ended BELGAZPROMBANK TABLE OF CONTENTS Page STATEMENT OF MANAGEMENT S RESPONSIBILITIES FOR THE PREPARATION AND APPROVAL
Neo Solar Power Corp. and Subsidiaries
 Neo Solar Power Corp. and Subsidiaries Consolidated Financial Statements for the Three Months Ended and and Independent Auditors Review Report NEO SOLAR POWER CORP. AND SUBSIDIARIES CONSOLIDATED BALANCE
Ameriabank cjsc. Financial Statements For the second quarter of 2016
 Financial Statements For the second quarter of Contents Statement of profit or loss and other comprehensive income... 3 Statement of financial position... 4 Statement of cash flows... 5 Statement of changes
NALCOR ENERGY MARKETING CORPORATION FINANCIAL STATEMENTS December 31, 2016
 FINANCIAL STATEMENTS December 31, 2016 Deloitte LLP 5 Springdale Street, Suite 1000 St. John's NL A1E 0E4 Canada Tel: (709) 576-8480 Fax: (709) 576-8460 www.deloitte.ca Independent Auditor s Report To
NALCOR ENERGY - BULL ARM FABRICATION INC. FINANCIAL STATEMENTS December 31, 2016
 FINANCIAL STATEMENTS December 31, 2016 Deloitte LLP 5 Springdale Street, Suite 1000 St. John's NL A1E 0E4 Canada Tel: (709) 576-8480 Fax: (709) 576-8460 www.deloitte.ca Independent Auditor s Report To
Financial Statements and Independent Auditors' Report. Universal Investment Bank AD, Skopje. 31 December 2013
 Financial Statements and Independent Auditors' Report Universal Investment Bank AD, Skopje 31 December 2013 Universal Investment Bank, AD Skopje Contents Page Independent Auditors Report 1 Statement of
KOMERCIJALNA BANKA AD SKOPJE. Independent Auditors Report and. Separate financial statements. For the year ended 31 December 2017
 Independent Auditors Report and Separate financial statements For the year ended 31 December Separate financial statements for the Year Ended December 31, Contents Page Independent Auditors Report Audited
Management s Responsibility for the Financial Statements
 kpmg KPMG d.o.o. Beograd Kraljice Natalije 11 11000 Belgrade Serbia Tel.: +381 (0)11 20 50 500 Fax: +381 (0)11 20 50 550 www.kpmg.com/rs Independent Auditors Report T R A N S L A T I O N TO THE OWNERS
Financial Statements and Independent Auditors Report. Eurostandard Banka AD, Skopje. 31 December 2008
 Financial Statements and Independent Auditors Report Eurostandard Banka AD, Skopje 31 December 2008 Eurostandard Banka AD Skopje Contents page Independent Auditors Report 1 Income Statement 2 Balance Sheet
NATIONAL BANK OF SERBIA. Financial Statements Year Ended December 31, 2014 and Independent Auditors Report
 Financial Statements Year Ended and Independent Auditors Report CONTENTS Page Independent Auditors Report 1 Income Statement 2 Statement of Other Comprehensive Income 3 Statement of Financial Position
Financial statements and independent auditor s report. Sileks Banka ad, Skopje. 31 December 2007
 Financial statements and independent auditor s report Sileks Banka ad, Skopje 31 December 2007 Sileks Banka ad, Skopje Contents Page Independent Auditor s Report 1 Statement on income 3 Balance sheet 4
KOMERCIJALNA BANKA AD SKOPJE. Consolidated financial statements and Independent Auditors Report for the year ended December 31, 2014
 Consolidated financial statements and Independent Auditors Report for the year ended CONTENTS Page Independent Auditors Report Consolidated statement of profit or loss and other comprehensive Income 1
LCY CHEMICAL CORP. and Subsidiaries. Consolidated Financial Statements for the Years Ended December 31, 2017 and 2016 and Independent Auditors Report
 LCY CHEMICAL CORP. and Subsidiaries Consolidated Financial Statements for the Years Ended December 31, 2017 and 2016 and Independent Auditors Report Key audit matters for the consolidated financial statements
Bank SinoPac. Financial Statements for the Years Ended December 31, 2013 and 2012 and Independent Auditors Report
 Bank SinoPac Financial Statements for the Years Ended 2013 and and Independent Auditors Report INDEPENDENT AUDITORS REPORT The Board of Directors and Stockholders Bank SinoPac We have audited the accompanying
Converse Bank Closed Joint Stock Company Consolidated financial statements. Year ended 31 December 2016 together with independent auditor s report
 Consolidated financial statements Year ended 31 December 2016 together with independent auditor s report 2016 Consolidated financial statements Contents Independent auditor s report Consolidated statement
 STATEMENT OF PROFIT OR LOSS For the year ended 31 December 2014 Financial statements Note 2014 2013 Interest income Cash and cash equivalents 893,744 506,424 Loans to customers 1,020,693 440,642 Amounts
MF BANKA A.D. BANJA LUKA. Financial Statements Year Ended December 31, 2016 and Independent Auditors Report
 Financial Statements and Independent Auditors Report CONTENTS Page Independent Auditors' Report 1 Financial Statements: Statement of Profit and Loss and Other Comprehensive Income 2 Statement of Financial
BOYUAN CONSTRUCTION GROUP, INC. ANNUAL REPORT Audited annual consolidated financial statements for the fiscal years ended June 30, 2018
 ANNUAL REPORT 2018 Audited annual consolidated financial statements for the fiscal years ended June 30, 2018 Management discussion & analysis for the fiscal year ended June 30, 2018 Report and Consolidated
YFY Inc. and Subsidiaries. Consolidated Financial Statements for the Six Months Ended June 30, 2018 and 2017 and Independent Auditors Review Report
 YFY Inc. and Subsidiaries Consolidated Financial Statements for the Six Months Ended 2018 and and Independent Auditors Review Report INDEPENDENT AUDITORS REVIEW REPORT The Board of Directors and Shareholders
Fibabanka Anonim Şirketi Financial Statements As at and for the year ended 31 December 2012 Together with the Independent Auditor s Report
 Financial Statements As at and for the year ended 2012 Together with the Independent Auditor s Report To the Board of Directors of Fibabanka A.Ş. İstanbul INDEPENDENT AUDITOR S REPORT We have audited the
Independent auditor s report on the financial statements of JSC RN Bank for 2016
 Independent auditor s report on the financial statements of for 2016 March 2017 Independent auditor s report on financial statements of Joint-Stock Company RN Bank Contents Page Independent auditor s report
KOMERCIJALNA BANKA A.D., BEOGRAD. Consolidated Financial Statements December 31, 2006 and Independent Auditors Report
 KOMERCIJALNA BANKA A.D., BEOGRAD Consolidated Financial Statements and Independent Auditors Report CONTENTS Page Independent Auditors Report 1 2 Consolidated Statement of Income 3 Consolidated Balance
Phihong Technology Co., Ltd. Financial Statements for the Years Ended December 31, 2015 and 2014 and Independent Auditors Report
 Phihong Technology Co., Ltd. Financial Statements for the Years Ended, 2015 and 2014 and Independent Auditors Report INDEPENDENT AUDITORS REPORT The Board of Directors and Stockholders Phihong Technology
LABRADOR ISLAND LINK GENERAL PARTNER CORPORATION FINANCIAL STATEMENTS December 31, 2015
 FINANCIAL STATEMENTS December 31, 2015 Deloitte LLP 5 Springdale Street, Suite 1000 St. John's NL A1E 0E4 Canada Independent Auditor s Report Tel: (709) 576-8480 Fax: (709) 576-8460 www.deloitte.ca To
Risk and Capital Management Basel II - Pillar 3 Disclosures
 Risk and Capital Management Basel II - Pillar 3 Disclosures Year 2011 Table of Contents Page 1. GENERAL INFORMATION 3 1.1. Basic information about the Vojvodjanska bank Member of NBG Group 3 2. INTRODUCTION
Consolidated Financial Statements of ALTERNA SAVINGS
 Consolidated Financial Statements of ALTERNA SAVINGS INDEPENDENT AUDITORS' REPORT To the Members of Alterna Savings and Credit Union Limited: We have audited the accompanying consolidated financial statements
OHRIDSKA BANKA AD, OHRID. Financial Statements and Independent Auditors Report for the year ended December 31, 2010
 OHRIDSKA BANKA AD, OHRID Financial Statements and Independent Auditors Report for the ended OHRIDSKA BANKA AD - OHRID CONTENTS Page Independent Auditors Report 1-2 Income Statement 3 Balance Sheet 4 Statement
Azer-Turk Bank Open Joint Stock Company Financial statements. Year ended 31 December 2016 together with independent auditor s report
 Financial statements Year ended 31 December together with independent auditor s report financial statements Contents Independent auditor s report Financial statements Statement of financial position...
Income statement 3. Balance sheet 4. Cash Flow Statement 6-7. Notes to the Financial Statements 8 67
 MARFIN BANK A.D., BEOGRAD FINANCIAL STATEMENTS FOR THE YEAR ENDED 31 DECEMBER 2009 TABLE OF CONTENTS Page Independent Auditor s report 1-2 Income statement 3 Balance sheet 4 Statement of Changes in Equity
OTP BANK PLC. FOR THE YEAR ENDED 31 DECEMBER 2016
 CONSOLIDATED FINANCIAL STATEMENTS IN ACCORDANCE WITH INTERNATIONAL FINANCIAL REPORTING STANDARDS AS ADOPTED BY THE EUROPEAN UNION AND INDEPENDENT AUDITORS REPORT FOR THE YEAR ENDED 31 DECEMBER 2016 CONSOLIDATED
PUBLIC JOINT STOCK COMPANY OTP BANK. Financial Statements and Independent Auditor s Report for the Year Ended 31 December 2017
 PUBLIC JOINT STOCK COMPANY OTP BANK Financial Statements and Independent Auditor s Report Table of contents Page STATEMENT OF MANAGEMENT S RESPONSIBILITIES FOR THE PREPARATION AND APPROVAL OF THE FINANCIAL
MUSKRAT FALLS CORPORATION FINANCIAL STATEMENTS December 31, 2016
 FINANCIAL STATEMENTS December 31, 2016 Deloitte LLP 5 Springdale Street, Suite 1000 St. John's NL A1E 0E4 Canada Tel: (709) 576-8480 Fax: (709) 576-8460 www.deloitte.ca Independent Auditor s Report To
Ameriabank CJSC Financial statements
 Ameriabank CJSC Financial statements for the year ended 31 December together with independent auditors report Ameriabank CJSC Financial statements Contents Independent auditors report Statement of comprehensive
Commercial Bank International P.S.C. Reports and the consolidated financial statements for the year ended 31 December 2017
 Commercial Bank International P.S.C. Reports and the consolidated financial statements for the year ended 31 December 2017 These audited consolidated financial statements are subject to approval of the
Intesa Sanpaolo Banka d.d. Bosna i Hercegovina
 Intesa Sanpaolo Banka d.d. Bosna i Hercegovina Financial Statements as at 2016 Intesa Sanpaolo Banka, d.d. Financial statements as at 2016 Contents Management Board s Report 2 Responsibilities of the Management
Georgian Leasing Company LLC Consolidated financial statements
 Consolidated financial statements For the year ended 31 December together with the independent auditor s report Consolidated financial statements Contents Independent auditor s report Consolidated statement
LLC CB Aljba Alliance. Consolidated Financial Statements For the Year Ended December 31, 2010
 LLC CB Aljba Alliance Consolidated Financial Statements For the Year Ended COMMERCIAL BANK ALJBA ALLIANCE (LIMITED LIABILITY COMPANY) TABLE OF CONTENTS Page STATEMENT OF MANAGEMENT S RESPONSIBILITIES FOR
Joint stock company "Belarusian-Swiss Bank "BSB Bank" Financial statements prepared in accordance with the International financial reporting standards
 Joint stock company "Belarusian-Swiss Bank "BSB Bank" Financial statements prepared in accordance with the International financial reporting standards For the year 2015 And an independent auditors report
Ameriabank CJSC Financial statements
 Ameriabank CJSC Financial statements for the year ended 31 December together with independent auditor s report Ameriabank CJSC Financial statements Contents Independent auditor s report Statement of comprehensive
SSANGYONG MOTOR COMPANY AND SUBSIDIARIES. (With Independent Auditors Report Thereon)
") Consolidated Financial Statements December 31, 2017 and 2016 (With Independent Auditors Report Thereon) Contents Page Independent Auditors Report 1 Consolidated Statements of Financial Position 3 Consolidated
Consolidated Financial Statements December 31, 2017 and 2016 (With Independent Auditors Report Thereon) Contents Page Independent Auditors Report 1 Consolidated Statements of Financial Position 3 Consolidated
Taiwan Cement Corporation. Financial Statements for the Years Ended December 31, 2017 and 2016 and Independent Auditors Report
 Taiwan Cement Corporation Financial Statements for the Years Ended December 31, 2017 and 2016 and Independent Auditors Report INDEPENDENT AUDITORS REPORT The Board of Directors and Shareholders Taiwan
INVEST BANK MONTENEGRO AD, PODGORICA FINANCIAL STATEMENTS YEAR ENDED DECEMBER 31, 2014 AND INDEPENDENT AUDITORS REPORT
 INVEST BANK MONTENEGRO AD, PODGORICA FINANCIAL STATEMENTS YEAR ENDED DECEMBER 31, AND INDEPENDENT AUDITORS REPORT CONTENTS Page Independent auditors report 1-2 Income Statement 3 Balance Sheet 4 Statement
MUSKRAT FALLS CORPORATION FINANCIAL STATEMENTS December 31, 2017
 FINANCIAL STATEMENTS December 31, 2017 Deloitte LLP 5 Springdale Street, Suite 1000 St. John's NL A1E 0E4 Canada Tel: (709) 576-8480 Fax: (709) 576-8460 www.deloitte.ca Independent Auditor s Report To
The Bank IBA MOSCOW Limited Liability Company. Financial Statements For the Year Ended December 31, 2015
 The Bank IBA MOSCOW Limited Liability Company Financial Statements For the Year Ended The Bank IBA-MOSCOW LLC TABLE OF CONTENTS Page STATEMENT OF MANAGEMENT S RESPONSIBILITIES FOR THE PREPARATION AND APPROVAL
ZEPTER BANKA A.D., BEOGRAD. Financial Statements December 31, 2006 and Independent Auditors Report
 Financial Statements and Independent Auditors Report CONTENTS Page Independent Auditors Report 1 2 Statement of Income 3 Balance Sheet 4 Statement of Changes in Equity 5 Statement of Cash Flows 6 Notes
MF BANKA A.D. BANJA LUKA. Financial Statements Year Ended December 31, 2014 and Independent Auditors Report
 Financial Statements and Independent Auditors Report CONTENTS Page Independent Auditors' Report 1 Financial Statements: Statement of Profit and Loss and Other Comprehensive Income 2 Statement of Financial
Public Joint Stock Company STATE SAVINGS BANK OF UKRAINE. Separate Financial Statements for the Year Ended 31 December 2012
 Public Joint Stock Company STATE SAVINGS BANK OF UKRAINE Separate Financial Statements for the Year Ended PUBLIC JOINT STOCK COMPANY STATE SAVINGS BANK OF UKRAINE TABLE OF CONTENTS Page STATEMENT OF MANAGEMENT
Management s Responsibility for the Financial Statements
 ABCD KPMG d.o.o. Beograd Kraljice Natalije 11 11000 Belgrade Serbia Telephone: Fax: E-mail: Internet: +381 11 20 50 500 +381 11 20 50 550 info@kpmg.rs www.kpmg.rs Independent Auditors Report TO THE OWNERS
Closed Joint Stock Company ISBANK. Financial Statements for the year ended 31 December 2013
 Financial Statements for the year ended 31 December Contents Auditors Report... 3 Statement of profit or loss and other comprehensive income... 5 Statement of financial position... 6 Statement of cash
TAIWAN BUSINESS BANK, LTD. AND ITS SUBSIDIARIES SEPTEMBER 30, 2017 AND 2016 INDEPENDENT ACCOUNTANTS REVIEW REPORT
 (English Translation of Consolidated Financial Statements and Report Originally Issued in Chinese) TAIWAN BUSINESS BANK, LTD. AND ITS SUBSIDIARIES CONSOLIDATED FINANCIAL STATEMENTS SEPTEMBER 30, 2017 AND
Converse Bank closed joint stock company
 Converse Bank closed joint stock company Consolidated Financial Statements 30 September 2016 Consolidated financial statements as at 30 September 2016 Contents Consolidated statement of financial position...
MF BANKA A.D. BANJA LUKA. Financial Statements Year Ended December 31, 2015 and Independent Auditors Report
 Financial Statements and Independent Auditors Report CONTENTS Page Independent Auditors' Report 1 Financial Statements: Statement of Profit and Loss and Other Comprehensive Income 2 Statement of Financial