A random variable is a quantitative variable that represents a certain
|
|
|
- Scott Merritt
- 5 years ago
- Views:
Transcription
1 Section 6.1 Discrete Random Variables Example: Probability Distribution, Spin the Spinners Sum of Numbers on Spinners Theoretical Probability A random variable is a quantitative variable that represents a certain. of a probability experiment, and whose value depends on Two different kinds of random variables: Discrete random variable number of values for x. Continuous random variable on a continuous scale. A probability distribution Gives the probability for each value of the random variable X. Each probability must be. The sum of the probabilities must equal. P(2) = (means: probability of getting a sum exactly = 2) Page 1

2 Graphing a Discrete Probability Distribution Use the probability distribution to make a probability histogram, which is just a graph of the probability distribution. Values of the discrete random variable go on the. Probabilities of those values go on the. Interpreting the probability distribution/histogram: Describe the shape of the distribution: Compare the theoretical probability distribution to the empirical frequency histograms: Page 2
.")


3 Disclaimer: We will be doing our discrete probability distribution graphs differently than is presented in the textbook (Sullivan 5 th edition). Example: From our book (Sullivan 5 th edition) Author s rationale in 5 th edition is that we want to emphasize that the data are discrete. From the previous edition of the book (Sullivan 4 th edition) Author s rationale in 4 th edition was to emphasize the relation between area and probability as a prelude to probabilities for continuous random variables. Page 3
4 Example: Coin flip experiment 1. Collect sample data from an experiment. Make a distribution and histogram from the experimental results. 2. Create a probability distribution based on the theoretical probabilities for the experiment. Make a probability distribution and histogram. Experiment is: Flip a coin 4 times. Count how many times you get out of 4 flips. Each group will repeat this experiment 10 times. x = random variable = P(x) = probability of that many out of 4 coin flips What are the possible values for the random variable x? Page 4
5 Experiment: data sheet Run your 10 trials, then summarize your data on the next page. Trial #1 Trial #2 Trial #3 Trial #4 Trial #5 Flip 1 Flip 1 Flip 1 Flip 1 Flip 1 Flip 2 Flip 2 Flip 2 Flip 2 Flip 2 Flip 3 Flip 3 Flip 3 Flip 3 Flip 3 Flip 4 Flip 4 Flip 4 Flip 4 Flip 4 Total H = Total H = Total H = Total H = Total H = Trial #6 Trial #7 Trial #8 Trial #9 Trial #10 Flip 1 Flip 1 Flip 1 Flip 1 Flip 1 Flip 2 Flip 2 Flip 2 Flip 2 Flip 2 Flip 3 Flip 3 Flip 3 Flip 3 Flip 3 Flip 4 Flip 4 Flip 4 Flip 4 Flip 4 Total H = Total H = Total H = Total H = Total H = Page 5
6 Summarize your results below in the first table then put them on the board (using tally marks). Each group will put a total of 10 tally marks on the board. Note: The frequency is the number of Trials in which you got x Heads, so for example, for x = 0, count up how many Total H = 0 results you have. Since you did 10 trials, the sum of the frequency column must equal 10. Your results: x (number of Heads in 4 flips) 0 Frequency sum = 10 Class results: (don t fill this one in until we have ALL the data on the board) x (number of Heads in 4 flips) Frequency sum = Relative Frequency Page 6
7 Page 7
8 Theoretical Model Start Toss #1 Toss #2 Toss #3 Toss #4 Outcome # heads H HHHH 4 H T HHHT 3 H H HHTH 3 T T HHTT 2 H H HTHH 3 H T HTHT 2 T H HTTH 2 T T HTTT 1 T H T H T H T H T H T H T H T x (number of Heads in 4 flips) No. of ways it can occur total outcomes = Theoretical Probability P(x) Page 8
9 Mean Calculation for a Discrete Random Variable: Calculate the mean of the random variable: Multiply each value of x by its. Add up the column of. Interpret the mean of a discrete random variable: The mean outcome of the probability experiment if we repeated the experiment many times. Example: Mean number of Heads in Four Coin Flips Theoretical Distribution Experimental Distribution x P(x) x P(x) x P(x) x P(x) sum = 1 Formula for mean of a discrete random variable: μ X = Round-off recommendation for and : decimal place than the values of the random variable. Note: always keep more decimal places for intermediate calculations Page 9
10 Standard Deviation Calculation for a Discrete Random Variable: Calculate the standard deviation of the random variable: Find the difference between value of the random variable and the. Square the difference. Multiply by the probability for that value. Example: Standard Deviation of Heads in Four Coin Flips x Standard Deviation of Theoretical Probability Distribution P(x) x - ( = ) (x - ) 2 (x - ) 2 P(x) σ X 2 = variance = σ X = standard deviation = σ X 2 = Formula for standard deviation of a discrete random variable: σ X = Page 10
11 Example: Standard Deviation of Heads in Four Coin Flips x Standard Deviation of Experimental Probability Distribution P(x) x - ( = ) (x - ) 2 (x - ) 2 P(x) sum = σ X 2 = variance = σ X = standard deviation = σ X 2 = Page 11
12 Section 6.2 The Binomial Probability Distribution A binomial probability distribution meets the following four requirements: 1. Procedure has a of trials. 2. Trials are. 3. Each individual trial has only possible categories of outcomes. 4. Probabilities of remain constant for each trial. The trials themselves are called, which are identical and independent repetitions of an experiment with two possible outcomes. Examples: Are these binomial procedures? 1. Roll a die 100 times and record the outcome 2. Roll a die 100 times and count how many 6s there are. 3. Spinning two spinners and adding the numbers (1 8) to find the sum. 4. Selecting 31 people from a very large population, and observing whether or not each of them is left-handed, when 10% of all people are known to be lefthanded. If a probability distribution is a binomial distribution, then there is a formula for calculating the probabilities for each value of the random variable. Three ways to use the formula to calculate probabilities for a binomial distribution: Page 12
13 Notation for Binomial Probability Distribution Two outcomes are: = probability of success in one trial = probability of failure in one trial n = X = random variable representing total no. of in n trials P(x) = probability of successes out of n trials Success or failure : Somewhat of an arbitrary designation. Success doesn t necessarily mean something Success means the outcome, or what you are looking for. Key Point: corresponds to Both represent the same category of outcome, a Page 13
14 Binomial Probability Formula: P(x) = where, P(x) = probability of x successes in n trials n = number of trials x = number of p = probability of in one trial 1 p = probability of in one trial Example: Coin flip problem, probabilities of getting 0 4 heads in four flips x P(x) Fixed number of trials? 2. Trials independent? 3. Outcomes in two categories? 4. Probabilities constant? Success = p = 1 p = n = x = (Example continued on next page) Page 14
15 Use binomial formula to calculate P(x) for values of x: P(x) = ncx p x (1 p) n-x x = 0: P(0) = x = 1: P(1) = x = 2: P(2) = There s no magic to the binomial formula it s based on: that we learned in Chapter 5. Example: From above, where x = 1 Which means: in 4 coin flips, have 1 H and 3 T Use the multiplication rule to calculate the probability of flipping a coin 4 times and getting: H, T, T, T P(H & T & T & T) = Why isn t this the same as what we calculated above for x = 1? So: P( x) x nx ncx p (1 p) First part of the formula tells us: Second part of the formula tells us: Page 15
16 Binomial Beans Sampling Experiment Every group has a cup with a total of 10 beans: 7 white beans 3 black beans The procedure that you re going to do is: Randomly select three beans (one at a time), and record their color. Notice that you are selecting WITH replacement, so put each bean BACK and shake up the cup before you select the next one. Each person in the group should perform the experiment for themselves, but then work together to answer the questions. Repeat the experiment TWO TIMES each. Define: s = success = choose a black bean 1. Record your results (every person do this individually): Trial # Color of Bean #1 Color of Bean #2 Color of Bean #3 # successes The random variable x = number of successes, or number of black beans that you selected. On the board, each person put a tally mark next to the number of successes that you had. 3. Now you are going to calculate the probability for each of the values of the random variable x, using the Binomial Probability Formula. First, fill in the following: n = number of trials = p = probability of success in one trial = 1 p = probability of failure in one trial = Also, x = number of successes = 0, 1, 2 or 3 for this experiment Calculate probabilities: x P(x) = ncxp x (1 p) n-x Page 16
17 Make a relative frequency histogram using the class experimental results: x Frequency Relative Frequency Make a probability distribution using the theoretical probabilities: Page 17
18 4. How could you calculate these probabilities WITHOUT using the Binomial Probability Formula? Fill out the following table. See x = 0 for an example. Value of random variable x In other words, how many black beans were selected out of 3 trials 0 No black beans List the ways this could happen (B = black, W = white) Calculate the probability for each way using the Multiplication Rule: P = P(A)P(B)P(C) Add the probabilities from column 4 together this should be the same value that you calculated with the Binomial Formula. WWW (0.7)(0.7)(0.7) = P(0) = (3 ways) P(1) = 1 One black bean (3 ways) P(2) = 2 Two black beans (1 way) P(3) = 3 Three black beans Page 18

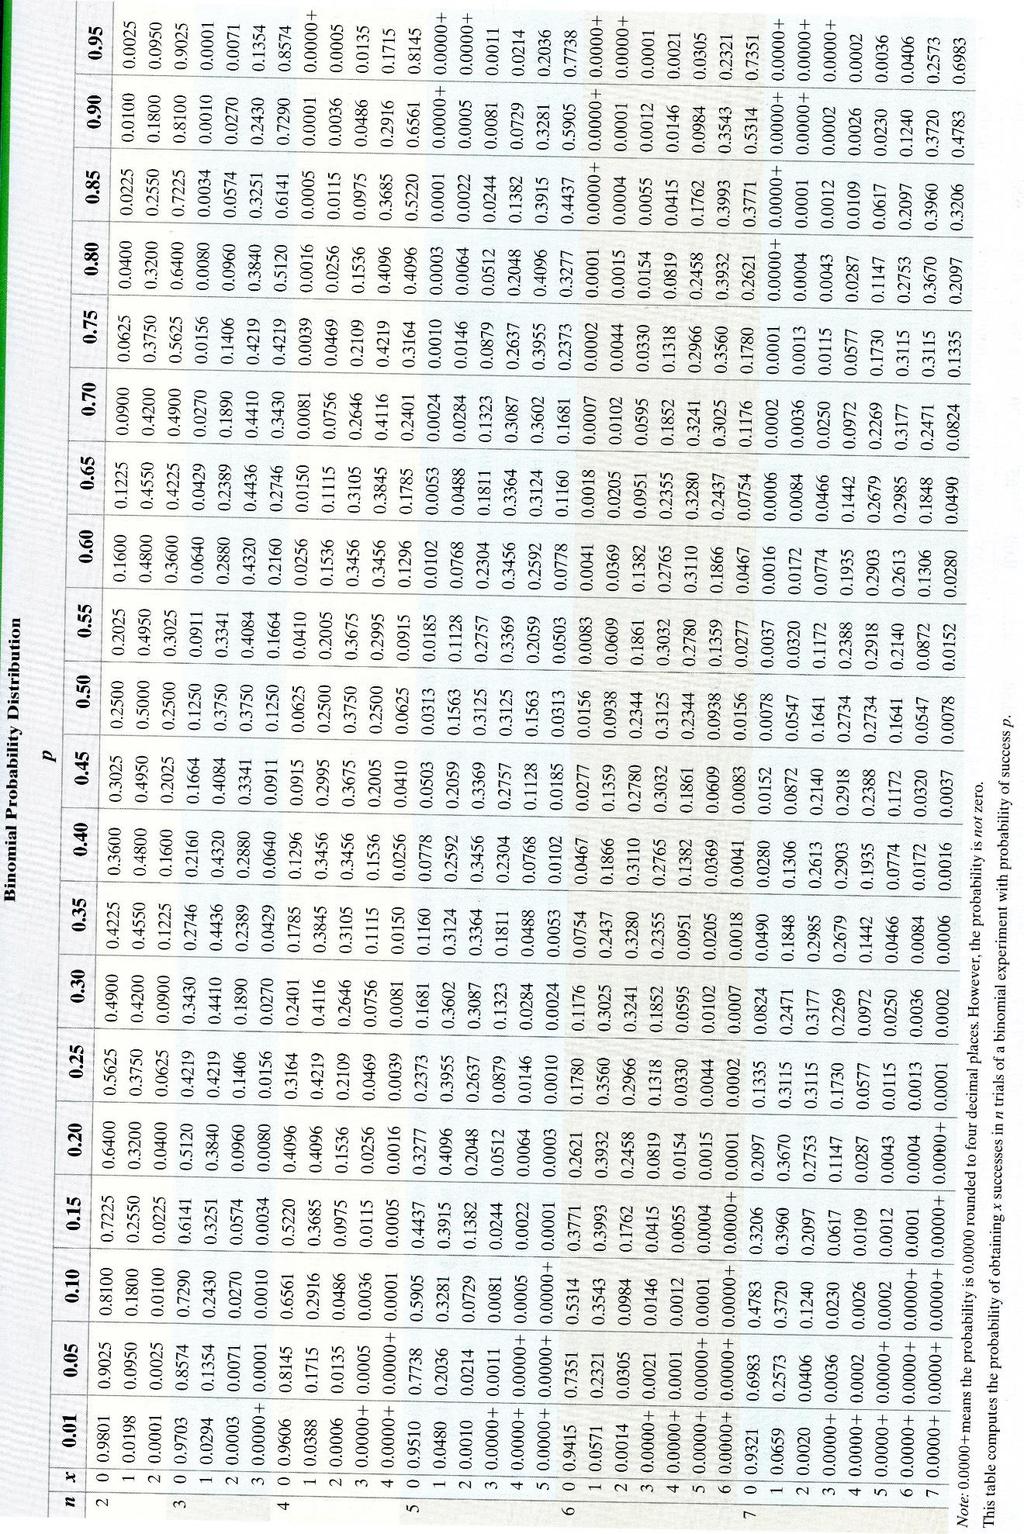
19 Table Look-up Method for Binomial Probabilities This method uses Table III in Appendix A Left-hand column is n, number of trials Next column is x, the number of successes Across the top are the different probabilities of success, p Example: Binomial Beans Example: Four Coin Flips n = n = p = p = x = x = Notice that the table look-up method can only be used for problems where the answers have been tabulated for the specific in the problem. Page 19


20 Using Technology to Calculate Binomial Probabilities Example: d. less than two. Using STATDISK: Analysis/Probability Distributions/Binomial Distribution Page 20
21 Mean and Standard Deviation for the Binomial Random Variable Any Discrete Probability Distribution Mean x P(x) Standard Deviation x X X P( x) X 2 Binomial Probability Distribution where, n = number of trials p = probability of 1 p = probability of Example: Food Safety (previous example) n = p = 1 p = Mean = μ X = Standard deviation = σ X = What μ X means: On average, if you ask 6 consumers in the US if they are confident that the food they buy is safe, about will say yes. Page 21

22 Shape of a Binomial Distribution Effect of p Trial size for all cases: n = Conclusion: for small trial sizes, the shape of the distribution is determined by. Shape of a Binomial Distribution Effect of n Conclusion: for a large trial size, the probability distribution becomes. Rule of thumb: if will be approximately bell-shaped., the probability distribution Page 22

23 Checking for Unusual Results in a Binomial Experiment 1. Using the Empirical Rule: Note: ONLY USE THIS if the distribution is approximately in other words if: maximum usual value minimum usual value Any values outside of these boundaries are considered to be Example: 4 coin flips Would it be unusual to get 0 Heads out of 4 flips? Page 23
24 Checking for Unusual Results in a Binomial Experiment (cont.) 2. Using probabilities: x successes out of a certain number of trials is unusually high if P(x or more) is. x successes out of a certain number of trials is unusually low if P(x or less) is. Note: USE THIS if the distribution is in other words if:. Key Point: Not just looking at. P(501) = P(501 or more) = Note: look at more or less based on which side of µ the value x is on. Probability Distribution for number of Heads out of 1000 coin flips P(x) Example: Food Safety Would it be unusual to get 1 or less people who are confident in their food? 490 x = number of Heads Page 24
25 1. Each sample of air has a 10% probability of containing a particular rare molecule. Assume the samples are independent with regard to the presence of the rare molecule. Fifteen samples of air are taken at a time. Tip: Before calculating anything, start by identifying: S = success = what you are looking for in words = n = p = a. Find the probability that none of the fifteen samples contain the rare molecule. b. Find the probability that at least one of the fifteen samples contains the rare molecule. c. Find the probability that at most one of the fifteen samples contains the rare molecule. d. Find the mean and standard deviation of the number of air samples that contain the rare molecule. e. What will the shape of the probability distribution look like, and how do you know? f. Would it be unusual for four of the air samples out of fifteen to contain the rare molecule, and how did you determine this? Page 25
26 2. Clarinex-D is a medication whose purpose is to reduce the symptoms associated with a variety of allergies. In clinical trials of Clarinex-D, 5% of the patients in the study experienced insomnia as a side effect. (a) If 240 users of Clarinex-D are randomly selected, how many would we expect to experience insomnia as a side effect? (b) What is the probability that exactly 12 users out of the 240 will experience insomnia? (c) What will the shape of the probability distribution look like, and how do you know? (d) Would it be unusual to observe 20 patients experiencing insomnia as a side effect in 240 trials of the probability experiment, and how did you determine this? Page 26
27 Page 27

28 Page 28

29 Page 29

30 Page 30
Examples: Random Variables. Discrete and Continuous Random Variables. Probability Distributions
 Random Variables Examples: Random variable a variable (typically represented by x) that takes a numerical value by chance. Number of boys in a randomly selected family with three children. Possible values:
Lecture Slides. Elementary Statistics Tenth Edition. by Mario F. Triola. and the Triola Statistics Series
 Lecture Slides Elementary Statistics Tenth Edition and the Triola Statistics Series by Mario F. Triola Slide 1 Chapter 5 Probability Distributions 5-1 Overview 5-2 Random Variables 5-3 Binomial Probability
Chapter 4 Probability Distributions
 Slide 1 Chapter 4 Probability Distributions Slide 2 4-1 Overview 4-2 Random Variables 4-3 Binomial Probability Distributions 4-4 Mean, Variance, and Standard Deviation for the Binomial Distribution 4-5
The Binomial Probability Distribution
 The Binomial Probability Distribution MATH 130, Elements of Statistics I J. Robert Buchanan Department of Mathematics Fall 2017 Objectives After this lesson we will be able to: determine whether a probability
Statistical Methods in Practice STAT/MATH 3379
 Statistical Methods in Practice STAT/MATH 3379 Dr. A. B. W. Manage Associate Professor of Mathematics & Statistics Department of Mathematics & Statistics Sam Houston State University Overview 6.1 Discrete
Overview. Definitions. Definitions. Graphs. Chapter 4 Probability Distributions. probability distributions
 Chapter 4 Probability Distributions 4-1 Overview 4-2 Random Variables 4-3 Binomial Probability Distributions 4-4 Mean, Variance, and Standard Deviation for the Binomial Distribution 4-5 The Poisson Distribution
MULTIPLE CHOICE. Choose the one alternative that best completes the statement or answers the question.
 Module 5 Test Name MULTIPLE CHOICE. Choose the one alternative that best completes the statement or answers the question. Calculate the specified probability ) Suppose that T is a random variable. Given
MA 1125 Lecture 14 - Expected Values. Wednesday, October 4, Objectives: Introduce expected values.
 MA 5 Lecture 4 - Expected Values Wednesday, October 4, 27 Objectives: Introduce expected values.. Means, Variances, and Standard Deviations of Probability Distributions Two classes ago, we computed the
CHAPTER 4 DISCRETE PROBABILITY DISTRIBUTIONS
 CHAPTER 4 DISCRETE PROBABILITY DISTRIBUTIONS A random variable is the description of the outcome of an experiment in words. The verbal description of a random variable tells you how to find or calculate
These Statistics NOTES Belong to:
 These Statistics NOTES Belong to: Topic Notes Questions Date 1 2 3 4 5 6 REVIEW DO EVERY QUESTION IN YOUR PROVINCIAL EXAM BINDER Important Calculator Functions to know for this chapter Normal Distributions
Discrete Probability Distributions
 Page 1 of 6 Discrete Probability Distributions In order to study inferential statistics, we need to combine the concepts from descriptive statistics and probability. This combination makes up the basics
MA 1125 Lecture 12 - Mean and Standard Deviation for the Binomial Distribution. Objectives: Mean and standard deviation for the binomial distribution.
 MA 5 Lecture - Mean and Standard Deviation for the Binomial Distribution Friday, September 9, 07 Objectives: Mean and standard deviation for the binomial distribution.. Mean and Standard Deviation of the
The normal distribution is a theoretical model derived mathematically and not empirically.
 Sociology 541 The Normal Distribution Probability and An Introduction to Inferential Statistics Normal Approximation The normal distribution is a theoretical model derived mathematically and not empirically.
4.1 Probability Distributions
 Probability and Statistics Mrs. Leahy Chapter 4: Discrete Probability Distribution ALWAYS KEEP IN MIND: The Probability of an event is ALWAYS between: and!!!! 4.1 Probability Distributions Random Variables
Chapter 5: Discrete Probability Distributions
 Chapter 5: Discrete Probability Distributions Section 5.1: Basics of Probability Distributions As a reminder, a variable or what will be called the random variable from now on, is represented by the letter
Chapter 6: Discrete Probability Distributions
 120C-Choi-Spring-2019 1 Chapter 6: Discrete Probability Distributions Section 6.1: Discrete Random Variables... p. 2 Section 6.2: The Binomial Probability Distribution... p. 10 The notes are based on Statistics:
Chapter 5 Probability Distributions. Section 5-2 Random Variables. Random Variable Probability Distribution. Discrete and Continuous Random Variables
 Chapter 5 Probability Distributions Section 5-2 Random Variables 5-2 Random Variables 5-3 Binomial Probability Distributions 5-4 Mean, Variance and Standard Deviation for the Binomial Distribution Random
MidTerm 1) Find the following (round off to one decimal place):
 Find the following (round off to one decimal place):") MidTerm 1) 68 49 21 55 57 61 70 42 59 50 66 99 Find the following (round off to one decimal place): Mean = 58:083, round off to 58.1 Median = 58 Range = max min = 99 21 = 78 St. Deviation = s = 8:535,
MidTerm 1) 68 49 21 55 57 61 70 42 59 50 66 99 Find the following (round off to one decimal place): Mean = 58:083, round off to 58.1 Median = 58 Range = max min = 99 21 = 78 St. Deviation = s = 8:535,
Random Variables CHAPTER 6.3 BINOMIAL AND GEOMETRIC RANDOM VARIABLES
 Random Variables CHAPTER 6.3 BINOMIAL AND GEOMETRIC RANDOM VARIABLES Essential Question How can I determine whether the conditions for using binomial random variables are met? Binomial Settings When the
Lecture 9. Probability Distributions. Outline. Outline
 Outline Lecture 9 Probability Distributions 6-1 Introduction 6- Probability Distributions 6-3 Mean, Variance, and Expectation 6-4 The Binomial Distribution Outline 7- Properties of the Normal Distribution
Binomial Distributions
 . Binomial Distributions Essential Question How can you determine the frequency of each outcome of an event? Analyzing Histograms Work with a partner. The histograms show the results when n coins are flipped.
Lecture 9. Probability Distributions
 Lecture 9 Probability Distributions Outline 6-1 Introduction 6-2 Probability Distributions 6-3 Mean, Variance, and Expectation 6-4 The Binomial Distribution Outline 7-2 Properties of the Normal Distribution
Chapter. Section 4.2. Chapter 4. Larson/Farber 5 th ed 1. Chapter Outline. Discrete Probability Distributions. Section 4.
 Chapter Discrete Probability s Chapter Outline 1 Probability s 2 Binomial s 3 More Discrete Probability s Copyright 2015, 2012, and 2009 Pearson Education, Inc 1 Copyright 2015, 2012, and 2009 Pearson
Stat511 Additional Materials
 Binomial Random Variable Stat511 Additional Materials The first discrete RV that we will discuss is the binomial random variable. The binomial random variable is a result of observing the outcomes from
5.2 Random Variables, Probability Histograms and Probability Distributions
 Chapter 5 5.2 Random Variables, Probability Histograms and Probability Distributions A random variable (r.v.) can be either continuous or discrete. It takes on the possible values of an experiment. It
Discrete Probability Distribution
 1 Discrete Probability Distribution Key Definitions Discrete Random Variable: Has a countable number of values. This means that each data point is distinct and separate. Continuous Random Variable: Has
Honors Statistics. Daily Agenda
 Honors Statistics Aug 23-8:26 PM Daily Agenda Aug 23-8:31 PM 1 Write a program to generate random numbers. I've decided to give them free will. A Skip 4, 12, 16 Apr 25-10:55 AM Toss 4 times Suppose you
Section 5 3 The Mean and Standard Deviation of a Binomial Distribution!
 Section 5 3 The Mean and Standard Deviation of a Binomial Distribution! Previous sections required that you to find the Mean and Standard Deviation of a Binomial Distribution by using the values from a
Probability Distributions
 4.1 Probability Distributions Random Variables A random variable x represents a numerical value associated with each outcome of a probability distribution. A random variable is discrete if it has a finite
Statistics 6 th Edition
 Statistics 6 th Edition Chapter 5 Discrete Probability Distributions Chap 5-1 Definitions Random Variables Random Variables Discrete Random Variable Continuous Random Variable Ch. 5 Ch. 6 Chap 5-2 Discrete
STA Module 3B Discrete Random Variables
 STA 2023 Module 3B Discrete Random Variables Learning Objectives Upon completing this module, you should be able to 1. Determine the probability distribution of a discrete random variable. 2. Construct
CHAPTER 6 Random Variables
 CHAPTER 6 Random Variables 6.3 Binomial and Geometric Random Variables The Practice of Statistics, 5th Edition Starnes, Tabor, Yates, Moore Bedford Freeman Worth Publishers Binomial and Geometric Random
Overview. Definitions. Definitions. Graphs. Chapter 5 Probability Distributions. probability distributions
 Chapter 5 Probability Distributions 5-1 Overview 5-2 Random Variables 5-3 Binomial Probability Distributions 5-4 Mean, Variance, and Standard Deviation for the Binomial Distribution 5-5 The Poisson Distribution
23.1 Probability Distributions
 3.1 Probability Distributions Essential Question: What is a probability distribution for a discrete random variable, and how can it be displayed? Explore Using Simulation to Obtain an Empirical Probability
CHAPTER 6 Random Variables
 CHAPTER 6 Random Variables 6.3 Binomial and Geometric Random Variables The Practice of Statistics, 5th Edition Starnes, Tabor, Yates, Moore Bedford Freeman Worth Publishers Binomial and Geometric Random
Binomial Distributions
 Binomial Distributions Binomial Experiment The experiment is repeated for a fixed number of trials, where each trial is independent of the other trials There are only two possible outcomes of interest
A random variable is a (typically represented by ) that has a. value, determined by, A probability distribution is a that gives the
 that has a. value, determined by, A probability distribution is a that gives the") 5.2 RANDOM VARIABLES A random variable is a (typically represented by ) that has a value, determined by, for each of a. A probability distribution is a that gives the for each value of the. It is often
5.2 RANDOM VARIABLES A random variable is a (typically represented by ) that has a value, determined by, for each of a. A probability distribution is a that gives the for each value of the. It is often
chapter 13: Binomial Distribution Exercises (binomial)13.6, 13.12, 13.22, 13.43
13.6, 13.12, 13.22, 13.43") chapter 13: Binomial Distribution ch13-links binom-tossing-4-coins binom-coin-example ch13 image Exercises (binomial)13.6, 13.12, 13.22, 13.43 CHAPTER 13: Binomial Distributions The Basic Practice of Statistics
chapter 13: Binomial Distribution ch13-links binom-tossing-4-coins binom-coin-example ch13 image Exercises (binomial)13.6, 13.12, 13.22, 13.43 CHAPTER 13: Binomial Distributions The Basic Practice of Statistics
We use probability distributions to represent the distribution of a discrete random variable.
 Now we focus on discrete random variables. We will look at these in general, including calculating the mean and standard deviation. Then we will look more in depth at binomial random variables which are
Chapter 4. Section 4.1 Objectives. Random Variables. Random Variables. Chapter 4: Probability Distributions
 Chapter 4: Probability s 4. Probability s 4. Binomial s Section 4. Objectives Distinguish between discrete random variables and continuous random variables Construct a discrete probability distribution
Chapter 11. Data Descriptions and Probability Distributions. Section 4 Bernoulli Trials and Binomial Distribution
 Chapter 11 Data Descriptions and Probability Distributions Section 4 Bernoulli Trials and Binomial Distribution 1 Learning Objectives for Section 11.4 Bernoulli Trials and Binomial Distributions The student
Chapter 8: Binomial and Geometric Distributions
 Chapter 8: Binomial and Geometric Distributions Section 8.1 Binomial Distributions The Practice of Statistics, 4 th edition For AP* STARNES, YATES, MOORE Section 8.1 Binomial Distribution Learning Objectives
Theoretical Foundations
 Theoretical Foundations Probabilities Monia Ranalli monia.ranalli@uniroma2.it Ranalli M. Theoretical Foundations - Probabilities 1 / 27 Objectives understand the probability basics quantify random phenomena
* Source:
 Problem: A recent report from Gallup stated that most teachers don t want to be armed in school. Gallup asked K-12 teachers if they would be willing to be trained so they could carry a gun at school. Eighteen
Probability is the tool used for anticipating what the distribution of data should look like under a given model.
 AP Statistics NAME: Exam Review: Strand 3: Anticipating Patterns Date: Block: III. Anticipating Patterns: Exploring random phenomena using probability and simulation (20%-30%) Probability is the tool used
Chapter 6: Random Variables
 Chapter 6: Random Variables Section 6.3 The Practice of Statistics, 4 th edition For AP* STARNES, YATES, MOORE Chapter 6 Random Variables 6.1 Discrete and Continuous Random Variables 6.2 Transforming and
The Normal Probability Distribution
 1 The Normal Probability Distribution Key Definitions Probability Density Function: An equation used to compute probabilities for continuous random variables where the output value is greater than zero
Chapter 3 - Lecture 5 The Binomial Probability Distribution
 Chapter 3 - Lecture 5 The Binomial Probability October 12th, 2009 Experiment Examples Moments and moment generating function of a Binomial Random Variable Outline Experiment Examples A binomial experiment
MAKING SENSE OF DATA Essentials series
 MAKING SENSE OF DATA Essentials series THE NORMAL DISTRIBUTION Copyright by City of Bradford MDC Prerequisites Descriptive statistics Charts and graphs The normal distribution Surveys and sampling Correlation
A probability distribution shows the possible outcomes of an experiment and the probability of each of these outcomes.
 Introduction In the previous chapter we discussed the basic concepts of probability and described how the rules of addition and multiplication were used to compute probabilities. In this chapter we expand
Chapter 6: Random Variables
 Chapter 6: Random Variables Section 6.1 Discrete and Continuous Random Variables The Practice of Statistics, 4 th edition For AP* STARNES, YATES, MOORE Chapter 6 Random Variables 6.1 Discrete and Continuous
Uniform Probability Distribution. Continuous Random Variables &
 Continuous Random Variables & What is a Random Variable? It is a quantity whose values are real numbers and are determined by the number of desired outcomes of an experiment. Is there any special Random
Let X be the number that comes up on the next roll of the die.
 Chapter 6 - Discrete Probability Distributions 6.1 Random Variables Introduction If we roll a fair die, the possible outcomes are the numbers 1, 2, 3, 4, 5, and 6, and each of these numbers has probability
STA Rev. F Learning Objectives. What is a Random Variable? Module 5 Discrete Random Variables
 STA 2023 Module 5 Discrete Random Variables Learning Objectives Upon completing this module, you should be able to: 1. Determine the probability distribution of a discrete random variable. 2. Construct
Determine whether the given procedure results in a binomial distribution. If not, state the reason why.
 Math 5.3 Binomial Probability Distributions Name 1) Binomial Distrbution: Determine whether the given procedure results in a binomial distribution. If not, state the reason why. 2) Rolling a single die
ME3620. Theory of Engineering Experimentation. Spring Chapter III. Random Variables and Probability Distributions.
 ME3620 Theory of Engineering Experimentation Chapter III. Random Variables and Probability Distributions Chapter III 1 3.2 Random Variables In an experiment, a measurement is usually denoted by a variable
Experimental Probability - probability measured by performing an experiment for a number of n trials and recording the number of outcomes
 MDM 4U Probability Review Properties of Probability Experimental Probability - probability measured by performing an experiment for a number of n trials and recording the number of outcomes Theoretical
L04: Homework Answer Key
 L04: Homework Answer Key Instructions: You are encouraged to collaborate with other students on the homework, but it is important that you do your own work. Before working with someone else on the assignment,
30 Wyner Statistics Fall 2013
 30 Wyner Statistics Fall 2013 CHAPTER FIVE: DISCRETE PROBABILITY DISTRIBUTIONS Summary, Terms, and Objectives A probability distribution shows the likelihood of each possible outcome. This chapter deals
Lecture Slides. Elementary Statistics Tenth Edition. by Mario F. Triola. and the Triola Statistics Series. Slide 1
 Lecture Slides Elementary Statistics Tenth Edition and the Triola Statistics Series by Mario F. Triola Slide 1 Chapter 6 Normal Probability Distributions 6-1 Overview 6-2 The Standard Normal Distribution
AP Statistics Ch 8 The Binomial and Geometric Distributions
 Ch 8.1 The Binomial Distributions The Binomial Setting A situation where these four conditions are satisfied is called a binomial setting. 1. Each observation falls into one of just two categories, which
Random Variables. 6.1 Discrete and Continuous Random Variables. Probability Distribution. Discrete Random Variables. Chapter 6, Section 1
 6.1 Discrete and Continuous Random Variables Random Variables A random variable, usually written as X, is a variable whose possible values are numerical outcomes of a random phenomenon. There are two types
Part 1 In which we meet the law of averages. The Law of Averages. The Expected Value & The Standard Error. Where Are We Going?
 1 The Law of Averages The Expected Value & The Standard Error Where Are We Going? Sums of random numbers The law of averages Box models for generating random numbers Sums of draws: the Expected Value Standard
Chapter 9: Sampling Distributions
 Chapter 9: Sampling Distributions 9. Introduction This chapter connects the material in Chapters 4 through 8 (numerical descriptive statistics, sampling, and probability distributions, in particular) with
EXERCISES ACTIVITY 6.7
 762 CHAPTER 6 PROBABILITY MODELS EXERCISES ACTIVITY 6.7 1. Compute each of the following: 100! a. 5! I). 98! c. 9P 9 ~~ d. np 9 g- 8Q e. 10^4 6^4 " 285^1 f-, 2 c 5 ' sq ' sq 2. How many different ways
Chapter 5. Discrete Probability Distributions. Random Variables
 Chapter 5 Discrete Probability Distributions Random Variables x is a random variable which is a numerical description of the outcome of an experiment. Discrete: If the possible values change by steps or
Chapter 6: Random Variables. Ch. 6-3: Binomial and Geometric Random Variables
 Chapter : Random Variables Ch. -3: Binomial and Geometric Random Variables X 0 2 3 4 5 7 8 9 0 0 P(X) 3???????? 4 4 When the same chance process is repeated several times, we are often interested in whether
STAT Chapter 5: Continuous Distributions. Probability distributions are used a bit differently for continuous r.v. s than for discrete r.v. s.
 STAT 515 -- Chapter 5: Continuous Distributions Probability distributions are used a bit differently for continuous r.v. s than for discrete r.v. s. Continuous distributions typically are represented by
Making Sense of Cents
 Name: Date: Making Sense of Cents Exploring the Central Limit Theorem Many of the variables that you have studied so far in this class have had a normal distribution. You have used a table of the normal
Part 10: The Binomial Distribution
 Part 10: The Binomial Distribution The binomial distribution is an important example of a probability distribution for a discrete random variable. It has wide ranging applications. One readily available
Part V - Chance Variability
 Part V - Chance Variability Dr. Joseph Brennan Math 148, BU Dr. Joseph Brennan (Math 148, BU) Part V - Chance Variability 1 / 78 Law of Averages In Chapter 13 we discussed the Kerrich coin-tossing experiment.
A Derivation of the Normal Distribution. Robert S. Wilson PhD.
 A Derivation of the Normal Distribution Robert S. Wilson PhD. Data are said to be normally distributed if their frequency histogram is apporximated by a bell shaped curve. In practice, one can tell by
Measures of Variation. Section 2-5. Dotplots of Waiting Times. Waiting Times of Bank Customers at Different Banks in minutes. Bank of Providence
 Measures of Variation Section -5 1 Waiting Times of Bank Customers at Different Banks in minutes Jefferson Valley Bank 6.5 6.6 6.7 6.8 7.1 7.3 7.4 Bank of Providence 4. 5.4 5.8 6. 6.7 8.5 9.3 10.0 Mean
Stats SB Notes 4.2 Completed.notebook February 22, Feb 21 11:39 AM. Chapter Outline
 Stats SB Notes 42 Completednotebook February 22, 2017 Chapter 4 Discrete Probability Distributions Chapter Outline 41 Probability Distributions 42 Binomial Distributions 43 More Discrete Probability Distributions
Binomial Random Variables. Binomial Random Variables
 Bernoulli Trials Definition A Bernoulli trial is a random experiment in which there are only two possible outcomes - success and failure. 1 Tossing a coin and considering heads as success and tails as
MA 1125 Lecture 18 - Normal Approximations to Binomial Distributions. Objectives: Compute probabilities for a binomial as a normal distribution.
 MA 25 Lecture 8 - Normal Approximations to Binomial Distributions Friday, October 3, 207 Objectives: Compute probabilities for a binomial as a normal distribution.. Normal Approximations to the Binomial
CHAPTER 6 Random Variables
 CHAPTER 6 Random Variables 6.1 Discrete and Continuous Random Variables The Practice of Statistics, 5th Edition Starnes, Tabor, Yates, Moore Bedford Freeman Worth Publishers Discrete and Continuous Random
Business Statistics. Chapter 5 Discrete Probability Distributions QMIS 120. Dr. Mohammad Zainal
 Department of Quantitative Methods & Information Systems Business Statistics Chapter 5 Discrete Probability Distributions QMIS 120 Dr. Mohammad Zainal Chapter Goals After completing this chapter, you should
Probability and Statistics. Copyright Cengage Learning. All rights reserved.
 Probability and Statistics Copyright Cengage Learning. All rights reserved. 14.3 Binomial Probability Copyright Cengage Learning. All rights reserved. Objectives Binomial Probability The Binomial Distribution
Simple Random Sample
 Simple Random Sample A simple random sample (SRS) of size n consists of n elements from the population chosen in such a way that every set of n elements has an equal chance to be the sample actually selected.
What do you think "Binomial" involves?
 Learning Goals: * Define a binomial experiment (Bernoulli Trials). * Applying the binomial formula to solve problems. * Determine the expected value of a Binomial Distribution What do you think "Binomial"
Chapter 5 Student Lecture Notes 5-1. Department of Quantitative Methods & Information Systems. Business Statistics
 Chapter 5 Student Lecture Notes 5-1 Department of Quantitative Methods & Information Systems Business Statistics Chapter 5 Discrete Probability Distributions QMIS 120 Dr. Mohammad Zainal Chapter Goals
Sampling Distributions For Counts and Proportions
 Sampling Distributions For Counts and Proportions IPS Chapter 5.1 2009 W. H. Freeman and Company Objectives (IPS Chapter 5.1) Sampling distributions for counts and proportions Binomial distributions for
Math 14 Lecture Notes Ch. 4.3
 4.3 The Binomial Distribution Example 1: The former Sacramento King's DeMarcus Cousins makes 77% of his free throws. If he shoots 3 times, what is the probability that he will make exactly 0, 1, 2, or
Binomial Random Variable - The count X of successes in a binomial setting
 6.3.1 Binomial Settings and Binomial Random Variables What do the following scenarios have in common? Toss a coin 5 times. Count the number of heads. Spin a roulette wheel 8 times. Record how many times
Essential Question: What is a probability distribution for a discrete random variable, and how can it be displayed?
 COMMON CORE N 3 Locker LESSON Distributions Common Core Math Standards The student is expected to: COMMON CORE S-IC.A. Decide if a specified model is consistent with results from a given data-generating
x is a random variable which is a numerical description of the outcome of an experiment.
 Chapter 5 Discrete Probability Distributions Random Variables is a random variable which is a numerical description of the outcome of an eperiment. Discrete: If the possible values change by steps or jumps.
A random variable (r. v.) is a variable whose value is a numerical outcome of a random phenomenon.
 is a variable whose value is a numerical outcome of a random phenomenon.") Chapter 14: random variables p394 A random variable (r. v.) is a variable whose value is a numerical outcome of a random phenomenon. Consider the experiment of tossing a coin. Define a random variable
Chapter 14: random variables p394 A random variable (r. v.) is a variable whose value is a numerical outcome of a random phenomenon. Consider the experiment of tossing a coin. Define a random variable
Example - Let X be the number of boys in a 4 child family. Find the probability distribution table:
 Chapter8 Probability Distributions and Statistics Section 8.1 Distributions of Random Variables tthe value of the result of the probability experiment is a RANDOM VARIABLE. Example - Let X be the number
Probability. An intro for calculus students P= Figure 1: A normal integral
 Probability An intro for calculus students.8.6.4.2 P=.87 2 3 4 Figure : A normal integral Suppose we flip a coin 2 times; what is the probability that we get more than 2 heads? Suppose we roll a six-sided
II - Probability. Counting Techniques. three rules of counting. 1multiplication rules. 2permutations. 3combinations
 II - Probability Counting Techniques three rules of counting 1multiplication rules 2permutations 3combinations Section 2 - Probability (1) II - Probability Counting Techniques 1multiplication rules In
Midterm Test 1 (Sample) Student Name (PRINT):... Student Signature:... Use pencil, so that you can erase and rewrite if necessary.
 Student Name (PRINT):... Student Signature:... Use pencil, so that you can erase and rewrite if necessary.") MA 180/418 Midterm Test 1 (Sample) Student Name (PRINT):............................................. Student Signature:................................................... Use pencil, so that you can erase
MA 180/418 Midterm Test 1 (Sample) Student Name (PRINT):............................................. Student Signature:................................................... Use pencil, so that you can erase
A.REPRESENTATION OF DATA
 A.REPRESENTATION OF DATA (a) GRAPHS : PART I Q: Why do we need a graph paper? Ans: You need graph paper to draw: (i) Histogram (ii) Cumulative Frequency Curve (iii) Frequency Polygon (iv) Box-and-Whisker
Example 1: Identify the following random variables as discrete or continuous: a) Weight of a package. b) Number of students in a first-grade classroom
 Weight of a package. b) Number of students in a first-grade classroom") Section 5-1 Probability Distributions I. Random Variables A variable x is a if the value that it assumes, corresponding to the of an experiment, is a or event. A random variable is if it potentially can
Section 5-1 Probability Distributions I. Random Variables A variable x is a if the value that it assumes, corresponding to the of an experiment, is a or event. A random variable is if it potentially can
Lecture 6 Probability
 Faculty of Medicine Epidemiology and Biostatistics الوبائيات واإلحصاء الحيوي (31505204) Lecture 6 Probability By Hatim Jaber MD MPH JBCM PhD 3+4-7-2018 1 Presentation outline 3+4-7-2018 Time Introduction-
Discrete Probability Distributions
 90 Discrete Probability Distributions Discrete Probability Distributions C H A P T E R 6 Section 6.2 4Example 2 (pg. 00) Constructing a Binomial Probability Distribution In this example, 6% of the human
Chapter 7: Random Variables
 Chapter 7: Random Variables 7.1 Discrete and Continuous Random Variables 7.2 Means and Variances of Random Variables 1 Introduction A random variable is a function that associates a unique numerical value
Chapter 7. Random Variables
 Chapter 7 Random Variables Making quantifiable meaning out of categorical data Toss three coins. What does the sample space consist of? HHH, HHT, HTH, HTT, TTT, TTH, THT, THH In statistics, we are most
Every data set has an average and a standard deviation, given by the following formulas,
 Discrete Data Sets A data set is any collection of data. For example, the set of test scores on the class s first test would comprise a data set. If we collect a sample from the population we are interested
The Binomial and Geometric Distributions. Chapter 8
 The Binomial and Geometric Distributions Chapter 8 8.1 The Binomial Distribution A binomial experiment is statistical experiment that has the following properties: The experiment consists of n repeated