Lecture 6 Probability
|
|
|
- Emerald Owen
- 5 years ago
- Views:
Transcription
 Lecture 6 Probability By Hatim Jaber MD MPH JBCM PhD 3+4-7-2018 1")
1 Faculty of Medicine Epidemiology and Biostatistics الوبائيات واإلحصاء الحيوي ( ) Lecture 6 Probability By Hatim Jaber MD MPH JBCM PhD
2 Presentation outline Time Introduction- Laws of Chance 10:30 to 10:40 Basic concepts 10:40 to 10:50 Additional law of probability 10: 50 to 11:10 Multiplication law of probability Binomial law of probability distribution Probability ( chances) from shape of normal distribution or normal curve or of calculated values from tables. 11:10 to 11:25 11:25 to 11:35 2

3 Probability -Laws of Chance- It started in Europe in 16 th century for gambling prediction Then has been used for epidemiology, genetics, insurance, and electronics etc 3

4 Probability It defined as relative frequency or probable chances of occurrence. knowledge about probabilities comes from the relative frequency of a large number of trials Probability theory is the branch of mathematics concerned with analysis of random phenomena. 4
5 Probability It s the likelihood, chances, or odds of a particular event happening. It usually expressed by P. The probability of an event is the measure of the chance that the event will occur as a result of an experiment. 5
6 The probability of an event A is the number of ways event A can occur divided by the total number of possible outcomes. The same for P(B). The probability of an event A, symbolized by P(A). P should be a number between 0 and 1. If P(A) > P(B) then event A is more likely to occur than event B. If P(A) = P(B) then events A and B are equally likely to occur 6
7 basic concepts probability of an event = p 0 <= p <= 1 0 = certain non-occurrence impossible 1 = certain occurrence inevitable P=.5 = even odds P=.1 = 1 chance out of 10 P= 0 (find 7 in a dice, one swims the Atlantic ocean, P or chance of survival after rabies) P= 1 ( any number from 1-6 in a dice, one dies someday) 7
8 basic concepts cont.: If the probability of an event happening is P and that not happening is q then q = 1 P or P + q = 1 P = total number of occurrences of the event / total number of trials P is a (proportion) 8
9 Ex 1: A jar contains : 3 red marbles, 7 green marbles and 10 white marbles. If a marble is drawn from the jar at random, what is the probability that this marble is white? 9
10 Answer 1 : Color frequency: red 3, green 7, white 10. The total number is 20 P = 10 \ 20 = 1 \ 2 10
11 Problem A spinner has 4 equal sectors colored yellow, blue, green and red. What are the chances of landing on blue after spinning the spinner? What are the chances of landing on other colors? 11
12 Definitions An experiment is a situation involving chance or probability that leads to results called outcomes.in the problem above, the experiment is spinning the spinner An outcome is the result of a single trial of an experiment.the possible outcomes are landing on yellow, blue, green or red An event is one or more outcomes of an experiment.one event of this experiment is landing on blue Probability is the measure of how likely an event is.the probability of landing on blue is one fourth. 12
13 Experiment 1 A spinner has 4 equal sectors colored yellow, blue, green and red. After spinning the spinner, what is the probability of landing on each color? Outcomes :The possible outcomes of this experiment are yellow, blue, green, and red 13
14 The chances of landing on blue are 1 in 4, or one fourth. The chances of landing on other colors are 3 in 4, or three fourth. 14
15 Probabilities Solution: P(yellow) = no. of ways to land on yellow / total no. colors = ¼ P(blue) = no. of ways to land on blue /total no. of colors = 1 / 4 P (green)= no. of ways to land on green/ total no. of colors = 1 /4 P (red) = no. of ways to land on green/ total no. of colors = 1 /4 P of other colors is = ¾ or we can say 1 ¼ = 3/4 15
16 Experiment 2 A single 6-sided die is rolled. What is the probability of each outcome? What is the probability of rolling an even number? of rolling an odd number? Outcomes: The possible outcomes of this experiment are 1, 2, 3, 4, 5 and 6. 16
17 Probabilities P(1)= # of ways to roll a 1 = 1 total # of sides 6 P(2) = # of ways to roll a 2 = 1 total # of sides 6 P(3) = # of ways to roll a 3 = 1 total # of sides 6 P(4) = # of ways to roll a 4 = 1 total # of sides 6 17
18 P(5) = # of ways to roll a 5 = 1 total # of sides 6 P(6) = # of ways to roll a 6 = 1 total # of sides 6 P(even)=# ways to roll an even number = 3 = 1 total # of sides 6 2 P(odd) = # ways to roll an odd number = 3 = 1 total # of sides
19 Example: If P of Rhesus ve = 1/10 What s the probability of being Rhesus +ve? 1 P = q 1-1/10= 9/10 If P of a pregnancy resulting in a multiple birth is 1/80 What s the probability of a single birth? 1 1/80 = 79/80 19
20 Ex : From 200 Kidney transplant succeeds occur in 80 cases. So p of survival calculated as? What is P for failure? 20
21 Answer : P = no. of survival / total number of patients = 80 / 200 = 2/ 5 = 0.4 q = 1- p = 1-2/5 = 3/5 =
22 The probability that a coin will fall head P = ½ If one event precludes the possibility of other specified events, the events are mutually exclusive Tossing a head or a tail with one throw of a coin are mutually exclusive (do not occur together) When all possible outcomes of mutually exclusive events are given, their probabilities sum to 1 22
 from shape of normal distribution or normal curve.")
23 Laws of probability 1- Additional law of probability 2- Multiplication law of probability 3- Binomial law of probability distribution 4- Probability ( chances) from shape of normal distribution or normal curve. 5- Probability of calculated values from tables. 23
24 Addition Law of Probability The probability that an event will occur in one of several possible ways is the sum of the individual probabilities of these separate events The addition rule is a result used to determine the probability that event A or event B will occurs. The result is often written as follows, using set notation: P(A U B)= P (A) + P (B) 24
25 Addition Rule P(A) = probability that event A occurs P(B) = probability that event B occurs P(A U B)= Probability that event A or event B can occur. The addition rule therefore reduces to: P(A U B)= P (A) + P (B) 25
26 Examples on Addition Law of Probability What s the probability of throwing a 6 or a 2 with a particular one set of dice? 1/6 + 1/6 = 2/6= 1/3 -- What s the probability of tossing a coin a head or a tail with one throw? All the probabilities =½+ ½= 1 (it s inevitable) 26

27 Question: A glass jar contains: 6 red, 5 green, 8 blue and 3 yellow marbles. If a single marble is chosen at random from the jar, what is the probability of choosing a red marble? a green marble or a blue marble? 27
28 Answer : The possible outcomes of this experiment are red, : 3\11=6 \ 22 P of Green or blue? 5 \ \ 22 = 13\22 28
29 Example 2 A large basket of fruit contains 3 oranges, 2 apples and 5 bananas. If a piece of fruit is chosen at random, what is the probability of getting an orange or a banana? a. 1/2 b. 4/5 c. 1/17 d. None of the above 29
30 Example 3 In a class of 30 students, there are 17 girls and 13 boys. Five are A students, and three of these students are girls. If a student is chosen at random, what is the probability of choosing a girl or an A boy student? a.11\15 b.17\180 c.19\30 d. None of the above 30
31 What s the probability of being a single and Rhesus +ve birth? We can t use the Addition Law of probability Why? Because these events can occur together (they are not mutually exclusive) 31
32 Multiplication Law of Probability It applies to events which do not affect each other (are independent) occurring together Independent events which do not affect each other. The multiplication rule is a result used to determine the probability that two events, A and B, both occur. 32
33 Multiplication Law of Probability Where: P(A) = probability that event A occurs P(B) = probability that event B occurs P (A B)= probability that event A and event B occur 33
34 Multiplication Law of Probability For independent events, that is events which have no influence on one another, the rule simplifies to: P (A B)= P (A). P (B) That is, the probability of the joint events A and B is equal to the product of the individual probabilities for the two events. 34
35 Examples -- What s the probability of being a single and Rhesus+ve birth? 9/10 X 79/80= 711/ If the probability of a female birth is ½, what s the probability of being a female Rhesus+ve birth? ½ X 9/10= 9/20 -- What s the probability of being a female single Rhesus+ve birth? ½ X 79/80 X 9/10= 711/
36 Example A bag contains: 4 white shirt, 6 black shirt, and 1 green shirt. What is the probability of drawing: a) A white shirt? b) A black shirt? c) A white shirt or a black shirt? d) A white shirt or a green shirt? E) white shirt and a green shirt? 36
37 Answer s P white = 4\11 P green = 1\11 A white or black = 4\11+6\11= 10\11 A white or green = 4\11+1\11= 5\11 A white and green = 4/11x 1/11 = 4/121 37
38 Example - If a fair coin and a die is tossed - what is the probability of getting a head and four? Answer P (A) = 1\2 P (B) = 1\6 P (A+ B) = 1\2 x 1\6 = 1\12 38
39 Example A pair of dice is rolled. What is the probability of getting a sum of 2? a. 1\3 b. 1\6 c. 1\36 d. None of the above 39
40 Example In an addiction treatment, failure occurs with P 60% a) What s P for success of the treatment for one addict? b) What s P for failure of the treatment for two addicts? c) What s P for success of the treatment for two addicts? 40
41 Answer 15 a) 1-6/10= 4/10= 0.4 b) 6/10. 6/10 = 36/100 = 0.36 c) 4/10. 4/10 = 16/100 =

 Probability that event A and")

42 P(A U B)= P (A)+ P (B) Probability that event A or event B occurs. P (A B)= P (A).P (B) Probability that event A and event B both occur. For mutually exclusive events, mean events which cannot occur together 42
 -0.00001 b) 0.5 c) 1.")
43 Question 2: Which of these numbers cannot be a probability? a) b) 0.5 c) d) 0 e) 1 f) 20% 43
44 The blood groups of 200 people is distributed as follows: 50 have type A blood, 65 have B blood type, 70 have O blood type and 15 have type AB blood. 1. If a person from this group is selected at random, what is the probability that this person has O blood type? 2. Having a person with blood group O or A? 44
45 Answer : P= 70\200= 0.35 P = 70/ /200 = 120/200 =
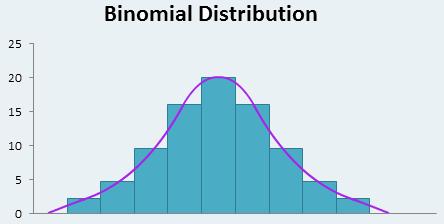
46 Binomial Distributions 46
47 Objectives / Assignment How to determine if a probability experiment is a binomial experiment How to find binomial probabilities using the binomial probability table and technology How to construct a binomial distribution and its graph How to find the mean, variance and standard deviation of a binomial probability distribution 47
48 Binomial Experiments There are many probability experiments for which the results of each trial can be reduced to two outcomes: success and failure. For instance, when a basketball player attempts a free throw, he or she either makes the basket or does not. Probability experiments such as these are called binomial experiments. 48
49 Definition A binomial experiment is a probability experiment that satisfies the following conditions: 1. The experiment is repeated for a fixed number of trials, where each trial is independent of the other trials. 2. There are only two possible outcomes of interest for each trial. The outcomes can be classified as a success (S) or as a failure (F). 3. The probability of a success, P(S), is the same for each trial. 4. The random variable, x, counts the number of successful trials. 49
50 To find binomial probabilities: 1. Direct substitution. (can be hard if n is large) 2. Use approximation 3. Computer software (most common source) 4. Binomial table
51 Binomial theorem Summarizes how odds/probabilities are distributed among the events that can arise from a series of trials P(n,x,p) probability of k successes in n trials where the probability of success on any one trial is p success = some specific event or outcome x specified outcomes n trials p probability of the specified outcome in 1 trial 51
52 Notation for Binomial Experiments Symbol n p = P(S) q = P(F) x Description The number of times a trial is repeated. The probability of success in a single trial. The probability of failure in a single trial (q = 1 p) The random variable represents a count of the number of successes in n trials: x = 0, 1, 2, 3,... n. 52

53 Note: Here is a simple example of binomial experiment. From a standard deck of cards, you pick a card, note whether it is a club or not, and replace the card. You repeat the experiment 5 times, so n = 5. The outcomes for each trial can be classified in two categories: S = selecting a club and F = selecting another suit. The probabilities of success and failure are: p = P(S) = ¼ and q = P(F) = ¾. The random variable x represents the number of clubs selected in the 5 trials. Note that x is a discrete random variable because its possible values can be listed. 53
54 Ex. 1: Binomial Experiments Decide whether the experiment is a binomial experiment. If it is, specify the values of n, p and q and list the possible values of the random variable, x. If it is not, explain why. 1. A certain surgical procedure has an 85% chance of success. A doctor performs the procedure on eight patients. The random variable represents the number of successful surgeries. 54
55 Ex. 1: Binomial Experiments Solution: the experiment is a binomial experiment because it satisfies the four conditions of a binomial experiment: 1. In the experiment, each surgery represents one trial. 2. There are eight surgeries, 3. and each surgery is independent of the others. 4. Also, there are only two possible outcomes for each surgery either the surgery is a success or it is a failure. Finally, the probability of success for each surgery is n = 8 p = 0.85 q = = 0.15 x = 0, 1, 2, 3, 4, 5, 6, 7, 8 55
56 Ex. 2: Binomial Experiments Decide whether the experiment is a binomial experiment. If it is, specify the values of n, p and q and list the possible values of the random variable, x. If it is not, explain why. 2. A jar contains 5 red marbles, 9 blue marbles and 6 green marbles. You randomly select 3 marbles from the jar, without replacement. The random variable represents the number of red marbles. 56
57 Ex. 2: Binomial Experiments Solution: The experiment is not a binomial experiment because it does not satisfy all four conditions of a binomial experiment. In the experiment, each marble selection represents one trial and selecting a red marble is a success. When selecting the first marble, the probability of success is 5/20. However because the marble is not replaced, the probability is no longer 5/20. So the trials are not independent, and the probability of a success is not the same for each trial. 57
58 Binomial Probabilities There are several ways to find the probability of x successes in n trials of a binomial experiment. One way is to use the binomial probability formula. Binomial Probability Formula In a binomial experiment, the probability of exactly x successes in n trials is: P( x) n C x p x q n x ( n n! x)! x! p x q n x 58
59 P x n n, x, p C n, x p 1 p q x where C n, x n! x! n x! n! = n*(n-1)*(n-2) *1 (where n is an integer) 0!=1 59
60 Ex. 2 Finding Binomial Probabilities A six sided die is rolled 3 times. Find the probability of rolling exactly one 6. Roll 1 Roll 2 Roll 3 Frequency # of 6 s Probability (1)(1)(1) = 1 3 1/216 (1)(1)(5) = 5 2 5/216 (1)(5)(1) = 5 2 5/216 You could use a tree diagram (1)(5)(5) = /216 (5)(1)(1) = 5 2 5/216 (5)(1)(5) = /216 (5)(5)(1) = /216 (5)(5)(5) = /216 60
61 Ex. 3 Finding Binomial Probabilities There are three outcomes that have exactly one six, and each has a probability of 25/216. So, the probability of rolling exactly one six is 3(25/216) Another way to answer the question is to use the binomial probability formula. In this binomial experiment, rolling a 6 is a success while rolling any other number is a failure. The values for n, p, q, and x are n = 3, p = 1/6, q = 5/6 and x = 1. The probability of rolling exactly one 6 is: P( x) n C x p x q n x ( n n! x)! x! p x q n x Or you could use the binomial probability formula 61
62 Ex. 2 Finding Binomial Probabilities P(1) (3 3! 1)! 1! ( )( ) ( )( ) ( ) ( ) ( ) By listing the possible values of x with the corresponding probability of each, you can construct a binomial probability distribution. 62
63 Ex. 3: Constructing a Binomial Distribution In a survey, American workers and retirees are asked to name their expected sources of retirement income. Seven workers who participated in the survey are asked whether they expect to rely on social security for retirement income. Create a binomial probability distribution for the number of workers who respond yes. P for yes is
64 Solution From the graph, you can see that 36% of working Americans expect to rely on social security for retirement income. So, p = 0.36 and q = Because n = 7, the possible values for x are 0, 1, 2, 3, 4, 5, 6 and P(0) 7C0(0.36) (0.64) P(1) 7C1(0.36) (0.64) P(2) 7C2(0.36) (0.64) 3 4 P(3) 7C3(0.36) (0.64) 4 3 P(4) 7C4(0.36) (0.64) 5 2 P(5) 7C5(0.36) (0.64) 6 1 P(6) 7C 6(0.36) (0.64) P(7) 7C7(0.36) (0.64) x P(x) P(x) = 1 Notice all the probabilities are between 0 and 1 and that the sum of the probabilities is 1. 64
65 Note: Finding binomial probabilities with the binomial formula can be a tedious and mistake prone process. To make this process easier, you can use a binomial probability Table B lists the binomial probability for selected values of n and p. 65
66 How to use Table V Example: The probability that a lunar eclipse will be obscured by clouds at an observatory near Buffalo, New York, is use table V to find the probabilities that at most three of 8 lunar eclipses will be obscured by clouds at that location. for n=8, p=0.6 p( x 3) p( x 0) p( x 1) p( x 2) p( x 3)

67 Ex. 4: Finding a Binomial Probability Using a Table Fifty percent of working adults spend less than 20 minutes commuting to their jobs. If you randomly select six working adults, what is the probability that exactly three of them spend less than 20 minutes commuting to work? Use a table to find the probability. Solution: A portion of Table is shown here. Using the distribution for n = 6 and p = 0.5, you can find the probability that x = 3, as shown by the highlighted areas in the table. 67
68 Ex. 4: Finding a Binomial Probability Using a Table The probability if you look at n = 6 and x = 3 over to 0.50 is.312. So the probability that exactly 3 out of the six workers spend less than 20 minutes commuting to work is Ex. 5 Using Technology to find a Binomial Probability An even more efficient way to find binomial probability is to use a calculator or a computer. For instance, you can find binomial probabilities by using Excel on the computer. 68
69 Example: Treatment of Kidney Cancer X ~ BIN(40,.20), find the probability that 16 or more patients survive at least 5 years. USE COMPUTER! Binomial Probability calculator in probabilities JMP are computed automatically for greater than or equal to and less than or equal to x. Enter n = sample size x = observed # of successes p = probability of success 69
70 Example: Treatment of Kidney Cancer X ~ BIN(40,.20), find the probability that 16 or more patients survive at least 5 years. USE COMPUTER! Binomial Probability calculator in JMP P(X > 16) = The chance that we would see 16 or more patients out of 40 surviving at least 5 years if the new method has the same chance of success as the current methods (20%) is VERY SMALL,.0029!!!! 70
71 Ex. 6: Finding Binomial Probabilities A survey indicates that 41% of American women consider reading as their favorite leisure time activity. You randomly select four women and ask them if reading is their favorite leisure-time activity. Find the probability that: (1) exactly two of them respond yes, (2) at least two of them respond yes, and (3) fewer than two of them respond yes. 71
72 Ex. 6: Finding Binomial Probabilities #1--Using n = 4, p = 0.41, q = 0.59 and x =2, the probability that exactly two women will respond yes is: P(2) 4 C (0.41) 4! (0.41) (4 2)!2! 2 (0.59) (0.59) (.1681)(.3481) 4 6(.1681)(.3481)
73 Ex. 6: Finding Binomial Probabilities #2--To find the probability that at least two women will respond yes, you can find the sum of P(2), P(3), and P(4). Using n = 4, p = 0.41, q = 0.59 and x =2, the probability that at least two women will respond yes is: P(2) P(3) P(4) C C C (0.41) (0.41) (0.41) (0.59) (0.59) (0.59) P( x 2) P(2) P(3) P(4)
74 Ex. 6: Finding Binomial Probabilities #3--To find the probability that fewer than two women will respond yes, you can find the sum of P(0) and P(1). Using n = 4, p = 0.41, q = 0.59 and x =2, the probability that at least two women will respond yes is: P(0) P(1) 4 4 C C 1 0 (0.41) (0.41) 1 0 (0.59) (0.59) P( x 2) P(0) P(1)
75 Ex. 7: Constructing and Graphing a Binomial Distribution 65% of American households subscribe to cable TV. You randomly select six households and ask each if they subscribe to cable TV. Construct a probability distribution for the random variable, x. Then graph the distribution. P(0) P(1) P(2) P(3) 6 P(4) P(5) P(6) C C 1 C C C C C (0.65) (0.65) (0.65) (0.65) (0.65) (0.65) (0.65) 0 (0.35) (0.35) (0.35) (0.35) (0.35) (0.35) (0.35)
76 Ex. 7: Constructing and Graphing a Binomial Distribution 65% of American households subscribe to cable TV. You randomly select six households and ask each if they subscribe to cable TV. Construct a probability distribution for the random variable, x. Then graph the distribution. x P(x) Because each probability is a relative frequency, you can graph the probability using a relative frequency histogram as shown on the next slide. 76
77 Ex. 7: Constructing and Graphing a Binomial Distribution Then graph the distribution. x P(x) R e l a t i v e F r e q u e n c y Households P(x) NOTE: that the histogram is skewed left. The graph of a binomial distribution with p >.05 is skewed left, while the graph of a binomial distribution with p <.05 is skewed right. The graph of a binomial distribution with p =.05 is symmetric. 77
78 ex: coin toss we toss a coin three times, defining the outcome head as a success what are the possible outcomes? how do we calculate their probabilities? 78
79 coin toss (cont.) how do we assign values to P(n,x,p)? 3 trials; n = 3 even odds of success; p=.5 P(3,x,.5) there are 4 possible values for x, and we want to calculate P for each of them x 0 TTT 1 HTT (THT,TTH) 2 HHT (HTH, THH) 3 HHH probability of x successes in n trials where the probability of success on any one trial is p 79
80 P(3,k,.5) n x n x, p! p 1 p x P n P P, x!( n x)! 3! ,0, !(3 0)! 3! ,1, !(3 1)! k 80
81 Mean, Variance and Standard Deviation Although you can use the formulas learned previously for mean, variance and standard deviation of a probability distribution, the properties of a binomial distribution enable you to use much simpler formulas. They are on the next slide. 81
82 Population Parameters of a Binomial Distribution Mean: = np Variance: 2 = npq Standard Deviation: = npq 82
83 Ex. 8: Finding Mean, Variance and Standard Deviation In Pittsburgh, 57% of the days in a year are cloudy. Find the mean, variance, and standard deviation for the number of cloudy days during the month of June. What can you conclude? Solution: There are 30 days in June. Using n=30, p = 0.57, and q = 0.43, you can find the mean variance and standard deviation as shown. Mean: = np = 30(0.57) = 17.1 Variance: 2 = npq = 30(0.57)(0.43) = Standard Deviation: = npq =
84 Summary Probability is the likelihood that a particular event will occur. 0 Probabilit y 1 Conditions of classical probability are: mutually exclusive, and equally likely. P (E) m N 84
 P(E2) P(E3).")
85 Properties of Probability Given some process with n mutually exclusive outcomes (E 1, E 2,, E n ), then `P( ) 0 E i The sum of the probability of the mutually exclusive is one. P(E1) P(E2) P(E3)... P(En ) For any two mutually exclusive events (E 1, E 2 ), the probability of either E 1 ore 2 = `P( E1orE 2) P( E1 ) P( E2) 1 85
86 Calculating Probability Conditional Probability is the chance that an event will occur, given that some events has already occurred P(A B). What is the probability of selecting subject used cocaine 100+, given the selected subject is male? P(C M)= 25/75 = 0.33 Joint Probability is the chance of two or more events occurring together P(A B). What is the probability of selecting male subject used cocaine 100+, given the selected subject is male? P(C M)= P(C M ) P(M) =(75/111) *(0.33) = Addition Rule is the chance that A event, or B event, or both is P(A B)= P(A)+P(B)- P(A B). What is the probability of selecting subject to be male or used cocaine 100+, or both? P(C M)= 34/ /111-25/111 + =
87 Calculating Probability Independent events is the chance that an event A occur regardless of whether or not B occurs P(A B)= P(A). What is the probability of selecting subject used cocaine 100+, given the selected subject has green eye? P(c t)= 34/111 = The properties of independent events are: P(A B)= P(A)P(B) P(A B)= P(A), and P(B A)= P(B). P(A B)= P(A)P(B). 87
88 Probability rules Mutually excluded events Two events are mutually excluded if the occurrence of an event avoid the occurrence of the other. For example If a baby is male, cannot be female. If a child had positivity for E. histolytic, can not had negativity. The probability of occurrence of two mutually excluded events, is the probability of occurrence of an event or another, and we can obtain the probability, add the individual probabilities of each event.
89 Probability rules Example 100 new born in a maternity of Celaya 55 were females and 45 males Probability to be female 55/100 = 0.55 Probability to be male 45/100=0.45 Probability to be anyone = = 1.00
90 Probability rules Example 200 children with a test for E. histolytic 59 had positive result. 151 had negative result Probability of positivity for E. histolytic was 59/200= Probability of negativity for E. histolytic was 51/200 = Probability for positive or negative result was = 1.00
91 Probability rules Independent events Two events are independents if the occurrence of a event does not affect the occurrence of the second event. Example If the first new born is male, does not affect that the next be female. Probability of two independent events is obtained multiplying individual probabilities of each event. This is the multiplicative law of probability.
92 Probability rules Example In a blood bank, they determined blood groups: Group n % A B AB 5 5 Total What is the probability of next two persons will be 0 group? Is it mutually excluded or independent?
93 Probability rules If the next person has 0 group does not interfere with that the second next person has 0 group, because of this are independent events. Their individual probabilities, are multiplied: 0.45 x 0.45 = = 20.25%
94 Probability rules Example 100 new born in a maternity in Celaya 55 were females and 45 males Probability of to be women was 55/100 =0.55 Probability to be boy was 45/100 = 0.45 What is the probability of the next three deliveries are females?
95 Probability rules Example They are excluded mutually events, and their individual probabilities are multiplied x 0.55 x 0.55 = = 16.64%
96 Thank you 96
Lesson 97 - Binomial Distributions IBHL2 - SANTOWSKI
 Lesson 97 - Binomial Distributions IBHL2 - SANTOWSKI Opening Exercise: Example #: (a) Use a tree diagram to answer the following: You throwing a bent coin 3 times where P(H) = / (b) THUS, find the probability
Opening Exercise: Lesson 91 - Binomial Distributions IBHL2 - SANTOWSKI
 08-0- Lesson 9 - Binomial Distributions IBHL - SANTOWSKI Opening Exercise: Example #: (a) Use a tree diagram to answer the following: You throwing a bent coin times where P(H) = / (b) THUS, find the probability
Binomial Distributions
 Binomial Distributions Binomial Experiment The experiment is repeated for a fixed number of trials, where each trial is independent of the other trials There are only two possible outcomes of interest
Binomial Distributions
 Binomial Distributions A binomial experiment is a probability experiment that satisfies these conditions. 1. The experiment has a fixed number of trials, where each trial is independent of the other trials.
Chapter 4. Section 4.1 Objectives. Random Variables. Random Variables. Chapter 4: Probability Distributions
 Chapter 4: Probability s 4. Probability s 4. Binomial s Section 4. Objectives Distinguish between discrete random variables and continuous random variables Construct a discrete probability distribution
Chapter. Section 4.2. Chapter 4. Larson/Farber 5 th ed 1. Chapter Outline. Discrete Probability Distributions. Section 4.
 Chapter Discrete Probability s Chapter Outline 1 Probability s 2 Binomial s 3 More Discrete Probability s Copyright 2015, 2012, and 2009 Pearson Education, Inc 1 Copyright 2015, 2012, and 2009 Pearson
Stats SB Notes 4.2 Completed.notebook February 22, Feb 21 11:39 AM. Chapter Outline
 Stats SB Notes 42 Completednotebook February 22, 2017 Chapter 4 Discrete Probability Distributions Chapter Outline 41 Probability Distributions 42 Binomial Distributions 43 More Discrete Probability Distributions
Chapter 3. Discrete Probability Distributions
 Chapter 3 Discrete Probability Distributions 1 Chapter 3 Overview Introduction 3-1 The Binomial Distribution 3-2 Other Types of Distributions 2 Chapter 3 Objectives Find the exact probability for X successes
What is the probability of success? Failure? How could we do this simulation using a random number table?
 Probability Ch.4, sections 4.2 & 4.3 Binomial and Geometric Distributions Name: Date: Pd: 4.2. What is a binomial distribution? How do we find the probability of success? Suppose you have three daughters.
4.1 Probability Distributions
 Probability and Statistics Mrs. Leahy Chapter 4: Discrete Probability Distribution ALWAYS KEEP IN MIND: The Probability of an event is ALWAYS between: and!!!! 4.1 Probability Distributions Random Variables
Chapter 4. Probability Lecture 1 Sections: Fundamentals of Probability
 Chapter 4 Probability Lecture 1 Sections: 4.1 4.2 Fundamentals of Probability In discussing probabilities, we must take into consideration three things. Event: Any result or outcome from a procedure or
Probability & Sampling The Practice of Statistics 4e Mostly Chpts 5 7
 Probability & Sampling The Practice of Statistics 4e Mostly Chpts 5 7 Lew Davidson (Dr.D.) Mallard Creek High School Lewis.Davidson@cms.k12.nc.us 704-786-0470 Probability & Sampling The Practice of Statistics
guessing Bluman, Chapter 5 2
 Bluman, Chapter 5 1 guessing Suppose there is multiple choice quiz on a subject you don t know anything about. 15 th Century Russian Literature; Nuclear physics etc. You have to guess on every question.
Math 14 Lecture Notes Ch. 4.3
 4.3 The Binomial Distribution Example 1: The former Sacramento King's DeMarcus Cousins makes 77% of his free throws. If he shoots 3 times, what is the probability that he will make exactly 0, 1, 2, or
Theoretical Foundations
 Theoretical Foundations Probabilities Monia Ranalli monia.ranalli@uniroma2.it Ranalli M. Theoretical Foundations - Probabilities 1 / 27 Objectives understand the probability basics quantify random phenomena
Chapter 5. Discrete Probability Distributions. McGraw-Hill, Bluman, 7 th ed, Chapter 5 1
 Chapter 5 Discrete Probability Distributions McGraw-Hill, Bluman, 7 th ed, Chapter 5 1 Chapter 5 Overview Introduction 5-1 Probability Distributions 5-2 Mean, Variance, Standard Deviation, and Expectation
Random Variables. 6.1 Discrete and Continuous Random Variables. Probability Distribution. Discrete Random Variables. Chapter 6, Section 1
 6.1 Discrete and Continuous Random Variables Random Variables A random variable, usually written as X, is a variable whose possible values are numerical outcomes of a random phenomenon. There are two types
Ex 1) Suppose a license plate can have any three letters followed by any four digits.
 Suppose a license plate can have any three letters followed by any four digits.") AFM Notes, Unit 1 Probability Name 1-1 FPC and Permutations Date Period ------------------------------------------------------------------------------------------------------- The Fundamental Principle
AFM Notes, Unit 1 Probability Name 1-1 FPC and Permutations Date Period ------------------------------------------------------------------------------------------------------- The Fundamental Principle
PROBABILITY AND STATISTICS CHAPTER 4 NOTES DISCRETE PROBABILITY DISTRIBUTIONS
 PROBABILITY AND STATISTICS CHAPTER 4 NOTES DISCRETE PROBABILITY DISTRIBUTIONS I. INTRODUCTION TO RANDOM VARIABLES AND PROBABILITY DISTRIBUTIONS A. Random Variables 1. A random variable x represents a value
Probability Distributions
 4.1 Probability Distributions Random Variables A random variable x represents a numerical value associated with each outcome of a probability distribution. A random variable is discrete if it has a finite
Mathacle. PSet Stats, Concepts In Statistics Level Number Name: Date: Distribution Distribute in anyway but normal
 Distribution Distribute in anyway but normal VI. DISTRIBUTION A probability distribution is a mathematical function that provides the probabilities of occurrence of all distinct outcomes in the sample
6.1 Binomial Theorem
 Unit 6 Probability AFM Valentine 6.1 Binomial Theorem Objective: I will be able to read and evaluate binomial coefficients. I will be able to expand binomials using binomial theorem. Vocabulary Binomial
***SECTION 8.1*** The Binomial Distributions
 ***SECTION 8.1*** The Binomial Distributions CHAPTER 8 ~ The Binomial and Geometric Distributions In practice, we frequently encounter random phenomenon where there are two outcomes of interest. For example,
Binomial Random Variable - The count X of successes in a binomial setting
 6.3.1 Binomial Settings and Binomial Random Variables What do the following scenarios have in common? Toss a coin 5 times. Count the number of heads. Spin a roulette wheel 8 times. Record how many times
ECON 214 Elements of Statistics for Economists 2016/2017
 ECON 214 Elements of Statistics for Economists 2016/2017 Topic Probability Distributions: Binomial and Poisson Distributions Lecturer: Dr. Bernardin Senadza, Dept. of Economics bsenadza@ug.edu.gh College
Experimental Probability - probability measured by performing an experiment for a number of n trials and recording the number of outcomes
 MDM 4U Probability Review Properties of Probability Experimental Probability - probability measured by performing an experiment for a number of n trials and recording the number of outcomes Theoretical
Test - Sections 11-13
 Test - Sections 11-13 version 1 You have just been offered a job with medical benefits. In talking with the insurance salesperson you learn that the insurer uses the following probability calculations:
Part V - Chance Variability
 Part V - Chance Variability Dr. Joseph Brennan Math 148, BU Dr. Joseph Brennan (Math 148, BU) Part V - Chance Variability 1 / 78 Law of Averages In Chapter 13 we discussed the Kerrich coin-tossing experiment.
Probability Distribution
 Probability Distribution CK-12 Say Thanks to the Authors Click http://www.ck12.org/saythanks (No sign in required) To access a customizable version of this book, as well as other interactive content, visit
Chapter 6: Random Variables
 Chapter 6: Random Variables Section 6.1 Discrete and Continuous Random Variables The Practice of Statistics, 4 th edition For AP* STARNES, YATES, MOORE Chapter 6 Random Variables 6.1 Discrete and Continuous
Binomial distribution
 Binomial distribution Jon Michael Gran Department of Biostatistics, UiO MF9130 Introductory course in statistics Tuesday 24.05.2010 1 / 28 Overview Binomial distribution (Aalen chapter 4, Kirkwood and
Lecture 9. Probability Distributions. Outline. Outline
 Outline Lecture 9 Probability Distributions 6-1 Introduction 6- Probability Distributions 6-3 Mean, Variance, and Expectation 6-4 The Binomial Distribution Outline 7- Properties of the Normal Distribution
A.REPRESENTATION OF DATA
 A.REPRESENTATION OF DATA (a) GRAPHS : PART I Q: Why do we need a graph paper? Ans: You need graph paper to draw: (i) Histogram (ii) Cumulative Frequency Curve (iii) Frequency Polygon (iv) Box-and-Whisker
Econ 6900: Statistical Problems. Instructor: Yogesh Uppal
 Econ 6900: Statistical Problems Instructor: Yogesh Uppal Email: yuppal@ysu.edu Lecture Slides 4 Random Variables Probability Distributions Discrete Distributions Discrete Uniform Probability Distribution
Unit 04 Review. Probability Rules
 Unit 04 Review Probability Rules A sample space contains all the possible outcomes observed in a trial of an experiment, a survey, or some random phenomenon. The sum of the probabilities for all possible
Chapter 4 Probability Distributions
 Slide 1 Chapter 4 Probability Distributions Slide 2 4-1 Overview 4-2 Random Variables 4-3 Binomial Probability Distributions 4-4 Mean, Variance, and Standard Deviation for the Binomial Distribution 4-5
WorkSHEET 13.3 Probability III Name:
 WorkSHEET 3.3 Probability III Name: In the Lotto draw there are numbered balls. Find the probability that the first number drawn is: (a) a (b) a (d) even odd (e) greater than 40. Using: (a) P() = (b) P()
Lecture 9. Probability Distributions
 Lecture 9 Probability Distributions Outline 6-1 Introduction 6-2 Probability Distributions 6-3 Mean, Variance, and Expectation 6-4 The Binomial Distribution Outline 7-2 Properties of the Normal Distribution
Determine whether the given events are disjoint. 1) Drawing a face card from a deck of cards and drawing a deuce A) Yes B) No
 Drawing a face card from a deck of cards and drawing a deuce A) Yes B) No") Assignment 8.-8.6 Name MULTIPLE CHOICE. Choose the one alternative that best completes the statement or answers the question. Determine whether the given events are disjoint. 1) Drawing a face card from
Assignment 8.-8.6 Name MULTIPLE CHOICE. Choose the one alternative that best completes the statement or answers the question. Determine whether the given events are disjoint. 1) Drawing a face card from
Chapter 7. Random Variables
 Chapter 7 Random Variables Making quantifiable meaning out of categorical data Toss three coins. What does the sample space consist of? HHH, HHT, HTH, HTT, TTT, TTH, THT, THH In statistics, we are most
Fall 2015 Math 141:505 Exam 3 Form A
 Fall 205 Math 4:505 Exam 3 Form A Last Name: First Name: Exam Seat #: UIN: On my honor, as an Aggie, I have neither given nor received unauthorized aid on this academic work Signature: INSTRUCTIONS Part
CHAPTER 10: Introducing Probability
 CHAPTER 10: Introducing Probability The Basic Practice of Statistics 6 th Edition Moore / Notz / Fligner Lecture PowerPoint Slides Chapter 10 Concepts 2 The Idea of Probability Probability Models Probability
Examples: Random Variables. Discrete and Continuous Random Variables. Probability Distributions
 Random Variables Examples: Random variable a variable (typically represented by x) that takes a numerical value by chance. Number of boys in a randomly selected family with three children. Possible values:
Example. Chapter 8 Probability Distributions and Statistics Section 8.1 Distributions of Random Variables
 Chapter 8 Probability Distributions and Statistics Section 8.1 Distributions of Random Variables You are dealt a hand of 5 cards. Find the probability distribution table for the number of hearts. Graph
Chapter 3 - Lecture 5 The Binomial Probability Distribution
 Chapter 3 - Lecture 5 The Binomial Probability October 12th, 2009 Experiment Examples Moments and moment generating function of a Binomial Random Variable Outline Experiment Examples A binomial experiment
(c) The probability that a randomly selected driver having a California drivers license
 The probability that a randomly selected driver having a California drivers license") Statistics Test 2 Name: KEY 1 Classify each statement as an example of classical probability, empirical probability, or subjective probability (a An executive for the Krusty-O cereal factory makes an educated
Statistics Test 2 Name: KEY 1 Classify each statement as an example of classical probability, empirical probability, or subjective probability (a An executive for the Krusty-O cereal factory makes an educated
the number of correct answers on question i. (Note that the only possible values of X i
 6851_ch08_137_153 16/9/02 19:48 Page 137 8 8.1 (a) No: There is no fixed n (i.e., there is no definite upper limit on the number of defects). (b) Yes: It is reasonable to believe that all responses are
HHH HHT HTH THH HTT THT TTH TTT
 AP Statistics Name Unit 04 Probability Period Day 05 Notes Discrete & Continuous Random Variables Random Variable: Probability Distribution: Example: A probability model describes the possible outcomes
Math 160 Professor Busken Chapter 5 Worksheets
 Math 160 Professor Busken Chapter 5 Worksheets Name: 1. Find the expected value. Suppose you play a Pick 4 Lotto where you pay 50 to select a sequence of four digits, such as 2118. If you select the same
The Binomial distribution
 The Binomial distribution Examples and Definition Binomial Model (an experiment ) 1 A series of n independent trials is conducted. 2 Each trial results in a binary outcome (one is labeled success the other
PROBABILITY DISTRIBUTIONS
 CHAPTER 3 PROBABILITY DISTRIBUTIONS Page Contents 3.1 Introduction to Probability Distributions 51 3.2 The Normal Distribution 56 3.3 The Binomial Distribution 60 3.4 The Poisson Distribution 64 Exercise
Probability & Statistics Chapter 5: Binomial Distribution
 Probability & Statistics Chapter 5: Binomial Distribution Notes and Examples Binomial Distribution When a variable can be viewed as having only two outcomes, call them success and failure, it may be considered
Overview. Definitions. Definitions. Graphs. Chapter 4 Probability Distributions. probability distributions
 Chapter 4 Probability Distributions 4-1 Overview 4-2 Random Variables 4-3 Binomial Probability Distributions 4-4 Mean, Variance, and Standard Deviation for the Binomial Distribution 4-5 The Poisson Distribution
Pearson Education Limited Edinburgh Gate Harlow Essex CM20 2JE England and Associated Companies throughout the world
 Pearson Education Limited Edinburgh Gate Harlow Essex CM0 JE England and Associated Companies throughout the world Visit us on the World Wide Web at: www.pearsoned.co.uk Pearson Education Limited 04 All
Part 1 In which we meet the law of averages. The Law of Averages. The Expected Value & The Standard Error. Where Are We Going?
 1 The Law of Averages The Expected Value & The Standard Error Where Are We Going? Sums of random numbers The law of averages Box models for generating random numbers Sums of draws: the Expected Value Standard
Chapter 3 Class Notes Intro to Probability
 Chapter 3 Class Notes Intro to Probability Concept: role a fair die, then: what is the probability of getting a 3? Getting a 3 in one roll of a fair die is called an Event and denoted E. In general, Number
Example - Let X be the number of boys in a 4 child family. Find the probability distribution table:
 Chapter7 Probability Distributions and Statistics Distributions of Random Variables tthe value of the result of the probability experiment is a RANDOM VARIABLE. Example - Let X be the number of boys in
Mean, Median and Mode. Lecture 2 - Introduction to Probability. Where do they come from? We start with a set of 21 numbers, Statistics 102
 Mean, Median and Mode Lecture 2 - Statistics 102 Colin Rundel January 15, 2013 We start with a set of 21 numbers, ## [1] -2.2-1.6-1.0-0.5-0.4-0.3-0.2 0.1 0.1 0.2 0.4 ## [12] 0.4 0.5 0.6 0.7 0.7 0.9 1.2
Chapter 6: Random Variables
 Chapter 6: Random Variables Section 6.3 The Practice of Statistics, 4 th edition For AP* STARNES, YATES, MOORE Chapter 6 Random Variables 6.1 Discrete and Continuous Random Variables 6.2 Transforming and
MidTerm 1) Find the following (round off to one decimal place):
 Find the following (round off to one decimal place):") MidTerm 1) 68 49 21 55 57 61 70 42 59 50 66 99 Find the following (round off to one decimal place): Mean = 58:083, round off to 58.1 Median = 58 Range = max min = 99 21 = 78 St. Deviation = s = 8:535,
MidTerm 1) 68 49 21 55 57 61 70 42 59 50 66 99 Find the following (round off to one decimal place): Mean = 58:083, round off to 58.1 Median = 58 Range = max min = 99 21 = 78 St. Deviation = s = 8:535,
Probability and Sample space
 Probability and Sample space We call a phenomenon random if individual outcomes are uncertain but there is a regular distribution of outcomes in a large number of repetitions. The probability of any outcome
10 5 The Binomial Theorem
 10 5 The Binomial Theorem Daily Outcomes: I can use Pascal's triangle to write binomial expansions I can use the Binomial Theorem to write and find the coefficients of specified terms in binomial expansions
STOR 155 Introductory Statistics (Chap 5) Lecture 14: Sampling Distributions for Counts and Proportions
 Lecture 14: Sampling Distributions for Counts and Proportions") The UNIVERSITY of NORTH CAROLINA at CHAPEL HILL STOR 155 Introductory Statistics (Chap 5) Lecture 14: Sampling Distributions for Counts and Proportions 5/31/11 Lecture 14 1 Statistic & Its Sampling Distribution
The UNIVERSITY of NORTH CAROLINA at CHAPEL HILL STOR 155 Introductory Statistics (Chap 5) Lecture 14: Sampling Distributions for Counts and Proportions 5/31/11 Lecture 14 1 Statistic & Its Sampling Distribution
Example - Let X be the number of boys in a 4 child family. Find the probability distribution table:
 Chapter8 Probability Distributions and Statistics Section 8.1 Distributions of Random Variables tthe value of the result of the probability experiment is a RANDOM VARIABLE. Example - Let X be the number
Math 14 Lecture Notes Ch Mean
 4. Mean, Expected Value, and Standard Deviation Mean Recall the formula from section. for find the population mean of a data set of elements µ = x 1 + x + x +!+ x = x i i=1 We can find the mean of the
Binomial population distribution X ~ B(
 Chapter 9 Binomial population distribution 9.1 Definition of a Binomial distributio If the random variable has a Binomial population distributio i.e., then its probability function is given by p n n (
MANAGEMENT PRINCIPLES AND STATISTICS (252 BE)
") MANAGEMENT PRINCIPLES AND STATISTICS (252 BE) Normal and Binomial Distribution Applied to Construction Management Sampling and Confidence Intervals Sr Tan Liat Choon Email: tanliatchoon@gmail.com Mobile:
MANAGEMENT PRINCIPLES AND STATISTICS (252 BE) Normal and Binomial Distribution Applied to Construction Management Sampling and Confidence Intervals Sr Tan Liat Choon Email: tanliatchoon@gmail.com Mobile:
Part 10: The Binomial Distribution
 Part 10: The Binomial Distribution The binomial distribution is an important example of a probability distribution for a discrete random variable. It has wide ranging applications. One readily available
Chapter 6: Random Variables. Ch. 6-3: Binomial and Geometric Random Variables
 Chapter : Random Variables Ch. -3: Binomial and Geometric Random Variables X 0 2 3 4 5 7 8 9 0 0 P(X) 3???????? 4 4 When the same chance process is repeated several times, we are often interested in whether
Chapter 5 Student Lecture Notes 5-1. Department of Quantitative Methods & Information Systems. Business Statistics
 Chapter 5 Student Lecture Notes 5-1 Department of Quantitative Methods & Information Systems Business Statistics Chapter 5 Discrete Probability Distributions QMIS 120 Dr. Mohammad Zainal Chapter Goals
Math Tech IIII, Apr 25
 Math Tech IIII, Apr 25 The Binomial Distribution I Book Sections: 4.2 Essential Questions: How can I compute the probability of any event? What is the binomial distribution and how can I use it? Standards:
Chapter 8: Binomial and Geometric Distributions
 Chapter 8: Binomial and Geometric Distributions Section 8.1 Binomial Distributions The Practice of Statistics, 4 th edition For AP* STARNES, YATES, MOORE Section 8.1 Binomial Distribution Learning Objectives
6 If and then. (a) 0.6 (b) 0.9 (c) 2 (d) Which of these numbers can be a value of probability distribution of a discrete random variable
 0.6 (b) 0.9 (c) 2 (d) Which of these numbers can be a value of probability distribution of a discrete random variable") 1. A number between 0 and 1 that is use to measure uncertainty is called: (a) Random variable (b) Trial (c) Simple event (d) Probability 2. Probability can be expressed as: (a) Rational (b) Fraction (c)
1. A number between 0 and 1 that is use to measure uncertainty is called: (a) Random variable (b) Trial (c) Simple event (d) Probability 2. Probability can be expressed as: (a) Rational (b) Fraction (c)
8.1 Binomial Distributions
 8.1 Binomial Distributions The Binomial Setting The 4 Conditions of a Binomial Setting: 1.Each observation falls into 1 of 2 categories ( success or fail ) 2 2.There is a fixed # n of observations. 3.All
Statistical Methods in Practice STAT/MATH 3379
 Statistical Methods in Practice STAT/MATH 3379 Dr. A. B. W. Manage Associate Professor of Mathematics & Statistics Department of Mathematics & Statistics Sam Houston State University Overview 6.1 Discrete
CHAPTER 4 DISCRETE PROBABILITY DISTRIBUTIONS
 CHAPTER 4 DISCRETE PROBABILITY DISTRIBUTIONS A random variable is the description of the outcome of an experiment in words. The verbal description of a random variable tells you how to find or calculate
Section 7.5 The Normal Distribution. Section 7.6 Application of the Normal Distribution
 Section 7.6 Application of the Normal Distribution A random variable that may take on infinitely many values is called a continuous random variable. A continuous probability distribution is defined by
Midterm Exam III Review
 Midterm Exam III Review Dr. Joseph Brennan Math 148, BU Dr. Joseph Brennan (Math 148, BU) Midterm Exam III Review 1 / 25 Permutations and Combinations ORDER In order to count the number of possible ways
11.5: Normal Distributions
 11.5: Normal Distributions 11.5.1 Up to now, we ve dealt with discrete random variables, variables that take on only a finite (or countably infinite we didn t do these) number of values. A continuous random
The normal distribution is a theoretical model derived mathematically and not empirically.
 Sociology 541 The Normal Distribution Probability and An Introduction to Inferential Statistics Normal Approximation The normal distribution is a theoretical model derived mathematically and not empirically.
Assignment 2 (Solution) Probability and Statistics
 Probability and Statistics") Assignment 2 (Solution) Probability and Statistics Dr. Jitesh J. Thakkar Department of Industrial and Systems Engineering Indian Institute of Technology Kharagpur Instruction Total No. of Questions: 15.
Assignment 2 (Solution) Probability and Statistics Dr. Jitesh J. Thakkar Department of Industrial and Systems Engineering Indian Institute of Technology Kharagpur Instruction Total No. of Questions: 15.
chapter 13: Binomial Distribution Exercises (binomial)13.6, 13.12, 13.22, 13.43
13.6, 13.12, 13.22, 13.43") chapter 13: Binomial Distribution ch13-links binom-tossing-4-coins binom-coin-example ch13 image Exercises (binomial)13.6, 13.12, 13.22, 13.43 CHAPTER 13: Binomial Distributions The Basic Practice of Statistics
chapter 13: Binomial Distribution ch13-links binom-tossing-4-coins binom-coin-example ch13 image Exercises (binomial)13.6, 13.12, 13.22, 13.43 CHAPTER 13: Binomial Distributions The Basic Practice of Statistics
The Binomial Distribution
 AQR Reading: Binomial Probability Reading #1: The Binomial Distribution A. It would be very tedious if, every time we had a slightly different problem, we had to determine the probability distributions
Homework: Due Wed, Nov 3 rd Chapter 8, # 48a, 55c and 56 (count as 1), 67a
, 67a") Homework: Due Wed, Nov 3 rd Chapter 8, # 48a, 55c and 56 (count as 1), 67a Announcements: There are some office hour changes for Nov 5, 8, 9 on website Week 5 quiz begins after class today and ends at
Homework: Due Wed, Nov 3 rd Chapter 8, # 48a, 55c and 56 (count as 1), 67a Announcements: There are some office hour changes for Nov 5, 8, 9 on website Week 5 quiz begins after class today and ends at
Chapter 15 - The Binomial Formula PART
 Chapter 15 - The Binomial Formula PART IV : PROBABILITY Dr. Joseph Brennan Math 148, BU Dr. Joseph Brennan (Math 148, BU) Chapter 15 - The Binomial Formula 1 / 19 Pascal s Triangle In this chapter we explore
Random Variables CHAPTER 6.3 BINOMIAL AND GEOMETRIC RANDOM VARIABLES
 Random Variables CHAPTER 6.3 BINOMIAL AND GEOMETRIC RANDOM VARIABLES Essential Question How can I determine whether the conditions for using binomial random variables are met? Binomial Settings When the
Chapter Six Probability
 Chapter Six Probability Copyright 2005 Brooks/Cole, a division of Thomson Learning, Inc. 6.1 Random Experiment a random experiment is an action or process that leads to one of several possible outcomes.
CHAPTER 6 Random Variables
 CHAPTER 6 Random Variables 6.3 Binomial and Geometric Random Variables The Practice of Statistics, 5th Edition Starnes, Tabor, Yates, Moore Bedford Freeman Worth Publishers Binomial and Geometric Random
+ Chapter 7. Random Variables. Chapter 7: Random Variables 2/26/2015. Transforming and Combining Random Variables
 + Chapter 7: Random Variables Section 7.1 Discrete and Continuous Random Variables The Practice of Statistics, 4 th edition For AP* STARNES, YATES, MOORE + Chapter 7 Random Variables 7.1 7.2 7.2 Discrete
The binomial distribution
 The binomial distribution The coin toss - three coins The coin toss - four coins The binomial probability distribution Rolling dice Using the TI nspire Graph of binomial distribution Mean & standard deviation
12 Math Chapter Review April 16 th, Multiple Choice Identify the choice that best completes the statement or answers the question.
 Multiple Choice Identify the choice that best completes the statement or answers the question. 1. Which situation does not describe a discrete random variable? A The number of cell phones per household.
Shifting our focus. We were studying statistics (data, displays, sampling...) The next few lectures focus on probability (randomness) Why?
 The next few lectures focus on probability (randomness) Why?") Probability Introduction Shifting our focus We were studying statistics (data, displays, sampling...) The next few lectures focus on probability (randomness) Why? What is Probability? Probability is used
Probability Introduction Shifting our focus We were studying statistics (data, displays, sampling...) The next few lectures focus on probability (randomness) Why? What is Probability? Probability is used
The Binomial Probability Distribution
 The Binomial Probability Distribution MATH 130, Elements of Statistics I J. Robert Buchanan Department of Mathematics Fall 2017 Objectives After this lesson we will be able to: determine whether a probability
binomial day 1.notebook December 10, 2013 Probability Quick Review of Probability Distributions!
 Probability Binomial Distributions Day 1 Quick Review of Probability Distributions! # boys born in 4 births, x 0 1 2 3 4 Probability, P(x) 0.0625 0.25 0.375 0.25 0.0625 TWO REQUIREMENTS FOR A PROBABILITY
Model Paper Statistics Objective. Paper Code Time Allowed: 20 minutes
 Model Paper Statistics Objective Intermediate Part I (11 th Class) Examination Session 2012-2013 and onward Total marks: 17 Paper Code Time Allowed: 20 minutes Note:- You have four choices for each objective
SHORT ANSWER. Write the word or phrase that best completes each statement or answers the question.
 Math 131-03 Practice Questions for Exam# 2 SHORT ANSWER. Write the word or phrase that best completes each statement or answers the question. 1) What is the effective rate that corresponds to a nominal
Chapter 11. Data Descriptions and Probability Distributions. Section 4 Bernoulli Trials and Binomial Distribution
 Chapter 11 Data Descriptions and Probability Distributions Section 4 Bernoulli Trials and Binomial Distribution 1 Learning Objectives for Section 11.4 Bernoulli Trials and Binomial Distributions The student
Name Period AP Statistics Unit 5 Review
 Name Period AP Statistics Unit 5 Review Multiple Choice 1. Jay Olshansky from the University of Chicago was quoted in Chance News as arguing that for the average life expectancy to reach 100, 18% of people
Lecture Slides. Elementary Statistics Tenth Edition. by Mario F. Triola. and the Triola Statistics Series
 Lecture Slides Elementary Statistics Tenth Edition and the Triola Statistics Series by Mario F. Triola Slide 1 Chapter 5 Probability Distributions 5-1 Overview 5-2 Random Variables 5-3 Binomial Probability
184 Chapter Not binomial: Because the student receives instruction after incorrect answers, her probability of success is likely to increase.
 Chapter Chapter. Not binomial: There is not fixed number of trials n (i.e., there is no definite upper limit on the number of defects) and the different types of defects have different probabilities..