INSTITUTIONAL PRESENTATION 2Q15
|
|
|
- Ernest Small
- 6 years ago
- Views:
Transcription
1 INSTITUTIONAL PRESENTATION 2Q15 AUGUST, 2015 KLBN11 KLBN11 / KLBAY
2 DISCLAIMER The statements contained in this presentation related to the business outlook, operating and financial projections, and growth prospects of Klabin S.A. are merely projections, and as such are based exclusively on the expectations of the Company s management concerning the future of the business. These forward-looking statements depend substantially on the market conditions, the performance of the Brazilian economy, the industry and international markets, and therefore are subject to change without prior notice. This presentation on Klabin s performance includes non-accounting and accounting data, such as operating and financial information, as well as projections based on Management s expectations. Note that the non-accounting data has not been reviewed by the Company s independent auditors. The Company s management believes EBITDA may provide useful information on the Company s operating performance and allow for comparisons with other companies in the same industry. Note however that EBITDA is not a measure established in accordance with generally accepted accounting principles of the International Financial Reporting Standards IFRS, and may be defined and calculated differently by other companies. 2
3 CONSISTENT PERFORMANCE

 and SACK KRAFT 330 thousand tonnes")

4 INTEGRATED BUSINESSES COMPETITIVENESS TROUGH ALL THE CHAIN FOREST PULP PAPER and CONVERSION 243 thousand ha 1.7 million tonnes COATED BOARDS 750 thousand tonnes 220 thousand tonnes INDUSTRIAL BAGS (160 k tonnes) and SACK KRAFT 330 thousand tonnes CORRUGATED BOXES (650 k tonnes) and KRAFTLINER 1,050 thousand tonnes EUCALYPTUS AND PINE FORESTS OLD CORRUGATED CONTAINERS HIGH YIELD FOREST INDUSTRIAL EFFICIENCY HIGH QUALITY and FLEXIBILITY 4

5 50% COATED BOARDS INDUSTRIAL BAGS LOW COST QUALITY sole supplier of liquid packaging board in Latin America market share LEADER IN BRAZIL IN ALL MARKETS installed capacity KRAFTLINER CORRUGATED BOXES DIVERSIFIED PRODUCT LINE 40% MARKET POSITION STRONGLY LINKED TO RESILIENT MARKETS 7% building 12% others food 13% other consumer goods 68% 50% source: ABPO, IBÁ market share market share 16% SALES VOLUME DESTINATION PAPER AND PACKAGING 5
6 BUSINESS EVOLUTION TIMELINE on PERFORMANCE IMPROVEMENT PAPER EXPANSIONS - COMPLETED PUMA PULP MILL NEW GROWTH OPPORTUNITIES 1,7 MILLION TONNES 2,0 MILLION TONNES 3,5 MILLION TONNES INCREASED RESULTS AND SET THE PATH FOR FUTURE GROWTH 6
7 35% 30% 25% EBITDA GROWTH CONSISTENT RESULTS DESPITE CHALLENGING SCENARIOS 31% % CHANGE VS PREVIOUS YEAR 20% 15% 10% 5% 7% 16% 10% 0% -5% EBITDA KLABIN BRL/US$ Brazil GDP World GDP -10% *LTM = Last twelve months
8 adjusted EBITDA LTM - R$ million ,027 1,089 1,180 1,286 1,351 1,424 1,452 1,504 1,562 1,602 1,627 1,652 1,718 1, EBITDA GROWTH SUSTAINABLE PERFORMANCE PERFORMANCE IMPROVEMENT EXPANSION OF CAPACITY 8
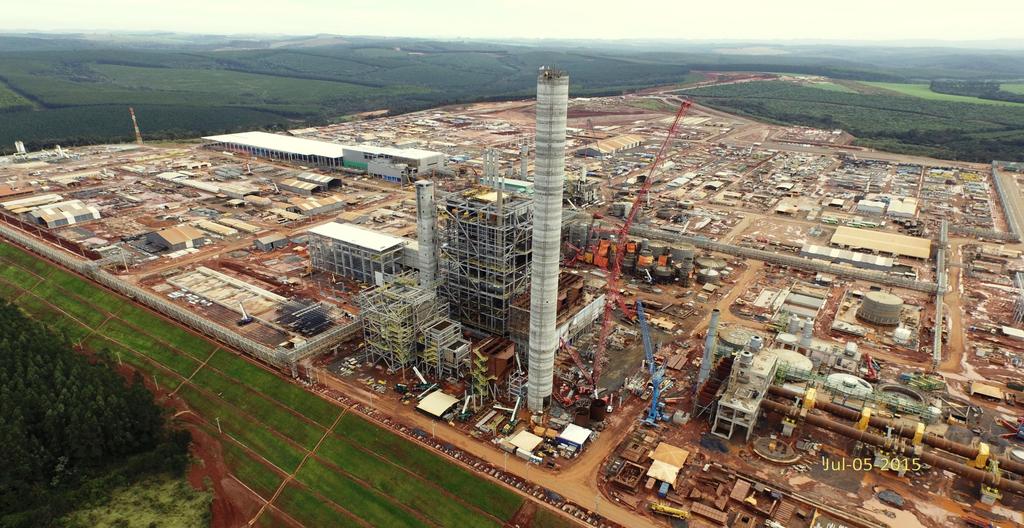
9 PUMA PROJECT
10 10

11 LOW OPERATION COST ANNUAL PRODUCTION CAPACITY 1.5 MILLION TONNES OF PULP 1.1 MILLION TONNES OF SHORT FIBER 400 THOUSAND TONNES OF LONG FIBER PART CONVERTED TO FLUFF PRODUCTION OF 270 MWh of ENERGY SELF SUFFICIENT 120 MWh FOR PUMA USE 150 MWh FOR SALE IN THE MARKET 11

12 CURRENT STATUS COMPLETION areas delivered to EPC s 100% of earthmoving concluded Assembly started EPC s with Klabin coordination dedicated team: strong feedback and control 95% of equipment supplies, materials and services concluded COST lower dependency on imported equipments EUR 365 million 75% 0% OF THE PROJECT COMPLETED 100% 54% 0% OF THE CAPEX DISBURSED 100% 12
13 46% INDUSTRIAL CAPEX 14% TOTAL CAPEX R$ 7.2 BI national equipments and materials 14% imported equipments 27% INDUSTRIAL CAPEX R$ 5.8 BI NET OF RECOVERABLE TAXES engineering and other services civil construction and assembly PROJECT FULLY FUNDED 13


14 LOGISTICS MULTIMODAL 72 Km forestry average distance 441 Km railway to the port FORESTS PULP MILL PARANAGUÁ PORT INBOUND OUTBOUND 14
15 EARNINGS 2Q15
16 SALES VOLUME excluding wood tsd tonnes NET REVENUE R$ million HIGHLIGHTS ADJUSTED EBITDA R$ million % % 1,151 22% 1,338 28% % 68% 78% 72% 2Q14 2Q15 2Q14 2Q15 2Q14 2Q15 exports domestic market 16
 KRAFTLINER 149 thousand tonnes 42% 58% 156 thousand tonnes 377 41% R$")

17 COATED BOARDS PAPER BUSINESS UNIT KRAFTLINER (3) KRAFTLINER AND COATED BOARDS (1) RECYCLED (2) KRAFTLINER 149 thousand tonnes 42% 58% 156 thousand tonnes % R$ million 59% 457 R$ million 86 thousand tonnes 59% 98 thousand tonnes % R$ million 189 R$ million 41% 33% 2Q14 2Q15 2Q14 2Q15 2Q14 2Q15 2Q14 2Q15 exports domestic market 17
 534 R$ million 551 R$ million 178 thousand tonnes 172 thousand tonnes 2Q14 2Q15 + 2Q14 2Q15")
18 CONVERSION MARKET POSITION CORRUGATED BOXES (7) CORRUGATED BOXES AND INDUSTRIAL BAGS (1) INDUSTRIAL BAGS (3) 534 R$ million 551 R$ million 178 thousand tonnes 172 thousand tonnes 2Q14 2Q15 + 2Q14 2Q15 18
19 CASH COST UNIT CASH COST CASH COST BREAKDOWN 2Q15 2,017 R$/tonne 2,193 R$/tonne Electricity 7% Maintenance materials / stoppage 14% Others 6% Labor / third parties 32% Fuel Oil 3% 2Q14 2Q15* Freight 11% Chemicals 13% Wood / Fibers 14% *Excluding non-recurring itens from other operating revenues and expenses 19
20 Mar-12 Jun-12 Sep-12 Dec-12 Mar-13 Jun-13 Sep-13 Dec-13 Mar-14 Jun-14 Sep-14 Dec-14 Mar-15 Jun-15 2,674 3,014 3,090 3,278 3,136 2,711 2,824 3,437 3,595 3,985 4,028 5,242 7,440 8,144 10,000 8,000 6,000 4,000 2, Gross Debt Cash Net Debt in 06/30/15 R$ 13.3 billion R$ 5.2 billion R$ 8.1 billion NET DEBT Net Debt (R$ million) Net Debt / EBITDA (LTM) 20
21 CAPEX CAPEX R$ million E 2016E maintenance 3T T T T T T special projects and growth vale do corisco PUMA project ,242 3,437 1,844 total ,945 4,172 2,322 21

22 Investor Relations Phone: +55 (11)
23 APPENDIX PUMA MARKET COMMERCIAL CONTRACT

24 PUMA PULP MARKET
25 PULP MARKET million tonnes 164 mm t 52.6 million tonnes VIRGIN FIBER PULP PULP MARKET DISTRIBUTION long fiber 45% 33% eucalyptus 22% integrated pulp market pulp other short fibers Source: Hawkins Wright; RISI 25
26 LARGEST MARKET PULP MILLS OF THE WORLD million tonnes per year in 2014 Fibria Aracruz 2,340 PUMA: 6 th LARGEST PULP MILL April Riau 2,200 April Rizhao 1,700 WORLD DEMAND million tonnes per year in 2014 CMPC Guaíba 1,690 Suzano Mucuri 1,565 Klabin 1,500 short fiber market pulp Suzano Maranhão 1,500 Eldorado 1,500 Montes del Plata 1,300 eucalyptus Source: Hawkins Wright 26
27 4 th LARGEST IN FLUFF WORLD CAPACITY OF FLUFF thousand tonnes per year in 2014 GP Weyco IP Puma Klabin Domtar Resolute Stora Arauco Rock Tenn Rayonier UPM Source: Hawkins Wright 1,045 1,420 the only designed to produce fluff from the start 2,296 mills converted in fluff mills WORLD DEMAND million tonnes per year in ,7 fibra longa SBSK = pinus long fiber from USA 6,4 fluff and SBSK 27


28 FOCUS ON CONSUMER MARKETS MARKET PENETRATION IN DISPOSABLE DIAPERS 2013 SOPHISTICATION AND INNOVATION IN HIGHER VALUE ADDED PRODUCTS USA 96% high potential of growth BRA 50% ARG 72% Source: RISI, Euromonitor 28
29 BRAZIL IS THE 3 RD LARGEST MARKET OF DISPOSABLE DIAPERS IN THE WORLD SALES OF DIAPERS FOR ADULTS R$ billion SALES OF DIAPERS FOR INFANT R$ billion Source: Euromonitor 29


30 COMPOSITION OF DIAPERS 30% TO 50% OF THE AVERAGE WEIGHT OF A DIAPER IS COMPOSED OF FLUFF (20 TO 40G) 30
31 SPREADS AMONG DIFFERENT FIBERS CIF EUROPE US$/TONNE 235 fluff x short fiber 15 long fiber x short fiber jul 13 aug 13 sep 13 oct 13 nov 13 dec 13 jan 14 feb 14 mar 14 apr 14 may 14 jun 14 jul 14 aug 14 sep 14 oct 14 nov 14 dez 14 jan 15 feb 15 mar 15 apr 15 may 15 Source: RISI, FOEX 31
32 GLOBAL CASH COST (SHORT FIBER) CIF EUROPE US$/TONNE 400 PUMA 5 million tonnes 10 million tonnes 15 million tonnes 20 million tonnes 25 million tonnes ANNUAL CAPACITY Source: Hawkins Wright CIF: COST, INSURANCE AND FREIGHT INCLUDED 32
33 KLABIN & FIBRIA COMMERCIAL CONTRACT HARDWOOD PULP
34 Contract Rationale Puma Project 1. 5 mt/year 1.1 mt of hardwood 400 kt of softwood, part converted to fluff Sale minimum 900 kt of hardwood / year 200 kt of hardwood / year kt of softwood / year EXPORTS EXCEPT SOUTH AMERICA SOUTH AMERICA ALL MARKETS
35 Sales dynamics kt hardwood forestry pulp plant Paranaguá Port (PR) final customer Same price as Fibria FOB Paranaguá KLABIN industrial efficiency FIBRIA commercial expertise
36 Timeline 900 kt of hardwood pro rata of the period Minimum of 900 kt of hardwood Phase out 1 75% of the delivered in 2019 Phase out 2 50% of the delivered in 2019 Pro rata 50% of the delivered in 2019 End of the contract From start-up date until December 12 months 12 months 12 months 12 months 12 months 72 months after start-up The contract may be renewed by agreement between the parties Volumes may be reduced if Klabin decides to integrate into paper for packaging


37 Agreement benefits Logistics and commercial structure synergies; Ensure sales volumes; Ensure pulp market access with Klabin brand. Logistics and commercial optimization and synergies; Support customers growth and enhance customers needs; Potential development of new customers. Mutual value creation, with better servicing for both Companies customer s base.
38 Highlights 1 Klabin is going to sell most of the Puma Project hardwood pulp to Fibria. 2 Klabin is going to sell the remaining hardwood pulp in South America, and softwood and fluff pulp globally. 3 Fibria will continue to place its hardwood pulp in all regions, including South America, on a competitive basis. 4 Innovative agreement exploring core competences: Fibria s commercial expertise and the recognized Klabin s industrial efficiency.
39 INCOME STATEMENT 2Q15/1Q15 2Q15/2Q14 6M14 6M15/6M14 (R$ thousands) 2Q15 1Q15 2Q14 6M15 Gross Revenue 1,593,961 1,555,081 1,399,323 3% 14% 3,149,042 2,841,133 11% Net Revenue 1,337,936 1,308,449 1,151,093 2% 16% 2,646,385 2,354,564 12% Change in fair value - biological assets 155,230 55, , % 20% 210, ,676-68% Cost of Products Sold (1,058,415) (930,067) (941,718) 14% 12% (1,988,482) (1,744,570) 14% Gross Profit 434, , ,979 0% 28% 868,671 1,261,670-31% Selling Expenses (105,594) (94,461) (87,474) 12% 21% (200,055) (185,655) 8% General & Administrative Expenses (82,927) (74,964) (72,882) 11% 14% (157,891) (145,812) 8% Other Revenues (Expenses) (9,912) (6,033) 17,459 64% N/A (15,945) 26,416 N/A Total Operating Expenses (198,433) (175,458) (142,897) 13% 39% (373,891) (305,051) 23% Operating Income (before Fin. Results) 236, , ,082-9% 21% 494, ,619-48% Equity pickup 5,804 7,535 5,807-23% 0% 13,339 11,349 18% Financial Expenses (163,412) (215,714) (97,103) -24% 68% (379,126) (203,105) 87% Financial Revenues 125, , ,008 6% -5% 244, ,244-4% Net Foreign Exchange Losses 239,104 (1,287,743) 101, % 135% (1,048,639) 252,147 N/A Net Financial Revenues 201,462 (1,384,611) 137,519 N/A 46% (1,183,149) 303,286 N/A Net Income before Taxes 443,584 (1,118,614) 339,408 N/A 31% (675,030) 1,271,254 N/A Income Tax and Soc. Contrib. (147,988) 390,048 (95,890) N/A 54% 242,060 (420,562) N/A Net income 295,596 (728,566) 243,518 N/A 21% (432,970) 850,692 N/A Depreciation and amortization 293, , ,832 17% 14% 544, ,383 25% Cost of carrying out assigned to property - land 7, N/A N/A 7,453 - N/A Change in fair value of biological assets (155,230) (55,538) (129,604) 180% 20% (210,768) (651,676) -68% Vale do Corisco 8,719 8,167 9,550 7% -9% 16,886 18,938-11% Adjusted EBITDA 391, , ,860-15% 17% 852, ,264 12% numbers in thousand R$ 39
40 BALANCE SHEET Assets jun-15 mar-15 Liabilities and Stockholders' Equity jun-15 mar-15 Current Assets 7,802,555 7,992,082 Current Liabilities 3,209,847 3,030,685 Cash and banks 39,881 41,968 Loans and financing 1,697,824 1,620,937 Short-term investments 4,678,747 5,027,182 Debentures 502, ,709 Securities 521, ,934 Suppliers 663, ,378 Receivables 1,240,197 1,273,769 Income tax and social contribution 0 0 Inventories 607, ,794 Taxes payable 36,253 38,330 Recoverble taxes and contributions 579, ,433 Salaries and payroll charges 165, ,670 Other receivables 136, ,002 Dividends to pay 0 101,981 REFIS Adherence 50,400 50,400 Noncurrent Assets 15,342,872 14,282,475 Other accounts payable 94, ,280 Long term Taxes to compensate 913, ,504 Noncurrent Liabilities 13,424,620 13,010,927 Judicial Deposits 84,426 84,879 Loans and financing 9,796,361 9,850,126 Other receivables 201, ,304 Debentures 1,387,647 1,165,761 Other investments 504, ,283 Deferred income tax and social contribution 1,428,556 1,282,760 Property, plant & equipment, net 10,096,021 9,194,472 Other accounts payable - Investors SCPs 136, ,760 Biological assets 3,531,080 3,568,934 REFIS Adherence 377, ,847 Intangible assets 11,413 12,099 Other accounts payable 298, ,673 Stockholders Equity 6,510,960 6,232,945 Capital 2,376,000 2,376,000 Capital reserve 1,301,030 1,301,030 Revaluation reserve 48,730 48,746 Profit reserve 1,879,743 1,599,276 Valuation adjustments to shareholders'equity 1,069,759 1,072,603 Treasury stock (164,302) (164,710) Total 23,145,427 22,274,557 Total 23,145,427 22,274,557 numbers in thousand R$ 40
41 LOAN MATURITY SCHEDULE 1,880 1,920 R$ million 1,813 1, ,744 1,173 1,565 1,467 1, , , Q15 4Q Foreign Currency 8,139 Local Currency 5,245 Gross Debt 13,384 Local currency : R$ 5.2 billion Average tenor: 40 months Foreign currency: R$ 8.1 billion Average tenor : 54 months numbers in R$ million 41
INSTITUTIONAL PRESENTATION NOVEMBER, 2015 KLBN11 KLBN11 / KLBAY
 INSTITUTIONAL PRESENTATION NOVEMBER, 2015 KLBN11 KLBN11 / KLBAY DISCLAIMER The statements contained in this presentation related to the business outlook, operating and financial projections, and growth
INSTITUTIONAL PRESENTATION
 INSTITUTIONAL PRESENTATION MARCH 2015 KLBN11 KLBN11 / 1 KLBAY DISCLAIMER The statements contained in this presentation related to the business outlook, operating and financial projections, and growth prospects
140k. 90k DIVERSIFICATION AND FLEXIBILITY. TOTAL FIBERS 3.5 million tpy. TOTAL LAND 490k hectares. TOTAL CAPACITY 3.5 million tpy. 1.
 PRESENTATION 2Q18 1 DIVERSIFICATION AND FLEXIBILITY TOTAL LAND 490k hectares TOTAL FIBERS 3.5 million tpy BLEACHED PULP 1.5 mi tpy TOTAL CAPACITY 3.5 million tpy MARKET PULP 1.5 mi tpy Long fiber / Fluff
Institutional Presentation. May 2012
 Institutional Presentation May 2012 1 Forward looking statement The statements contained in this presentation related to the business outlook, operating and financial projections, and growth prospects
Institutional Presentation November, 2012
 Institutional Presentation November, 2012 1 2 Disclaimer The statements contained in this presentation related to the business outlook, operating and financial projections, and growth prospects of Klabin
Institutional Presentation. February, 2013
 Institutional Presentation February, 2013 1 Disclaimer The statements contained in this presentation related to the business outlook, operating and financial projections, and growth prospects of Klabin
1Q18 Earnings Release APRIL 26, 2018
 1Q18 Earnings Release APRIL 26, 2018 ADJUSTED EBITDA REACHES R$ 760 MILLION IN 1Q18, 41% GROWTH IN RELATION TO 1Q18. ADJUSTED EBITDA NET REVENUE KRAFTLINER SALES REVENUE PULP SALES VOLUME REDUCTION OF
EARNINGS RELEASE 3Q17
 EARNINGS RELEASE 3Q17 OCTOBER 26, 2017 ADJUSTED EBITDA REACHES R$ 750 MILLION IN 3Q17, 28% GROWTH IN RELATION TO THE SAME PERIOD IN 2016. ADJUSTED EBITDA R$ 750 mi PULP SALES VOLUME 353 mil t CONVERSION
2Q18 Earnings Release JULY 30 th, 2018
 2Q18 Earnings Release JULY 30 th, 2018 ADJUSTED EBITDA REACHES R$ 884 MILLION IN 2Q18 YEAR ON YEAR GROWTH OF 49% ADJUSTED EBITDA SALES REVENUES KRAFTLINER SALES REVENUE PULP PRODUCTION IN JUNE EBITDA MARGIN
Earnings Release 2Q17
 Earnings Release 2Q17 JULY 27, 2017 ADJUSTED EBITDA REACHES R$ 595 MILLION IN 2Q17, 11% GROWTH IN RELATION TO THE SAME PERIOD IN 2016. ADJUSTED EBITDA R$ 595 mm PULP SALES VOLUME 337k tonnes NET REVENUE
Quarterly Report 3Q18 OCTOBER
 Quarterly Report 3Q18 OCTOBER 29 2018 ADJUSTED EBITDA FOR THE QUARTER REACHES R$ 1.248 BILLION IN 3Q18, YEAR-ON-YEAR GROWTH OF 66%. ADJUSTED EBITDA SALES REVENUES LEVERAGE REDUCTION PULP PRODUCTION EBITDA
Earnings Release 1Q15
 Earnings Release 1Q15 APRIL 27, 2015 Adjusted EBITDA of R$461 million in 1Q15, 9% growth on 1Q14 NET REVENUE R$1,308 million Net revenue of R$1,308 million, 9% up on 1Q14. Domestic market net revenue came
EARNINGS RELEASE 4Q16 FEBRUARY 01, 2017
 EARNINGS RELEASE 4Q16 FEBRUARY 01, 2017 4Q16 ADJUSTED EBITDA REACHES R$ 653 MILLION AND R$2.3 BILLION IN 2016, 16% YOY GROWTH ADJUSTED EBITDA PULP PRODUCTION VOLUME PULP AND PAPER SALES VOLUME SALES REVENUE
Fixed Income Presentation 3Q17
 Fixed Income Presentation 3Q17 1 Agenda 1. Company Overview 2. Investment Highlights 3. Operating and Financial Highlights 2 Section 1 Company Overview 3 Company Overview Company Overview Competitive Advantages
Fixed Income Presentation 1Q18
 Fixed Income Presentation 1Q18 1 Agenda 1. Company Overview 2. Investment Highlights 3. Operating and Financial Highlights 2 Section 1 Company Overview 3 Company Overview Company Overview Competitive Advantages
Institutional Presentation
 Institutional Presentation 3Q09 October, 2009 years old Shareholder Structure 09/30/2009 Family control + Professional management Monteiro Aranha ; 20% Brazilian Investors ; 21% Common Klabin Irmãos; 59%
Fixed Income Presentation 4Q17
 Fixed Income Presentation 4Q17 1 Agenda 1. Company Overview 2. Investment Highlights 3. Operating and Financial Highlights 2 Section 1 Company Overview 3 Company Overview Company Overview Competitive Advantages
May Corporate Presentation
 May 2014 Corporate Presentation Disclaimer The information contained in this presentation may include statements which constitute forward-looking statements, within the meaning of Section 27A of the U.S.
Klabin S.A. Quarterly Information (ITR) at March 31, 2013 and report on review of quarterly information
 at March 31, 2013 and report on review of quarterly information") Klabin S.A. Quarterly Information (ITR) at March 31, 2013 and report on review of quarterly information Report on review of quarterly information To the Board of Directors and Stockholders Klabin S.A.
Klabin S.A. Quarterly Information (ITR) at March 31, 2013 and report on review of quarterly information Report on review of quarterly information To the Board of Directors and Stockholders Klabin S.A.
3rd Quarter of October/08
 3rd Quarter of 2008 October/08 1 Forward Looking Statement The statements contained in this presentation related to the business outlook, operating and financial projections, and growth prospects of Klabin
Corporate Presentation June, 2011
 Corporate Presentation June, 2011 1 1 1 Disclaimer The information contained in this presentation may include statements which constitute forward-looking statements, within the meaning of Section 27A of
Klabin S.A. Quarterly Information (ITR) at September 30, 2014 and report on review of quarterly information
 at September 30, 2014 and report on review of quarterly information") Klabin S.A. Quarterly Information (ITR) and report on review of quarterly information Report on review of quarterly information To the Board of Directors and Stockholders Klabin S.A. Introduction We have
Klabin S.A. Quarterly Information (ITR) and report on review of quarterly information Report on review of quarterly information To the Board of Directors and Stockholders Klabin S.A. Introduction We have
December Corporate Presentation
 December 2014 Corporate Presentation Disclaimer The information contained in this presentation may include statements which constitute forward-looking statements, within the meaning of Section 27A of the
Klabin S.A. Quarterly Information (ITR) at March 31, 2015 and report on review of quarterly information
 at March 31, 2015 and report on review of quarterly information") Klabin S.A. Quarterly Information (ITR) at March 31, 2015 and report on review of quarterly information Report on review of quarterly information To the Board of Directors and Stockholders Klabin S.A.
Klabin S.A. Quarterly Information (ITR) at March 31, 2015 and report on review of quarterly information Report on review of quarterly information To the Board of Directors and Stockholders Klabin S.A.
Klabin S.A. Quarterly Information (ITR) at March 31, 2017 and report on review of quarterly information
 at March 31, 2017 and report on review of quarterly information") Klabin S.A. Quarterly Information (ITR) at March 31, 2017 and report on review of quarterly information Independent auditor s report on interim financial information The Shareholders, Board of Directors
Klabin S.A. Quarterly Information (ITR) at March 31, 2017 and report on review of quarterly information Independent auditor s report on interim financial information The Shareholders, Board of Directors
4Q17 EARNINGS RELEASE
 4Q17 EARNINGS RELEASE FEBRUARY 1 2018 ADJUSTED EBITDA REACHES R$ 855 MILLION IN 4Q17, 31% GROWTH VERSUS 4Q16 ADJUSTED EBITDA PULP PRODUCTION VOLUME PACKAGING SALES VOLUME SALES REVENUE NET DEBT/ EBITDA
Klabin S.A. Quarterly Information (ITR) at September 30, 2015 and report on review of quarterly information
 at September 30, 2015 and report on review of quarterly information") Klabin S.A. Quarterly Information (ITR) and report on review of quarterly information KLABIN915RL.DOCX Report on review of quarterly information To the Board of Directors and Stockholders Introduction
Klabin S.A. Quarterly Information (ITR) and report on review of quarterly information KLABIN915RL.DOCX Report on review of quarterly information To the Board of Directors and Stockholders Introduction
Klabin S.A. Quarterly Information (ITR) at June 30, 2014 and Report on Review of Quarterly Information
 at June 30, 2014 and Report on Review of Quarterly Information") Klabin S.A. Quarterly Information (ITR) at June 30, 2014 and Report on Review of Quarterly Information Report on Review of Quarterly Information To the Board of Directors and Shareholders Klabin S.A. Introduction
Klabin S.A. Quarterly Information (ITR) at June 30, 2014 and Report on Review of Quarterly Information Report on Review of Quarterly Information To the Board of Directors and Shareholders Klabin S.A. Introduction
Why to invest in Suzano?
 Why to invest in Suzano? November 2017 Why to invest in Suzano? Strategy to Maximize the Return on Invested Capital Competitive Advantages and Leading Position in the Industry Strong Operating Cash Flow
September Morgan Stanley - Global Natural Resources Conference
 September 2013 Morgan Stanley - Global Natural Resources Conference Disclaimer The information contained in this presentation may include statements which constitute forward-looking statements, within
Institutional Presentation 2Q10. August, 2010
 Institutional Presentation 2Q10 August, 2010 1 Forward Looking Statement The statements contained in this presentation related to the business outlook, operating and financial projections, and growth prospects
Corporate Presentation. June 2018
 Corporate Presentation June 2018 Forward-looking Statements This presentation may contain forward-looking statements, that should be considered as good faith estimates. Such statements are subject to risks
Citi 5 th Annual Brazil Equity Conference
 Citi 5 th Annual Brazil Equity Conference June 2012 1 Disclaimer The information contained in this presentation may include statements which constitute forwardlooking statements, within the meaning of
PWC 20 th Annual Forest and Paper Industry Conference
 PWC 20 th Annual Forest and Paper Industry Conference José Luciano Penido, CEO May, 2007 1 Shareholder Structure % of Total Capital Stock (1) Pro forma Votorantim Group 52% of total 100% of ON Free Float
Corporate Presentation. November 2018
 Corporate Presentation November 2018 Forward-Looking Statements This presentation may contain forward-looking statements that should be considered as good faith estimates. Such statements are subject to
Corporate Presentation. March 2018
 Corporate Presentation March 2018 Forward-looking Statements This presentation may contain forward-looking statements, that should be considered as good faith estimates. Such statements are subject to
Deutsche Bank GEMs Conference
 Deutsche Bank GEMs Conference September 5 6 th, 2012 1 Disclaimer The information contained in this presentation may include statements which constitute forwardlooking statements, within the meaning of
Corporate Presentation. January 2018
 Corporate Presentation January 2018 Forward-looking Statements This presentation may contain forward-looking statements, that should be considered as good faith estimates. Such statements are subject to
Corporate Presentation. September 2018
 Corporate Presentation September 2018 Forward-Looking Statements This presentation may contain forward-looking statements, that should be considered as good faith estimates. Such statements are subject
Corporate Presentation. October 2018
 Corporate Presentation October 2018 Forward-Looking Statements This presentation may contain forward-looking statements that should be considered as good faith estimates. Such statements are subject to
FY 2017 Results. February 21 st 2018
 FY 2017 Results February 21 st 2018 Disclaimer The information contained in this presentation has been prepared by Ence Energía y Celulosa, S.A. (hereinafter, "Ence"). This presentation includes data relating
2 nd. nd Quarter August 08
 2 nd nd Quarter 2008 August 08 1 Forward Looking Statement The statements contained in this presentation related to the business outlook, operating and financial projections, and growth prospects of Klabin
March BofAML 2014 Brazil Conference
 March 2014 BofAML 2014 Brazil Conference 2 Disclaimer The information contained in this presentation may include statements which constitute forward-looking statements, within the meaning of Section 27A
Equity offering and sale of forest assets of Bahia Produtos de Madeira (BPM) totaled R$1.6 billion in liquidity events to reduce leverage
 totaled R$1.6 billion in liquidity events to reduce leverage") Equity offering and sale of forest assets of Bahia Produtos de Madeira (BPM) totaled R$1.6 billion in liquidity events to reduce leverage Key Figures Unit 1Q12 4Q11 4Q11 Last 12 months Pulp Production
Equity offering and sale of forest assets of Bahia Produtos de Madeira (BPM) totaled R$1.6 billion in liquidity events to reduce leverage Key Figures Unit 1Q12 4Q11 4Q11 Last 12 months Pulp Production
Increasing operational performance with capital discipline OPERATING CASH GENERATION¹ LTM² (R$ billion)
") 2Q16 Results Disclaimer The statements in this presentation constitute projections or forward-looking statements. Such statements are subject to known and unknown risks and uncertainties that could cause
2Q16 Results Disclaimer The statements in this presentation constitute projections or forward-looking statements. Such statements are subject to known and unknown risks and uncertainties that could cause
Morgan Stanley Global Emerging Markets Conference May 2014
 Morgan Stanley Global Emerging Markets Conference May 2014 2 Disclaimer The information contained in this presentation may include statements which constitute forward-looking statements, within the meaning
Corporate Presentation. April 2017
 Corporate Presentation April 2017 Forward-looking Statements This presentation may contain forward-looking statements, that should be considered as good faith estimates. Such statements are subject to
Santander 11 th Annual Conference. August 22-24, 2010 São Paulo 1
 Santander 11 th Annual Conference August 22-24, 2010 São Paulo 1 Disclaimer The information contained in this presentation may include statements which constitute forward-looking statements, within the
1Q17 C o n f e re n c e C a l l
 1Q17 C o n f e re n c e C a l l Disclaimer The statements in this presentation constitute projections or forward-looking statements. Such statements are subject to known and unknown risks and uncertainties
Ence Energía y Celulosa 9M15 Results. November 12 th, 2015
 Ence Energía y Celulosa 9M15 Results November 12 th, 2015 Ence 3Q15: Main Highlights 1 2 3 4 9M15 Adjusted EBITDA of 141 M, 56 M in the quarter. On track to achieve 200 M Adjusted EBITDA target - Unleveraged
Stora Enso s strategy and market environment. Nordea Forest Products & Paper Seminar, 28 May 2014 CFO Seppo Parvi Stora Enso
 s strategy and market environment Nordea Forest Products & Paper Seminar, 28 May 2014 CFO Seppo Parvi It should be noted that certain statements herein which are not historical facts, including, without
Deutsche Bank's 2015 Global Emerging Markets (GEMs) September, 2015
 September, 2015") Deutsche Bank's 2015 Global Emerging Markets (GEMs) September, 2015 FIBRIA APP WITH THIS PRESENTATION IS AVAILABLE FOR DOWNLOAD AT APPLE STORE AND GOOGLE PLAY. 2 Disclaimer The information contained in
Deutsche Bank's 2015 Global Emerging Markets (GEMs) September, 2015 FIBRIA APP WITH THIS PRESENTATION IS AVAILABLE FOR DOWNLOAD AT APPLE STORE AND GOOGLE PLAY. 2 Disclaimer The information contained in
Corporate Presentation. September, 2011
 Corporate Presentation September, 2011 1 Disclaimer The information contained in this presentation may include statements which constitute forwardlooking statements, within the meaning of Section 27A of
Meeting with investors - Santander August 2014
 Meeting with investors - Santander August 2014 2 Disclaimer The information contained in this presentation may include statements which constitute forward-looking statements, within the meaning of Section
Corporate Presentation. November 2017
 Corporate Presentation November 2017 Forward-looking Statements This presentation may contain forward-looking statements, that should be considered as good faith estimates. Such statements are subject
CELULOSA ARAUCO Y CONSTITUCIÓN S.A. Second Quarter 2018 Results August 21, 2018
 CELULOSA ARAUCO Y CONSTITUCIÓN S.A. Second Quarter 2018 Results August 21, 2018 1 HIGHLIGHTS REVENUES U.S.$ 1,559.3 MILLION Arauco s revenues reached U.S.$ 1,559.3 million during the second quarter of
Suzano Papel e Celulose: Consolidated results for 3Q 2006
 Suzano Papel e Celulose: Consolidated results for 3Q 2006 Record Consolidated Ebitda of US$138 million São Paulo October 18, 2006: Suzano Papel e Celulose (Bovespa: SUZB5), one of Latin America s largest
Third Quarter 2017 Earnings Results
 Third Quarter 2017 Earnings Results Forward-looking Statements This presentation may contain forward-looking statements, that should be considered as good faith estimates. Such statements are subject to
EARNINGS RELEASE 1Q18
 , EARNINGS RELEASE Curitiba, May 8, 2018 RUMO S.A. (B3: RAIL3) ( Rumo ) and COSAN LOGÍSTICA S.A. (B3: RLOG3) ( Cosan Logística ) today announced their results for the first quarter of 2018 (), composed
NDR RJ - Corporate Presentation. November, 2017
 NDR RJ - Corporate Presentation November, 2017 2 Disclaimer The information contained in this presentation may include statements which constitute forward-looking statements, within the meaning of Section
4Q10 Results. 4Q10 Results
 1 Sale of Conpacel and KSR for R$1.5 billion reinforces Fibria s strategy of focusing on the pulp business and reducing its leverage. Key Indicators 1 4Q10 3Q10 4Q09 4Q10 vs. 3Q10 4Q10 vs. 4Q09 2010 2009
Bank of America Merrill Lynch 2018 CalGEMs Conference. June, 2018
 Bank of America Merrill Lynch 2018 CalGEMs Conference June, 2018 3 Disclaimer The information contained in this presentation may include statements which constitute forward-looking statements, within the
UBS Sixth Annual LAT/EMEA Investor Conference. December 2009
 UBS Sixth Annual LAT/EMEA Investor Conference December 2009 1 Disclaimer The information contained in this presentation may include statements which constitute forward-looking statements, within the meaning
Pulp Production 000 t % 32% Pulp Sales 000 t % 22% 6.497
 Leverage reduction to 2.02x in US$ and 2.08x in R$ Adjusted EBITDA of R$1,824 million, with a margin of 55% The learning curve of the new Horizonte 2 production line is 90% reached Key Figures Unit 1Q18
EMPRESAS CMPC PRESENTATION PREPARED FOR THE J.P. MORGAN GLOBAL EMERGING MARKETS CORPORATE CONFERENCE
 EMPRESAS CMPC PRESENTATION PREPARED FOR THE J.P. MORGAN GLOBAL EMERGING MARKETS CORPORATE CONFERENCE LUIS LLANOS - CFO FEBRUARY, 2014 AGENDA I. Company description II. Our Value proposal 1. Leading diversified
Highlights of the FY on track for more growth. Highlights of the 4Q07
 Highlights of the FY 2007 - on track for more growth CFO'S COMMENT P.2 GLOBAL PULP MARKET UPDATE P.4 PRODUCTION AND SALES P.6 INCOME STATEMENT 4Q07 P.7 EBITDA ANALYSIS P.12 CAPITAL EXPENDITURE P.12 VERACEL
Leverage ratio in USD reaches lowest level since 3Q15, at 1.58x
 Leverage ratio in USD reaches lowest level since 3Q15, at 1.58x Record adjusted EBITDA of R$2,499 million with record margin of 58% and record FCF at R$1.7 billion Key Figures Unit 2Q18 6M18 6M17 Last
Resultados trimestrales 1T13. Quarterly Report 2nd Quarter 2014
 Resultados trimestrales 1T13 Quarterly Report 2nd Quarter 2014 30 June 2014 CONTENTS 1. EXECUTIVE SUMMARY 1H14... 3 2. PULP BUSINESS... 5 3. ENERGY ACTIVITY... 7 4. FORESTRY ACTIVITY... 9 5. COMMENT ON
Goldman Sachs Natural Resources Trip. January, 2011
 Goldman Sachs Natural Resources Trip January, 2011 1 1 1 Disclaimer The information contained in this presentation may include statements which constitute forward-looking statements, within the meaning
18 th Annual Santander Brazil Conference - Corporate Presentation. August, 2017
 18 th Annual Santander Brazil Conference - Corporate Presentation August, 2017 2 Disclaimer The information contained in this presentation may include statements which constitute forward-looking statements,
EMPRESAS CMPC COMPANY OVERVIEW
 EMPRESAS CMPC COMPANY OVERVIEW Presentation prepared for the BCI Investor Meeting Luis Llanos CFO April 2013 AGENDA I. Company description II. Our Value proposal 1. Leading diversified Latin American P&P
BofA Merrill Lynch 2015 CalGEMs Global Emerging Markets 1x1 Conference June, 2015
 BofA Merrill Lynch 2015 CalGEMs Global Emerging Markets 1x1 Conference June, 2015 FIBRIA APP WITH THIS PRESENTATION IS AVAILABLE FOR DOWNLOAD AT APPLE STORE AND GOOGLE PLAY. 2 Disclaimer The information
DOMTAR CORPORATION JOHN D. WILLIAMS PRESIDENT & CHIEF EXECUTIVE OFFICER. Citi Basic Materials Conference New York, November 28, 2018
 JOHN D. WILLIAMS PRESIDENT & CHIEF EXECUTIVE OFFICER DOMTAR CORPORATION Citi Basic Materials Conference New York, November 28, 2018 (All financial information in U.S. dollars, unless otherwise noted) SAFE
Ence Energía y Celulosa 1Q15 Results. April 30 th, 2015
 Ence Energía y Celulosa 1Q15 Results April 30 th, 2015 Implementing EBITDA ramp up, focusing on cash cost reduction and delivering our planned targets within the current positive environment 1Q14 Recurrent
4 th Quarter 2014 Financial Results Celulosa Arauco y Constitución S.A.
 Conference Call Presentation 4 th Quarter 2014 Financial Results Celulosa Arauco y Constitución S.A. Gianfranco Truffello, C.F.O. Santiago, March 13 th, 2015 Disclaimer Forward-looking statements are based
Delivering value, delivering commitments. October 2016
 Delivering value, delivering commitments October 2016 Disclaimer The information contained in this presentation has been prepared by Ence Energía y Celulosa, S.A. (hereinafter, "Ence"). This presentation
Celulose Irani S.A. Quarterly Information (ITR) at September 30, 2015 and report on review of quarterly information
 at September 30, 2015 and report on review of quarterly information") Celulose Irani S.A. Quarterly Information (ITR) at September 30, 2015 and report on review of quarterly information IRANI915GHM.DOCX / IRANI915GHM.XLSX Report on review of quarterly information To the
Celulose Irani S.A. Quarterly Information (ITR) at September 30, 2015 and report on review of quarterly information IRANI915GHM.DOCX / IRANI915GHM.XLSX Report on review of quarterly information To the
UPM Q4 RESULTS Jussi Pesonen President and CEO 31 January 2013
 UPM Q4 RESULTS 212 Jussi Pesonen President and CEO 31 January 213 Q4 212 highlights Stable financial performance compared with Q3 212 and Q4 211 Operating cash flow continued strong at EUR 352m in Q4 212
22 nd Santander LatAm Conference Cancun. January, 2018
 22 nd Santander LatAm Conference Cancun January, 2018 3 Disclaimer The information contained in this presentation may include statements which constitute forward-looking statements, within the meaning
BTG Pactual XIX CEO Conference Brasil - SP. February, 2018
 BTG Pactual XIX CEO Conference Brasil - SP February, 2018 3 Disclaimer The information contained in this presentation may include statements which constitute forward-looking statements, within the meaning
J.P. Morgan Brazil Opportunities Conference December, 2014
 J.P. Morgan Brazil Opportunities Conference December, 2014 2 Disclaimer The information contained in this presentation may include statements which constitute forward-looking statements, within the meaning
Applied Value. Pulp & Paper Report. Industry Report. Applied Value
 Applied Value Pulp & Paper Report Industry Report Q2 2018 Applied Value World Trade Center Kungsbron 1 G2, P.O. Box 5047 111 22, Stockholm Sweden Phone: +46 (0)8 562 787 00 www.appliedvaluegroup.com 1
Pulp & Paper Day Santander SP. May 24, 2017
 Pulp & Paper Day Santander SP May 24, 2017 2 Disclaimer The information contained in this presentation may include statements which constitute forward-looking statements, within the meaning of Section
First Quarter 2018 Earnings Results
 First Quarter 2018 Earnings Results Forward-Looking Statements This presentation may contain forward-looking statements that should be considered as good faith estimates. Such statements are subject to
EMPRESAS CMPC PRESENTATION PREPARED FOR THE BTG PACTUAL V LATAM CEO CONFERENCE - NY OCTOBER 2014 SERGIO BREGMAN CFOO AGUSTÍN LETELIER VP FINANCE
 EMPRESAS CMPC PRESENTATION PREPARED FOR THE BTG PACTUAL V LATAM CEO CONFERENCE - NY OCTOBER 2014 SERGIO BREGMAN CFOO AGUSTÍN LETELIER VP FINANCE AGENDA I. Company description II. Our value proposal 1.
XML Publisher Balance Sheet Vision Operations (USA) Feb-02
 Feb-02") Page:1 Apr-01 May-01 Jun-01 Jul-01 ASSETS Current Assets Cash and Short Term Investments 15,862,304 51,998,607 9,198,226 Accounts Receivable - Net of Allowance 2,560,786
Page:1 Apr-01 May-01 Jun-01 Jul-01 ASSETS Current Assets Cash and Short Term Investments 15,862,304 51,998,607 9,198,226 Accounts Receivable - Net of Allowance 2,560,786
EMPRESAS CMPC COMPANY OVERVIEW
 EMPRESAS CMPC COMPANY OVERVIEW JUNE, 2014 AGENDA I. Company description II. Our value proposal 1. Leading diversified Latin American P&P player and low cost producer 2. Diversified investment portfolio
Celulose Irani S.A. Quarterly Information (ITR) at June 30, 2015 and report on review of quarterly information
 at June 30, 2015 and report on review of quarterly information") Celulose Irani S.A. Quarterly Information (ITR) at June 30, 2015 and report on review of quarterly information / IRANI615IFN.XLSX Report on review of quarterly information To the Board of Directors and
Celulose Irani S.A. Quarterly Information (ITR) at June 30, 2015 and report on review of quarterly information / IRANI615IFN.XLSX Report on review of quarterly information To the Board of Directors and
(A free translation of the original in Portuguese)
") Porto Alegre, July 31, 2018. Celulose Irani (B3: RANI3 and RANI4), one of the major Brazilian companies in the packaging paper and corrugated cardboard packaging segments, announces today the consolidated
Porto Alegre, July 31, 2018. Celulose Irani (B3: RANI3 and RANI4), one of the major Brazilian companies in the packaging paper and corrugated cardboard packaging segments, announces today the consolidated
Citi's 8th Annual Brazil Equity Conference June, 2015 FIBRIA APP WITH THIS PRESENTATION IS AVAILABLE FOR DOWNLOAD AT APPLE STORE AND GOOGLE PLAY.
 Citi's 8th Annual Brazil Equity Conference June, 2015 FIBRIA APP WITH THIS PRESENTATION IS AVAILABLE FOR DOWNLOAD AT APPLE STORE AND GOOGLE PLAY. 2 Disclaimer The information contained in this presentation
Third Quarter 2018 Earnings Results
 Third Quarter 2018 Earnings Results Second Quarter 2018 Earnings Results Forward-Looking Statements This presentation may contain forward-looking statements that should be considered as good faith estimates.
Delivering value, delivering commitments. January 2017
 Delivering value, delivering commitments January 2017 Disclaimer The information contained in this presentation has been prepared by Ence Energía y Celulosa, S.A. (hereinafter, "Ence"). This presentation
FY 2018 Results. February 27, 2019
 FY 2018 Results February 27, 2019 Disclaimer The information contained in this presentation has been prepared by Ence Energía y Celulosa, S.A. (hereinafter, "Ence"). This presentation includes data relating
Interim report presentation Q October 31, 2017
 Interim report presentation 2017 October 31, 2017 Ulf Larsson, CEO Summary 2017 Strong market with increasing prices Sales growth of 12% vs 2016 Volumes +11%, price/mix +3%, currency -2% EBITDA 1) up 25%
Fourth Quarter 2017 Earnings Results
 Fourth Quarter 2017 Earnings Results Forward-Looking Statements This presentation may contain forward-looking statements, that should be considered as good faith estimates. Such statements are subject
Delivering value Delivering commitments. June 2018
 Delivering value Delivering commitments June 2018 Disclaimer The information contained in this presentation has been prepared by Ence Energía y Celulosa, S.A. (hereinafter, "Ence"). This presentation includes
LatAm Commodities Conference - Itaú BBA October 2014
 LatAm Commodities Conference - Itaú BBA October 2014 2 Disclaimer The information contained in this presentation may include statements which constitute forward-looking statements, within the meaning of
EMPRESAS CMPC PRESENTATION PREPARED FOR SANTANDER S XIX ANNUAL LATIN AMERICAN CEO CONFERENCE - CANCUN LUIS LLANOS CFO COLOMBA HENRÍQUEZ IR OFFICER
 EMPRESAS CMPC PRESENTATION PREPARED FOR SANTANDER S XIX ANNUAL LATIN AMERICAN CEO CONFERENCE - CANCUN LUIS LLANOS CFO COLOMBA HENRÍQUEZ IR OFFICER AGENDA I. Company description II. Our value proposal 1.
CONFERENCE CALL PRESENTATION
 CONFERENCE CALL PRESENTATION First Quarter 2017 Results May 26 th, 2017 www.empresascopec.cl AGENDA 01 02 03 04 CONSOLIDATED RESULTS REVIEW BY BUSINESS DIVISION HIGHLIGHTS OF THE QUARTER Q & A www.empresascopec.cl
Corporate Presentation November, 2016
 Corporate Presentation November, 2016 2 Disclaimer The information contained in this presentation may include statements which constitute forward-looking statements, within the meaning of Section 27A of