Popular Exit Strategies The Good, the Bad, and the Ugly
|
|
|
- Marshall Hunter
- 6 years ago
- Views:
Transcription
1 Popular Exit Strategies The Good, the Bad, and the Ugly A webcast presentation for the Market Technicians Association Presented by Chuck LeBeau Director of Analytics
2 What we intend to cover Problems with most trailing exits The good, the bad, and the ugly Proposed solutions Chandelier exits Modified Parabolic Targeted exits for short-term traders Other methods to exit on strength
3 Challenges of using trailing stops 1. Always know when to sell 2. Limit risk & maximize profits 3. Avoid whipsaws 4. Have a reentry 5. Ease of use Most popular methods of setting trailing stops are seriously flawed We will now look at some common methods of setting stops and discuss their strengths and weaknesses
4 Percentage trailing stops The Good: Ease of calculations Objective (no chart analysis) The Bad: Stops get closer or farther away based on price levels No adjustment for trend strength or direction No research on what percentages work best (8%, 10%, 25% or some other percentage???) The Ugly: Subtract percentage from where? From entry? From recent high? After price breaks by selected percentage where is next stop?
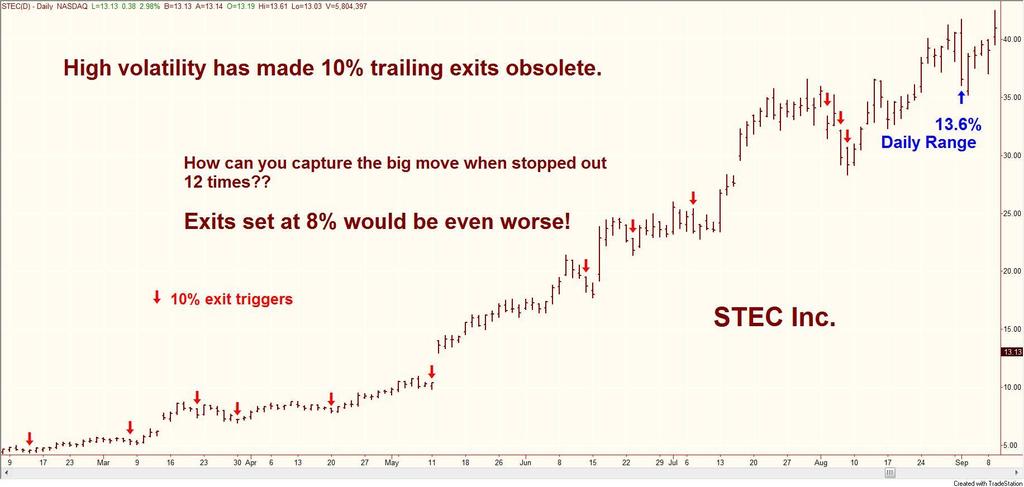
5
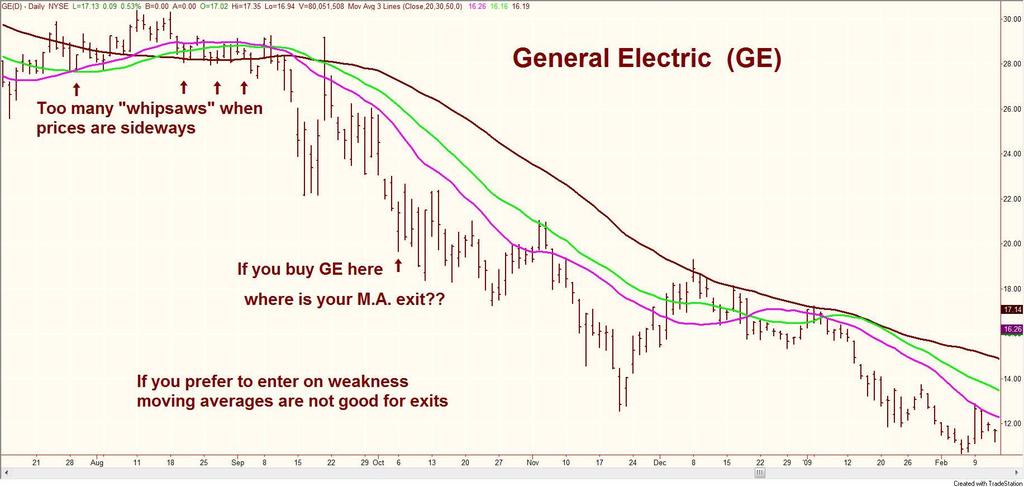
6 Moving Average trailing stops The Good: Ease of calculations Objective (no chart analysis) The Bad: Which moving average should you use? No adjustments for direction of trends No adjustment for changes in volatility The Ugly: Too slow- rapidly rising prices quickly get too far away from MA After MA is broken where is next stop? They will drive you crazy in sideways markets!!
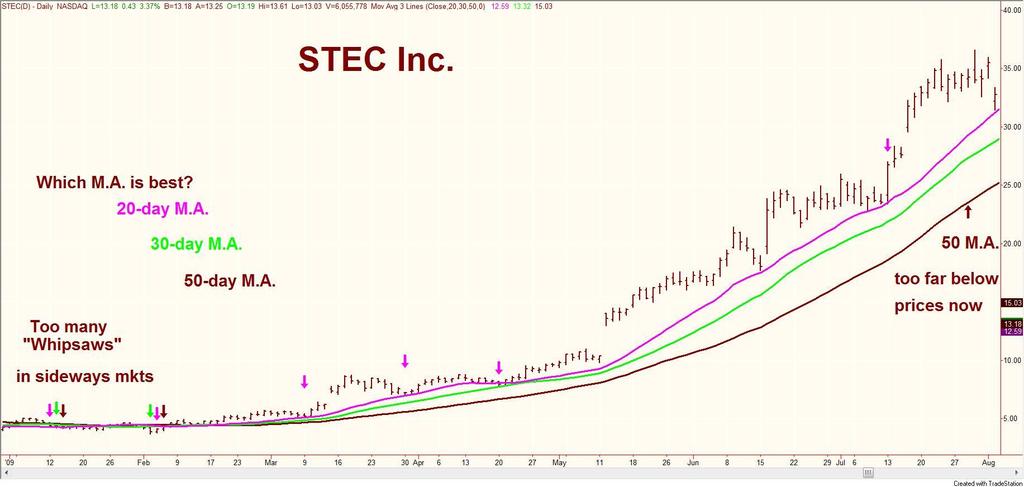
7
8
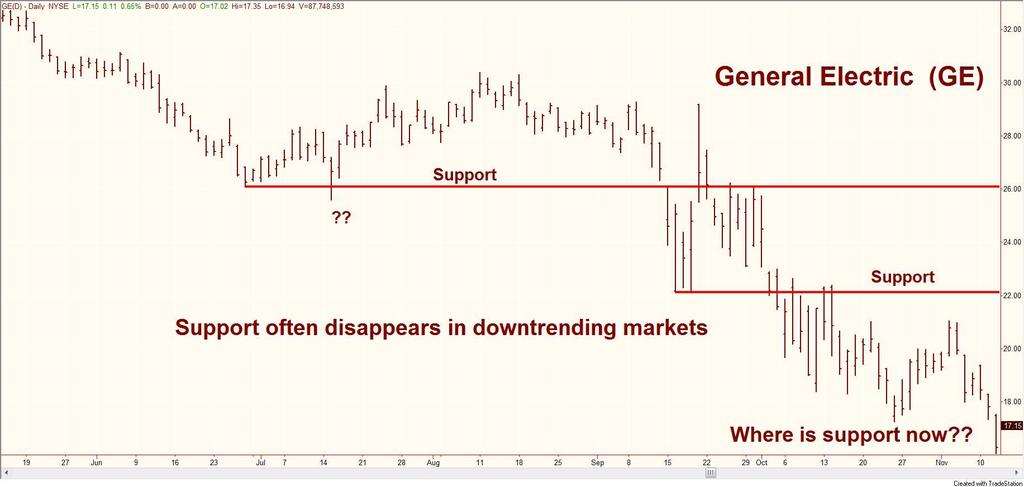
9 Exit at Support levels The Good: No calculations The Bad: Highly subjective expert chart analysis required Support levels do not move up as prices accelerate No adjustment for changes in direction or volatility The Ugly: Too slow- Rapidly rising prices quickly get too far away Not suited to downtrends where is next stop?
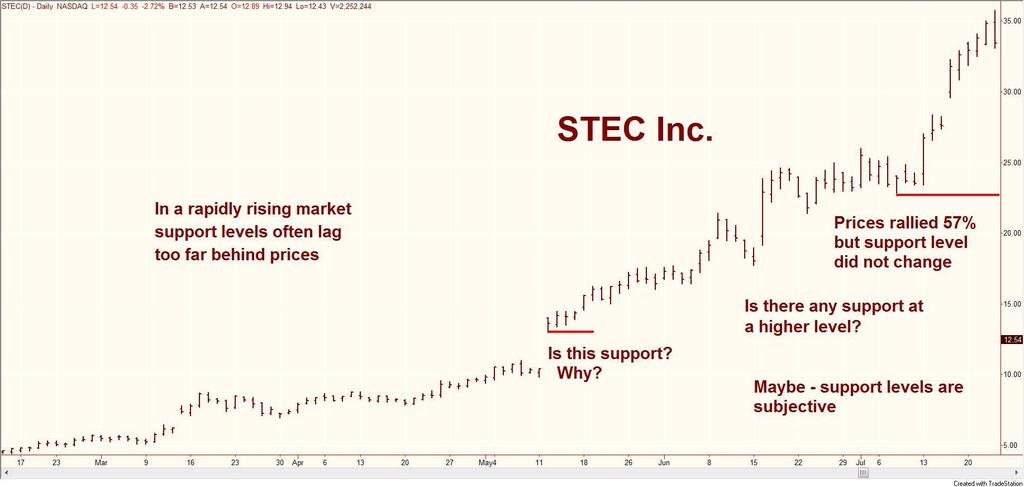
10
11
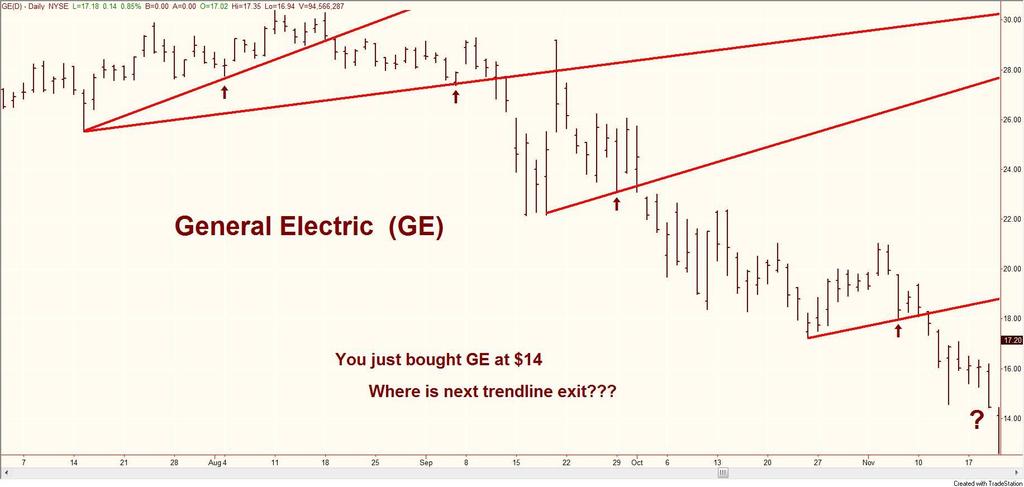
12 Exit at Trend Lines The Good: No calculations The Bad: Highly subjective expert chart analysis required No adjustment for changes in direction or volatility Frequent whipsaws in sideways market The Ugly: Too slow- Rapidly rising prices quickly get too far away Not suited to downtrends where is next stop?
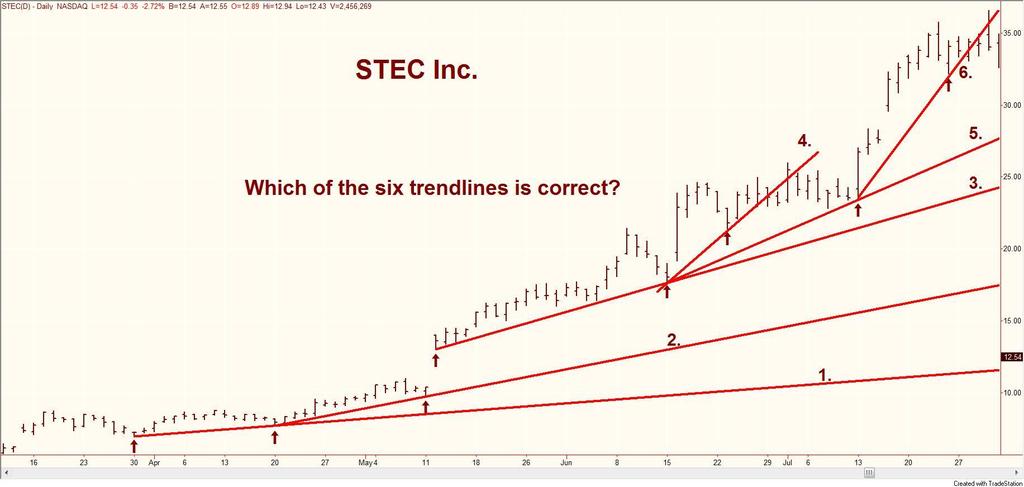
13
14
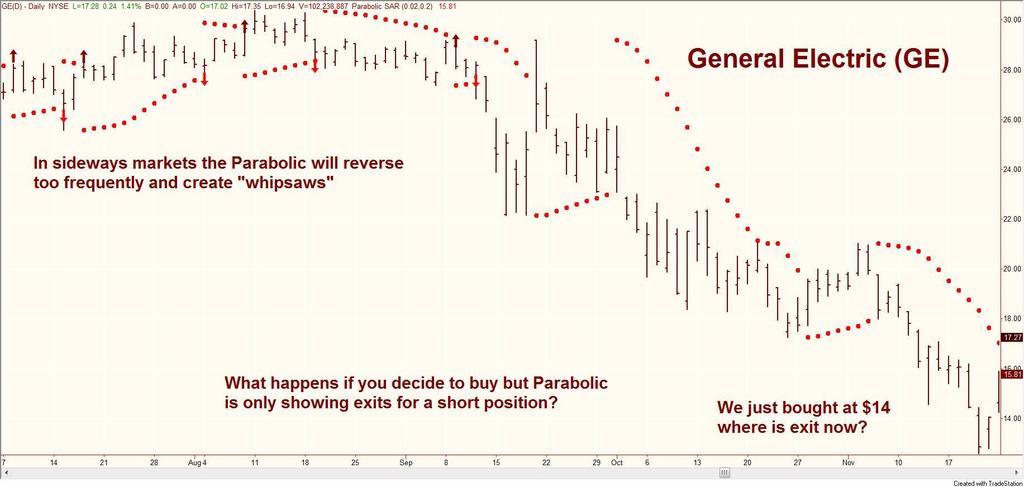
15 Exit at Parabolic SAR The Good: Accelerate very quickly to keep pace with rising prices The Bad: Complicated calculations requiring computer and software No adjustment for changes in direction or volatility Frequent whipsaws in sideways markets The Ugly: Not suited to downtrends where is next exit? Does not let profits run for big gains
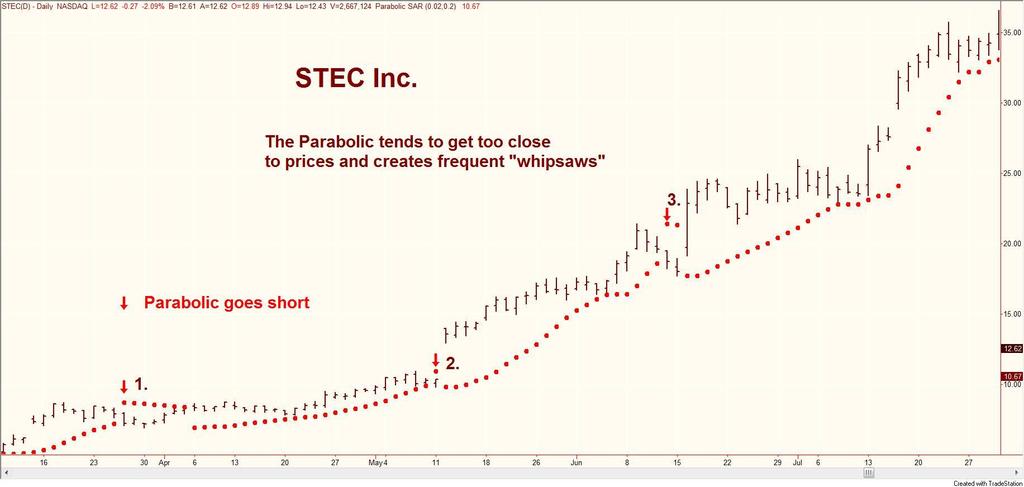
16
17
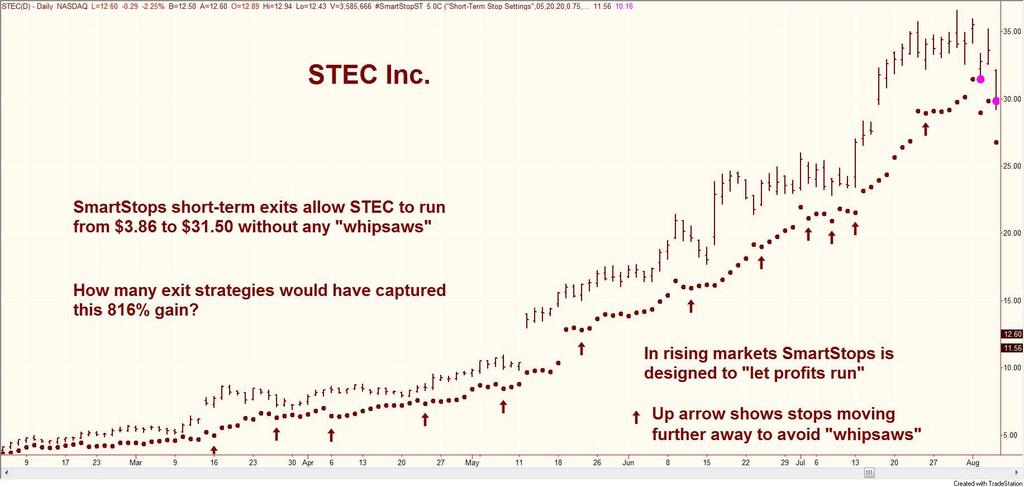
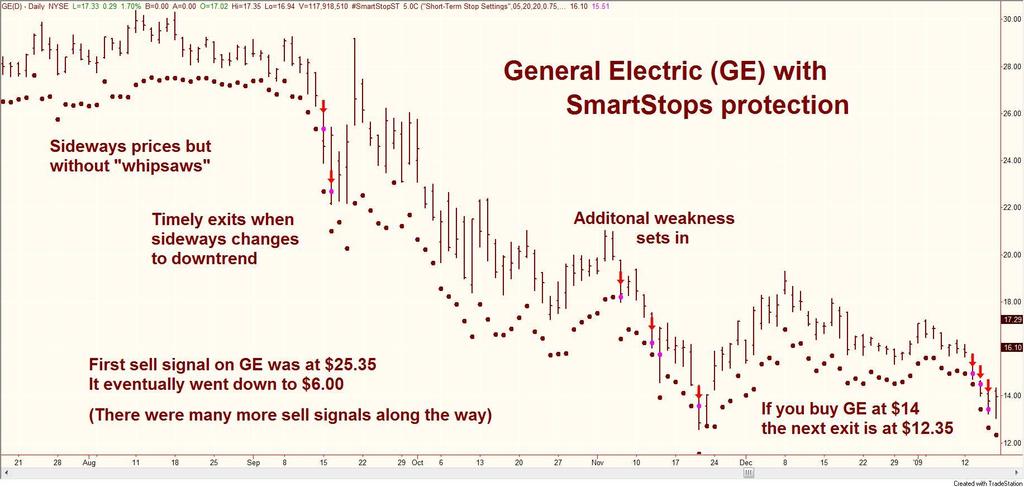
18 Exits at SmartStops.net The Good: Cuts losses short while letting profits run Automatically adjusts to trend direction Automatically adjusts to changes in volatility Completely objective no charts to read Provides exit prices in advance of use Choice of short-term and long-term time frames Timely notification when exit prices are hit When necessary, exits move farther away to avoid whipsaws The Bad: Service is only free for 14 days on a trial basis The Ugly: There is no ugly SmartStops are beautiful!
19
20
21 Quick comparison to buy and hold From the beginning of 1998 thru July 2009, a buy and hold approach using 1,000 shares of the SPY (ETF for the S&P 500) would have lost $6,940. If SmartStops exits were combined with a simple reentry at 20 day highs, over the same period the result would have been a profit of $52,970. The SmartStops exits improved results over this ten-year period by a total of $59,910!
22 How the SS strategies work 1. The exits are adjusted according to trend direction: In an uptrend the exits trail at a distance in order to let profits run. In a downtrend the exits are moved closer to protect more capital. In sideways markets the exits trail just outside the range of random price swings to avoid whipsaws.
23 How the SS strategies work 2. The exits are accurately adjusted to changes in volatility as measured by Average True Range: The normal price ranges are mathematically defined in units of ATR. To avoid whipsaws the exits are placed outside the normal price swings. Only an abnormal period of weakness will trigger an exit signal.
24 Range True Range True range adjusts for gaps
25 How the SS strategies work 3. In upward trending markets the Chandelier Exit allows the exits to keep up with price acceleration: A stop is placed (3?) Average True Ranges from the highest high since entry of the trade or the highest high over some defined period of time. Because the stop is attached to the high point it moves up at the same rate that the high moves. The length of the chain on the Chandelier is measured in units of ATR and will automatically adjust to changes in volatility. Adjusting the chain on the Chandelier Exit keeps the stops from getting too close or too far away.
26 How the SS strategies work 4. A highly modified Parabolic indicator allows the stops to gradually accelerate without getting too close: The Parabolic is modified to make it a long-only indicator and it never reverses. The acceleration of the Parabolic is slowed so it does not accelerate too fast. The Parabolic is modified so that it is not allowed to move inside the range of normal price activity.
27 How the SS strategies work 5. Combine the exit signals with a foolproof and intelligent method of reentering trades after an exit: Try to find indicators such as MACD and ADX that can signal when strength has returned to a position you may have previously sold. Our research has shown that following a reentry methodology as simple as the Donchian 4-week breakout or the Turtles 20-day breakout would prevent missing any major opportunities. SmartStops uses two proprietary reentry methods. When the trend is down the reentries are slow to trigger. When the trend is up the reentries will trigger quickly.
28 Advice: Overcome Whipsaw Paranoia The only way to completely avoid whipsaws is to not use protective stops. Unfortunately that drastic solution would expose investors to unacceptable levels of risk. In order to mitigate the consequences of a premature exit signal a plan of reentering needs to be in place. Our studies clearly show that over the long run the benefits of using protective trailing stops will far exceed the expense or lost opportunity costs of an occasional whipsaw. Learn to accept the occasional whipsaw as simply a cost of doing business and make sure that you are always prepared to renter if a strong upward trend is resumed.
29 Advice: Learn Position Sizing Use your protective stops to determine your correct position size. Here are the simple steps: 1. Select a percentage level of risk relative to the size of your portfolio. Example a portfolio of $100,000 might select a risk level of 1.5% so risk should be limited to $1500 on each trade. 2. Pick a stock and find your precise worst-case exit based on your exit strategies. Example buying a $25 stock and the exit stop is at $22. Risk is $3 per share so correct position size is 500 shares. ($1500 risk limit divided by $3 risk to your exit point) Remember, controlling risk is a two step process: use protective exits and then make sure you control your initial position size.
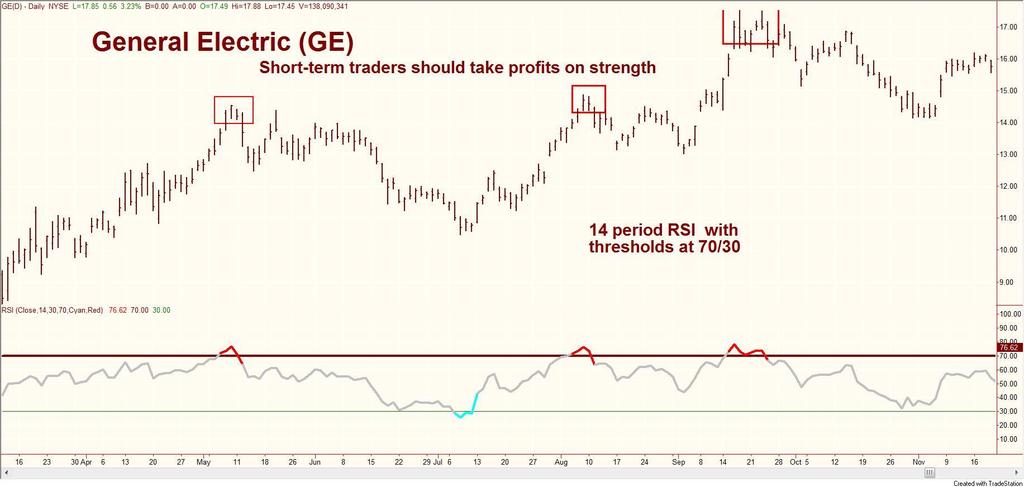
30 Advice: for Short-term traders Most of the exits discussed in this presentation work best for long-term trend followers who are able to hold positions until weakness is detected. Short-term traders may use trailing stops for protection but should plan to exit on strength in order to maximize short-term profits. Here is one of my favorite exit-on-strength techniques. It is extremely simple and uses Welles Wilder s RSI indicator. However other overbought/over-sold oscillators would also work. (Stochastics, William s Percent R, various bands, etc.) We will also be discussing the use of targeted exits.
31
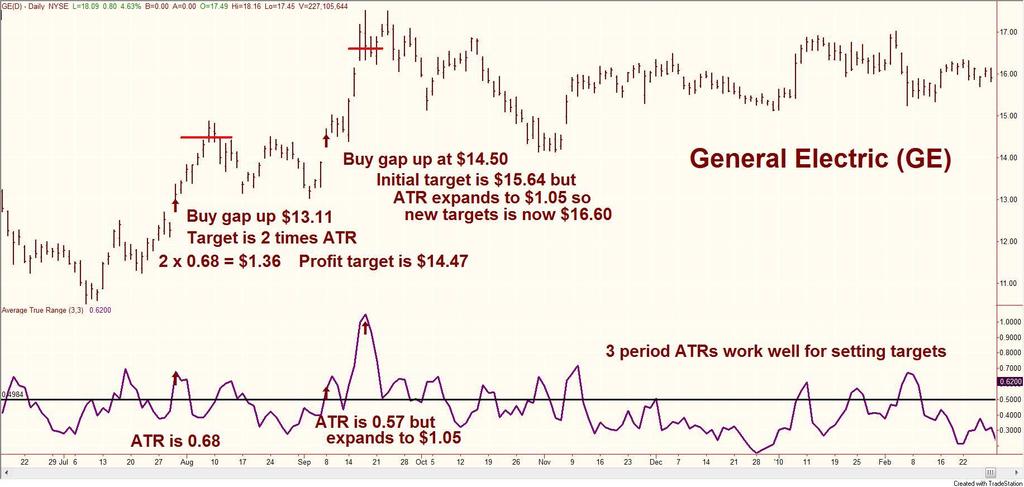
32 Use ATR to set profit targets Units of ATR are perfect for setting profit targets because they contract and expand as volatility changes. In volatile markets ATR profit targets will be bigger. In quiet markets ATR targets will be smaller. Short-term traders might expect maximum profits to be about 2 ATRs using a 3-period ATR calculation. Although it is more difficult and less accurate, targets can also be used by longer-term traders using a longer ATR (20 periods) and a larger ATR multiple (4 or higher).
33
34 Thanks for attending For additional education and many informative articles be sure to visit and You are welcome to contact me at if you have any questions about this presentation. (I will be happy to send you a copy of these slides via .) Good luck and good trading!
Exit Strategies for Stocks and Futures
 Exit Strategies for Stocks and Futures Presented by Charles LeBeau E-mail clebeau2@cox.net or visit the LeBeau web site at www.traderclub.com Disclaimer Each speaker at the TradeStationWorld Conference
Thanks for Checking out The Parabolic SAR Trading Strategy Report that we have developed for you to learn and apply to your trading system..
 Thanks for Checking out The Parabolic SAR Trading Strategy Report that we have developed for you to learn and apply to your trading system.. This Trading Strategy will teach you how to catch new trends
Using Acceleration Bands and Williams %R
 Price Headley s Simple Trading System for Stock, ETF & Option Traders Using Acceleration Bands and Williams %R How Technical Indicators Can Help You Find the Big Trends For option traders, correctly forecasting
SuperADX. Written on: October 11 th 2009
 SuperADX Written on: October 11 th 2009 Congratulations on your purchase. And I mean that! You are now in possession of a powerful trading tool. It is what I believe to be the most leading and most profitable
Using Acceleration Bands, CCI & Williams %R
 Price Headley s Simple Trading System for Stock, ETF & Option Traders Using Acceleration Bands, CCI & Williams %R How Technical Indicators Can Help You Find the Big Trends For any type of trader, correctly
Chapter 2.3. Technical Analysis: Technical Indicators
 Chapter 2.3 Technical Analysis: Technical Indicators 0 TECHNICAL ANALYSIS: TECHNICAL INDICATORS Charts always have a story to tell. However, from time to time those charts may be speaking a language you
OSCILLATORS. TradeSmart Education Center
 OSCILLATORS TradeSmart Education Center TABLE OF CONTENTS Oscillators Bollinger Bands... Commodity Channel Index.. Fast Stochastic... KST (Short term, Intermediate term, Long term) MACD... Momentum Relative
Fast Track Stochastic:
 Fast Track Stochastic: For discussion, the nuts and bolts of trading the Stochastic Indicator in any market and any timeframe are presented herein at the request of Beth Shapiro, organizer of the Day Traders
Schwab Investing Insights Trading Edition Text Close Window Size: November 15, 2007
 Schwab Investing Insights Trading Edition Text Close Window Size: from TheStreet.com November 15, 2007 ON TECHNIQUES Two Indicators Are Better Than One The Relative Strength Index works well but it s better
SWITCHBACK (FOREX) V1.4
 V1.4") SWITCHBACK (FOREX) V1.4 User Manual This manual describes all the parameters in the ctrader cbot. Please read the Switchback Strategy Document for an explanation on how it all works. Last Updated 11/11/2017
SWITCHBACK (FOREX) V1.4 User Manual This manual describes all the parameters in the ctrader cbot. Please read the Switchback Strategy Document for an explanation on how it all works. Last Updated 11/11/2017
Technicals & Time Frame
 Advanced Charting Neither Better Trades or any of its personnel are registered broker-dealers or investment advisers. I will mention that I consider certain securities or positions to be good candidates
The 5 Money Management And Position Sizing Secrets Of The Turtle Traders
 The Turtle traders were a legendary group of traders coached by two successful traders, Richard Dennis and William Eckhardt. They selected 10 people (turtles) with little to no prior trading experience
Real-time Analytics Methodology
 New High/Low New High/Low alerts are generated once daily when a stock hits a new 13 Week, 26 Week or 52 Week High/Low. Each second of the trading day, the stock price is compared to its previous 13 Week,
How To Use S&P 500 Futures To Get A Heads Up On Stock Price Action By Tsutae Kamada
 How To Use S&P 500 Futures To Get A Heads Up On Stock Price Action By Tsutae Kamada As we know, to be successful traders, we should not fight the overall trend of the stock market. If we are experiencing
The Schaff Trend Cycle
 The Schaff Trend Cycle by Brian Twomey This indicator can be used with great reliability to catch moves in the currency markets. Doug Schaff, president and founder of FX Strategy, created the Schaff trend
Class 7: Moving Averages & Indicators. Quick Review
 Today s Class Moving Averages Class 7: Moving Averages & Indicators 3 Key Ways to use Moving Averages Intro To Indicators 2 Indicators Strength of Lines Quick Review Great for establishing point of Support
Technical Indicators
 Taken From: Technical Analysis of the Financial Markets A Comprehensive Guide to Trading Methods & Applications John Murphy, New York Institute of Finance, Published 1999 Technical Indicators Technical
Planetary 2 Library ADVANCED TRADERS LIBRARYII. Introduction: Benefits: Included in this Library: L I B R A R I E S. Functions.
 Planetary 2 Library ADVANCED TRADERS LIBRARYII Introduction: The Advanced Traders Library II picks up where The Advanced Traders Library left off. This library contains 10 additional strategies including
Market Mastery Protégé Program Method 1 Part 1
 Method 1 Part 1 Slide 2: Welcome back to the Market Mastery Protégé Program. This is Method 1. Slide 3: Method 1: understand how to trade Method 1 including identifying set up conditions, when to enter
MagicBreakout Forex Trading Strategy
 Tim Trush & Julie Lavrin introduce MagicBreakout Forex Trading Strategy Your guide to financial freedom. Tim Trush, Julie Lavrin, T&J Profit Club, 2007, All rights reserved www.magicbreakout.com Table
 1 www.candlecharts.com 2 BONUS www. candlecharts.com/special/swing-trading-2/ 3 www. candlecharts.com/special/swing-trading-2/ 4 www. candlecharts.com/special/swing-trading-2/ 5 www. candlecharts.com/special/swing-trading-2/
Now You Can Have These Trading Gems- Free!
 Presents Killer Patterns Now You Can Have These Trading Gems- Free! The Trading Info Revealed Here is not the Same as the Proven WizardTrader.com Methods But Works Well With Them 1 Copyright Information
Combining Rsi With Rsi
 Working Two Stop Levels Combining Rsi With Rsi Optimization and stop-losses can help you minimize risks and give you better returns. channels, and so forth should be kept to a minimum. DAVID GOLDIN ou
The Forex Report CORE CONCEPTS. J A N U A R Y Signal Selection By Scott Owens
 The Forex Report CORE CONCEPTS J A N U A R Y 2 0 0 5 Signal Selection By Scott Owens When selecting which signals to use, most traders shop charts until they find one that tells the story they want to
Weekly Options Secrets Revealed: A Proven Options Trading Plan
 Weekly Options Secrets Revealed: A Proven Options Trading Plan When talking about stock options there are many common questions that come up. Which strike price should I trade? Should I buy or sell the
Losing When Good Trade Goes Bad
 Webinar 21 Feb 2017 (futures.io) Losing When Good Trade Goes Bad Al Brooks How to Trade Forex Price Action Part Video #54 Brooks Trading Course BrooksTradingCourse.com BrooksPriceAction.com Main Points
Convergence and Divergence
 Convergence and Divergence Momentum: The Verge of Success Momentum plays a key role in trend analysis. Trends are composed of a series of price swings. It is a trader s edge to know when a trend is slowing
Trade Setups, Rules & Trading Strategies
 Trade Setups, Rules & Trading Strategies dba of FreeTradingVideos.com, Inc. v.1411 Using Technical Analysis to Enter, Manage and Exit Trades Quote of the Day At Grok Trade, we do not trade Trading Patterns.
Introduction to the Gann Analysis Techniques
 Introduction to the Gann Analysis Techniques A Member of the Investment Data Services group of companies Bank House Chambers 44 Stockport Road Romiley Stockport SK6 3AG Telephone: 0161 285 4488 Fax: 0161
Compiled by Timon Rossolimos
 Compiled by Timon Rossolimos - 2 - The Seven Best Forex Indicators -All yours! Dear new Forex trader, Everything we do in life, we do for a reason. Why have you taken time out of your day to read this
TD AMERITRADE Technical Analysis Night School Week 2
 TD AMERITRADE Technical Analysis Night School Week 2 Hosted By Derek Moore Director, National Education For the audio portion of today s webcast, please enable your computer speakers. Past performance
Introduction. Technicians (also known as quantitative analysts or chartists) usually look at price, volume and psychological indicators over time.
 usually look at price, volume and psychological indicators over time.") Technical Analysis Introduction Technical Analysis is the study of market action, primarily through the use of charts, for the purpose of forecasting future price trends. Technicians (also known as quantitative
Technical Analysis Introduction Technical Analysis is the study of market action, primarily through the use of charts, for the purpose of forecasting future price trends. Technicians (also known as quantitative
charts to also be in the overbought area before taking the trade. If I took the trade right away, you can see on the M1 chart stochastics that the
 When you get the signal, you first want to pull up the chart for that pair and time frame of the signal in the Web Analyzer. First, I check to see if the candles are near the outer edge of the Bollinger
Maybank IB. Understanding technical analysis. by Lee Cheng Hooi. 24 September Slide 1 of Maybank-IB
 Maybank IB Understanding technical analysis 24 September 2011 by Lee Cheng Hooi Slide 1 of 40 Why technical analysis? 1) Market action discounts everything 2) Prices move in trends 3) History repeats itself
The very first calculations for average gain and average loss are simple 14- period averages.
 Introduction Developed by J. Welles Wilder, the Relative Strength Index (RSI) is a momentum oscillator that measures the speed and change of price movements. RSI oscillates between zero and 100. Traditionally,
Chapter 2.3. Technical Indicators
 1 Chapter 2.3 Technical Indicators 0 TECHNICAL ANALYSIS: TECHNICAL INDICATORS Charts always have a story to tell. However, sometimes those charts may be speaking a language you do not understand and you
Bollinger Trading Methods. Play 1 - The Squeeze
 Overview: Play 1 - The Squeeze Play 2 - The Trend Trade Play 3 - Reversals Wrap up Bollinger Trading Methods Play 1 - The Squeeze The Squeeze The most popular strategy Looks to enter a trend early on Anticipates
TRADING STRATEGY SERIES LEARN HOW TO SPOT OPPORTUNITIES IN VOLATILE MARKETS fpmarkets.com.au
 1 TRADING STRATEGY SERIES LEARN HOW TO SPOT OPPORTUNITIES IN VOLATILE MARKETS This educational material does not constitute financial product advice and does not take into account your investment objectives,
BONUS. www. candlecharts.com/special/swing-trading-2/
 BONUS www. candlecharts.com/special/swing-trading-2/ 1 www. candlecharts.com/special/swing-trading-2/ www. candlecharts.com/special/swing-trading-2/ www. candlecharts.com/special/swing-trading-2/ 2 www.
TECHNICAL INDICATORS
 TECHNICAL INDICATORS WHY USE INDICATORS? Technical analysis is concerned only with price Technical analysis is grounded in the use and analysis of graphs/charts Based on several key assumptions: Price
MULTI-TIMEFRAME TREND TRADING
 1. SYNOPSIS The system described is a trend-following system on a slow timeframe that uses optimized (that is, contrarian) entries and exits on a fast timeframe at the tops and bottoms of retraces against
Charting Glossary. September 2008 Version 1
 Charting Glossary September 2008 Version 1 i Contents 1 Price... 1 2 Charts... 1 2.1 Line, Step, Scatter, Histogram/Mountain charts...1 2.2 Open/High/Low/Close charts (Bar Charts)...1 2.3 Candle charts...2
FOREX TRADING STRATEGIES.
 FOREX TRADING STRATEGIES www.ifcmarkets.com www.ifcmarkets.com 2 One of the most powerful means of winning a trade is the portfolio of Forex trading strategies applied by traders in different situations.
Swing Trading Strategies that Work
 Swing Trading Strategies that Work Jesse Livermore, one of the greatest traders who ever lived once said that the big money is made in the big swings of the market. In this regard, Livermore successfully
TRADING ADDICTS. Lesson 3: Timing and Technical Indicators. Timing the Market. Copyright 2010, Trading Addicts, LLC. All Rights Reserved
 Lesson 3: Timing and Technical Indicators In this chapter, we will be focusing on the timing of the trade, from each individual angle. Timing plays a critical role in a Covered Call strategy, as it can
As the size of the GorillaTrades portfolio increases, the Gorilla understands that not every new stock idea can be purchased.
 Welcome to the GorillaTrades System tutorial. Feel free to learn at your own pace. You can pause anytime, and can also select different chapters. If you d prefer to read through the material yourself,
Technical Indicators versiunea
 Technical Indicators versiunea 2.0 03.10.2008 Contents 1 Price... 1 2 Charts... 1 2.1 Line, Step, Scatter, Histogram/Mountain charts 1 2.2 Open/High/Low/Close charts (Bar Charts)... 2 2.3 Candle charts...
Naked Trading and Price Action
 presented by Thomas Wood MicroQuant SM Divergence Trading Workshop Day One Naked Trading and Price Action Risk Disclaimer Trading or investing carries a high level of risk, and is not suitable for all
Trading Success Principles Floor Trader Pivots
 Trading Success Principles Floor Trader Pivots Trading Concepts, Inc. Trading Success Principles Floor Trader Pivots By Todd Mitchell Copyright 2014 by Trading Concepts, Inc. All Rights Reserved This training
IronFX. technical indicators
 IronFX technical indicators Average Directional Index (ADX) The Average Directional Index (ADX) helps traders see if a trend is developing in the charts and whether the trend is strengthening or weakening.
Subject: Daily report explanatory notes, page 2 Version: 0.9 Date: Dec 29, 2013 Author: Ken Long
 Subject: Daily report explanatory notes, page 2 Version: 0.9 Date: Dec 29, 2013 Author: Ken Long Description Example from Dec 23, 2013 1. Market Classification: o Shows market condition in one of 9 conditions,
Rotational Trading Systems
 Rotational Trading Systems A new and very different alternative? By: Bruce Wood Disclaimer: This presentation is for educational purposes ONLY. I am a Private Trader, and I DO NOT provide any personal
INTERMEDIATE EDUCATION GUIDE
 INTERMEDIATE EDUCATION GUIDE CONTENTS Key Chart Patterns That Every Trader Needs To Know Continution Patterns Reversal Patterns Statistical Indicators Support And Resistance Fibonacci Retracement Moving
Figure 3.6 Swing High
 Swing Highs and Lows A swing high is simply any turning point where rising price changes to falling price. I define a swing high (SH) as a price bar high, preceded by two lower highs (LH) and followed
RSI 2 System. for Shorter term SWING trading and Longer term TREND following. Dave Di Marcantonio 2016
 RSI 2 System for Shorter term SWING trading and Longer term TREND following Dave Di Marcantonio 2016 ddimarc@gmail.com Disclaimer Dave Di Marcantonio Disclaimer & Terms of Use All traders and self-directed
Getting Paid System Part 2. Module 2 Review The Market Up, Down & Sideways 5 Key Principles Big Mistake To Avoid Action Items To Take
 Disclaimer The VectorVest Program ( the System ) which we promote is not intended to provide you with specific or personalized advice. In all circumstances where you are looking to apply the System to
USER GUIDE. How To Get The Most Out Of Your Daily Cryptocurrency Trading Signals
 USER GUIDE How To Get The Most Out Of Your Daily Cryptocurrency Trading Signals Getting Started Thank you for subscribing to Signal Profits daily crypto trading signals. If you haven t already, make sure
1. Accumulation Swing Index
 1. Accumulation Swing Index The Accumulation Swing Index (Wilder) is a cumulative total of the Swing Index. The Accumulation Swing Index may be analyzed using technical indicators, line studies, and chart
EZ Trade FOREX Day Trading System. by Beau Diamond
 EZ Trade FOREX Day Trading System by Beau Diamond The EZ Trade FOREX Day Trading System is mainly used with four different currency pairs; the EUR/USD, USD/CHF, GBP/USD and AUD/USD, but some trades are
Table of Contents. Risk Disclosure. Things we will be going over. 2 Most Common Chart Layouts Anatomy of a candlestick.
 Table of Contents Risk Disclosure Things we will be going over 2 Most Common Chart Layouts Anatomy of a candlestick Candlestick chart Anatomy of a BAR PLOT Indicators Trend-Lines Volume MACD RSI The Stochastic
RISK DISCLOSURE STATEMENT / DISCLAIMER AGREEMENT
 RISK DISCLOSURE STATEMENT / DISCLAIMER AGREEMENT Trading any financial market involves risk. This report and all and any of its contents are neither a solicitation nor an offer to Buy/Sell any financial
Planetary WINNING 2 Library STRATEGIES OF THE MASTERS II LIBRARY. Introduction: Benefits: L I B R A R I E S
 Planetary WINNING 2 Library STRATEGIES OF THE MASTERS II LIBRARY Introduction: Winning Strategies of the Masters II is the successor to the Winning Trading Strategies library. In this collection of strategies
Williams Percent Range
 Williams Percent Range (Williams %R or %R) By Marcille Grapa www.surefiretradingchallenge.com RISK DISCLOSURE STATEMENT / DISCLAIMER AGREEMENT Trading any financial market involves risk. This report and
Copyright by Profits Run, Inc. Published by: Profits Run, Inc Beck Rd Unit F1. Wixom, MI
 DISCLAIMER: Stock, forex, futures, and options trading is not appropriate for everyone. There is a substantial risk of loss associated with trading these markets. Losses can and will occur. No system or
Top Down Analysis Success Demands Singleness of Purpose
 Chapter 9 Top Down Analysis Success Demands Singleness of Purpose Armed with a little knowledge about the stock and options market as well as a desire to trade, many new traders are faced with the daunting
Market Observations - as of Jul 27, 2018
 Market Observations - as of Jul 27, 2018 By Carl Jorgensen - For Objective Traders - For educational purposes only. Not Financial Advice. This week began with most markets continuing their bullish trends
BackTesting Report Presents The Official Study Guide For The Truth About MACD Video Series
 BackTesting Report Presents The Official Study Guide For The Truth About MACD Video Series Course Overview How to Make MACD Work for You How MACD Signals Are Used and Misused How BackTesting Helps You
THREE DIFFERENT TRENDS
 USER S GUIDE Welcome to FTMDaily s Market Barometer service! The Market Barometer is a powerful trend following system that can be used by both swing traders and long-term investors alike. This system
Advanced Trading Systems Collection MACD DIVERGENCE FOREX TRADING SYSTEM
 MACD DIVERGENCE FOREX TRADING SYSTEM 1 This system will cover the MACD divergence. With this forex trading system you can trade any currency pair (I suggest EUR/USD and GBD/USD when you start), and you
Chapter 24 DIVERGENCE DECISIONS
 Chapter 24 DIVERGENCE DECISIONS The subject of divergence is one that we will approach with the utmost caution. We hope we have made ourselves clear in the other volumes of this course that we have little
Technical Analysis for Options Trading. Fidelity Brokerage Services LLC, Member NYSE, SIPC, 900 Salem Street, Smithfield, RI
 Technical Analysis for Options Trading Fidelity Brokerage Services LLC, Member NYSE, SIPC, 900 Salem Street, Smithfield, RI 02917 747561.2.0 Disclosures Options trading entails significant risk and is
Power Ranger Strategy
 Power Ranger Strategy Power Ranger Strategy Strategy Concept Using the common oscillator, the Stochastic to identify entry for early range trading. Time-frame H1 and above. Currency Pairs All currency
Rockefeller Treasury Services, Inc. ( Daily Currency Trading Recommendations--CME/Globex FUTURES
 (www.rts-forex.com) Daily Currency Trading Recommendations--CME/Globex FUTURES Published Monday, 8//9 for Globex Open Tonight and Tuesday, 8/11/9--SEPT Contract SWING CURRENT PROFIT ENTRY ENTRY NEW STOP*
Introduction. Technical analysis is the attempt to forecast stock prices on the basis of market-derived data.
 Technical Analysis Introduction Technical analysis is the attempt to forecast stock prices on the basis of market-derived data. Technicians (also known as quantitative analysts or chartists) usually look
COPYRIGHTED MATERIAL. Index
 Index A Accuracy of data, 117 Adaptive moving averages, 19 ADX, see Average directional movement index Aesop, 1 Alcott, Louisa May, 163 Anti-Martingale strategy, 168, 169 Appel, Gerald, 27 Aristotle, 189
Explanation of the 5 / 15-Minute Trading Rules
 5 / 15-Minute Trading Rules 1 Explanation of the 5 / 15-Minute Trading Rules Trading during the first ½ hour of the day can be very tricky and if one were able to gather all of the statistics for retail
How I Trade Profitably Every Single Month without Fail
 How I Trade Profitably Every Single Month without Fail First of all, let me take some time to introduce myself to you. I am Koon Hwee (KH Lee) and I am a full time currency trader. I have a passion for
JOURNAL INTRODUCING THE HPO ROBERT KRAUSZ'S. Volume 2, Issue 2. ear Trader,
 ROBERT KRAUSZ'S JOURNAL INTRODUCING THE HPO TM ear Trader, D First, I would like to introduce myself. My name is Thom Hartle (www.thomhartle.com) and I have put together this latest issue of the FT Journal.
GUIDE TO STOCK trading tools
 P age 1 GUIDE TO STOCK trading tools VI. TECHNICAL INDICATORS AND OSCILLATORS I. Introduction to Indicators and Oscillators Technical indicators, to start, are data points derived from a specific formula.
Forexsignal30 Extreme ver. 2 Tutorials
 Forexsignal30 Extreme ver. 2 Tutorials Forexsignal30.com is a manual trading system that is composed of several indicators that mutually cooperate with each other. Very difficult to find indicators that
Gunning For Stops By: Lan H. Turner
 Gunning For Stops By: Lan H. Turner Stop order management can be a very complex subject, because in my opinion, it is the difference between a traders success and failure. This article is not in any sense
Software user manual for all our indicators including. Floor Traders Tools & TrendPro
 Software user manual for all our indicators including Floor Traders Tools & TrendPro All the software was designed and developed by Roy Kelly ARC Systems, Inc. 1712 Pioneer Ave Ste 1637 Cheyenne, WY 82001
Divergence and Momentum Trading
 presented by Thomas Wood MicroQuant SM Divergence Trading Workshop Day One Divergence and Momentum Trading Risk Disclaimer Trading or investing carries a high level of risk, and is not suitable for all
With that, let s dive into the steps. Step 1 Identify range bound markets on Daily or 4 Hour Charts
 If you have been trading for any length of time, you have probably noticed that the markets are moving sideways A LOT. Consolidation is a huge part of the market s balance and so it makes sense to learn
THE WISETRADER SUCCEEDING WITH FOREX TRADING
 THE WISETRADER SUCCEEDING WITH FOREX TRADING 1 TABLE OF CONTENT SUCCEEDING WITH FOREX TRADING LESSON 1: THE BASICS OF FOREX TRADING...3 HIGH RISK WARNING...3 ADVISORY WARNING...3 What is Forex trading?...4
Forex Advantage Blueprint
 Forex Advantage Blueprint Complimentary Report!! www.forexadvantageblueprint.com Copyright Protected www.forexadvantageblueprint.com - 1 - Limits of liability/disclaimer of Warranty The author and publishers
Hidden Divergence. Hello there, you will be excited about the information contained in this report.
 Hidden Divergence Hello there, you will be excited about the information contained in this report. Isn t it remarkable how people like us who are in the Trading business have taken frequently interesting
1. Introduction 2. Chart Basics 3. Trend Lines 4. Indicators 5. Putting It All Together
 Technical Analysis: A Beginners Guide 1. Introduction 2. Chart Basics 3. Trend Lines 4. Indicators 5. Putting It All Together Disclaimer: Neither these presentations, nor anything on Twitter, Cryptoscores.org,
Relative Strength Index (RSI) by Ty Young
 by Ty Young") Relative Strength Index (RSI) by www.surefire-trading.com Ty Young Hi, this is Ty Young with Surefire-trading.com and today I will be discussing the Relative Strength Index (RSI). History J. Welles Wilder,
Relative Strength Index (RSI) by www.surefire-trading.com Ty Young Hi, this is Ty Young with Surefire-trading.com and today I will be discussing the Relative Strength Index (RSI). History J. Welles Wilder,
Expert Trend Locator. The Need for XTL. The Theory Behind XTL
 Chapter 20 C H A P T E R 20 The Need for XTL esignal does an excellent job in identifying Elliott Wave counts. When combined with studies such as the Profit Taking Index, Wave Four Channels, Trend Channels
The Stackable Carry Trade
 The Stackable Carry Trade Introduction: The Carry Trade is a relatively popular strategy among Forex traders. The concept is to pair high yielding interest currencies against low interest currencies in
Technical Analysis and Charting Part II Having an education is one thing, being educated is another.
 Chapter 7 Technical Analysis and Charting Part II Having an education is one thing, being educated is another. Technical analysis is a very broad topic in trading. There are many methods, indicators, and
Naked Trading - Double Top Chart Pattern Strategy
 Naked Trading - Double Top Chart Pattern Strategy If you really want to learn a profitable way to trade then look no further, the Double Top chart pattern strategy uses simple and sound trading principles
This is the complete: Fibonacci Golden Zone Strategy Guide
 This is the complete: Fibonacci Golden Zone Strategy Guide In this strategy report, we are going to share with you a simple Fibonacci Trading Strategy that uses the golden ratio which is a special mathematical
How To Read Charts Like A Pro Your guide to reading stock charts!
 How To Read Charts Like A Pro Your guide to reading stock charts! Courtesy of Swing-Trade-Stocks.com You may distribute this book FREELY or use it as part of a commercial package as long as this page and
Top 10 BEST Forex Trading Strategies PDF Report Ebook Author
 Top 10 BEST Forex Trading Strategies PDF Report Ebook Author Top 10 Best Forex Trading Strategies PDF Report If you re in the pursuit of nding the Best Forex trading Strategy and the keys to choosing a
Profiting. with Indicators. By Jeff Drake with Ed Downs
 Profiting with Indicators By Jeff Drake with Ed Downs Profiting with Indicators By Jeff Drake with Ed Downs Copyright 2018 Nirvana Systems Inc. All Rights Reserved The charts and indicators used in this
TRADING QUALIFIED TRENDS. L.A Little (Author, Professional Trader) Founder of Technical Analysis Today
 Founder of Technical Analysis Today") TRADING QUALIFIED TRENDS L.A Little (Author, Professional Trader) Founder of Technical Analysis Today www.tatoday.com What is Trading? Many loose definitions floating around My definition is that trading
TRADING QUALIFIED TRENDS L.A Little (Author, Professional Trader) Founder of Technical Analysis Today www.tatoday.com What is Trading? Many loose definitions floating around My definition is that trading
The six technical indicators for timing entry and exit in a short term trading program
 The six technical indicators for timing entry and exit in a short term trading program Definition Technical analysis includes the study of: Technical analysis the study of a stock s price and trends; volume;
Using Oscillators & Indicators Properly May 7, Clarify, Simplify & Multiply
 Using Oscillators & Indicators Properly May 7, 2016 Clarify, Simplify & Multiply Disclaimer U.S. Government Required Disclaimer Commodity Futures Trading Commission Futures and Options trading has large