ISyE 512 Chapter 9. CUSUM and EWMA Control Charts. Instructor: Prof. Kaibo Liu. Department of Industrial and Systems Engineering UW-Madison
|
|
|
- Bernice Bryan
- 6 years ago
- Views:
Transcription


1 ISyE 512 hapter 9 USUM and EWMA ontrol harts Instructor: Prof. Kabo Lu Department of Industral and Systems Engneerng UW-Madson Emal: klu8@wsc.edu Offce: Room 317 (Mechancal Engneerng Buldng) ISyE 512 Instructor: Kabo Lu 1
2 Lst of topcs n hapter 9 USUM Motvaton What s t? How to determne the control lmts EWMA control chart MA hart ISyE 512 Instructor: Kabo Lu 2
3 Motvaton for USUM & EWMA ontrol harts To expedte detecton of a small mean shft n the process. Shewhart chart takes a long tme to detect a small mean shft (shft<1.5) only uses the nformaton about process contaned n the last plotted pont and gnores any nformaton gven by the entre sequence of ponts s not sutable for the sample wth a sngle observaton Shewhart chart wth other supplemental senstzng rules can ncrease detecton senstvty but reduce smplcty and ease of nterpretaton of the Shewhart control chart and ncrease type I error (sometmes dramatcally) ISyE 512 Instructor: Kabo Lu 3
4 An Motvaton Example onsder the followng data. Ths process has a mean ncrease snce sample 21, do you see t? ISyE 512 Instructor: Kabo Lu 4

5 What f ( X j j1 1) ISyE 512 Instructor: Kabo Lu 5
6 What s USUM hart? The USUM chart was frst proposed by Page (1954). USUM chart: drectly ncorporates all the nformaton n the sequence of sample values by plottng the cumulatve sums (USUM) of devatons of the sample values from a target value x j (x j ) j1 : the average of the jth sample : the target for the process mean : the cumulatve sum up to and ncludng the th sample n1: cusum could be constructed for ndvdual observatons ISyE 512 Instructor: Kabo Lu 6
7 Interpretaton of the USUM chart 1 (x j ) (x j ) (x ) 1 (x ) j1 j1 =, s a random walk wth mean zero >, s an upward drft trend <, s a downward drft trend Remark: a trend of s an ndcaton of the process mean shft. ISyE 512 Instructor: Kabo Lu 7
8 How to onstruct a USUM ontrol hart? Montor the mean of a process : Tabular (algorthmc) cusum (preferable way) V-mask form of cusum usum can be constructed for both ndvdual observatons and for the averages of ratonal subgroups. For ndvdual observaton: j1 x x (x j ) 1 (x ) ISyE 512 Instructor: Kabo Lu 8
9 onstruct a USUM ontrol hart Tabular USUM max[, max[, x ( ( K) x K) 1 1 ] ] Statstc / : one sde upper/lower cusum / : accumulate devatons from o that are greater than K, wth both quanttes reset to zero upon becomng negatve K: reference value (allowance or slack value) Often chosen about halfway between the target o and the out-of-control value of the mean 1 that we are nterested n detectng quckly Decson Rules: If ether or exceeds the decson nterval H (A common choce H=5), the process s consdered to be out of control K 2 2 ISyE 512 Instructor: Kabo Lu 9

10 ISyE 512 Instructor: Kabo Lu 1
11 ISyE 512 Instructor: Kabo Lu 11
12 usum Status hart (Fgure 9.3a) ISyE 512 Instructor: Kabo Lu 12
13 Procedures for onstructon of USUM Select K and H onstruct one sde upper and lower cusum and then represent n the two separate columns of the table alculate x -( +K) and -K- x alculate the accumulatve devatons + and - ount the number of consecutve perods that the cusum + or - have been nonzero, whch are ndcated by N + and N - respectvely ISyE 512 Instructor: Kabo Lu 13
14 Interpretaton of USUM Fnd the data pont out at whch or exceeds the decson nterval H (H=5) If the out-of-control data corresponds to an assgnable cause, then to determne the locaton of the last n-control data n = out - N + out or n = out - N - out where N + out and N - out correspond to N + and N - at data pont out Estmate the new process mean ˆ K N K N out out H H Plot a USUM status chart for vsualzaton f f however, the other senstzng rules cannot be safely used for the USUM chart because and are not ndependent ISyE 512 Instructor: Kabo Lu 14
: to mnmze the ARL 1 value for fxed ARL choose h (H=h): to obtan the desred n-control ARL performance ARL ARL 1 Not too senstve Shewhart chart")
15 Desgn of USUM Based on ARL The reference value of K and the decson nterval H have an effect on ARL and ARL 1 k=.5 (K=k): to mnmze the ARL 1 value for fxed ARL choose h (H=h): to obtan the desred n-control ARL performance ARL ARL 1 Not too senstve Shewhart chart ARL 1 =43.96 ISyE 512 Instructor: Kabo Lu 15
16 ARL of the USUM hart The most wdely used ARL s the Segmund's approxmaton. ISyE 512 Instructor: Kabo Lu 16
17 A numercal example (1) Try h = 3.25 ARL s not large enough so we wll ncrease h a lttle and try agan. ISyE 512 Instructor: Kabo Lu 17
18 ISyE 512 Instructor: Kabo Lu Standardzed USUM Advantage of a standardzed cusum: does not depend on. So, many cusum charts can now have the same values of k and h naturally represent the process varablty ; ] y k max[, ] k y max[, ; x y


19 Improvement of USUM Fast Intal Response (FIR): set If a shft occurred at the begnnng, FIR can detect the shft more quckly to decrease ARL 1 If n control at the begnnng, cusum wll quckly drop to zero, lttle effect on the performance Example: =1, K=3, H=12, 5% headstart value In-control data =1 1 =15 H / 2 6 ISyE 512 Instructor: Kabo Lu 19
20 USUM for Montorng Process Varablty reate a new standardzed quantty (Hawkns, 1981,1993), whch s senstve to varance changes. In-control dstrbuton of s approxmately N(,1) S S y.822 ; ~.349 max[, k S 1] max[, k S 1 N(,1); ] y x S S ; Selecton of h and k and the nterpretaton of cusum are smlar to the cusum for controllng the process mean ISyE 512 Instructor: Kabo Lu 2
21 EXPONENTIALLY WEIGHTED MOVING AVERAGE (EWMA) To exponentally forget the past data, we want to attach more weght to the most recent data It s a weghted average: a geometrc seres of weghts Z X (1 )Z 1 ; Z X <1-1 and (1-) j gettng smaller when j ncrease Z 1 j (1 ) j X j (1 ) <1, Z = Z j= j=1 j=1 X 1 ) 1 ( X 1 1 (1 ) X More weght on most recent data 1 Assume x t are ndependent random varables, wth E(x t )=, Var(x t )= 2 ISyE 512 Instructor: Kabo Lu 21
22 ISyE 512 Instructor: Kabo Lu 22
23 How to onstruct a EWMA hart? Assume x t are ndependent random varables, wth E(x Var (Z t ) = 2 n 2 ( 1 (1 ) 2t) t )=, Var(x t )= 2 t As t becomes large: Var (Z t ) = 2 n 2 Note: for =1 we have Shewhart hart. In general, 2t UL Zt = + L [1 (1 ) ] (2 )n L= 2t LL Zt = L [1 (1 ) ] (2 )n Steady-state control lmts UL L LL L (2 ) n (2 ) n Note : Ths s the general equatons for ratonal subgroups (sample) of observatons (n>1). For ndvdual samples, n=1. ISyE 512 Instructor: Kabo Lu 23

24 ISyE 512 Instructor: Kabo Lu 24
25 ISyE 512 Instructor: Kabo Lu 25
26 ISyE 512 Instructor: Kabo Lu 26
27 Desgn of the EWMA ISyE 512 Instructor: Kabo Lu 27
28 Performance of EWMA ontrol hart ompared to Shewhart chart and USUM chart, EWMA chart s effectve on detecton of small mean shfts lke USUM, less effectve on larger shft detecton than the Shewhart chart, but generally superor to the USUM chart (partcularly f >.1) EWMA s very nsenstve to the normalty assumpton. So, t s an deal control chart for ndvdual observatons. ISyE 512 Instructor: Kabo Lu 28
29 EWMA for Montorng Process Varablty The exponentally weghted mean square error (EWMS) S (x ) (1 ) S 1 x ~ N(, ) For larger and ndependent observaton, t follows the chsquare dstrbuton wth (2- )/ degrees of freedom and onstruct exponentally weghted root mean square (EWRMS) 2 control chart to check data pont n-control or not. E(S ) UL LL, / 2 To be nsenstve to process mean change, t s suggested to replace wth z (a predcton of x +1 ) xˆ 1,1 / 2 z 2 S 2 ISyE 512 Instructor: Kabo Lu 29
30 Example: An EWMA control chart uses =.4. How wde wll the lmts be on the x-bar control chart (n sgma-unts), expressed as a multple of the wdth of the steady-state EWMA lmts (n sgma-unts)? ISyE 512 Instructor: Kabo Lu 3
31 USUM vs. EWMA Smlarty between USUM & EWMA To expedte detecton of a small mean shft n the process Drectly ncorporates ALL the nformaton n the sequence of sample values (past data) Dfference between USUM & EWMA USUM: all the past data are EQUALLY mportant EWMA: exponentally forget the past data, we want to attach more weght to the most recent data (more emphasze on the sequence) ISyE 512 Instructor: Kabo Lu
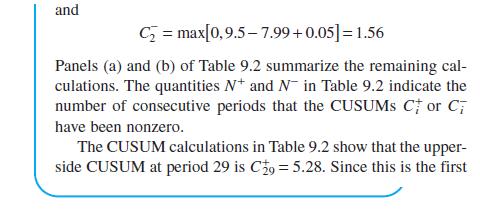
32 Movng Average ontrol harts Sample Statstc x Dfferent from EWMA, use an unweghted movng average M t = ( X t + X t-1 + X t X t-w+1 ) / w Ths wndow of sze w, ncorporates some of the memory of the past data nformaton by droppng the oldest data and addng the newest data w=4 UL= L= LL= k k n n 1 Tme (hour) 2 ISyE 512 Instructor: Kabo Lu 32
33 onstruct Movng Average ontrol harts The movng averatge can be wrtten recursvely as, M t = M t-1 + ( X t X t-w )/w w = wndow sze, n = sample sze 1 t Var (M t ) = w 2 Var( X ) = 2 nw =t-w+1 UL = + 3 Mt nw At the begnnng, f <w LL Mt = - 3 nw 3 n ISyE 512 Instructor: Kabo Lu 33
34 ISyE 512 Instructor: Kabo Lu 34
35 ISyE 512 Instructor: Kabo Lu 35
Alternatives to Shewhart Charts
 Alternatves to Shewhart Charts CUSUM & EWMA S Wongsa Overvew Revstng Shewhart Control Charts Cumulatve Sum (CUSUM) Control Chart Eponentally Weghted Movng Average (EWMA) Control Chart 2 Revstng Shewhart
Int. Statistical Inst.: Proc. 58th World Statistical Congress, 2011, Dublin (Session STS041) p The Max-CUSUM Chart
 p The Max-CUSUM Chart") Int. Statstcal Inst.: Proc. 58th World Statstcal Congress, 1, Dubln (Sesson STS41) p.2996 The Max-CUSUM Chart Smley W. Cheng Department of Statstcs Unversty of Mantoba Wnnpeg, Mantoba Canada, R3T 2N2 smley_cheng@umantoba.ca
Int. Statstcal Inst.: Proc. 58th World Statstcal Congress, 1, Dubln (Sesson STS41) p.2996 The Max-CUSUM Chart Smley W. Cheng Department of Statstcs Unversty of Mantoba Wnnpeg, Mantoba Canada, R3T 2N2 smley_cheng@umantoba.ca
Capability Analysis. Chapter 255. Introduction. Capability Analysis
 Chapter 55 Introducton Ths procedure summarzes the performance of a process based on user-specfed specfcaton lmts. The observed performance as well as the performance relatve to the Normal dstrbuton are
MgtOp 215 Chapter 13 Dr. Ahn
 MgtOp 5 Chapter 3 Dr Ahn Consder two random varables X and Y wth,,, In order to study the relatonshp between the two random varables, we need a numercal measure that descrbes the relatonshp The covarance
Chapter 3 Student Lecture Notes 3-1
 Chapter 3 Student Lecture otes 3-1 Busness Statstcs: A Decson-Makng Approach 6 th Edton Chapter 3 Descrbng Data Usng umercal Measures 005 Prentce-Hall, Inc. Chap 3-1 Chapter Goals After completng ths chapter,
Tests for Two Correlations
 PASS Sample Sze Software Chapter 805 Tests for Two Correlatons Introducton The correlaton coeffcent (or correlaton), ρ, s a popular parameter for descrbng the strength of the assocaton between two varables.
occurrence of a larger storm than our culvert or bridge is barely capable of handling? (what is The main question is: What is the possibility of
 Module 8: Probablty and Statstcal Methods n Water Resources Engneerng Bob Ptt Unversty of Alabama Tuscaloosa, AL Flow data are avalable from numerous USGS operated flow recordng statons. Data s usually
II. Random Variables. Variable Types. Variables Map Outcomes to Numbers
 II. Random Varables Random varables operate n much the same way as the outcomes or events n some arbtrary sample space the dstncton s that random varables are smply outcomes that are represented numercally.
Using Cumulative Count of Conforming CCC-Chart to Study the Expansion of the Cement
 IOSR Journal of Engneerng (IOSRJEN) e-issn: 225-32, p-issn: 2278-879, www.osrjen.org Volume 2, Issue (October 22), PP 5-6 Usng Cumulatve Count of Conformng CCC-Chart to Study the Expanson of the Cement
Which of the following provides the most reasonable approximation to the least squares regression line? (a) y=50+10x (b) Y=50+x (d) Y=1+50x
 y=50+10x (b) Y=50+x (d) Y=1+50x") Whch of the followng provdes the most reasonable approxmaton to the least squares regresson lne? (a) y=50+10x (b) Y=50+x (c) Y=10+50x (d) Y=1+50x (e) Y=10+x In smple lnear regresson the model that s begn
Whch of the followng provdes the most reasonable approxmaton to the least squares regresson lne? (a) y=50+10x (b) Y=50+x (c) Y=10+50x (d) Y=1+50x (e) Y=10+x In smple lnear regresson the model that s begn
UNIVERSITY OF VICTORIA Midterm June 6, 2018 Solutions
 UIVERSITY OF VICTORIA Mdterm June 6, 08 Solutons Econ 45 Summer A0 08 age AME: STUDET UMBER: V00 Course ame & o. Descrptve Statstcs and robablty Economcs 45 Secton(s) A0 CR: 3067 Instructor: Betty Johnson
ECONOMETRICS - FINAL EXAM, 3rd YEAR (GECO & GADE)
") ECONOMETRICS - FINAL EXAM, 3rd YEAR (GECO & GADE) May 17, 2016 15:30 Frst famly name: Name: DNI/ID: Moble: Second famly Name: GECO/GADE: Instructor: E-mal: Queston 1 A B C Blank Queston 2 A B C Blank Queston
ECONOMETRICS - FINAL EXAM, 3rd YEAR (GECO & GADE) May 17, 2016 15:30 Frst famly name: Name: DNI/ID: Moble: Second famly Name: GECO/GADE: Instructor: E-mal: Queston 1 A B C Blank Queston 2 A B C Blank Queston
Survey of Math Test #3 Practice Questions Page 1 of 5
 Test #3 Practce Questons Page 1 of 5 You wll be able to use a calculator, and wll have to use one to answer some questons. Informaton Provded on Test: Smple Interest: Compound Interest: Deprecaton: A =
Calibration Methods: Regression & Correlation. Calibration Methods: Regression & Correlation
 Calbraton Methods: Regresson & Correlaton Calbraton A seres of standards run (n replcate fashon) over a gven concentraton range. Standards Comprsed of analte(s) of nterest n a gven matr composton. Matr
/ Computational Genomics. Normalization
 0-80 /02-70 Computatonal Genomcs Normalzaton Gene Expresson Analyss Model Computatonal nformaton fuson Bologcal regulatory networks Pattern Recognton Data Analyss clusterng, classfcaton normalzaton, mss.
CHAPTER 9 FUNCTIONAL FORMS OF REGRESSION MODELS
 CHAPTER 9 FUNCTIONAL FORMS OF REGRESSION MODELS QUESTIONS 9.1. (a) In a log-log model the dependent and all explanatory varables are n the logarthmc form. (b) In the log-ln model the dependent varable
Measures of Spread IQR and Deviation. For exam X, calculate the mean, median and mode. For exam Y, calculate the mean, median and mode.
 Part 4 Measures of Spread IQR and Devaton In Part we learned how the three measures of center offer dfferent ways of provdng us wth a sngle representatve value for a data set. However, consder the followng
Analysis of Variance and Design of Experiments-II
 Analyss of Varance and Desgn of Experments-II MODULE VI LECTURE - 4 SPLIT-PLOT AND STRIP-PLOT DESIGNS Dr. Shalabh Department of Mathematcs & Statstcs Indan Insttute of Technology Kanpur An example to motvate
Physics 4A. Error Analysis or Experimental Uncertainty. Error
 Physcs 4A Error Analyss or Expermental Uncertanty Slde Slde 2 Slde 3 Slde 4 Slde 5 Slde 6 Slde 7 Slde 8 Slde 9 Slde 0 Slde Slde 2 Slde 3 Slde 4 Slde 5 Slde 6 Slde 7 Slde 8 Slde 9 Slde 20 Slde 2 Error n
Abstract The R chart is often used to monitor for changes in the process variability. However, the standard
 An Alternatve to the Stanar Chart chael B.C. Khoo an H.C. Lo School of athematcal Scences, Unverst Sans alaysa, 800 nen, Penang, alaysa Emal: mkbc@usm.my & hclo@cs.usm.my Abstract The chart s often use
Understanding Annuities. Some Algebraic Terminology.
 Understandng Annutes Ma 162 Sprng 2010 Ma 162 Sprng 2010 March 22, 2010 Some Algebrac Termnology We recall some terms and calculatons from elementary algebra A fnte sequence of numbers s a functon of natural
Evaluating Performance
 5 Chapter Evaluatng Performance In Ths Chapter Dollar-Weghted Rate of Return Tme-Weghted Rate of Return Income Rate of Return Prncpal Rate of Return Daly Returns MPT Statstcs 5- Measurng Rates of Return
Survey of Math: Chapter 22: Consumer Finance Borrowing Page 1
 Survey of Math: Chapter 22: Consumer Fnance Borrowng Page 1 APR and EAR Borrowng s savng looked at from a dfferent perspectve. The dea of smple nterest and compound nterest stll apply. A new term s the
Economic Design of Short-Run CSP-1 Plan Under Linear Inspection Cost
 Tamkang Journal of Scence and Engneerng, Vol. 9, No 1, pp. 19 23 (2006) 19 Economc Desgn of Short-Run CSP-1 Plan Under Lnear Inspecton Cost Chung-Ho Chen 1 * and Chao-Yu Chou 2 1 Department of Industral
Simultaneous Monitoring of Multivariate-Attribute Process Mean and Variability Using Artificial Neural Networks
 Journal of Qualty Engneerng and Producton Optmzaton Vol., No., PP. 43-54, 05 Smultaneous Montorng of Multvarate-Attrbute Process Mean and Varablty Usng Artfcal Neural Networks Mohammad Reza Malek and Amrhossen
Chapter 5 Student Lecture Notes 5-1
 Chapter 5 Student Lecture Notes 5-1 Basc Busness Statstcs (9 th Edton) Chapter 5 Some Important Dscrete Probablty Dstrbutons 004 Prentce-Hall, Inc. Chap 5-1 Chapter Topcs The Probablty Dstrbuton of a Dscrete
Likelihood Fits. Craig Blocker Brandeis August 23, 2004
 Lkelhood Fts Crag Blocker Brandes August 23, 2004 Outlne I. What s the queston? II. Lkelhood Bascs III. Mathematcal Propertes IV. Uncertantes on Parameters V. Mscellaneous VI. Goodness of Ft VII. Comparson
Linear Combinations of Random Variables and Sampling (100 points)
") Economcs 30330: Statstcs for Economcs Problem Set 6 Unversty of Notre Dame Instructor: Julo Garín Sprng 2012 Lnear Combnatons of Random Varables and Samplng 100 ponts 1. Four-part problem. Go get some
Economcs 30330: Statstcs for Economcs Problem Set 6 Unversty of Notre Dame Instructor: Julo Garín Sprng 2012 Lnear Combnatons of Random Varables and Samplng 100 ponts 1. Four-part problem. Go get some
Chapter 10 Making Choices: The Method, MARR, and Multiple Attributes
 Chapter 0 Makng Choces: The Method, MARR, and Multple Attrbutes INEN 303 Sergy Butenko Industral & Systems Engneerng Texas A&M Unversty Comparng Mutually Exclusve Alternatves by Dfferent Evaluaton Methods
Notes on experimental uncertainties and their propagation
 Ed Eyler 003 otes on epermental uncertantes and ther propagaton These notes are not ntended as a complete set of lecture notes, but nstead as an enumeraton of some of the key statstcal deas needed to obtan
Sampling Distributions of OLS Estimators of β 0 and β 1. Monte Carlo Simulations
 Addendum to NOTE 4 Samplng Dstrbutons of OLS Estmators of β and β Monte Carlo Smulatons The True Model: s gven by the populaton regresson equaton (PRE) Y = β + β X + u = 7. +.9X + u () where β = 7. and
TCOM501 Networking: Theory & Fundamentals Final Examination Professor Yannis A. Korilis April 26, 2002
 TO5 Networng: Theory & undamentals nal xamnaton Professor Yanns. orls prl, Problem [ ponts]: onsder a rng networ wth nodes,,,. In ths networ, a customer that completes servce at node exts the networ wth
Tests for Two Ordered Categorical Variables
 Chapter 253 Tests for Two Ordered Categorcal Varables Introducton Ths module computes power and sample sze for tests of ordered categorcal data such as Lkert scale data. Assumng proportonal odds, such
4. Greek Letters, Value-at-Risk
 4 Greek Letters, Value-at-Rsk 4 Value-at-Rsk (Hull s, Chapter 8) Math443 W08, HM Zhu Outlne (Hull, Chap 8) What s Value at Rsk (VaR)? Hstorcal smulatons Monte Carlo smulatons Model based approach Varance-covarance
Copyright 2017 by Taylor Enterprises, Inc., All Rights Reserved. Dr. Wayne A. Taylor
 Taylor Enterprses, Inc. ormalzed Indvduals (I ) Chart Copyrght 07 by Taylor Enterprses, Inc., All Rghts Reserved. ormalzed Indvduals (I) Control Chart Dr. Wayne A. Taylor Abstract: The only commonly used
OCR Statistics 1 Working with data. Section 2: Measures of location
 OCR Statstcs 1 Workng wth data Secton 2: Measures of locaton Notes and Examples These notes have sub-sectons on: The medan Estmatng the medan from grouped data The mean Estmatng the mean from grouped data
Available online: 20 Dec 2011
 Ths artcle was downloaded by: [UVA Unverstetsbblotheek SZ] On: 16 May 212, At: 6:32 Publsher: Taylor & Francs Informa Ltd Regstered n England and Wales Regstered Number: 172954 Regstered offce: Mortmer
CHAPTER - IV STANDARDIZED CUSUM MEDIAN CONTROL CHART
 A Study o Process Varablty usg CUSUM ad Fuzzy Cotrol Charts Ph.D Thess CHAPTER - IV STANDARDIZED CUSUM MEDIAN CONTROL CHART. Itroducto: I motorg e process mea, e Mea ( X ) cotrol charts, ad cumulatve sum
Random Variables. b 2.
 Random Varables Generally the object of an nvestgators nterest s not necessarly the acton n the sample space but rather some functon of t. Techncally a real valued functon or mappng whose doman s the sample
Chapter 3 Descriptive Statistics: Numerical Measures Part B
 Sldes Prepared by JOHN S. LOUCKS St. Edward s Unversty Slde 1 Chapter 3 Descrptve Statstcs: Numercal Measures Part B Measures of Dstrbuton Shape, Relatve Locaton, and Detectng Outlers Eploratory Data Analyss
Process Control with Highly Left Censored Data Javier Orlando Neira Rueda a, MSC. a
 Process Control wth Hghly Left Censored Data Javer Orlando Nera Rueda a, MSC. a Unversdad UNIMINUTO. Departamento de Ingenera Dagonal 81C Nº 72 B 81, 11001 Bogotá, Colomba javer.nera@unmnuto.edu Andrés
3: Central Limit Theorem, Systematic Errors
 3: Central Lmt Theorem, Systematc Errors 1 Errors 1.1 Central Lmt Theorem Ths theorem s of prme mportance when measurng physcal quanttes because usually the mperfectons n the measurements are due to several
15-451/651: Design & Analysis of Algorithms January 22, 2019 Lecture #3: Amortized Analysis last changed: January 18, 2019
 5-45/65: Desgn & Analyss of Algorthms January, 09 Lecture #3: Amortzed Analyss last changed: January 8, 09 Introducton In ths lecture we dscuss a useful form of analyss, called amortzed analyss, for problems
arxiv: v1 [q-fin.pm] 13 Feb 2018
![arxiv: v1 [q-fin.pm] 13 Feb 2018](/thumbs/95/124102683.jpg "arxiv: v1 [q-fin.pm] 13 Feb 2018") WHAT IS THE SHARPE RATIO, AND HOW CAN EVERYONE GET IT WRONG? arxv:1802.04413v1 [q-fn.pm] 13 Feb 2018 IGOR RIVIN Abstract. The Sharpe rato s the most wdely used rsk metrc n the quanttatve fnance communty
WHAT IS THE SHARPE RATIO, AND HOW CAN EVERYONE GET IT WRONG? arxv:1802.04413v1 [q-fn.pm] 13 Feb 2018 IGOR RIVIN Abstract. The Sharpe rato s the most wdely used rsk metrc n the quanttatve fnance communty
Quiz on Deterministic part of course October 22, 2002
 Engneerng ystems Analyss for Desgn Quz on Determnstc part of course October 22, 2002 Ths s a closed book exercse. You may use calculators Grade Tables There are 90 ponts possble for the regular test, or
Lecture Note 2 Time Value of Money
 Seg250 Management Prncples for Engneerng Managers Lecture ote 2 Tme Value of Money Department of Systems Engneerng and Engneerng Management The Chnese Unversty of Hong Kong Interest: The Cost of Money
iii) pay F P 0,T = S 0 e δt when stock has dividend yield δ.
 pay F P 0,T = S 0 e δt when stock has dividend yield δ.") Fnal s Wed May 7, 12:50-2:50 You are allowed 15 sheets of notes and a calculator The fnal s cumulatve, so you should know everythng on the frst 4 revews Ths materal not on those revews 184) Suppose S t
Fnal s Wed May 7, 12:50-2:50 You are allowed 15 sheets of notes and a calculator The fnal s cumulatve, so you should know everythng on the frst 4 revews Ths materal not on those revews 184) Suppose S t
Elton, Gruber, Brown and Goetzmann. Modern Portfolio Theory and Investment Analysis, 7th Edition. Solutions to Text Problems: Chapter 4
 Elton, Gruber, Brown and Goetzmann Modern ortfolo Theory and Investment Analyss, 7th Edton Solutons to Text roblems: Chapter 4 Chapter 4: roblem 1 A. Expected return s the sum of each outcome tmes ts assocated
PASS Sample Size Software. :log
 PASS Sample Sze Software Chapter 70 Probt Analyss Introducton Probt and lot analyss may be used for comparatve LD 50 studes for testn the effcacy of drus desned to prevent lethalty. Ths proram module presents
The Institute of Chartered Accountants of Sri Lanka
 The Insttute of Chartered Accountants of Sr Lanka Postgraduate Dploma n Accountng, Busness and Strategy Quanttatve Methods for Busness Studes Handout 0: Presentaton and Analyss of data Tables and Charts
ECE 586GT: Problem Set 2: Problems and Solutions Uniqueness of Nash equilibria, zero sum games, evolutionary dynamics
 Unversty of Illnos Fall 08 ECE 586GT: Problem Set : Problems and Solutons Unqueness of Nash equlbra, zero sum games, evolutonary dynamcs Due: Tuesday, Sept. 5, at begnnng of class Readng: Course notes,
Natural Resources Data Analysis Lecture Notes Brian R. Mitchell. IV. Week 4: A. Goodness of fit testing
 Natural Resources Data Analyss Lecture Notes Bran R. Mtchell IV. Week 4: A. Goodness of ft testng 1. We test model goodness of ft to ensure that the assumptons of the model are met closely enough for the
OPERATIONS RESEARCH. Game Theory
 OPERATIONS RESEARCH Chapter 2 Game Theory Prof. Bbhas C. Gr Department of Mathematcs Jadavpur Unversty Kolkata, Inda Emal: bcgr.umath@gmal.com 1.0 Introducton Game theory was developed for decson makng
Midterm Exam. Use the end of month price data for the S&P 500 index in the table below to answer the following questions.
 Unversty of Washngton Summer 2001 Department of Economcs Erc Zvot Economcs 483 Mdterm Exam Ths s a closed book and closed note exam. However, you are allowed one page of handwrtten notes. Answer all questons
Financial mathematics
 Fnancal mathematcs Jean-Luc Bouchot jean-luc.bouchot@drexel.edu February 19, 2013 Warnng Ths s a work n progress. I can not ensure t to be mstake free at the moment. It s also lackng some nformaton. But
Mode is the value which occurs most frequency. The mode may not exist, and even if it does, it may not be unique.
 1.7.4 Mode Mode s the value whch occurs most frequency. The mode may not exst, and even f t does, t may not be unque. For ungrouped data, we smply count the largest frequency of the gven value. If all
Probability Distributions. Statistics and Quantitative Analysis U4320. Probability Distributions(cont.) Probability
 Probability") Statstcs and Quanttatve Analss U430 Dstrbutons A. Dstrbutons: How do smple probablt tables relate to dstrbutons?. What s the of gettng a head? ( con toss) Prob. Segment 4: Dstrbutons, Unvarate & Bvarate
Statstcs and Quanttatve Analss U430 Dstrbutons A. Dstrbutons: How do smple probablt tables relate to dstrbutons?. What s the of gettng a head? ( con toss) Prob. Segment 4: Dstrbutons, Unvarate & Bvarate
Basket options and implied correlations: a closed form approach
 Basket optons and mpled correlatons: a closed form approach Svetlana Borovkova Free Unversty of Amsterdam CFC conference, London, January 7-8, 007 Basket opton: opton whose underlyng s a basket (.e. a
Scribe: Chris Berlind Date: Feb 1, 2010
 CS/CNS/EE 253: Advanced Topcs n Machne Learnng Topc: Dealng wth Partal Feedback #2 Lecturer: Danel Golovn Scrbe: Chrs Berlnd Date: Feb 1, 2010 8.1 Revew In the prevous lecture we began lookng at algorthms
The Integration of the Israel Labour Force Survey with the National Insurance File
 The Integraton of the Israel Labour Force Survey wth the Natonal Insurance Fle Natale SHLOMO Central Bureau of Statstcs Kanfey Nesharm St. 66, corner of Bach Street, Jerusalem Natales@cbs.gov.l Abstact:
SIMPLE FIXED-POINT ITERATION
 SIMPLE FIXED-POINT ITERATION The fed-pont teraton method s an open root fndng method. The method starts wth the equaton f ( The equaton s then rearranged so that one s one the left hand sde of the equaton
Cracking VAR with kernels
 CUTTIG EDGE. PORTFOLIO RISK AALYSIS Crackng VAR wth kernels Value-at-rsk analyss has become a key measure of portfolo rsk n recent years, but how can we calculate the contrbuton of some portfolo component?
REGULATORY REFORM IN THE JAPANESE ELECTRIC POWER INDUSTRY AN EVENT STUDY ANALYSIS IAEE 2017 Conference, Singapore 20 th June 2017 Koichiro Tezuka,
 REGULATORY REFORM IN THE JAPANESE ELECTRIC POWER INDUSTRY AN EVENT STUDY ANALYSIS IAEE 2017 Conference, Sngapore 20 th June 2017 Kochro Tezuka, Nhon Unversty, Masahro Ish, Sopha Unversty, Satoru Hashmoto,
An Application of Alternative Weighting Matrix Collapsing Approaches for Improving Sample Estimates
 Secton on Survey Research Methods An Applcaton of Alternatve Weghtng Matrx Collapsng Approaches for Improvng Sample Estmates Lnda Tompkns 1, Jay J. Km 2 1 Centers for Dsease Control and Preventon, atonal
Simple Regression Theory II 2010 Samuel L. Baker
 SIMPLE REGRESSIO THEORY II Smple Regresson Theory II 00 Samuel L. Baker Assessng how good the regresson equaton s lkely to be Assgnment A gets nto drawng nferences about how close the regresson lne mght
Facility Location Problem. Learning objectives. Antti Salonen Farzaneh Ahmadzadeh
 Antt Salonen Farzaneh Ahmadzadeh 1 Faclty Locaton Problem The study of faclty locaton problems, also known as locaton analyss, s a branch of operatons research concerned wth the optmal placement of facltes
A REAL OPTIONS DESIGN FOR PRODUCT OUTSOURCING. Mehmet Aktan
 Proceedngs of the 2001 Wnter Smulaton Conference B. A. Peters, J. S. Smth, D. J. Mederos, and M. W. Rohrer, eds. A REAL OPTIONS DESIGN FOR PRODUCT OUTSOURCING Harret Black Nembhard Leyuan Sh Department
CS54701: Information Retrieval
 CS54701: Informaton Retreval Federated Search 22 March 2016 Prof. Chrs Clfton Federated Search Outlne Introducton to federated search Man research problems Resource Representaton Resource Selecton Results
Elements of Economic Analysis II Lecture VI: Industry Supply
 Elements of Economc Analyss II Lecture VI: Industry Supply Ka Hao Yang 10/12/2017 In the prevous lecture, we analyzed the frm s supply decson usng a set of smple graphcal analyses. In fact, the dscusson
Multifactor Term Structure Models
 1 Multfactor Term Structure Models A. Lmtatons of One-Factor Models 1. Returns on bonds of all maturtes are perfectly correlated. 2. Term structure (and prces of every other dervatves) are unquely determned
Using Conditional Heteroskedastic
 ITRON S FORECASTING BROWN BAG SEMINAR Usng Condtonal Heteroskedastc Varance Models n Load Research Sample Desgn Dr. J. Stuart McMenamn March 6, 2012 Please Remember» Phones are Muted: In order to help
Module Contact: Dr P Moffatt, ECO Copyright of the University of East Anglia Version 2
 UNIVERSITY OF EAST ANGLIA School of Economcs Man Seres PG Examnaton 2012-13 FINANCIAL ECONOMETRICS ECO-M017 Tme allowed: 2 hours Answer ALL FOUR questons. Queston 1 carres a weght of 25%; Queston 2 carres
Finance 402: Problem Set 1 Solutions
 Fnance 402: Problem Set 1 Solutons Note: Where approprate, the fnal answer for each problem s gven n bold talcs for those not nterested n the dscusson of the soluton. 1. The annual coupon rate s 6%. A
Macroeconomic equilibrium in the short run: the Money market
 Macroeconomc equlbrum n the short run: the Money market 2013 1. The bg pcture Overvew Prevous lecture How can we explan short run fluctuatons n GDP? Key assumpton: stcky prces Equlbrum of the goods market
Interval Estimation for a Linear Function of. Variances of Nonnormal Distributions. that Utilize the Kurtosis
 Appled Mathematcal Scences, Vol. 7, 013, no. 99, 4909-4918 HIKARI Ltd, www.m-hkar.com http://dx.do.org/10.1988/ams.013.37366 Interval Estmaton for a Lnear Functon of Varances of Nonnormal Dstrbutons that
Cyclic Scheduling in a Job shop with Multiple Assembly Firms
 Proceedngs of the 0 Internatonal Conference on Industral Engneerng and Operatons Management Kuala Lumpur, Malaysa, January 4, 0 Cyclc Schedulng n a Job shop wth Multple Assembly Frms Tetsuya Kana and Koch
COS 511: Theoretical Machine Learning. Lecturer: Rob Schapire Lecture #21 Scribe: Lawrence Diao April 23, 2013
 COS 511: Theoretcal Machne Learnng Lecturer: Rob Schapre Lecture #21 Scrbe: Lawrence Dao Aprl 23, 2013 1 On-Lne Log Loss To recap the end of the last lecture, we have the followng on-lne problem wth N
Clearing Notice SIX x-clear Ltd
 Clearng Notce SIX x-clear Ltd 1.0 Overvew Changes to margn and default fund model arrangements SIX x-clear ( x-clear ) s closely montorng the CCP envronment n Europe as well as the needs of ts Members.
Appendix - Normally Distributed Admissible Choices are Optimal
 Appendx - Normally Dstrbuted Admssble Choces are Optmal James N. Bodurtha, Jr. McDonough School of Busness Georgetown Unversty and Q Shen Stafford Partners Aprl 994 latest revson September 00 Abstract
Numerical Analysis ECIV 3306 Chapter 6
 The Islamc Unversty o Gaza Faculty o Engneerng Cvl Engneerng Department Numercal Analyss ECIV 3306 Chapter 6 Open Methods & System o Non-lnear Eqs Assocate Pro. Mazen Abualtaye Cvl Engneerng Department,
A Comparison of Statistical Methods in Interrupted Time Series Analysis to Estimate an Intervention Effect
 Transport and Road Safety (TARS) Research Joanna Wang A Comparson of Statstcal Methods n Interrupted Tme Seres Analyss to Estmate an Interventon Effect Research Fellow at Transport & Road Safety (TARS)
A Bootstrap Confidence Limit for Process Capability Indices
 A ootstrap Confdence Lmt for Process Capablty Indces YANG Janfeng School of usness, Zhengzhou Unversty, P.R.Chna, 450001 Abstract The process capablty ndces are wdely used by qualty professonals as an
Problem Set 6 Finance 1,
 Carnege Mellon Unversty Graduate School of Industral Admnstraton Chrs Telmer Wnter 2006 Problem Set 6 Fnance, 47-720. (representatve agent constructon) Consder the followng two-perod, two-agent economy.
Random Variables. 8.1 What is a Random Variable? Announcements: Chapter 8
 Announcements: Quz starts after class today, ends Monday Last chance to take probablty survey ends Sunday mornng. Next few lectures: Today, Sectons 8.1 to 8. Monday, Secton 7.7 and extra materal Wed, Secton
ME 310 Numerical Methods. Differentiation
 M 0 Numercal Metods fferentaton Tese presentatons are prepared by r. Cuneyt Sert Mecancal ngneerng epartment Mddle ast Tecncal Unversty Ankara, Turkey csert@metu.edu.tr Tey can not be used wtout te permsson
3/3/2014. CDS M Phil Econometrics. Vijayamohanan Pillai N. Truncated standard normal distribution for a = 0.5, 0, and 0.5. CDS Mphil Econometrics
 Lmted Dependent Varable Models: Tobt an Plla N 1 CDS Mphl Econometrcs Introducton Lmted Dependent Varable Models: Truncaton and Censorng Maddala, G. 1983. Lmted Dependent and Qualtatve Varables n Econometrcs.
Fall 2017 Social Sciences 7418 University of Wisconsin-Madison Problem Set 3 Answers
 ublc Affars 854 enze D. Chnn Fall 07 Socal Scences 748 Unversty of Wsconsn-adson roblem Set 3 Answers Due n Lecture on Wednesday, November st. " Box n" your answers to the algebrac questons.. Fscal polcy
Macroeconomic Theory and Policy
 ECO 209 Macroeconomc Theory and Polcy Lecture 7: The Open Economy wth Fxed Exchange Rates Gustavo Indart Slde 1 Open Economy under Fxed Exchange Rates Let s consder an open economy wth no captal moblty
Stochastic ALM models - General Methodology
 Stochastc ALM models - General Methodology Stochastc ALM models are generally mplemented wthn separate modules: A stochastc scenaros generator (ESG) A cash-flow projecton tool (or ALM projecton) For projectng
Midterm Version 2 Solutions
 Econ 45 Fall 07 age UIVERSITY OF VICTORIA Mdterm Verson Solutons October 07 AME: STUDET UMBER: V00 Course ame & o. Descrve Statstcs and robably Secton(s) Economcs 45 A0 CR: 098 Instructor: Betty Johnson
MATH 373 Quiz 3 Fall 2017 October 12, 2017
 MATH 373 Quz 3 Fall 2017 October, 2017 1. Alex wants to nvest for hs retrement. Today s hs 22 nd brthday. He wll make a payment of 10,000 on each brthday begnnng wth hs 30 th brthday. Hs last payment wll
IND E 250 Final Exam Solutions June 8, Section A. Multiple choice and simple computation. [5 points each] (Version A)
![IND E 250 Final Exam Solutions June 8, Section A. Multiple choice and simple computation. [5 points each] (Version A)](/thumbs/85/92440984.jpg "IND E 250 Final Exam Solutions June 8, Section A. Multiple choice and simple computation. [5 points each] (Version A)") IND E 20 Fnal Exam Solutons June 8, 2006 Secton A. Multple choce and smple computaton. [ ponts each] (Verson A) (-) Four ndependent projects, each wth rsk free cash flows, have the followng B/C ratos:
IND E 20 Fnal Exam Solutons June 8, 2006 Secton A. Multple choce and smple computaton. [ ponts each] (Verson A) (-) Four ndependent projects, each wth rsk free cash flows, have the followng B/C ratos:
Empirical Evidence on Spatial Contagion Between Financial Markets
 Fnance etters, 5, 3 (1, 77-86 Emprcal Evdence on Spatal Contagon Between Fnancal arkets Brendan O. Bradley a and urad S. Taqqu b, a Acadan Asset anagement Inc., USA b Boston Unversty, USA Abstract We say
PhysicsAndMathsTutor.com
 PhscsAndMathsTutor.com phscsandmathstutor.com June 2005 6. A scentst found that the tme taken, M mnutes, to carr out an eperment can be modelled b a normal random varable wth mean 155 mnutes and standard
It is important for a financial institution to monitor the volatilities of the market
 CHAPTER 10 Volatlty It s mportant for a fnancal nsttuton to montor the volatltes of the market varables (nterest rates, exchange rates, equty prces, commodty prces, etc.) on whch the value of ts portfolo
Morningstar After-Tax Return Methodology
 Mornngstar After-Tax Return Methodology Mornngstar Research Report 24 October 2003 2003 Mornngstar, Inc. All rghts reserved. The nformaton n ths document s the property of Mornngstar, Inc. Reproducton
CS 286r: Matching and Market Design Lecture 2 Combinatorial Markets, Walrasian Equilibrium, Tâtonnement
 CS 286r: Matchng and Market Desgn Lecture 2 Combnatoral Markets, Walrasan Equlbrum, Tâtonnement Matchng and Money Recall: Last tme we descrbed the Hungaran Method for computng a maxmumweght bpartte matchng.
The Effects of Industrial Structure Change on Economic Growth in China Based on LMDI Decomposition Approach
 216 Internatonal Conference on Mathematcal, Computatonal and Statstcal Scences and Engneerng (MCSSE 216) ISBN: 978-1-6595-96- he Effects of Industral Structure Change on Economc Growth n Chna Based on
EDC Introduction
 .0 Introducton EDC3 In the last set of notes (EDC), we saw how to use penalty factors n solvng the EDC problem wth losses. In ths set of notes, we want to address two closely related ssues. What are, exactly,
The Mack-Method and Analysis of Variability. Erasmus Gerigk
 The Mac-Method and Analyss of Varablty Erasmus Gerg ontents/outlne Introducton Revew of two reservng recpes: Incremental Loss-Rato Method han-ladder Method Mac s model assumptons and estmatng varablty