WEEKLY REPORT NIFTY- 50 WEEKLY TRADING RANGE WEEKLY CLOSE WEEKLY LOW
|
|
|
- Merryl O’Connor’
- 6 years ago
- Views:
Transcription

1 (+91) e- : lokesh.sethia25@gmail.com Date:- December 31, 2017 WEEKLY REPORT NIFTY- 50 WEEKLY OPEN WEEKLY HIGH WEEKLY LOW WEEKLY CLOSE WEEKLY GAIN/LOSS WEEKLY TRADING RANGE LAST WEEK OF THE MONTH NIFTY TRADE IN A NARROW RANGE. LAST WEEK NIFTY CREAT DOJI PATTERN. MEANING A SMALL TRADING RANGE WITH AN OPENING AND CLOSING PRICE THAT ARE VIRTUALLY EQUAL. Nifty close with positive. FOR NEXT WEEK NIFTY TRADING RANGE WILL BE EITHER SIDE BREAKOUT NIFTY CAN MOVES 100 POINTS.

2 STOCK TO BUY FOR NEXT WEEK JSW ENERGY CMP ACTION BUY TARGETS 100 STOPLOSS 88.5 JSW ENERGY BREAKOUT AT 88 LEVEL LAST WEEK. LAST FEW WEEK VOLUE IS ALSO INCREASE. RSI AND MACD ARE IN CONFORT ZONE. SO BUY THIS SHARE FOR EVERY DIPS AND HOLD FOR FIRST TARGET 100 AND SECOND TARGET 110. DURATION 1 WEEK


3 MARKET LAST WEEK ADVANCE DECLINE RATIO FII DII ACTIVITY


4 NIFTY 50 OPTION DATA NIFTY TOP 10 GAINER


5 NIFTY TOP 10 LOSERS 52 WEEK HIGH

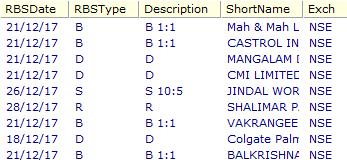
6 52 WEEK LOW CORPORATE ANNOUNCEMENTS


7 Reach US DISCLAIMER This is solely for information of clients of LOKESHSETHIA.COM and does not construe to be an investment advice. It is also not intended as an offer or solicitation for the purchase and sale of any financial instruments. Any action taken by you on the basis of the information contained herein is your responsibility alone and LOKESH SETHIA its subsidiaries or its employees or associates will not be liable in any manner for the consequences of such action taken by you. We have exercised due diligence in checking the correctness and authenticity of the information contained in this recommendation, but LOKESHSETHIA.COM or any of its subsidiaries or associates or employees shall not be in any way responsible for any loss or damage that may arise to any person from any inadvertent error in the information contained in this recommendation or any action taken on basis of this information. Technical analysis studies market psychology, price patterns and volume levels. It is used to forecast future price and market movements. Technical analysis is complementary to fundamental analysis and news sources. The recommendations issued herewith might be contrary to recommendations issued by LOKESHSETHIA.COM in the company research undertaken as the recommendations stated in this report is derived purely from technical analysis. LOKESHSETHIA.COM has based this document on information obtained from sources it believes to be reliable but which it has not independently verified; LOKESHSETHIA.COM makes no guarantee, representation or warranty and accepts no responsibility or liability as to its accuracy or completeness. The opinions contained within the report are based upon publicly available information at the time of publication and are subject to change without notice. The information and any disclosures provided herein are in summary form and have been prepared for informational purposes. The recommendations and suggested price levels are intended purely for trading purposes. The recommendations are valid for the day of the report however trading trends and volumes might vary substantially on an intraday basis and the recommendations may be subject to change. The information and any disclosures provided herein may be considered confidential. Any use, distribution, modification, copying, forwarding or disclosure by any person is strictly prohibited. The information and any disclosures provided herein do not constitute a solicitation or offer to purchase or sell any security or other financial product or instrument. The current performance may be unaudited. Past performance does not guarantee future returns. There can be no assurance that investments will achieve any targeted rates of return, and there is no guarantee against the loss of your entire investment. POTENTIAL CONFLICT OF INTEREST DISCLOSURE (as on date of report) Disclosure of interest statement Analyst interest of the stock /Instrument(s): - No. Firm interest of the stock / Instrument (s): - No.
You get an optimistic feeling when you see our research analytics.
 You get an optimistic feeling when you see our research analytics. Comfort Securities Limited Evening Round Up Disclosures and Disclaimer : This report must be read with the disclosures in the Disclosure
You get an optimistic feeling when you see our research analytics.
 You get an optimistic feeling when you see our research analytics. Comfort Securities Limited Evening Round Up Disclosures and Disclaimer : This report must be read with the disclosures in the Disclosure
You get an optimistic feeling when you see our research analytics.
 You get an optimistic feeling when you see our research analytics. Comfort Securities Limited Evening Round Up Disclosures and Disclaimer : This report must be read with the disclosures in the Disclosure
Aaj Ka Trend. Bullions. MCX Gold (Dec) Daily Chart CMP: MCX Gold (Dec) Trend: Bullish. Price potential: Reversal: 29100
 Daily Chart CMP: MCX Gold (Dec) Trend: Bullish. Price potential: Reversal: 29100") Bullions MCX Gold (Dec) Daily Chart CMP: 29318 On the 4 hourly chart, MCX Gold has formed morning star candlestick patterns and bounced back from lower levels. Moreover. COMEX Gold has found a support
Bullions MCX Gold (Dec) Daily Chart CMP: 29318 On the 4 hourly chart, MCX Gold has formed morning star candlestick patterns and bounced back from lower levels. Moreover. COMEX Gold has found a support
WEEKLY UPDATE. Monday. 17 th February One step ahead and two steps back. Domestic Markets. Global Markets. Currency Update.
 One step ahead and two steps back. Well, that s what is happening to our markets, we see that there is some progress happening but suddenly some event causes the whole effort futile. Last week we saw that
WEEKLY UPDATE. Domestic Markets. Global Markets. Currency Update. Commodity Update. Monday 10 th February 2014
 GDP revision downwards triggers a selloff, but markets manage to climb back. Domestic Markets Markets ended higher on Friday but on weekly basis closed in red. The revision of GDP growth rate downwards
Equities Call Tracker
 Date Lot Size Calls Scripts Segment Initiated SL TGT Status Date2 Exit % ReturnTotal Profit 1.02.16 4000 Buy Tata Global Cash 127.7 124.9 133 Stopped Out 2.02.16 124.9-2.19-11200 1.02.16 75 Sell NIFTY
WEEKLY UPDATE. Domestic Markets. Global Markets. Currency Update. Commodity Update. Monday 6th January,2014. % Change. Change. Last.
 Dear Readers, WishWeek You AllSummary a Very Happy New Year. The New Year 2014 started on a very dull note due to holiday season. Most of the traders were away and the volumes were very thin. The markets
Trident Ltd. Buy & Add on dips
 Trident Ltd. Buy & Add on dips 33,351.8 38,689.6 37,553.3 36,656.6 46,944.2 18-Apr-17 18-May-17 18-Jun-17 18-Jul-17 18-Aug-17 18-Sep-17 18-Oct-17 18-Nov-17 18-Dec-17 18-Jan-18 18-Feb-18 18-Mar-18 Trident
Will this BUDGET lead markets to New Highs?
 P a g e 1 Will this BUDGET lead markets to New Highs? Budget Special Sectoral Overview (Technical Report) 2017-18 Research Team 1 P a g e NIFTY MIDCAP50 (CMP: 4927) Bullish Daily Chart The Midcap basket
Market Commentary. Weekly Technical Roundup
 Market Commentary Sector Wise Performance Indices Last Traded % Change NIFTY IT 15811.4 1.81 NIFTY BANK 28061.75-0.15 NIFTY REALTY 275.85-0.07 NIFTY INFRA 3289.25 1.14 INDIA VIX 12.5975 1.49 NIFTY ENERGY
WEEKLY UPDATE. Markets retreat after making record highs on disappointing results. Domestic Markets. Global Markets. Currency Update.
 Markets retreat after making record highs on disappointing results. Dear Readers, A very good morning. Markets ended in red on Friday, retreating from fourth consecutive record highs hit in the morning
BULLIONS WEEKLY TECHNICAL LEVELS GOLD(APRIL) MCX WEEKLY CHART
 MCX WEEKLY CHART") BULLIONS WEEKLY TECHNICAL LEVELS GOLD(APRIL) MCX WEEKLY CHART MCX Gold JUNE contract, showed upside movement this week and made a weekly high of 33617 and low of 32600 due to rise in dollar index and global
BULLIONS WEEKLY TECHNICAL LEVELS GOLD(APRIL) MCX WEEKLY CHART MCX Gold JUNE contract, showed upside movement this week and made a weekly high of 33617 and low of 32600 due to rise in dollar index and global
WEEKLY REPORT. 7 th JAN- 11 th JAN
 REPORT 61.34 61.34 Trade House 426 Alok Nagar, Kanadia Main Road Near Bangali Square Indore-452001 (M.P.) India Mobile :+91-9039261444 E-mail: info@tradenivesh.in REPORT INDIAN MARKETS INDIAN SECTORIAL
WEEKLY REPORT. 5 th Nov- 9 th Nov. 5 th NOV 9 th NOV
 REPORT 61.34 61.34 5 th Nov- 9 th Nov Trade House 426 Alok Nagar, Kanadia Main Road Near Bangali Square Indore-452001 (M.P.) India Mobile :+91-9039261444 E-mail: info@tradenivesh.in REPORT INDIAN MARKETS
WEEKLY REPORT. 31 st DEC- 4 th JAN
 REPORT 61.34 61.34 Trade House 426 Alok Nagar, Kanadia Main Road Near Bangali Square Indore-452001 (M.P.) India Mobile :+91-9039261444 E-mail: info@tradenivesh.in REPORT INDIAN MARKETS INDIAN SECTORIAL
MONEY MAKER RESEARCH & INVESTMENT ADVISOR PVT. LTD.
 MONEY MAKER RESEARCH & INVESTMENT ADVISOR PVT. LTD. 11/JUNE/2018 WWW.MONEYMAKERFINANCIAL.COM Weekly Wrap: The market ended the volatile session almost flat as losses in banks shares negated gains in IT
Market Commentary. Weekly Technical Roundup. Dec 3, 2018
 Market Commentary Sector Wise Performance Indices Last Traded % Change 14638.05 5.80 26862.95 3.32 232 2.41 3087-0.26 19.1625 0.01 14323.95 2.47 30126.25 3.02 9275.7-0.29 2915.2-0.16 9270.2 2.29 2549.85
Allahabad Bank (ALLBAN): Down trend line breakout after base formation
: Down trend line breakout after base formation") Stocks on the move Scrip I-Direct Code Action Target Stoploss Upside Graphite India CAREVE Buy in the range of 450.00-458.00 510.00 425.00 12% Time Frame: 3 Months Research Analysts Dharmesh Shah dharmesh.shah@icicisecurities.com
Stocks on the move Scrip I-Direct Code Action Target Stoploss Upside Graphite India CAREVE Buy in the range of 450.00-458.00 510.00 425.00 12% Time Frame: 3 Months Research Analysts Dharmesh Shah dharmesh.shah@icicisecurities.com
WEEKLY REPORT 20 NOV.-2017
 WEEKLY REPORT 20 NOV.-2017 Upcoming Week Nifty Movement: The Nifty opened the week at 10322, made a high of 10343, low of 10094 and closed the week at 10283. Thus the Nifty closed the week with a loss
18-Sep Market Outlook: CNX NIFTY TECHNICAL & DERIVATIVES REPORT
 TECHNICAL & DERIVATIVES REPORT Market Outlook: 18-Sep-2017 CNX NIFTY Nifty is expected to open in a slightly up tracking the gains in asian market. Traders are advised to buy nifty in the range of 10065
WEEKLY REPORT. 14 th JAN- 18 th JAN
 REPORT 61.34 61.34 Trade House 426 Alok Nagar, Kanadia Main Road Near Bangali Square Indore-452001 (M.P.) India Mobile :+91-9039261444 E-mail: info@tradenivesh.in REPORT INDIAN MARKETS INDIAN SECTORIAL
Arbitrage Opportunity in Wipro buyback
 July 21, 2017 Arbitrage Opportunity in Wipro buyback Research Analyst Amit Gupta Raj Deepak Singh amit.gup@icicisecurities.com rajdeepak.singh@icicisecurities.com Arbitrage opportunity in Wipro buy back
Technical & Derivatives Report
 Sensex (27035) / Nifty (8349) Exhibit 1: Nifty Daily Chart On Friday, a gap down opening was followed by a strong selling pressure in the second half, which led to a breakdown on intraday charts below
Market Commentary. Weekly Technical Roundup. Oct 8, 2018
 Market Commentary Sector Wise Performance Indices Last Traded % Change NIFTY IT 15591.65-2.99 NIFTY BANK 24443.45-10.01 NIFTY REALTY 208.8-21.55 NIFTY INFRA 2845.4-12.30 INDIA VIX 19.7325 42.55 NIFTY ENERGY
NEWSLETTER SWING TRADING. 18 Dec Intelligent Analysis to point your decisions in the right direction
 NEWSLETTER 18 Dec 2017 Intelligent Analysis to point your decisions in the right direction SWING TRADING Newsletter contains index, stocks and sector recommendations along with market outlook. It also
Technical & Derivatives Report
 Sensex (26150) / Nifty (8074) Exhibit 1: Nifty Daily Chart The Nifty opened with marginal upside gap on Friday and traded in a narrow range in first half of the session. However, we witnessed some positive
KLY EQUIT REPORT. 7
 WEEK KLY EQUIT TY REPORT th May, 2018 7 th INDIAN MARKET AS ON FRIDAY 04/05/2018 Index Current Value Prev. Week Closing % Change Nifty 50 10618.25 10695.30-0.72% Sensex 34915.38 34981.70-0.18% WORLD INDICES
BULLIONS WEEKLY TECHNICAL LEVELS GOLD(APRIL) MCX WEEKLY CHART
 MCX WEEKLY CHART") BULLIONS WEEKLY TECHNICAL LEVELS GOLD(APRIL) MCX WEEKLY CHART MCX Gold April contract, showed upside movement this week and made a weekly high of 33410 and weekly low of 32805. This week gold closed above
BULLIONS WEEKLY TECHNICAL LEVELS GOLD(APRIL) MCX WEEKLY CHART MCX Gold April contract, showed upside movement this week and made a weekly high of 33410 and weekly low of 32805. This week gold closed above
Technical & Derivatives Report
 Sensex (36636) / Nifty (11053) Exhibit 1: Nifty Daily Chart Tuesday s strong move was followed by a gap up opening as indicated by the SGX Nifty. Subsequently, index consolidated for the remaining part
NEWSLETTER SWING TRADING. 17 Jan Intelligent Analysis to point your decisions in the right direction
 NEWSLETTER 17 Jan 2018 Intelligent Analysis to point your decisions in the right direction SWING TRADING Newsletter contains index, stocks and sector recommendations along with market outlook. It also
Market Commentary. Daily Technical Roundup
 Market Commentary FII & DII Activity FII (Cash) in Cr -226.19 DII (Cash) in Cr +1206.16 FII (Index Futures) in Cr +72.71 FII (Index Options) in Cr +1097.25 FII (Stock Futures) in Cr -167.47 FII (Stock
Hikal Limited. CMP: Rs253 Target1:Rs295 Target2:Rs325 28%
 Hikal Limited Hikal Ltd representing a classic Ascending triangle breakout. Stock is in uptrend from early April of 2016. stock remained in the range of 232-200 for almost a year. Price breakout is supported
WEEKLY UPDATE. Markets close flat for second consecutive week, are they making an intermediate top? Domestic Markets. Global Markets.
 Markets close flat for second consecutive week, are they making an intermediate top? Dear Readers, A very good morning. Last week was quite eventful in the sense that the markets made fresh new highs but
Market Commentary. Weekly Technical Roundup. February 4, 2019
 Market Commentary Sector Wise Performance Indices Last Traded % Change NIFTY IT 15724.3 4.55 NIFTY BANK 27085.95-0.11 NIFTY REALTY 231.4 0.59 NIFTY INFRA 2997.95 0.98 INDIA VIX 15.72-11.14 NIFTY ENERGY
Research Analysts. December 3, 2015
 Stocks on the move Scrip I-Direct Code Action Target Stoploss Omax Auto OMAAUT Buy in the range of 76.00-81.00 97.00 68.00 Indian Hotel INDHOT Buy in the range of 102.00-108.00 133.00 95.00 Time Frame:
Stocks on the move. Scrip I-Direct Code Action Target Stoploss Upside Bharti Airtel BHAAIR Buy in the range of
 Stocks on the move Scrip I-Direct Code Action Target Stoploss Upside Bharti Airtel BHAAIR Buy in the range of 420.00-430.00 485.00 392.00 14% Time Frame: 3 Months Research Analysts Dharmesh Shah dharmesh.shah@icicisecurities.com
Stock Trader: HDFC Bank
 Stock Trader: HDFC Bank Amit Gupta Raj Deepak Singh Azeem Ahmad amit.gup@icicisecurities.com rajdeepak.singh@icicisecurities.com azeem.ahmad@icicisecurities.com November 5, 2014 Important Data Points:
Technical & Derivatives Report
 Technical & Derivatives Report Exhibit 1: Nifty Daily Chart Sensex (31847) / Nifty (9989) Despite SGX Nifty showing not so great opening for our markets, we witnessed Nifty starting the week slightly in
Market Commentary. Daily Technical Roundup
 Market Commentary FII & DII Activity FII (Cash) in Cr -2760.63 DII (Cash) in Cr +1823.59 FII (Index Futures) in Cr -3156.90 FII (Index Options) in Cr +8509.33 FII (Stock Futures) in Cr -365.03 FII (Stock
Market Commentary. Daily Technical Roundup
 Market Commentary FII & DII Activity FII (Cash) in Cr -386.44 +87.96 DII (Cash) in Cr FII (Index Futures) in Cr FII (Index Options) in Cr FII (Stock Futures) in Cr FII (Stock Options) in Cr +300.26 +2439.70-552.07
Technical & Derivatives Report
 Sensex (35645) / Nifty (10770) Exhibit 1: Nifty Daily Chart Despite e SGX Nifty indicating a dull start, our markets opened on a positive note. This was followed by a good sustained up move in a gradual
Stock Trader - Power Grid
 Stock Trader - Power Grid Research Analysts: Amit Gupta Raj Deepak Singh Azeem Ahmad amit.gup@icicisecurities.com rajdeepak.singh@icicisecurities.com azeem.ahmad@icicisecurities.com ahmad@icicisec com
Gladiator Stocks: Reliance Industries
 Gladiator Stocks: Reliance Industries Scrip I-Direct Code Action Target Stoploss Upside Reliance Industries RELIND Buy in the range of 925.00-945.00 1070.00 865.00 14% Time Frame: 6 Months Research Analysts
Cummins Deal Team India (CUMIND): At Your Faster Service retracement signals maturity of consolidation
: At Your Faster Service retracement signals maturity of consolidation") Stocks on the move Scrip I-Direct Code Action Target Stoploss Cummins India CUMIND Buy in the range of 890.00-905.00 1150.00 825.00 Siemens SIEMEN Buy in the range of 1330.00-1345.00 1490.00 1275.00 Time
Stocks on the move Scrip I-Direct Code Action Target Stoploss Cummins India CUMIND Buy in the range of 890.00-905.00 1150.00 825.00 Siemens SIEMEN Buy in the range of 1330.00-1345.00 1490.00 1275.00 Time
Technical & Derivatives Report
 Sensex (35200) / Nifty (10600) Exhibit 1: Nifty Daily Chart Yesterday morning, the massacre in the global equities hinted for a gap down opening in our markets, however, the positive aspect of falling
DEALMONEY MARKET BUZZ
 DEALMONEY MARKET BUZZ 20 th August 25 th August Index Equity Commodity Currency Equities Commodities Wealth Mutual Funds Insurance 1 Weekly Performance: Equity S.No Equity View Entry Target SL Outcome
Stock Trader - Focus on Budget: Power Grid
 Stock Trader - Focus on Budget: Power Grid Amit Gupta Raj Deepak Singh Azeem Ahmad amit.gup@icicisecurities.com rajdeepak.singh@icicisecurities.com azeem.ahmad@icicisecurities.com December 23, 2014 Important
Research Analysts
 Stocks on the move Scrip IDi I-Direct tcode Action Target Stoploss Sterlite Technologies STETEC Buy in the range of 100.00-102.00 118.00 91.50 Time Frame: 3 Months Research Analysts Dharmesh Shah Pabitro
Stock Trader - Canara Bank: Focus on Budget
 Stock Trader - Canara Bank: Focus on Budget Amit Gupta Raj Deepak Singh Azeem Ahmad amit.gup@icicisecurities.com rajdeepak.singh@icicisecurities.com azeem.ahmad@icicisecurities.com January 20, 2015 Important
Technical & Derivatives Report
 Sensex (35163) / Nifty (10585) Exhibit 1: Nifty Daily Chart Yesterday, we had a positive opening with marginal upside gap after Monday s good tail end buying. Subsequently, we saw the index adding further
Gladiator Stocks: Rallis India
 Gladiator Stocks: Rallis India Scrip I-Direct Code Action Target Stoploss Upside Rallis India RALIND Buy in the range of 272.00-278.00 330.00 246.00 20% Time Frame: 6 Months Research Analysts Dharmesh
WEEKLY REPORT. 24th DEC- 28thDEC. 24th DEC- 28thDEC
 REPORT 61.34 61.34 Trade House 426 Alok Nagar, Kanadia Main Road Near Bangali Square Indore-452001 (M.P.) India Mobile :+91-9039261444 E-mail: info@tradenivesh.in REPORT INDIAN MARKETS INDIAN SECTORIAL
Nifty Auto (CMP: 7464)
") Nifty Auto (CMP: 7464) Positive Bullish Harami pattern at a strong support zone (Lower end of the Channel as well as the 50% Fibonacci retracement level) Technical Overview: The overall Automobile space
Nifty Auto (CMP: 7464) Positive Bullish Harami pattern at a strong support zone (Lower end of the Channel as well as the 50% Fibonacci retracement level) Technical Overview: The overall Automobile space
DEALMONEY MARKET BUZZ
 DEALMONEY MARKET BUZZ 15 th Oct 20 th Oct Index Equity Commodity Currency Equities Commodities Wealth Mutual Funds Insurance 1 Weekly Performance: Equity S.No Equity View Entry Target SL Outcome 1 Godrej
Technical & Derivatives Report
 Sensex (35575) / Nifty (10750) Exhibit 1: Nifty Daily Chart Wednesday s decent up move was followed by a subdued start for our markets. During the day, index didn t go anywhere as it just vacillated precisely
Technical & Derivatives Report
 Sensex (38723) / Nifty (11692) Exhibit 1: Nifty Daily Chart Yesterday, we had a flat start and the index consolidated for the major part of the day. The real action was clearly seen in some of the individual
Research Analysts
 Stocks on the move Scrip IDi I-Direct tcode Action Target Stoploss Union Bank of India UNIBAN Buy in the range of 127.00-130.00 147.00 118.00 Time Frame: 3 Months Research Analysts Dharmesh Shah Nitin
Research Analysts. March 18, Larsen & Tourbo LARTOU Buy in the range of
 Stocks on the move Scrip IDi I-Direct Code Action Target Stoploss Larsen & Tourbo LARTOU Buy in the range of 1180-1203 1345.00 1120.00 Time Frame: 3 Months Research Analysts Dharmesh Shah dharmesh.shah@icicisecurities.com
MOSt Technical Outlook- Monthly
 INDEX S&P CNX Nifty : 5,720 Sensex : 18,918 NIFTY LEVELS Support : 5550, 5485 Resistance : 5850, 5930 RISING CORRELATION ERODES DIVERSIFICATION Nifty for the month of February closed with a loss of 342
Saudi Market (TADAWUL)... 2 Boursa Kuwait... 3 Abu Dhabi Exchange... 4 Dubai Financial Market... 5 Definitions... 6 Contacts... 7.
... 2 Boursa Kuwait... 3 Abu Dhabi Exchange... 4 Dubai Financial Market... 5 Definitions... 6 Contacts... 7.") QNBFS Technical Technical Spotlight Spotlight Sunday, February January 14, 11, 2018 2018 Contents Saudi Market (TADAWUL)... 2 Boursa Kuwait... 3 Abu Dhabi Exchange... 4 Dubai Financial Market... 5 Definitions...
QNBFS Technical Technical Spotlight Spotlight Sunday, February January 14, 11, 2018 2018 Contents Saudi Market (TADAWUL)... 2 Boursa Kuwait... 3 Abu Dhabi Exchange... 4 Dubai Financial Market... 5 Definitions...
Quant Pick Buy Axis Bank
 September 14, 2017 Quant Pick Buy Axis Bank Quant Pick Stock Action Range Target Stoploss Frame Axis Bank Buy 505-513 592 465 3 months Research Analyst Amit Gupta amit.gup@icicisecurities.com Azeem Ahmad
Technical & Derivatives Report
 Technical & Derivatives Report Sensex (36351) / Nifty (10957) Exhibit 1: Nifty Daily Chart We continue to remain in a range and yesterday s session was no exception. We opened flat in line with global
WEEKLY REPORT. 11 th FEB 15 th FEB
 61.34 61.34 Trade House 426 Alok Nagar, Kanadia Main Road Near Bangali Square Indore-452001 (M.P.) India Mobile :+91-9039261444 E-mail: info@tradenivesh.in INDIAN MARKETS INDIAN SECTORIAL INDICES INDICES
MONTHLY REPORT OCTOBER 2013
 NIFTY / BANK NIFTY DATE NIFTY / BANK NIFTY ADVICE TIME FRAME ENTRY TARGET STOP RESULT COMMENT GAIN/LOSS 04/10/2013 NIFTY OCT FUT SHORT INTRADAY 5925.00 5905-5890-5875 5945.10 TARGET HIT 5856.50 ON 07/10/2013
Quant Picks. Quant Pick
 October 3, 2017 Quant Picks Quant Pick Stock Action Range Target Stoploss Frame Vedanta Buy 315-320 358 295 1 month Dabur Buy 305-310 310 356 282 1month Research Analyst Amit Gupta amit.gup@icicisecurities.com
Technical & Derivatives Report
 Sensex (36374) / Nifty (10905) Exhibit 1: Nifty Daily Chart In last couple of days, US markets have once again started marching northwards and in-line with this, we opened higher after Wednesday s quiet
Currency Monthly. 6 th January 2017
 6 th January 2017 SEBI Certified Research Analyst www.choiceindia.com Outlook Indian Rupee: Indian Rupee is estimated to depreciate for the month of January on account of stronger dollar index after US
Market Commentary. Daily Technical Roundup
 Market Commentary FII & DII Activity FII (Cash) in Cr -94.45 DII (Cash) in Cr +389.96 FII (Index Futures) in Cr -510.91 FII (Index Options) in Cr +924.36 FII (Stock Futures) in Cr +571.07 FII (Stock Options)
Gladiator Stocks. Research Analysts. May 3, Cummins India CUMIND Buy in the range of
 Gladiator Stocks Scrip IDirectCode I-Direct Action Target Stoploss Cummins India CUMIND Buy in the range of 1060-1080 1250.00 970.00 Time Frame: 6 Months Research Analysts Dharmesh Shah dharmesh.shah@icicisecurities.com
Eagle Eye Equities. August 21, Index
 August 21, 2017 Index Punter s Call Looking Trendy Nifty Day Trader Smart Charts Momentum Swing CTFT (Carry Today For Tomorrow) Bank Nifty Bank Nifty Day Trader Day Trader s Hit List Visit us at www.sharekhan.com
Oil & Gas Thematic. Quant Pick
 August 18, 2017 Oil & Gas Thematic Quant Pick Gail and Petronet t LNG Quant Pick Stock Action Range Target Stoploss Frame GAIL Buy 376-382 445 342 3 months Petronet LNG Buy 226-230 230 270 205 3months
Stock Trader: Budget Beneficiary Stock Larsen & Toubro
 Stock Trader: Budget Beneficiary Stock Larsen & Toubro Amit Gupta Raj Deepak Singh Azeem Ahmad amit.gup@icicisecurities.com rajdeepak.singh@icicisecurities.com azeem.ahmad@icicisecurities.com February
MONTHLY REPORT MARCH 2013
 NIFTY / BANK NIFTY DATE NIFTY / BANK NIFTY ADVICE TIME FRAME ENTRY TARGET STOP RESULT COMMENT GAIN/LOSS 07/03/2013 NIFTY 5800 MARCH PUT LONG EXPIRY 35.00 55-75-95 14.90 TARGET HIT 79.55 ON 14/03/2013 6,684
Technical & Derivatives Report
 Technical & Derivatives Report Sensex (27117) / Nifty (8392) Exhibit 1: Nifty Daily Chart Trading for the week began with a marginal downside gap which was quite expected after a decent corrective move
Technical & Derivatives Report
 Sensex (34474) / Nifty (10348) Exhibit 1: Nifty Daily Chart Trading for the week began on a sluggish note and during the initial hours, Nifty once again nosedived to test the 10200 mark. This was followed
Research Desk Stock Broking
 Research Desk Stock Broking India ValueMax January 01, 2015 ValueMax Monthly Investment Ideas ValueMax helps clients to take a long stance on stocks from the S&P BSE-100 universe. Comprising monthly technical
Technical & Derivatives Report
 Sensex (35379) / Nifty (10700) Exhibit 1: Nifty Daily Chart Despite Asian bourses indicating some nervous start; our markets managed to open flat with mildly positive bias. Subsequently, we witnessed a
Gold Outlook. Bear bug hits gold!!! CMP - $1150. ICICI Securities Ltd. Retail Equity Research. November 5, 2014
 Gold Outlook. Gold price performance of last 5 years 44% -36% 30% 10% 7% -28% -5% 2010 2011 2012 2013 YTD Year 2014 Bear bug hits gold!!! CMP - $1150 Global commodity prices have remained in a downward
Consumer Discretionary Thematic 6.0 : Buy Page Industries
 September 21, 2016 Consumer Discretionary Thematic 6.0 : Buy Page Industries Quant Pick Stock Action Initiation Range Target Stoploss Time Frame Page Industries Buy 14950-15150 17500 13750 3 months Research
NEWSLETTER SWING TRADING. 28 Feb Intelligent Analysis to point your decisions in the right direction
 NEWSLETTER 28 Feb 2018 Intelligent Analysis to point your decisions in the right direction SWING TRADING Newsletter contains index, stocks and sector recommendations along with market outlook. It also
Advance Certificate in Trading : A PROGRAM FOR SELF-INVESTORS
 Advance Certificate in Trading : A PROGRAM FOR SELF-INVESTORS [Stock Commodity-Forex] Duration: 4 Months Fee: 33,000 + Service Tax Training: Weekends / Weekdays Certifications: Certified Trader Certificate
Technical Trading Idea
 Date: 16 th September 2013 Technical Trading Idea Research Contributor: Brijesh Bhatia (Technical Analyst Senior Manager) 022-40350185 brijesh.bhatia@lmcpl.com Amit Pathania (Jr. Technical Analyst) 022-40350184
Technical & Derivatives Report
 Technical & Derivatives Report Sensex (33066) / Nifty (10131) Exhibit 1: Nifty Daily Chart The indices started trading for the week on a cautious note citing the sell-off which was seen in the U.S markets
Market Commentary. Daily Technical Roundup. Sumpoorna period of not more than 18 months, to the promoter on a preferential allotment basis.
 Market Commentary FII & DII Activity FII (Cash) in Cr +675.14-51.86 DII (Cash) in Cr FII (Index Futures) in Cr FII (Index Options) in Cr FII (Stock Futures) in Cr FII (Stock Options) in Cr +2395.73 +3273.54-95.56
Technical & Derivatives Report
 Sensex (35557) / Nifty (10807) Exhibit 1: Nifty Daily Chart Our markets witnessed a flat opening as indicated by SGX Nifty. Subsequently, Index traded cautiously in a very narrow range ahead of Karnataka
KLY EQUIT
 WEEK KLY EQUIT TY REPORT 26 th March, 2018 INDIAN MARKET AS ON FRIDAY 23/03/2018 Index Current Value Prev. Week Closing % Change Nifty 50 9998..05 10195.15-1.93% Sensex 32596.54 33176.00-1.74% WORLD INDICES
Channel Becomes Credible Resistance.
 T E C H N I C A L A N A L Y S I S 15, 2010 D A I L Y Channel Becomes Credible Resistance. Syed Rehan Ali rehan@fs.com.pk +92 (21) 561 2290-94 Ext. 306 Open High Low Close Vol. (m) RSI(14) 21ema 55ema 233ema
Gladiator Stocks. Federal-Mogul Goetze (India) Ltd. FEDGOE Buy in the range of
 Ltd. FEDGOE Buy in the range of") Gladiator Stocks Scrip I-Direct Code Action Target Stoploss Federal-Mogul Goetze (India) Ltd. FEDGOE Buy in the range of 540-560 680.00 480.00 Time Frame: 6 Months Research Analysts Dharmesh Shah dharmesh.shah@icicisecurities.com
Gladiator Stocks Scrip I-Direct Code Action Target Stoploss Federal-Mogul Goetze (India) Ltd. FEDGOE Buy in the range of 540-560 680.00 480.00 Time Frame: 6 Months Research Analysts Dharmesh Shah dharmesh.shah@icicisecurities.com
Technical & Derivatives Report
 Sensex (32402) / Nifty (10148) Exhibit 1: Nifty Daily Chart Despite mixed cues from the Asian peers, our markets opened slightly higher carrying previous day s optimistic mood. Subsequently, index consolidated
Technical & Derivatives Report
 Sensex (33627) / Nifty (10332) Exhibit 1: Nifty Daily Chart On Friday, our markets witnessed a flat opening as indicated by SGX Nifty and post trading in a narrow range ended well above the 10300 mark.
NEWSLETTER SWING TRADING. 26 Feb Intelligent Analysis to point your decisions in the right direction
 NEWSLETTER 26 Feb 2018 Intelligent Analysis to point your decisions in the right direction SWING TRADING Newsletter contains index, stocks and sector recommendations along with market outlook. It also
TECHNICAL RESEARCH DESK. Bank Nifty to make a new High! Manav Chopra, CMT : Technical Analyst
 TECHNICAL RESEARCH DESK Bank Nifty to make a new High! Manav Chopra, CMT : Technical Analyst CNX BANK NIFTY 15,230 (DAILY CHART) :- The index after the election result has been consolidating its gains
Stock Trader: ONGC. Research Analysts.
 Research Analysts Amit Gupta Raj Deepak Singh Azeem Ahmad Stock Trader: ONGC amit.gup@icicisecurities.com rajdeepak.singh@icicisecurities.com azeem.ahmad@icicisecurities.com December 3, 2014 Important
DAILY TECHNICAL REPORT
 RESEARCH TEAM DAILY TECHNICAL REPORT DISCLAIMER & DISCLOSURES Please read the disclaimer and the disclosures which can be found at the end of this report EUR / USD Decreasing. EUR/USD is declining, approaching
BONAZ CAPITAL WEEKLY REPORT ON EQUITY MARKET 02/07/2018 TO 06/07/2018
 BONAZ CAPITAL WEEKLY REPORT ON EQUITY MARKET 02/07/2018 TO 06/07/2018 Nifty opened with positive note gap up around 1.0 % at the beginning of this week, showed Upside movement and closed with positive
Gladiator Stocks. Scrip I-Direct Code Action Target Stoploss Upside Tata Power TATPOW Buy in the range of
 Gladiator Stocks Scrip I-Direct Code Action Target Stoploss Upside Tata Power TATPOW Buy in the range of 79.000-82.00 98.00 72.00 22% Time Frame: 6 Months Research Analysts Dharmesh Shah dharmesh.shah@icicisecurities.com
Technical & Derivatives Report
 Sensex (37922) / Nifty (11438) Exhibit 1: Nifty Daily Chart A weakening in Rupee continues to put lot of burden on our markets as the opening of USDINR beyond the 72.15 mark led to a sluggish start for
Technical & Derivatives Report
 Technical & Derivatives Report Sensex (35850) / Nifty (10772) Exhibit 1: Nifty Daily Chart Yesterday morning, the global set up was just perfect to kick start the trading week on a cheerful note. Our benchmarks
Technical & Derivatives Report
 Sensex (35354) / Nifty (10629) Exhibit 1: Nifty Daily Chart Yesterday morning, we had a perfect set up to kick start the proceedings for the week on a cheerful note. The Crude oil continued its losing