North Central Wisconsin Labor Market Trends, Information and Updates
|
|
|
- Randolph Kennedy
- 5 years ago
- Views:
Transcription


1 North Central Wisconsin Labor Market Trends, Information and Updates Facts, Strategies, and Resources Derek Heikkinen and Mitchell Rupp North Central Wisconsin Workforce Solutions Summit Wednesday, September 13, 2017 Rothschild, Wisconsin North Central Wisconsin Workforce Development Board &Department of Workforce Development
2 Review: What We Already Know United States Economy will be an estimated 18 million skilled workers short of demand by (Manpower) Wisconsin has loses the 7th largest portion of skilled talent to outbound population migration. Baby Boomers expected to be gone from the workforce by (74.9 million living in the United States). Millennials will make up the workforce majority by as early as (75.4 million between in the United States Currently). Cost of living continues to rise. (Livable Wage $12.85) Wages are rising (Nationally average weekly wage rose 5.4% over this past year)
3 The Regional Correlation Wisconsin Unemployment Rate 3.2% (17 year low) (April 2017) 15.6% of population is over % of population is disabled 12.1 % live below poverty line U.S. Birth rate reached record low of 1.86 babies/year, well below the 2.1 per needed for a stable population (ages 15-44) Birth rates of women in 2015 hit historic lows equaling the rate for the time period in the years before and after the Great Recession (15% drop from )
4 Q4 (2016) Top Ten Jobs U.S. Employers Can t Fill 1.Skilled Trade Workers (machinist, welders, maintenance, pipefitters, construction, etc) 2. Drivers (OTR/CDL) 3. Teachers 4. Sales Representatives 5. Administrative Professionals 6.Management Executives 7.Nurses 8.Technicians 9.Accounting and Finance Staff 10.Engineers (Manpower 2016)
5 Unemployment Rate South Central has lower unemployment rate than WI and US Unemployment Rates Source: Bureau of Labor Statistics; Local Area Unemployment Statistics (LAUS), Current Population Survey (CPS)
6 In Demand Jobs in North Central Wisconsin Teachers Engineers IT/Computer Science Registered Nurse CMA CNA Medical Assistant Diesel Technician Machinist Welder Carpenters/Construction Pipefitters Electricians Maintenance Technicians Auto Technicians and Collision Heavy Equipment Operator HR Accountants
7 Tax Base: Regional Sector Analysis Driver Economies (Pillars) Manufacturing (1:4) Healthcare Transportation and Warehousing Finance and Insurance Emerging Economies (Most Growth Potential) Construction Healthcare Wholesale Trade Information/Computer Science Management of Companies and Enterprises Agriculture
8 Employment Private Sector Super Sectors North Central WDA 2016 SuperSector Jobs Share of Jobs Natural Resources & Mining % Construction % Manufacturing % Trade, Transportation, Utilities % Information % Financial Activities % Professional & Business Services % Education & Health Services % Leisure & Hospitality % Other Services % Source: Quarterly Census of Employment and Wages (BLS)

9 Manufacturing Employment, 3Q 2016 Area All- Industry Manufacturing Total Percent Adams County % Forest County % Langlade County % Lincoln County % Marathon County % Oneida County % Portage County % Vilas County % Wood County %
10 Manufacturing Location Quotient vs US, 3Q 2016 LQ of 1 = average, LQ >1 = above average Adams 0.76 Forest 1.15 Lincoln 2.72 Langlade 2.15 Marathon 2.67 Oneida 1.05 Portage 1.63 Vilas 0.54 Wood 1.67

11 Births In the Region

12 Baby Boomers in the Labor Force: Retirements Outpacing Births

13 WI Population and Labor Force
14 Labor Force Participation Source: Bureau of Labor Statistics; Local Area Unemployment Statistics (LAUS), Current Population Survey (CPS) U.S. Census Bureau, Population Division
15 Marathon County and Wisconsin Differ Racially in Labor Force Race Labor Force Shares Marathon Wisconsin White 93.62% 88.95% Black 0.53% 5.02% American Indian or Alaska Native 0.22% 0.77% Asian 4.56% 2.34% Native Hawaiian or Pacific Islander 0.01% 0.02% Some other race 0.17% 1.54% Multiracial 0.90% 1.35% Source: Year American Community Survey (U.S. Census Bureau) Note: All Races are mutually exclusive and cover the entire universe the sample represents. Hispanic includes all individuals that are identified as ethnically Hispanic in the American Community Survey. The remaining race categories reflect only the non-hispanic portion of that population.
16 Employment North Central WDA - Gradual Employment Growth From

17 Employment Bulk of Growth from Private Sector; 62% of gains from Service-Providing Industries
18 What s The Future Hold? K-12 Enrollment From to Regional Net Decrease of 3,528 across our school Districts Attributing Factors: Recession (people left), Labor Shed Growth, and Cost of Living Continues to rise (Stagnant Wages). Largest Regressions Rapids (-619) Rhinelander (-580) Adams-Friendship (-403) Antigo (-306) Nekoosa (-248)
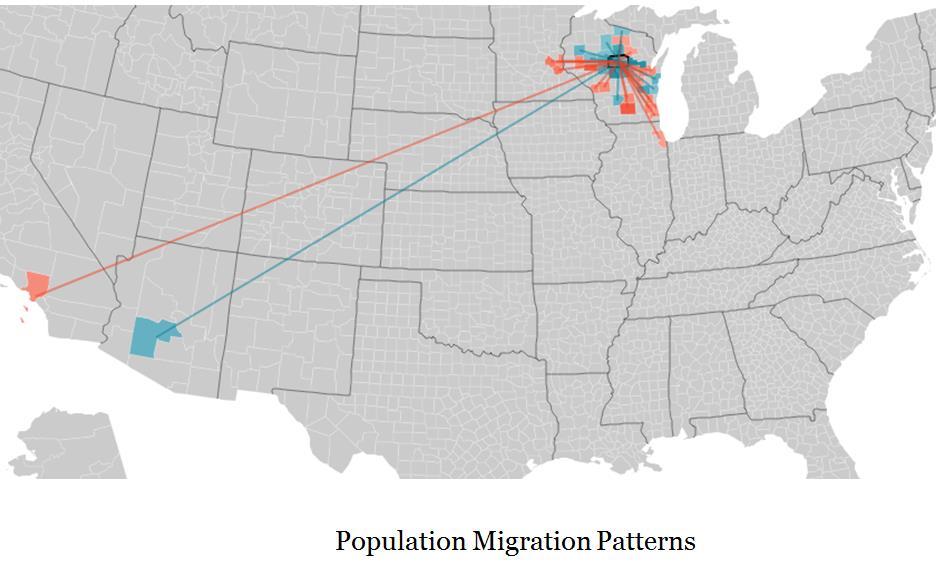
19 Population Migration

20 What s Our Future Hold?

21 Population Shifts Ages 18-24

22 Over 65 Population


23 Marathon County Older than Wisconsin Fewer Millennials, More Persons Aged 45 and Over Source: Year American Community Survey (US Census Bureau)

24 Bachelor-Educated Portion of Labor Force Smaller in Marathon County Source: Year American Community Survey (US Census Bureau)
25 North Central WDA Job Openings, JCW Internal YTD as of 5/18/17 - By NAICS Industry
26 North Central WDA Job Openings, JCW Internal YTD as of 5/18/17 - By ONET (SOC) Occupation
27 How Do We Solve This? Understand Your Market Place (Labor Shed) Re-Invest in Human Capital/Your Workforce Train Up Incumbent Workers to offset gap left by retirements (Grants, Apprenticeships, Technical College Partners). Understand Millennials- Culture Shifts, Career Upward Mobility, Competitive Wages, Tuition Reimbursement, On site Healthcare/daycare, work from home, flexible scheduling. Sector Partnerships (K-12/ Post Secondary Shifts) Develop Pipelines with Technical Colleges, K-12 System, Youth Apprenticeship, and Workforce Partners. Attract Outside Talent- Get Involved with Regional Economic Partners and Programs. Foster Entrepreneurship within the K-12 System (Diversify Rural Economies)
EMPLOYMENT PROJECTIONS
 For release 10:00 a.m. (EST) Tuesday, December 8, 2015 USDL-15-2327 Technical information: (202) 691-5700 ep-info@bls.gov www.bls.gov/emp Media contact: (202) 691-5902 PressOffice@bls.gov EMPLOYMENT PROJECTIONS
Economic Overview City of Tyler, TX. January 8, 2018
 Economic Overview City of Tyler, TX January 8, 2018 DEMOGRAPHIC PROFILE...3 EMPLOYMENT TRENDS...5 WAGE TRENDS...5 COST OF LIVING INDEX...6 INDUSTRY SNAPSHOT...7 OCCUPATION SNAPSHOT...9 INDUSTRY CLUSTERS...
Economic Overview New York
 Report created on October 20, 2015 Economic Overview Created using: Contact: Lisa.Montiel@suny.edu DEMOGRAPHIC PROFILE...3 EMPLOYMENT TRENDS...5 UNEMPLOYMENT RATE...5 WAGE TRENDS...6 COST OF LIVING INDEX...6
Economic Overview Long Island
 Report created on October 20, 2015 Economic Overview Long Island Created using: Contact: Lisa.Montiel@suny.edu DEMOGRAPHIC PROFILE...3 EMPLOYMENT TRENDS...5 UNEMPLOYMENT RATE...5 WAGE TRENDS...6 COST OF
Economic Overview York County, South Carolina. February 14, 2018
 Economic Overview York County, February 14, 2018 DEMOGRAPHIC PROFILE... 3 EMPLOYMENT TRENDS... 5 UNEMPLOYMENT RATE... 5 WAGE TRENDS... 6 COST OF LIVING INDEX... 6 INDUSTRY SNAPSHOT... 7 OCCUPATION SNAPSHOT...
Economic Overview Mohawk Valley
 Report created on August 29, 2017 Economic Overview Mohawk Valley Contact: Lisa.Montiel@suny.edu DEMOGRAPHIC PROFILE... 3 EMPLOYMENT TRENDS... 5 UNEMPLOYMENT RATE... 5 WAGE TRENDS... 6 COST OF LIVING INDEX...
Rifle city Demographic and Economic Profile
 Rifle city Demographic and Economic Profile Community Quick Facts Population (2014) 9,289 Population Change 2010 to 2014 156 Place Median HH Income (ACS 10-14) $52,539 State Median HH Income (ACS 10-14)
Economic Overview Long Island
 Report created on August 29, 2017 Economic Overview Long Island Contact: Lisa.Montiel@suny.edu DEMOGRAPHIC PROFILE... 3 EMPLOYMENT TRENDS... 5 UNEMPLOYMENT RATE... 5 WAGE TRENDS... 6 COST OF LIVING INDEX...
Economic Overview Monterey County, California. July 22, 2016
 Economic Overview Monterey July 22, 2016 DEMOGRAPHIC PROFILE... 3 EMPLOYMENT TRENDS... 5 UNEMPLOYMENT RATE... 5 WAGE TRENDS... 6 COST OF LIVING INDEX... 6 INDUSTRY SNAPSHOT... 7 OCCUPATION SNAPSHOT...
Economic Overview Loudoun County, Virginia. October 23, 2017
 Economic Overview October 23, 2017 DEMOGRAPHIC PROFILE... 3 EMPLOYMENT TRENDS... 5 UNEMPLOYMENT RATE... 5 WAGE TRENDS... 6 COST OF LIVING INDEX... 6 INDUSTRY SNAPSHOT... 7 OCCUPATION SNAPSHOT... 9 INDUSTRY
DEMOGRAPHIC PROFILE...3 EMPLOYMENT TRENDS...5 UNEMPLOYMENT RATE...5 WAGE TRENDS...6 COST OF LIVING INDEX...6 INDUSTRY SNAPSHOT...7
 March 14, 2017 DEMOGRAPHIC PROFILE...3 EMPLOYMENT TRENDS...5 UNEMPLOYMENT RATE...5 WAGE TRENDS...6 COST OF LIVING INDEX...6 INDUSTRY SNAPSHOT...7 OCCUPATION SNAPSHOT...9 INDUSTRY CLUSTERS... 12 EDUCATION
October 28, Economic Overview Yellowstone County, Montana
 October 28, 2016 Economic Overview Yellowstone DEMOGRAPHIC PROFILE...3 EMPLOYMENT TRENDS...5 UNEMPLOYMENT RATE...5 WAGE TRENDS...6 COST OF LIVING INDEX...6 INDUSTRY SNAPSHOT...7 OCCUPATION SNAPSHOT...9
Economic Overview Western New York
 Report created on August 29, 2017 Economic Overview Western New Contact: Lisa.Montiel@suny.edu DEMOGRAPHIC PROFILE... 3 EMPLOYMENT TRENDS... 5 UNEMPLOYMENT RATE... 5 WAGE TRENDS... 6 COST OF LIVING INDEX...
Economic Overview Fairfax / Falls Church. October 23, 2017
 Economic Overview Fairfax / Falls Church October 23, 2017 DEMOGRAPHIC PROFILE... 3 EMPLOYMENT TRENDS... 5 UNEMPLOYMENT RATE... 5 WAGE TRENDS... 6 COST OF LIVING INDEX... 6 INDUSTRY SNAPSHOT... 7 OCCUPATION
2016 Labor Market Profile
 2016 Labor Market Profile Prepared by The Tyler Economic Development Council Tyler Area Sponsor June 2016 The ability to demonstrate a regions availability of talented workers has become a vital tool
June 9, Economic Overview Billings, MT MSA
 June 9, 2016 Economic Overview Billings, MT MSA DEMOGRAPHIC PROFILE... 3 EMPLOYMENT TRENDS... 5 UNEMPLOYMENT RATE... 5 WAGE TRENDS... 6 COST OF LIVING INDEX... 6 INDUSTRY SNAPSHOT... 7 OCCUPATION SNAPSHOT...
Economy Overview. Navarro County, TX. Emsi Q Data Set
 Economy Overview Navarro County, TX Emsi Q3 2017 Data Set www.economicmodeling.com Economy Overview Contents. Economy........ Overview.........................................................................................
REGIONAL SNAPSHOT. Partner for Progress Region, NE
 REGIONAL SNAPSHOT Partner for Progress Region, NE Table of contents 01 Overview 04 Labor force 02 Demography 05 Industry and occupation 03 Human capital 01 overview Partner for Progress Region, NE What
Economic Overview Capital District
 August 29, 2017 Economic Overview Capital District Contact: Lisa.Montiel@suny.edu DEMOGRAPHIC PROFILE... 3 EMPLOYMENT TRENDS... 5 UNEMPLOYMENT RATE... 5 WAGE TRENDS... 6 COST OF LIVING INDEX... 6 INDUSTRY
ECONOMIC OVERVIEW DuPage County, Illinois
 ECONOMIC OVERVIEW DuPage County, Illinois DEMOGRAPHIC PROFILE... 3 EMPLOYMENT TRENDS... 5 UNEMPLOYMENT RATE... 5 WAGE TRENDS... 6 COST OF LIVING INDEX... 7 INDUSTRY SNAPSHOT... 8 OCCUPATION SNAPSHOT...
2. Demographics. Population and Households
 2. Demographics This analysis describes the existing demographics in. It will be used to identify the major demographic trends that may have an effect on public policy in in the next decade. Demographic
REGIONAL SNAPSHOT. Eastern Shore Region, Virginia
 REGIONAL SNAPSHOT Eastern Shore Region, Virginia Table of contents 01 Overview 04 Labor force 02 Demography 05 Industry and occupation 03 Human capital 01 overview Eastern Shore Region, VA What is a regional
EMPLOYEE TENURE IN 2014
 For release 10:00 a.m. (EDT) Thursday, September 18, 2014 USDL-14-1714 Technical information: (202) 691-6378 cpsinfo@bls.gov www.bls.gov/cps Media contact: (202) 691-5902 PressOffice@bls.gov EMPLOYEE TENURE
REGIONAL SNAPSHOT. Indiana 15 Regional Planning Commission Region, Indiana
 REGIONAL SNAPSHOT Indiana 15 Regional Planning Commission Region, Indiana Table of contents 01 Overview 04 Labor force 02 Demography 05 Industry and occupation 03 Human capital 01 overview Indiana 15 Regional
REGIONAL SNAPSHOT. Northern Shenandoah Valley Regional Partnership (NSVRP), Virginia
, Virginia") REGIONAL SNAPSHOT Northern Shenandoah Valley Regional Partnership (NSVRP), Virginia Table of contents 01 Overview 04 Labor force 02 Demography 05 Industry and occupation 03 Human capital 01 overview Northern
REGIONAL SNAPSHOT Northern Shenandoah Valley Regional Partnership (NSVRP), Virginia Table of contents 01 Overview 04 Labor force 02 Demography 05 Industry and occupation 03 Human capital 01 overview Northern
Economic Overview. Lawrence, KS MSA
 Economic Overview Lawrence, KS MSA March 5, 2019 DEMOGRAPHIC PROFILE... 3 EMPLOYMENT TRENDS... 5 UNEMPLOYMENT RATE... 5 WAGE TRENDS... 6 COST OF LIVING INDEX... 7 INDUSTRY SNAPSHOT... 8 OCCUPATION SNAPSHOT...
REGIONAL SNAPSHOT. Crossing Borders Region (CBR), Oklahoma
, Oklahoma") REGIONAL SNAPSHOT Crossing Borders Region (CBR), Oklahoma Table of contents 01 Overview 04 Labor force 02 Demography 05 Industry and occupation 03 Human capital 01 overview Crossing Borders Region, OK
REGIONAL SNAPSHOT Crossing Borders Region (CBR), Oklahoma Table of contents 01 Overview 04 Labor force 02 Demography 05 Industry and occupation 03 Human capital 01 overview Crossing Borders Region, OK
Respiratory Therapy Occupation Overview
 Respiratory Therapy Occupation Overview Emsi Q1 2018 Data Set March 2018 Western Technical College 400 Seventh Street La Crosse, Wisconsin 54601 608.785.9200 Emsi Q1 2018 Data Set www.economicmodeling.com
REGIONAL SNAPSHOT. Foothills Region, North Carolina
 REGIONAL SNAPSHOT Foothills Region, North Carolina Table of contents 01 Overview 04 Labor force 02 Demography 05 Industry and occupation 03 Human capital 01 overview Foothills Region, NC What is a regional
Economic Overview Prince William/Manassas. October 23, 2017
 Economic Overview Prince William/Manassas October 23, 2017 DEMOGRAPHIC PROFILE... 3 EMPLOYMENT TRENDS... 5 UNEMPLOYMENT RATE... 5 WAGE TRENDS... 6 COST OF LIVING INDEX... 6 INDUSTRY SNAPSHOT... 7 OCCUPATION
Economic Overview 45-Minute Commute From Airport Park. June 6, 2017
 Economic Overview 45-Minute Commute From Airport Park June 6, 2017 DEMOGRAPHIC PROFILE... 3 EMPLOYMENT TRENDS... 5 WAGE TRENDS... 5 COST OF LIVING INDEX... 6 INDUSTRY SNAPSHOT... 7 OCCUPATION SNAPSHOT...
Economic Overview Marlboro County Labor Shed. June 29, 2016
 Economic Overview Marlboro County Labor June 29, 2016 DEMOGRAPHIC PROFILE...3 EMPLOYMENT TRENDS...5 UNEMPLOYMENT RATE...5 WAGE TRENDS...6 COST OF LIVING INDEX...6 INDUSTRY SNAPSHOT...7 OCCUPATION SNAPSHOT...9
Occupational Therapy Assistant Occupation Overview
 Occupational Therapy Assistant Occupation Overview Emsi Q1 2018 Data Set March 2018 Western Technical College 400 Seventh Street La Crosse, Wisconsin 54601 608.785.9200 Emsi Q1 2018 Data Set www.economicmodeling.com
Economic Overview Plant City Region. April 5, 2017
 Economic Overview Plant City Region April 5, 2017 DEMOGRAPHIC PROFILE... 3 EMPLOYMENT TRENDS... 5 WAGE TRENDS... 5 COST OF LIVING INDEX... 6 INDUSTRY SNAPSHOT... 7 OCCUPATION SNAPSHOT... 9 INDUSTRY CLUSTERS...
Town Profiles: Demographic, Economic, and Housing Statistics for De Smet City and Wall Town, SOuth Dakota
 South Dakota State University Open PRAIRIE: Open Public Research Access Institutional Repository and Information Exchange Census Data Center News Releases SDSU Census Data Center 12-7-2017 Town Profiles:
Tyler Area Economic Overview
 Tyler Area Economic Overview Demographic Profile. 2 Unemployment Rate. 4 Wage Trends. 4 Cost of Living Index...... 5 Industry Clusters. 5 Occupation Snapshot. 6 Education Levels 7 Gross Domestic Product
2018:IIIQ Nevada Unemployment Rate Demographics Report*
 2018:IIIQ Nevada Unemployment Rate Demographics Report* Department of Employment, Training & Rehabilitation Research and Analysis Bureau Dr. Tiffany Tyler-Garner, Director Dennis Perea, Deputy Director
Economy Overview. Navarro County, TX. Emsi Q Data Set
 Economy Overview Navarro County, TX Emsi Q4 2017 Data Set www.economicmodeling.com Economy Overview Contents. Economy........ Overview.........................................................................................
WHO S LEFT TO HIRE? WORKFORCE AND UNEMPLOYMENT ANALYSIS PREPARED BY BENJAMIN FRIEDMAN JANUARY 23, 2019
 JANUARY 23, 2019 WHO S LEFT TO HIRE? WORKFORCE AND UNEMPLOYMENT ANALYSIS PREPARED BY BENJAMIN FRIEDMAN 13805 58TH STREET NORTH CLEARNWATER, FL, 33760 727-464-7332 Executive Summary: Pinellas County s unemployment
FUTURE LANDSCAPES. The effects of changing demographics. Background. Future landscapes: The effects of changing demographics February, 2007
 FUTURE LANDSCAPES The effects of changing demographics Background DRCOG Board Retreat 1 Our region is changing Demographic facts: Rapid growth of the older population Increasing immigration Flexible, creative
Economic Overview Charlotte-Concord-Gastonia, NC-SC MSA. October 27, 2017
 Economic Overview Charlotte-Concord-Gastonia, NC-SC MSA October 27, 2017 DEMOGRAPHIC PROFILE...3 EMPLOYMENT TRENDS...5 UNEMPLOYMENT RATE...5 WAGE TRENDS...6 COST OF LIVING INDEX...6 INDUSTRY SNAPSHOT...7
LOCAL LABOR MARKET SURVEY RESULTS
 LOCAL LABOR MARKET SURVEY RESULTS FALL 2014 OVERVIEW 1 2 OVERVIEW ABOUT THE SURVEY Understanding the local labor market is a vital component in formulating a strategy for addressing local skills gaps.
Population and Labor Force Projections for New Jersey: 2008 to 2028
 Population and Labor Force Projections for New Jersey: 2008 to 2028 by Sen-Yuan Wu, Division of Labor Market and Demographic Research Similar to other northern states, New Jersey has had slower population
2018 Economic Outlook
 2018 Economic Outlook presented at the North Haven EDC Breakfast 4/12/18 About CERC CERC drives economic development in Connecticut by providing research based data, planning and implementation strategies
Commission District 4 Census Data Aggregation
 Commission District 4 Census Data Aggregation 2011-2015 American Community Survey Data, U.S. Census Bureau Table 1 (page 2) Table 2 (page 2) Table 3 (page 3) Table 4 (page 4) Table 5 (page 4) Table 6 (page
Regional Data Snapshot
 Regional Data Snapshot Population, Economy & Education Features SET Civic Forum Ozark Foothills Region, Missouri Table of Contents 01 Overview 03 Human Capital 02 Demography 04 Labor Force 01 overview
Northwest Census Data Aggregation
 Northwest Census Data Aggregation 2011-2015 American Community Survey Data, U.S. Census Bureau Table 1 (page 2) Table 2 (page 2) Table 3 (page 3) Table 4 (page 4) Table 5 (page 4) Table 6 (page 5) Table
Riverview Census Data Aggregation
 Riverview Census Data Aggregation 2011-2015 American Community Survey Data, U.S. Census Bureau Table 1 (page 2) Table 2 (page 2) Table 3 (page 3) Table 4 (page 4) Table 5 (page 4) Table 6 (page 5) Table
Zipe Code Census Data Aggregation
 Zipe Code 66101 Census Data Aggregation 2011-2015 American Community Survey Data, U.S. Census Bureau Table 1 (page 2) Table 2 (page 2) Table 3 (page 3) Table 4 (page 4) Table 5 (page 4) Table 6 (page 5)
Zipe Code Census Data Aggregation
 Zipe Code 66103 Census Data Aggregation 2011-2015 American Community Survey Data, U.S. Census Bureau Table 1 (page 2) Table 2 (page 2) Table 3 (page 3) Table 4 (page 4) Table 5 (page 4) Table 6 (page 5)
A Sublette County Profile: Socioeconomics
 JULY 2015 A Sublette County Profile: Socioeconomics Sublette County Board of County Commissioners Andy Nelson, Chair Joel Bousman Jim Latta INTRODUCTION In a rapidly changing world, timely and accurate
Regional Data Snapshot
 Regional Data Snapshot Population, Economy & Education Features SET Civic Forum Forest Country Region (FCR), Texas Table of Contents 01 Overview 03 Human Capital 02 Demography 04 Labor Force 01 overview
Pennsylvania. Demographic and Economic Profile. Metro and Nonmetro Counties in Pennsylvania
 Demographic and Economic Profile Pennsylvania Updated June 2006 Metro and Nonmetro Counties in Pennsylvania Based on the most recent listing of core based statistical areas by the Office of Management
Occupation Overview. EMSI Q Data Set. Criminal Justice Program. October Western Technical College
 Occupation Overview EMSI Q2 2015 Data Set Criminal Justice Program October 2015 Western Technical College 400 Seventh Street La Crosse, Wisconsin 54601 608.785.9200 EMSI Q2 2015 Data Set www.economicmodeling.com
Women in the Labor Force: A Databook
 Cornell University ILR School DigitalCommons@ILR Federal Publications Key Workplace Documents 2-2013 Women in the Labor Force: A Databook Bureau of Labor Statistics Follow this and additional works at:
Demographic and Economic Profile. Florida. Updated May 2006
 Demographic and Economic Profile Florida Updated May 2006 Metro and Nonmetro Counties in Florida Based on the most recent listing of core based statistical areas by the Office of Management and Budget
Economic Outlook. Connecticut Economic Resource Center, Inc.
 Economic Outlook Alissa DeJonge Vice President of Research January 2018 Connecticut Economic Resource Center, Inc. Private, nonprofit organization; founded in 1992 CERC drives economic development in Connecticut
Utah. Demographic and Economic Profile. Metro and Nonmetro Counties in Utah
 Demographic and Economic Profile Utah Updated July 2006 Metro and Nonmetro Counties in Utah Based on the most recent listing of core based statistical areas by the Office of Management and Budget (December
Local Business Profile All Sectors - Fairfield city, Ohio. Contents. What will I find in this report? My Customers
 Local Business Profile All Sectors -, Contents What will I find in this report? My Customers The My Customers section provides summarized demographic information for,. This information provides a snapshot
Demographic and Economic Profile. Delaware. Updated December 2006
 Demographic and Economic Profile Delaware Updated December 2006 Metro and Nonmetro Counties in Delaware Based on the most recent listing of core based statistical areas by the Office of Management and
Demographic and Economic Profile. North Dakota. Updated June 2006
 Demographic and Economic Profile North Dakota Updated June 2006 Metro and Nonmetro Counties in North Dakota Based on the most recent listing of core based statistical areas by the Office of Management
Demographic and Economic Profile. New Mexico. Updated June 2006
 Demographic and Economic Profile New Mexico Updated June 2006 Metro and Nonmetro Counties in New Mexico Based on the most recent listing of core based statistical areas by the Office of Management and
Regional Prosperity Initiative: Labor Market Information Supplement
 Regional Prosperity Initiative: Labor Market Information Supplement Prepared For: (Region 6) (Genesee, Huron, Lapeer, Sanilac, Shiawassee, St. Clair, and Tuscola) Prepared By: State of Michigan Department
MEMORANDUM. Gloria Macdonald, Jennifer Benedict Nevada Division of Health Care Financing and Policy (DHCFP)
") MEMORANDUM To: From: Re: Gloria Macdonald, Jennifer Benedict Nevada Division of Health Care Financing and Policy (DHCFP) Bob Carey, Public Consulting Group (PCG) An Overview of the in the State of Nevada
MEMORANDUM To: From: Re: Gloria Macdonald, Jennifer Benedict Nevada Division of Health Care Financing and Policy (DHCFP) Bob Carey, Public Consulting Group (PCG) An Overview of the in the State of Nevada
Demographic and Economic Profile. Nevada. Updated May 2006
 Demographic and Economic Profile Nevada Updated May 2006 Metro and Nonmetro Counties in Nevada Based on the most recent listing of core based statistical areas by the Office of Management and Budget (December
Contingent and Alternative Employment Arrangements, May U.S. BUREAU OF LABOR STATISTICS bls.gov
 Contingent and Alternative Employment Arrangements, May 2017 1 U.S. BUREAU OF LABOR STATISTICS bls.gov Gig economy No official BLS definition of gig economy or gig workers Researchers use many different
Occupation Overview Industrial Health & Safety Related Occupations in Kern
 Occupation Overview Industrial Health & Safety Related Occupations in Kern EMSI Q2 2015 Data Set Taft College 29 Emmons Park Drive Taft, California 93268 661.763.7700 EMSI Q2 2015 Data Set www.economicmodeling.com
Economic Profile. Capital Crossroads. a vision forward
 Economic Profile Capital a vision forward This profile was prepared by: Liesl Eathington Department of Economics State University phone: (515) 294 2954 email: leathing@iastate.edu 5/23/2012 Distribution
Monte Vista Population, ,744 4,651 4,564 4,467 4,458 4,432 4,451
 1 Monte Vista 4,8 4,7 4,6 4,5 4,4 4,3 4,2 4,1 4,61 4,612 4,61 4,676 Monte Vista, 2-213 4,744 4,651 4,564 4,467 4,458 4,432 4,451 4,418 4,412 4,355 2 21 22 23 24 25 26 27 28 29 21 211 212 213 Year Monte
Demographic and Economic Profile. Kentucky. Updated June 2006
 Demographic and Economic Profile Kentucky Updated June 2006 Metro and Nonmetro Counties in Kentucky Based on the most recent listing of core based statistical areas by the Office of Management and Budget
Women in the Labor Force: A Databook
 Cornell University ILR School DigitalCommons@ILR Federal Publications Key Workplace Documents 12-2010 Women in the Labor Force: A Databook Bureau of Labor Statistics Follow this and additional works at:
Demographic and Economic Profile. Ohio. Updated June Metro and Nonmetro Counties in Ohio
 Demographic and Economic Profile Ohio Updated June 2006 Metro and Nonmetro Counties in Ohio Based on the most recent listing of core based statistical areas by the Office of Management and Budget (December
2018 Trustee & Employee Diversity Update. June 2018
 2018 Trustee & Employee Diversity Update June 2018 Highlights at a Glance Established DEI Task Force & Steering Committee DEI Transparency: posted demographic data publicly Defined diversity, equity and
Women in the Labor Force: A Databook
 Cornell University ILR School DigitalCommons@ILR Federal Publications Key Workplace Documents 9-2007 Women in the Labor Force: A Databook Bureau of Labor Statistics Follow this and additional works at:
Clay County Comprehensive Plan
 2011-2021 Clay County Comprehensive Plan Chapter 1: Demographic Overview Clay County Comprehensive Plan Demographic Overview Population Trends This section examines historic and current population trends
Transitions. Population and Economic Trends For Northern Colorado
 Transitions Population and Economic Trends For Northern Colorado EDCC 2017 Elizabeth Garner State Demography Office Colorado Department of Local Affairs Demography.dola.colorado.gov Transitions to Watch
White Pine County Economic Overview
 Economic Overview Population (2016) 10,105 Jobs (2016) 4,597 Average Earnings (2016) $65,033 Unemployed (2/2016) 229 GRP (2014) $996,944,330 Exports (2014) $1,789,478,088 Imports (2014) $1,181,738,119
Mail Application to: Friedrichs Residence Attn: Patrice Griffiths 3 Wartburg Place Mount Vernon, NY Phone
 FRIEDRICHS RESIDENCE AT WARTBURG 3 Wartburg Place, Mt Vernon, New York (Westchester County) (61 Studio & One Bedroom Apartments available to seniors ages 62 and older) 1 Mail one application per household
Minnesota Energy Industry
 Energy Industry Jobs Q3 2000 Q3 2001 Q3 2002 Q3 2003 Q3 2004 Q3 2005 Q3 2006 Q3 2007 Q3 2008 Q3 2009 Q3 2010 Q3 2011 Q3 Q3 Q3 Q3 Q3 2016 Minnesota Energy Consortium April 13, 2017 Cameron Macht DEED Labor
SDs from Regional Peer Group Mean. SDs from Size Peer Group Mean
 Family: Population Demographics Population Entire MSA 602894 Central Cities (CC) 227,818 Outside Central Cities 375,076 Percent of Entire MSA 37.79% Population in CC Percent Change in Population from 1999
SDs from Regional Peer Group Mean. SDs from Size Peer Group Mean
 Family: Population Demographics Population Entire MSA 1187941 Central Cities (CC) 511,843 Outside Central Cities 676,098 Percent of Entire MSA 43.09% Population in CC Percent Change in Population from
SDs from Regional Peer Group Mean. SDs from Size Peer Group Mean
 Family: Population Demographics Population Entire MSA 661645 Central Cities (CC) 247,057 Outside Central Cities 414,588 Percent of Entire MSA 37.34% Population in CC Percent Change in Population from 1999
SDs from Regional Peer Group Mean. SDs from Size Peer Group Mean
 Family: Population Demographics Population Entire MSA 583845 Central Cities (CC) 316,649 Outside Central Cities 267,196 Percent of Entire MSA 54.24% Population in CC Percent Change in Population from 1999
SDs from Regional Peer Group Mean. SDs from Size Peer Group Mean
 Family: Population Demographics Population Entire MSA 1251509 Central Cities (CC) 540,423 Outside Central Cities 711,086 Percent of Entire MSA 43.18% Population in CC Percent Change in Population from
SDs from Regional Peer Group Mean. SDs from Size Peer Group Mean
 Family: Population Demographics Population Entire MSA 1135614 Central Cities (CC) 677,766 Outside Central Cities 457,848 Percent of Entire MSA 59.68% Population in CC Percent Change in Population from
SDs from Regional Peer Group Mean. SDs from Size Peer Group Mean
 Family: Population Demographics Population Entire MSA 591932 Central Cities (CC) 260,970 Outside Central Cities 330,962 Percent of Entire MSA 44.09% Population in CC Percent Change in Population from 1999
SDs from Regional Peer Group Mean. SDs from Size Peer Group Mean
 Family: Population Demographics Population Entire MSA 1100491 Central Cities (CC) 735,617 Outside Central Cities 364,874 Percent of Entire MSA 66.84% Population in CC Percent Change in Population from
SDs from Regional Peer Group Mean. SDs from Size Peer Group Mean
 Family: Population Demographics Population Entire MSA 540258 Central Cities (CC) 198,915 Outside Central Cities 341,343 Percent of Entire MSA 36.82% Population in CC Percent Change in Population from 1999
SDs from Regional Peer Group Mean. SDs from Size Peer Group Mean
 Family: Population Demographics Population Entire MSA 1249763 Central Cities (CC) 691,295 Outside Central Cities 558,468 Percent of Entire MSA 55.31% Population in CC Percent Change in Population from
SDs from Regional Peer Group Mean. SDs from Size Peer Group Mean
 Family: Population Demographics Population Entire MSA 1088514 Central Cities (CC) 272,953 Outside Central Cities 815,561 Percent of Entire MSA 25.08% Population in CC Percent Change in Population from
SDs from Regional Peer Group Mean. SDs from Size Peer Group Mean
 Family: Population Demographics Population Entire MSA 922516 Central Cities (CC) 470,859 Outside Central Cities 451,657 Percent of Entire MSA 51.04% Population in CC Percent Change in Population from 1999
SDs from Regional Peer Group Mean. SDs from Size Peer Group Mean
 Family: Population Demographics Population Entire MSA 687249 Central Cities (CC) 198,500 Outside Central Cities 488,749 Percent of Entire MSA 28.88% Population in CC Percent Change in Population from 1999
SDs from Regional Peer Group Mean. SDs from Size Peer Group Mean
 Family: Population Demographics Population Entire MSA 542149 Central Cities (CC) 181870 Outside Central Cities 360279 Percent of Entire MSA 33.55% Population in CC Percent Change in Population from 1999
SDs from Regional Peer Group Mean. SDs from Size Peer Group Mean
 Family: Population Demographics Population Entire MSA 1025598 Central Cities (CC) 293,834 Outside Central Cities 731,764 Percent of Entire MSA 28.65% Population in CC Percent Change in Population from
SDs from Regional Peer Group Mean. SDs from Size Peer Group Mean
 Family: Population Demographics Population Entire MSA 875583 Central Cities (CC) 232,835 Outside Central Cities 642,748 Percent of Entire MSA 26.59% Population in CC Percent Change in Population from 1999
SDs from Regional Peer Group Mean. SDs from Size Peer Group Mean
 Family: Population Demographics Population Entire MSA 716998 Central Cities (CC) 448,275 Outside Central Cities 268,723 Percent of Entire MSA 62.52% Population in CC Percent Change in Population from 1999
SDs from Regional Peer Group Mean. SDs from Size Peer Group Mean
 Family: Population Demographics Population Entire MSA 1333914 Central Cities (CC) 284,943 Outside Central Cities 1,048,971 Percent of Entire MSA 21.36% Population in CC Percent Change in Population from
SDs from Regional Peer Group Mean. SDs from Size Peer Group Mean
 Family: Population Demographics Population Entire MSA 712738 Central Cities (CC) 448,607 Outside Central Cities 264,131 Percent of Entire MSA 62.94% Population in CC Percent Change in Population from 1999
SDs from Regional Peer Group Mean. SDs from Size Peer Group Mean. Population Entire MSA
 Family: Population Demographics Population Entire MSA 1169641 Central Cities (CC) 0 Outside Central Cities 1,169,641 Percent of Entire MSA 0% Population in CC Percent Change in Population from 1999 to
REGIONAL SNAPSHOT. Crossing Borders Region (CBR), Oklahoma
, Oklahoma") REGIONAL SNAPSHOT Crossing Borders Region (CBR), Oklahoma Table of contents 01 Overview 04 Labor force 02 Demography 05 Industry and occupation 03 Human capital 01 overview Crossing Borders Region, OK
REGIONAL SNAPSHOT Crossing Borders Region (CBR), Oklahoma Table of contents 01 Overview 04 Labor force 02 Demography 05 Industry and occupation 03 Human capital 01 overview Crossing Borders Region, OK