ITV delivers strong operational performance in an uncertain economic environment 2017 Full Year Results
|
|
|
- Charlene Boone
- 5 years ago
- Views:
Transcription

1 ITV delivers strong operational performance in an uncertain economic environment 2017 Full Year Results 28 February 2018 The Voice UK

2 Agenda 1. Key Messages & Initial Impressions Carolyn McCall 2. Operating & Financial Review Ian Griffiths 3. Outlook for 2018 Carolyn McCall 4. Q&A Coronation Street 2

3 Key Messages & Initial Impressions Carolyn McCall I m A Celebrity Get Me Out Of Here!

4 Key Messages Financial performance delivers as expected ITV delivered a strong operating performance in a challenging environment in 2017 Linear viewing share up for second consecutive year Significant growth in online viewing and revenue ITV Studios delivered strong revenue growth Good performance has created a solid foundation Rapidly changing industry creates opportunities and challenges Strategy refresh for what ITV needs to be in 3 and 5 years Emmerdale Soap of the year 4
5 Places visited so far: Getting to know ITV Offices: London, Manchester, Leeds, people and places New York Meeting key stakeholders Newsrooms: Meridian, Granada, Yorkshire Strategic refresh well underway Coronation Street and Emmerdale Production Companies: Mammoth, Shiver, Twofour, ITV America and Talpa 5
6 Great culture talented and creative people Strong consumer brand ITV s unique proposition of mass audiences the power of TV Direct to Consumer relationships through the ITV Hub Studios is a scaled international business with a healthy pipeline of new and returning programmes Integrated producer broadcaster Strong balance sheet 6


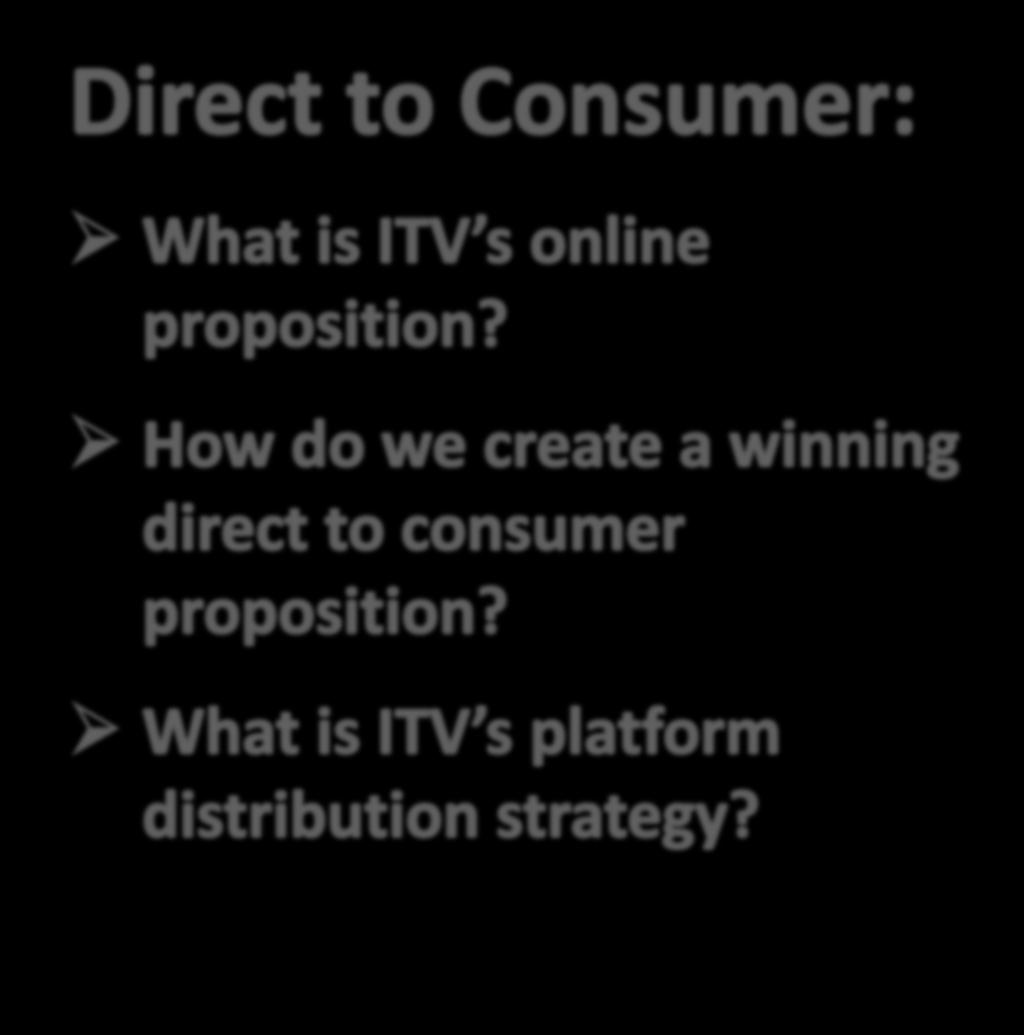
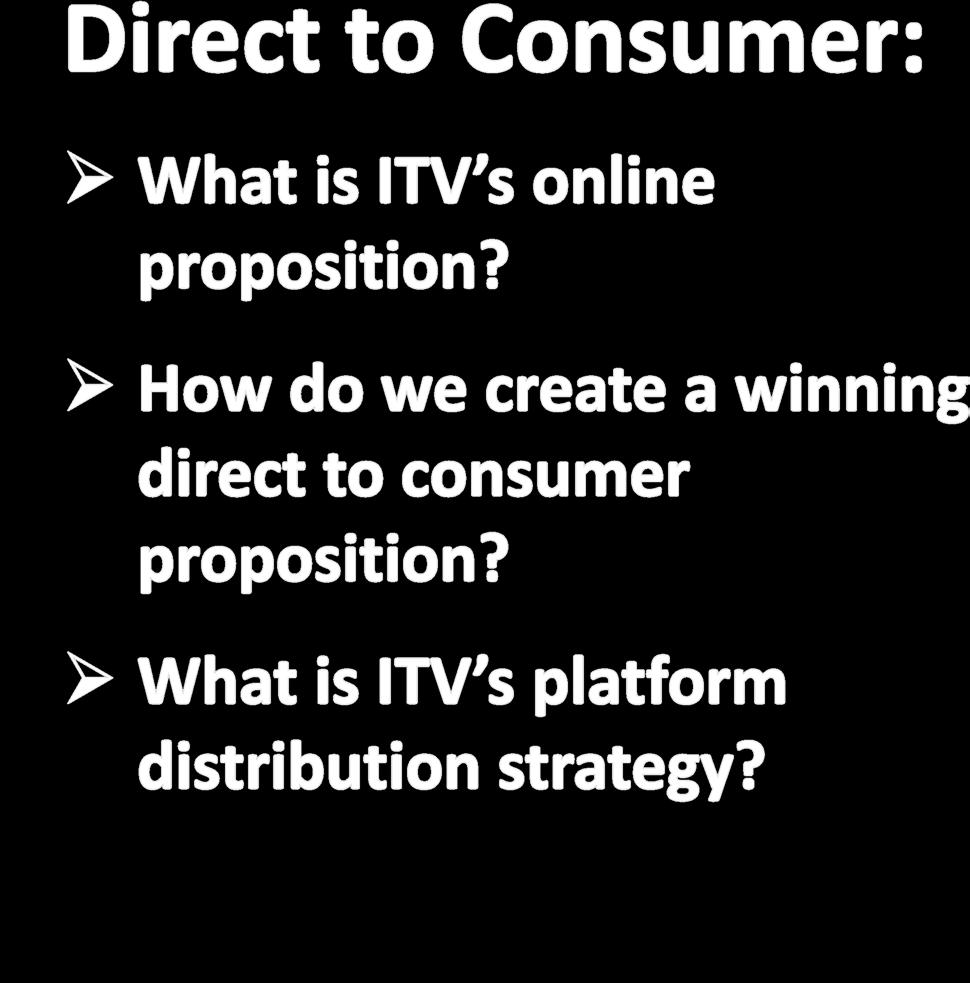
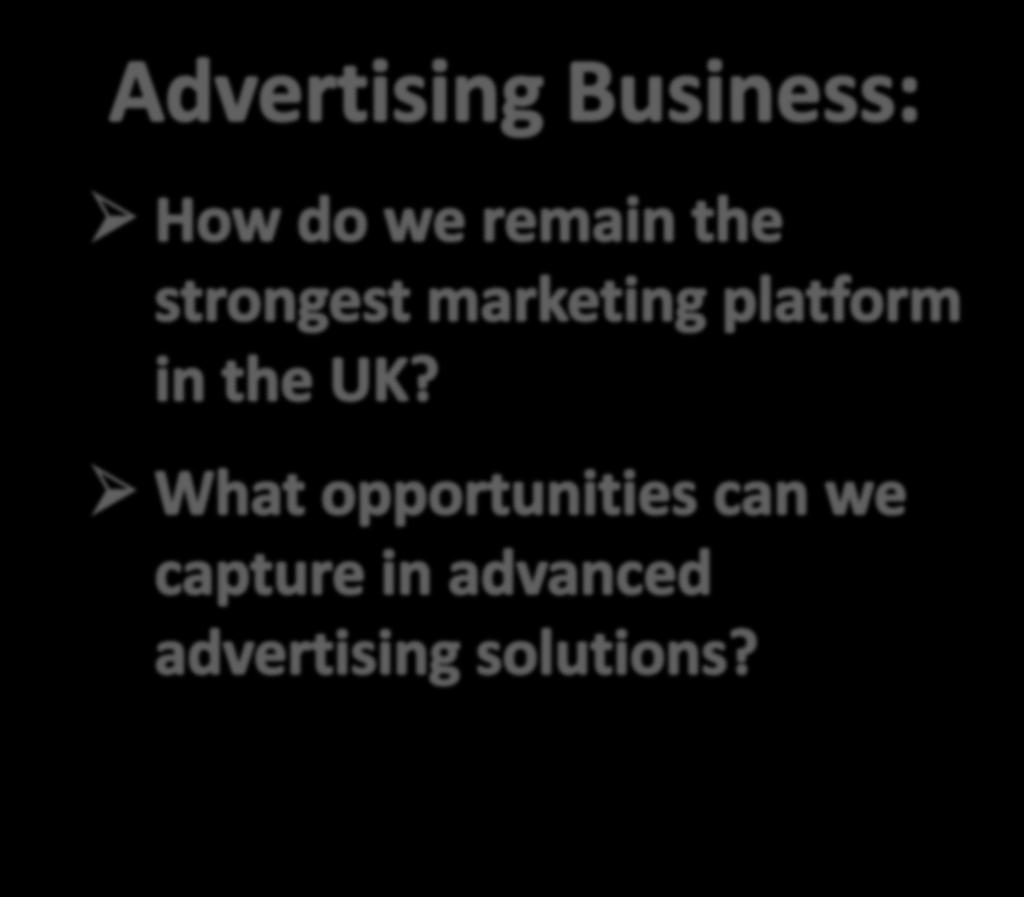
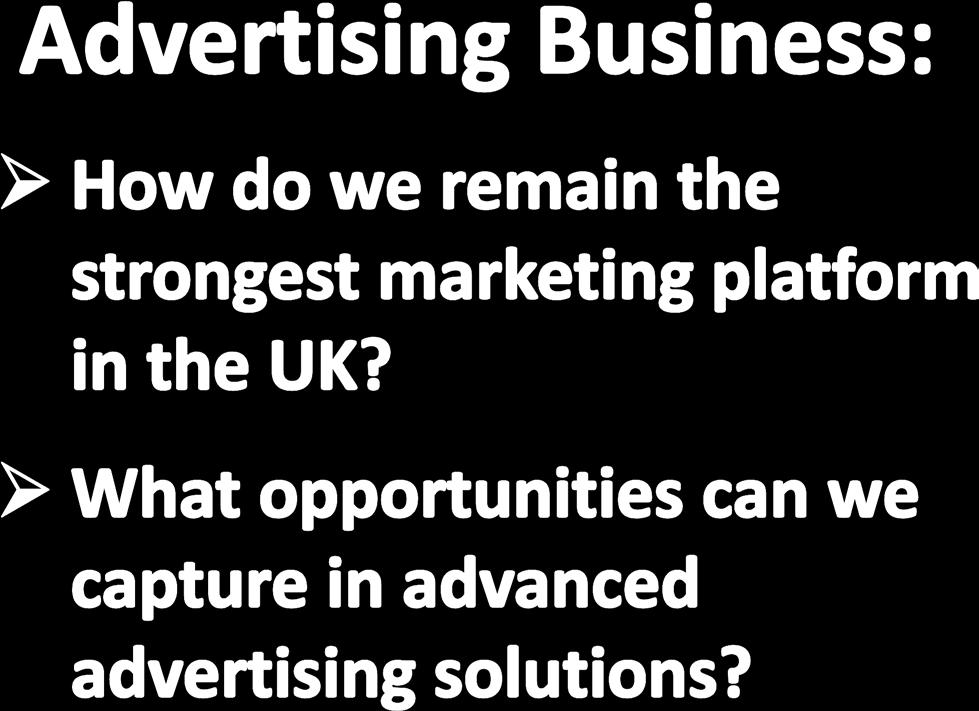
7 Data Strategy Operating Model 7

8 Operating & Financial Review Ian Griffiths ITV Horse Racing

9 Dancing on Ice 9
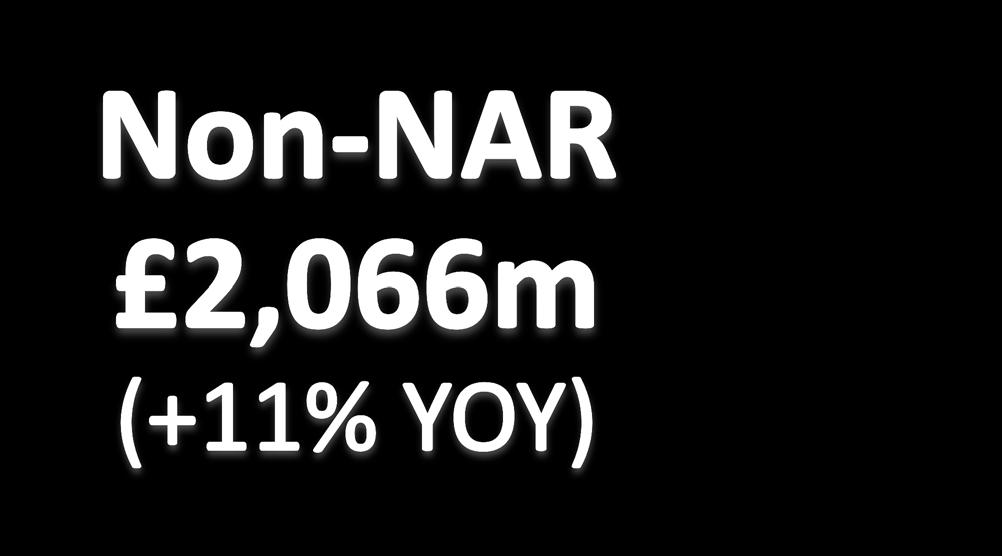
10 ITV NAR 1,591 1,672 (5) Online, Pay & Interactive SDN (external) Other commercial income Non-NAR revenue Total revenue 2,075 2,132 (3) Schedule costs (1,025) (1,050) (2) Other costs (451) (440) 3 Broadcast & Online EBITA (7) EBITA margin 29% 30% Good growth in Non-NAR partly offsetting decline in NAR ITV NAR down 5% as guided Double-digit growth in high margin VOD Schedule costs lower in non-sport year maintained investment in original commissions Cost savings offset by investment in the ITV Hub and Pay/SVOD platforms Margins down 1% to 29% 10


11 11


12 21m registered users Market leader in live simulcast 75% of UK s 16-24s registered Requests and simulcast growing faster than C4 and BBC catch-up Available on 29 platforms Only commercial PSB broadcaster to launch SVOD service, Hub+ 27m app downloads Over 250k subscribers for BritBox US and Canada 12
13 Category FY 2017 ( m) NAR down 5% as guided FY YOY % change Retail 324 (3) Entertainment and Leisure 158 (4) Finance Cosmetics and Toiletries 112 (5) Food 101 (23) Cars and Car Dealers Telecommunications Airlines, Travel and Holidays 80 (3) Publishing and Broadcasting 69 (10) Household Stores 53 (12) Others 354 (8) Total 1,591 (5) 5% 0% -5% -10% -15% 1% (4)% (7)% (9)% Q1 Q2 Q3 Q4 Quarterly YOY Moving Annual Total Total advertising down 3% including sponsorship and VOD Retail down 3% - high street weak, supermarkets increased spending FMCG advertisers have been reducing their spend but allocating more back to TV Cars and Telecommunications up year on year driven by new product launches Digital businesses continue to build brands on TV, including Netflix, Amazon, Twitter and Facebook Q continues the growth seen in Q4 H1 expected to be up, helped by the football 13
14 Studios UK ITV America Studios RoW Global Entertainment Total Studios revenue 1,582 1, Total Studios costs (1,339) (1,152) 16 ITV Studios EBITA EBITA margin 15% 17% Internal ITVS to ITV Network External revenue 1, Total revenue 1,582 1, Total revenue up 13% Good growth across all parts of the business Organic revenue, excluding currency, grew 7% Studios UK - healthy revenue growth driven by entertainment ITV America - strong growth from entertainment and scripted Studios RoW - benefitted from growth in UK and Talpa formats in Australia, France and the Nordics Global Entertainment - good slate of programmes, especially scripted Margin impacted by genre mix on new shows 43m revenue and 7m EBITA benefit from FX 14
 1,582 FY")
 Recommissions")


15 2017 ITV Studios Total Revenue ( m) ,395 (336) 1,582 FY 2016 Non-returning New shows (potential to return) Recommissions Acquisitions FX Other FY 2017 Managing the portfolio of new and returning shows is key to Studios growth New shows include Bancroft, The Voice Kids UK, 5 Gold Rings, Love Island Germany, Big Star s Little Star US, Snowpiercer Recommissions include The Voice UK, I m A Celebrity, Love Island UK, Hell s Kitchen US, Aber Bergen 15


16 *Organic excludes all acquisitions since 2012; ROI is based on EBITA and expected consideration 16
17 Scripted Hours UK US & RoW Returning Scripted Hours +277% Entertainment Hours 3,000 2,000 1, ,500 2,000 1,500 1, Returning Entertainment Hours +84% Good growth in scripted content in UK and US with new and returning series Victoria, Cold Feet, Unforgotten, Snowpiercer, Good Witch Acquisition of Tetra and Cattleya in 2017 strengthens international scripted business More entertainment formats lead to growth across the business Love Island, The Voice, The Voice Kids, I m A Celebrity Get Me Out Of Here!, Hell s Kitchen, The Chase, Come Dine with Me Revenue mix impacts margins New shows, especially scripted, have lower margins in the early years *Data incudes acquisitions 17


18 2017 Adjusted EBITA ( m) 885 (81) (37) 29 6 (15) 842 FY 2016 NAR Network Schedule Online, Pay & Interactive ITV Studios Underlying The Voice Of China FX & Other Cost Savings Investments FY 2017 NAR biggest impact on 2017 profit Offset by delivering cost savings and lower schedule costs Continued to invest in the Hub, ITV Box Office and Studios creative/scripted Good underlying profit growth in Studios, but The Voice of China included in 2016 comparatives 18

19 19
20 P&L Cash Schedule Costs Around 1,055-60m increase of around 30m and weighted to H1 due to the Football World Cup Capex Around 100m with 60m of regular capex and 40m relating to the London property move in 2018 Investments Total of around 15-20m new property, online and initial data investments Profit to cash Around 85% continued strong cash flow generation Adjusted Interest Around 35m broadly unchanged from 2017 Pension 80m deficit funding contribution no change, subject to agreeing triennial valuation Tax Adjusted effective tax rate around 19%, unchanged and expected to be sustainable over the medium term Exceptional Items Cash cost of exceptionals will be around 85m Foreign Exchange Translation impact of FX, assuming rates remain at current levels, will negatively impact revenue by 35m and profit by 5m Exceptional Items Around 85m, mainly due to acquisition accounting and London office and Studios moves 20


21 Outlook for 2018 Carolyn McCall Good Morning Britain


22 Coming up On ITV Coming up Off ITV Coming up internationally 22


23 Significant advertising and sponsorship opportunities Produced by ITV Studios Premiering on Amazon Prime in US 7 episodes 31 matches on ITV 2018 FIFA World Cup UK broadcast expected in H2 Extended run on ITV2 Multiple commercial partnerships secured Enhanced digital offerings including daily podcasts Format sold to 6 countries Vanity Fair 23

24 Strategic refresh in progress In the meantime we remain very focused on the business Strong culture - talented and creative people Strong balance sheet and healthy cash flow Committed to our ordinary dividend policy Solid foundation for the future 24


25 Q&A


26 Appendix Full Year Results
27 12 months to 31 December 2017 ( m) 2016 ( m) Change Commissions (563) (564) 0% Sport (82) (111) 26% Acquired (38) (37) (3)% ITN News and Weather (48) (48) - Total ITV main channel (731) (760) 4% Regional news and non-news (72) (70) (3)% ITV Breakfast (42) (44) 5% Total ITV incl. regional & Breakfast (845) (874) 3% ITV2, ITV3, ITV4, ITV Encore, ITVBe, CITV (180) (176) (2)% Total schedule costs (1,025) (1,050) 2% 27
28 12 months to 31 December 2017 ( m) 2016 ( m) Change Organic change* Studios UK % 9% Studios US % 28% Studios RoW % (8)% Global Entertainment % 1% Total revenue 1,582 1,395 13% 7% *At constant currencies, and excluding revenue from 2017 acquisitions 28
29 12 months to 31 December 2017 ( m) 2016 ( m) Change Adjusted EBITA (5)% Internally generated amortisation (5) (12) 58% Financing costs (33) (26) (27)% Share of losses on JVs and associates (4) - 100% Profit before tax (6)% Tax (154) (160) 4% Profit after tax (6)% Non-controlling interests (4) (4) 0% Earnings (6)% EPS (p) 16.0p 17.0p (6)% Diluted EPS (p) 16.0p 17.0p (6)% 29
30 12 months to 31 December 2017 ( m) 2016 ( m) Change EBITA (5)% Exceptional items (operating) (153) (164) (7)% Amortisation and impairment (102) (89) (15)% Operating profit (8)% Net financing costs (50) (51) 2% Share of losses on JVs and associates (4) - 100% Gain on sale of non-current assets and subsidiaries (non-operating exceptional items) (1) - 100% Profit before tax (10)% Tax (87) (100) 13% Profit after tax (9)% Loss after tax for the period from discontinuing operations - (1) 100% Non-controlling interests (4) (4) 0% Earnings (9)% EPS (p) 10.2p 11.2p (9)% Diluted EPS (p) 10.2p 11.1p (8)% 30
31 12 months to 31 December Reported ( m) Adjustments ( m) Adjusted ( m) EBITA* Exceptional items (operating) (153) Amortisation and impairment (102) 97 (5) Operating profit Net financing costs (50) 17 (33) Share of losses on JVs and Associates (4) - (4) Gain on sale of non-current assets and subsidiaries (non-operating exceptional items) (1) 1 - Profit before tax Tax (87) (67) (154) Profit after tax Non-controlling interests (4) - (4) Earnings Number of shares (weighted average)** 4,006-4,006 Earnings per share 10.2p 16.0p *Adjusted EBITA includes the benefit of production tax credits; **Diluted number of shares is 4,017m 31
32 12 months to 31 December 2017 ( m) 2016 ( m) Acquisition-related expenses (96) (131) Restructuring and property-related cost (30) (14) Insured trade receivables provision (27) - Pension curtailment - (19) Total operating exceptional items (153) (164) Non-operating exceptional items (1) - Total exceptional items (154) (164) 32
33 12 months to 31 December 2017 ( m) 2016 ( m) 161m Eurobond at 6.125% coupon Jan 17 - (7) 600m Eurobond at 2.125% coupon Sept 22 (11) (10) 500m Eurobond at 2% coupon Dec 23* (15) (1) 630m Revolving Credit Facility (4) (2) 150m and 100m Bilateral loans - (2) Financing costs directly attributable to loans and bonds (30) (22) Cash-related net financing costs (2) (3) Amortisation of bonds (1) (1) Adjusted financing costs (33) (26) Mark-to-market on swaps and foreign exchange - (3) Imputed pension interest (9) (5) Unrealised foreign exchange and other net financial losses (8) (17) Net financing costs (50) (51) * effective swapped coupon of 3.5% 33
34 12 months to 31 December 2017 ( m) 2016 ( m) Profit before tax Production tax credits Exceptional items Amortisation and impairment* Adjustments to net financing costs Adjusted profit before tax Tax charge (87) (100) Production tax credits (32) (28) Charge for exceptional items (12) (15) Charge in respect of amortisation and impairment* (19) (11) Charge in respect of adjustments to net financing costs (4) (6) Adjusted tax charge (154) (160) Effective tax rate on adjusted profits 19% 19% Total cash tax paid (including receipt of production tax credits) Total adjusted cash tax paid (excluding the receipt of production tax credits) *In respect of intangible assets arising from business combinations and investments. Also reflects the cash tax benefit of tax deductions for US goodwill. 34
35 Company Initial consideration ( m) Additional consideration paid in 2017 ( m) Expected future payments* ( m) Total expected consideration** ( m) Expected payment dates Total maximum consideration** ( m) 2017 Various Total for Total for , ,923 Total ,324 2,341 Of 292m expected future payments, 161m recorded on the balance sheet to date * Undiscounted and adjusted for foreign exchange. All future payments are performance related. ** Undiscounted and adjusted for foreign exchange, including initial consideration and excluding working capital adjustments. 35
36 2017 ( m) 2016 ( m) Adjusted EBITA Working capital movement (58) (28) Adjustment for high end production tax credits (9) 8 Share-based compensation and pension service cost Acquisition of property, plant and equipment, and intangible assets* (71) (44) Adjustment to capex relating to redevelopment of London HQ 16 - Depreciation Adjusted cash flow Profit to cash ratio 91% 97% Adjusted cash flow Net cash interest paid (38) (20) Adjusted Cash tax paid (118) (126) Pension funding (80) (80) Free cash flow *Except where disclosed, management views the acquisition of operating property, plant and equipment and intangibles as business as usual capex, necessary to the ongoing investment in the business. 36
37 31 December 2017 ( m) 2016 ( m) 630m RCF (60) - 161m Jan 17 - (161) 100m bilateral loan - (100) 600m Eurobond (529) (508) 500m Eurobond* (424) (425) Finance Leases - (4) Other debt (25) - Cash and cash equivalents Net debt (912) (637) 31 December 2017 ( m) 2016 ( m) Cash and cash equivalents Debt (1,038) (1,198) Net debt (912) (637) *Net of 20m cross currency swap (2016: 2m) 37
38 m 150 (50) 527 (250) (637) (450) (912) (650) (494) (126) (850) (95) (36) (20) (16) (15) (1,050) Dec-16 Net Debt Free cash flow Dividends Exceptional items Acquisitions and investments Purchase of shares for EBT FX on retranslation of debt London property capex Other Dec-17 Net Debt 38
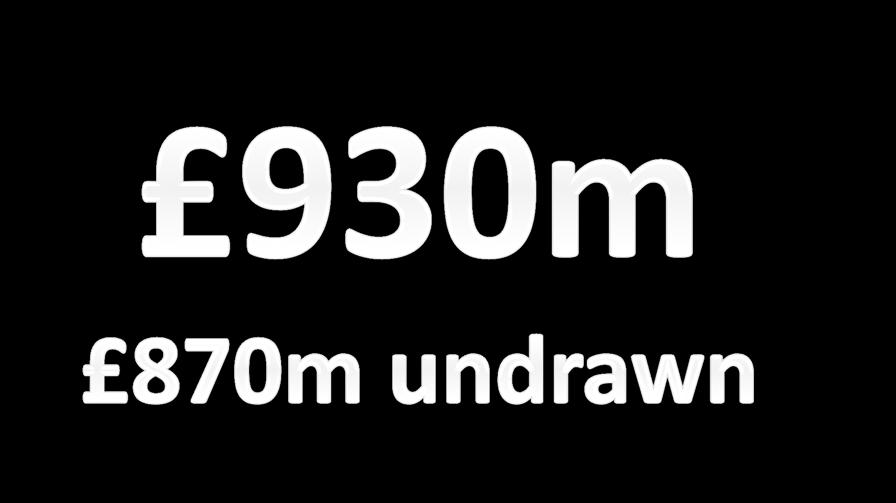
39 Type of Facility Facility Amount Amount drawn at 31/12/2017 Maturity Revolving credit facility (RCF) 630m 60m 2022, option to extend to 2023 Bilateral financing facility 300m 0m 2021 Total 930m 60m 39
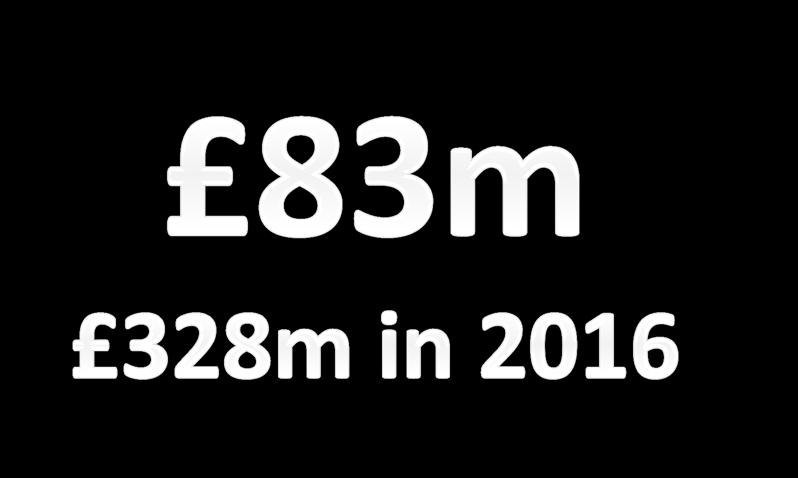
40 m (83) (100) (328) 145 (59) 6 (39) (200) 80 (300) (400) Dec 16 Deficit funding Update in scheme membership data Change in assets Change in inflation assumptions Change in bond yields Other Dec-2017 Net pension deficit 40
41 Revenue by currency 12 months to 31 December 2017 ( m) 2016 ( m) GBP 2,313 2,357 US Dollar Euro Other Currencies External revenue 3,132 3,064 Foreign Exchange Sensitivity impact of a 10% appreciation/depreciation in Sterling* Currency Revenue ( m) Adjusted EBITA ( m) USD ($) ±50-60 ±6-8 EUR ( ) ±40-50 ±4-5 *An appreciation in Sterling has a negative effect on revenue and adjusted EBITA, a depreciation has a positive effect 41
ITV on track to deliver Interim Results 2017
 ITV on track to deliver Interim Results 2017 26 July 2017 Agenda Key Messages and H1 Highlights Peter Bazalgette Half Year Financial and Operating review Ian Griffiths Q&A 2 Key Messages and H1 Highlights
Rebalanced ITV delivers continued good growth Interim Results 2016
 Rebalanced ITV delivers continued good growth Interim Results 2016 27 July 2016 Agenda Key Messages and H1 Highlights Adam Crozier Half Year Financial Results Ian Griffiths Strategic Outlook Adam Crozier
Half Year Results 2012 ITV Transformation Plan delivers double digit revenue and profit growth
 Half Year Results 2012 ITV Transformation Plan delivers double digit revenue and profit growth 0 Agenda 1 Strategic and operating review Financial review Outlook Adam Crozier Ian Griffiths Adam Crozier
Rebalanced ITV delivers continued growth Full year results for the year ended 31 st December 2016
 1 Rebalanced ITV delivers continued growth Full year results for the year ended 31 st December 2016 Revenue growth driven by double-digit increase in non-nar Total external revenue up 3% to 3,064m (2015:
Launching our new strategy from a position of strength Interim results for the six months to 30 June 2018
 Launching our new strategy from a position of strength Interim results for the six months to 30 June Carolyn McCall, ITV Chief Executive, said: We have delivered a strong operating performance with fantastic
Delivering strong growth and building scale Full year results for the year ended 31 st December 2015
 1 Delivering strong growth and building scale Full year results for the year ended 31 st December 2015 Revenue growth across all parts of the business Total external revenue up 15 at 2,972m (2014: 2,590m)
Rebalanced ITV delivers continued growth
 Rebalanced ITV delivers continued growth Full year results for the year ended 31st December Revenue growth driven by double-digit increase in non-nar Total external revenue up 3% to 3,064m (: 2,972m),
Launching our new strategy from a position of strength Interim results for the six months to 30 June 2018
 Launching our new strategy from a position of strength Interim results for the six months to 30 June Carolyn McCall, ITV Chief Executive, said: We have delivered a strong operating performance with fantastic
Rebalanced ITV delivers continued good growth
 Rebalanced ITV delivers continued good growth Interim results for the six months to 30 June Rebalanced business driving another strong performance in H1 Total external revenue up 11% to 1,503m (2015: 1,356m)
A platform for change
 A platform for change Operating review John Cresswell A more efficient business maintaining performance in a tough market Financial review Ian Griffiths Resilient financial performance and strengthened
ITV plc Final Results th March 2009
 ITV plc Final Results 2008 4th March 2009 1 Introduction Michael Grade Executive Chairman 2 Agenda Introduction and overview Financial review Current trading and strategic update Michael Grade Ian Griffiths
ITV delivers strong operational performance in an uncertain economic environment
 ITV delivers strong operational performance in an uncertain economic environment ITV plc Annual Report and Accounts for the year ended 31 December We are an integrated producer broadcaster, creating, owning
Rebalanced ITV delivers continued growth
 Rebalanced ITV delivers continued growth ITV plc Annual Report and Accounts for the year ended 31 December Strategic Report Overview We are an integrated producer broadcaster, creating, owning and distributing
Agenda. Full-year 2017 highlights. Group financials. Business & Strategy update. Outlook
 Agenda 1 2 3 4 2018 Full-year 2017 highlights Group financials Business & Strategy update Outlook 2018 2 Highlights Total Video strategy continues to pay off BROADCAST Strong results in Germany and France
Full-year results Cologne, 10 March Entertain. Inform. Engage.
 Full-year results 2015 Cologne, 10 March 2016 Entertain. Inform. Engage. Agenda 1 2 3 4 2016 Full-year 2015 highlights Group financials Business update Strategy & Outlook 2016 2 Highlights 2015 in a nutshell
DETERMINATION OF MERGER NOTIFICATION M/16/064 - BBC & ITV/BRITBOX
 DETERMINATION OF MERGER NOTIFICATION M/16/064 - BBC & ITV/BRITBOX Section 21 of the Competition Act 2002 Proposed acquisition of joint control by BBC Worldwide Americas, Inc. and ITV SVOD Holding Inc.
Final results for 52 weeks to 27 December Ralph Topping, Chief Executive Neil Cooper, Group Finance Director
 Final results for 52 weeks to 27 December 2011 Ralph Topping, Chief Executive Neil Cooper, Group Finance Director 1 Agenda Overview Ralph Topping, Chief Executive Financial highlights Neil Cooper, Group
Aegis Group plc Half Year Results. 27 August 2010
 Aegis Group plc 2010 Half Year Results 27 August 2010 Agenda Introduction John Napier, Chairman Aegis Group overview Jerry Buhlmann, CEO Divisional review Aegis Media - Jerry Buhlmann, CEO Synovate Robert
INDEPENDENT NEWS & MEDIA PLC
 INDEPENDENT NEWS & MEDIA PLC 2013 PRELIMINARY RESULTS 13 March 2014 2014 INM PLC inmplc.com Page 1 PRELIMINARY RESULTS OVERVIEW Strategic and Operating Highlights Successful completion of Financial Restructuring
INTERIM RESULTS 2015 FOR THE SIX MONTHS ENDING 30th JUNE 2015
 INTERIM RESULTS 2015 FOR THE SIX MONTHS ENDING 30th JUNE 2015 INTERIM RESULTS 2015 HIGHLIGHTS Organic revenue growth of 2%, lower than recent years as a result of: - Shift in phasing of revenues and trading
UK Television Production Survey
 UK Television Production Survey Financial Census 2017 September 2017 A report by Oliver & Ohlbaum Associates Ltd for Pact Contents 1. Summary 2. Revenue growth 3. UK commissioning trends 4. International
2018 Full Year Results 20 November 2018
 2018 Full Year Results 20 November 2018 Disclaimer Certain information included in the following presentation is forward looking and involves risks, assumptions and uncertainties that could cause actual
2017 Full Year. Results Presentation. 21 February 2018
 2017 Full Year Results Presentation 21 February 2018 CAUTIONARY STATEMENT 2017 Full Year Results Slide 2 Full Year Highlights 2017 Full Year Results Presentation 8TH YEAR OF DOUBLE-DIGIT GROWTH 2017 FINANCIAL
Aegis Group plc. 17 March 2011
 Aegis Group plc 2010 Full Year Results 2010 Full Year Results 17 March 2011 Agenda Introduction John Napier, Chairman Aegis Group overview Jerry Buhlmann, CEO Divisional review Aegis Media - Jerry Buhlmann,
Preliminary Results. 22nd February 2018
 Preliminary Results 22nd February 2018 Mark Lewis Chief Executive Officer Matthew Price Chief Financial Officer Full year themes Diversified business delivering stable returns Doing a great job for our
2017 Full Year Results. Tuesday 21 November 2017
 2017 Full Year Results Tuesday 21 November 2017 Disclaimer Certain information included in the following presentation is forward looking and involves risks, assumptions and uncertainties that could cause
Jetix Europe N.V. Financial Results Year ended September 30, 2006 November 28, 2006
 Jetix Europe N.V. Financial Results Year ended September 30, 2006 November 28, 2006 Operating Review Paul Taylor Chief Executive Officer Slide 2 Overview One of Europe s leading kids entertainment companies
HY 2018 Results. Record EBITDA & free cash flow generation. August 3, 2018
 HY 2018 Results Record EBITDA & free cash flow generation August 3, 2018 Legal Disclaimer Information in this presentation may involve guidance, expectations, beliefs, plans, intentions or strategies regarding
Electronic Arts Inc. Q3 FY 2017 Results. January 31, 2017
 Electronic Arts Inc. Q3 FY 2017 Results January 31, 2017 Safe Harbor Statement Please review our risk factors on Form 10-Q filed with the SEC. Some statements set forth in this document, including the
Agenda. Future proofing our business and Outlook. Group financials. Group highlights. Operational highlights
 Agenda 1 2 3 4 2017 Group highlights Group financials Operational highlights Future proofing our business and Outlook 2 Group highlights 'Total Video' strategy paying off A Revenue growth Solid performance
Strategy 2013 highlights. Business. segments
 1 1 2 3 4 2014 Full-year Group Business Outlook 2014 Strategy 2013 highlights financials segments update 2 1 2 3 4 Revenue Cash conversion rate YoY growth: +6.9% EBITA Margin YoY growth: +4.7% Reported
First Quarter 2018 Performance and Business Update. April 25, 2018
 First Quarter 2018 Performance and Business Update April 25, 2018 1 Important Notice Please read this management presentation together with the Company s press release issued earlier today announcing the
Q Results & 2019 Financial Guidance Call. February 7, 2019
 Q4 2018 Results & 2019 Financial Guidance Call February 7, 2019 Safe harbour notice Certain statements made in this presentation are forward-looking statements. These forward-looking statements include,
Paddy Power Betfair plc Prelim Results
 Paddy Power Betfair plc 2016 Prelim Results Financial & Operating Review [find new imagery for cover] Financial highlights 3 m, Proforma 1 2016 2015 YOY % YOY % CC 2 Revenue 1,551 1,318 +18% +11% Cost
FY17 Results. 25 September 2017
 FY17 Results 25 September 2017 Forward Looking Statement This document contains forward looking statements, which reflect management s current views and estimates. The forward looking statements involve
DISCOVERY, INC. REPORTS SECOND QUARTER 2018 RESULTS
 REPORTS SECOND QUARTER 2018 RESULTS Silver Spring, MD August 7, 2018: Discovery, Inc. ( Discovery or the Company ) (NASDAQ: DISCA, DISCB, DISCK) today reported financial results for the second quarter
INVESTOR PRESENTATION
 INVESTOR PRESENTATION IMPORTANT DISCLOSURE This presentation contains estimates and forward-looking statements made pursuant to the safe harbour provisions of the Private Securities Litigation Reform Act
Electronic Arts Inc. Q4 FY 2017 Results. May 9, 2017
 Electronic Arts Inc. Q4 FY 2017 Results May 9, 2017 Safe Harbor Statement Please review our risk factors on Form 10-Q filed with the SEC. Some statements set forth in this document, including the information
InterContinental Hotels Group PLC First Quarter Results to 31 March 2010
 InterContinental Hotels Group PLC First Quarter Results to Financial results % change % change CER Total Excluding LDs 1 Total Excluding LDs 1 Revenue 2 $362m $351m 3% 4% 0% 1% Operating profit 2 $83m
4 TH QUARTER AND FULL YEAR 2012 RESULTS
 4 TH QUARTER AND FULL YEAR 2012 RESULTS CONFERENCE CALL & WEBCAST FEBRUARY 11, 2013 5:00 PM ET NYSE: NLSN SAFE HARBOR FOR FORWARD-LOOKING STATEMENTS The following discussion contains forward-looking statements,
H1 16 interim results. 22 September 2015
 H1 16 interim results 22 September 2015 Important notice 2 This presentation may include certain forward-looking statements, beliefs or opinions, including statements with respect to the Company s business,
THE WALT DISNEY COMPANY REPORTS INCREASED THIRD QUARTER EARNINGS
 FOR IMMEDIATE RELEASE July 30, THE WALT DISNEY COMPANY REPORTS INCREASED THIRD QUARTER EARNINGS BURBANK, Calif. The Walt Disney Company today reported earnings for the third fiscal quarter and nine months
2010 Annual Results. February 10, 2011
 2010 Annual Results February 10, 2011 Disclaimer This presentation contains forward-looking statements. The use of the words "aim(s)," "expect(s)," "feel(s)," "will," "may," "believe(s)," "anticipate(s)"
RESULTS 2 nd QUARTER 2017 (IFRS, UNAUDITED)
") RESULTS 2 nd QUARTER (IFRS, UNAUDITED) July 20, Software AG. All rights reserved. SAFE HARBOR This presentation includes forward-looking statements based on the beliefs of Software AG management. Such
RESULTS 2 nd QUARTER (IFRS, UNAUDITED) July 20, Software AG. All rights reserved. SAFE HARBOR This presentation includes forward-looking statements based on the beliefs of Software AG management. Such
Second Quarter 2018 Performance and Business Update. July 25, 2018
 Second Quarter 2018 Performance and Business Update July 25, 2018 1 Important Notice Please read this management presentation together with the Company s press release issued earlier today announcing the
W W E Q 4 A N D F U L L Y E A R R E S U LT S F E B R U A R Y 8,
 W W E Q 4 A N D F U L L Y E A R 2 0 7 R E S U LT S F E B R U A R Y 8, 2 0 8 Forward-Looking Statements This presentation contains forward-looking statements pursuant to the safe harbor provisions of the
PINEWOOD GROUP PRESENTATION OF FY 2017/18 RESULTS
 PINEWOOD GROUP PRESENTATION OF FY 2017/18 RESULTS Important notice This presentation has been prepared by Pinewood Finco plc (the Issuer) and Pinewood Group Limited (the Company and, collectively with
The leading European Entertainment network. Interim financial results, June 2014
 The leading European Entertainment network Interim financial results, June 2014 Agenda 1 2 3 4 2014 5 Half-year 2014 highlights Group financials Business segments Outlook 2014 Strategic update 2 1 2 3
2017 Results Presentation
 2017 Results Presentation 27th February 2018 www.morganadvancedmaterials.com Agenda Introduction and key highlights Pete Raby 2017 results Peter Turner Operational and strategic update Pete Raby 2 Key
Preliminary Results for year ended 30 November 2015
 Preliminary Results for year ended 30 November 2015 Good progress against a challenging market backdrop 5 year planning process completed, underpins 2016 expectations Clear long term strategy being implemented
AEGIS GROUP PLC 2008 ANNUAL RESULTS. 19 March 2009
 AEGIS GROUP PLC 2008 ANNUAL RESULTS 19 March 2009 AGENDA OVERVIEW OF RESULTS John Napier FINANCIAL REVIEW Alicja Lesniak OUTLOOK John Napier Q&A Aegis Group plc Page 2 OVERVIEW OF RESULTS John Napier,
GENERAL MEETING 3 MAY Arnaud Lagardère General and Managing Partner
 GENERAL MEETING 3 MAY 2018 Arnaud Lagardère General and Managing Partner CONTENTS 1 OUR MARKETS AND THEIR TRENDS 2 OUR GROUP TODAY 3 OUR STRATEGIC VISION AND AMBITION 2 OUR MARKETS AND OUR GROUP TODAY
ARYZTA AG. H1 Results, FY 2013 Fixed Income Investor Presentation 11 March 2013
 ARYZTA AG H1 Results, FY 2013 Fixed Income Investor Presentation 11 March 2013 Forward Looking Statement This document contains forward looking statements which reflect management s current views and estimates.
3 RD QUARTER 2013 RESULTS CONFERENCE CALL & WEBCAST
 3 RD QUARTER 2013 RESULTS CONFERENCE CALL & WEBCAST OCTOBER 23, 2013 8:30AM ET / 2:30PM CET NYSE: NLSN SAFE HARBOR FOR FORWARD-LOOKING STATEMENTS The following discussion contains forward-looking statements,
Following is a copy of the Presentation of Results for the financial half-year ended 29 December 2012.
 20 February 2013 Company Announcements Office Australian Securities Exchange Limited 20 Bridge Street Sydney NSW 2000 By electronic lodgment Total Pages: 27 (including covering letter) PRESENTATION OF
NEMETSCHEK GROUP Financial Results Q3 / 9M 2017
 Barco One Campus, Kortrijk, Belgium Architects: Jaspers-Eyers Architects Engineering Office: Establis Image: Marc Detiffe Realized with GRAPHISOFT and SCIA NEMETSCHEK GROUP Financial Results Q3 / 9M 2017
9M 2017 Results. Ongoing strong growth and acceleration of cash flow generation. October 31, 2017
 9M 2017 Results Ongoing strong growth and acceleration of cash flow generation October 31, 2017 Legal Disclaimer Information in this presentation may involve guidance, expectations, beliefs, plans, intentions
DARING TO ADAPT 2015 Half-Year Results 31 August 2015
 DARING TO ADAPT 2015 Half-Year Results 31 August 2015 GROUP SUMMARY Sales: EUR 3.2 billion, +8.6% Current consolidated result before tax, group s share, better than anticipated thanks to a favourable currency
Q4 AND FY 2015 RESULTS. Harold Goddijn CEO Taco Titulaer CFO 9 February 2016
 Q4 AND FY 2015 RESULTS Harold Goddijn CEO Taco Titulaer CFO 9 February 2016 CONSUMER OPERATIONAL HIGHLIGHTS Within Drive, we maintained our leading market position and continued to strengthen our navigation-based
2012 PRELIMINARY RESULTS & FINANCIAL RESTRUCTURING
 INDEPENDENT NEWS & MEDIA PLC 2012 PRELIMINARY RESULTS & FINANCIAL RESTRUCTURING 26 April 2013 2013 INM PLC inmplc.com Page 1 DEBT RESTRUCTURE - OVERVIEW Agreement reached on Debt Restructure will put the
Electronic Arts Inc. Q2 FY 2018 Results. October 31, 2017
 Electronic Arts Inc. Q2 FY 2018 Results October 31, 2017 Safe Harbor Statement Please review our risk factors on Form 10-Q filed with the SEC. Some statements set forth in this document, including the
PINEWOOD GROUP PRESENTATION OF Q3 2017/18 RESULTS
 PINEWOOD GROUP PRESENTATION OF Q3 2017/18 RESULTS Important notice This presentation has been prepared by Pinewood Finco plc (the Issuer) and Pinewood Group Limited (the Company and, collectively with
9 May Half Year Results
 9 May 2018 2018 Half Year Results Disclaimer Certain information included in the following presentation is forward looking and involves risks, assumptions and uncertainties that could cause actual results
Analyst Presentation. 31 March 2012
 Analyst Presentation 31 March 2012 Welcome Financial results Giles Willits CFO Business overview Darren Throop CEO No.1 independent multi-territory distributor Analyst Presentation 2012 1 FINANCIAL RESULTS
Preliminary Results Pro forma 12 months ended 30 September 2008
 Preliminary Results Pro forma 12 months ended 30 September 2008 2 December 2008 Introduction Manny Fontenla-Novoa, CEO Financial review Jürgen Büser, CFO Strategy update, current trading & outlook Manny
Full Year Results. for the year ended 31 August October 2018
 Full Year Results for the year ended 31 August 2018 17 October 2018 Nick Beighton CEO FY 2018 Highlights Another strong trading performance Including an acceleration in P4 to +29% Our biggest ever investment
Q Results. Strong start in May 3, 2016
 Q1 2016 Results Strong start in 2016 May 3, 2016 Legal Disclaimer Information in this presentation may involve guidance, expectations, beliefs, plans, intentions or strategies regarding the future. These
INDEPENDENT NEWS & MEDIA PLC 2011 PRELIMINARY RESULTS
 INDEPENDENT NEWS & MEDIA PLC 2011 PRELIMINARY RESULTS 2012 INM PLC www.inmplc.com Page 1 PRELIMINARY RESULTS FOR 2011 OVERVIEW EBIT of 75.5m in line with market guidance Results reflect continuing economic
BT Group plc. Q2 2015/16 results. 29 October 2015
 BT Group plc Q2 2015/16 results 29 October 2015 Forward-looking statements caution Certain statements in this presentation are forward-looking and are made in reliance on the safe harbour provisions of
INDEPENDENT NEWS & MEDIA PLC 2013 INTERIM RESULTS. 30 August INM PLC inmplc.com Page 1
 INDEPENDENT NEWS & MEDIA PLC 2013 INTERIM RESULTS 30 August 2013 2013 INM PLC inmplc.com Page 1 INTERIM RESULTS OVERVIEW H1 2013 - Financial Summary for Continuing Group * Euro millions 2013 2012 % Revenue
PROFIT BEFORE TAX GROWTH OF 13.5% TO 15.1M, GROUP DEBT CLEARED AND CASH POSITIVE
 PROFIT BEFORE TAX GROWTH OF 13.5% TO 15.1M, GROUP DEBT CLEARED AND CASH POSITIVE Dublin and London 28 August 2015: Independent News & Media PLC (INM ID, INM LN) today announced its results for the six
August 2011
 August 2011 www.inmplc.com 1 OVERVIEW/ OPERATIONS ANALYSIS GK O Reilly Chief Executive Officer DISCLAIMER Forward Looking Information: This presentation contains forward-looking statements, which are subject
TWELVE MONTHS END 31 MARCH 2018 MARCO GOBBETTI
 TWELVE MONTHS END 31 MARCH 2018 MARCO GOBBETTI CHIEF EXECUTIVE OFFICER 1 AGENDA INTRODUCTION FINANCIAL RESULTS GUIDANCE STRATEGIC UPDATE Q&A FY 2018 HIGHLIGHTS Results in line with our expectations Group
1st Half 2010 Results. July 29, 2010
 Results July 29, 2010 1 Disclaimer This presentation contains forward-looking statements. The use of the words "aim(s)," "expect(s)," "feel(s)," "will," "may," "believe(s)," "anticipate(s)" and similar
2017 Full Year Results
 2017 Full Year Results Title of the presentation 2 lines Location, Date, Author Paris February 15 th, 2018 Disclaimer This presentation may contain forward-looking statements, Such statements may include
Year end results 30 June Jon Macdonald Caroline Rawlinson Colin Rohloff
 Year end results 30 June 2016 Jon Macdonald Caroline Rawlinson Colin Rohloff CEO CFO IR Overview Full year YoY H2 YoY Revenue $218m +9.2% $112m +9.4% Expenses $76m +17.8% $38m +16.9% EBITDA 1 $140m +4.5%
H1 2014/15 Results 13 May 2015
 H1 2014/15 Results 13 May 2015 Riu Palace Cabo San Lucas Forward-Looking Statements This presentation contains a number of statements related to the future development of TUI. These statements are based
2017 Full Year Results. 22 November 2017
 2017 Full Year Results 22 November 2017 Agenda Highlights - Peter Fankhauser CEO Financial results Strategic progress Current trading and outlook Page 2 Strong demand for our holidays driving growth Revenue
DARING TO ADAPT 2015 Full-Year Results 25 February 2016
 DARING TO ADAPT 2015 Full-Year Results 25 February 2016 GROUP SUMMARY Results of both activities improved significantly in FY 2015 Group sales: EUR 6.0 billion, +10.7% Current PBT, group s share: EUR 212.1
November 2017 Mike Poteshman Executive VP & CFO
 November 2017 Mike Poteshman Executive VP & CFO Forward looking statements We are making some forward looking statements today that use words like outlook or target or similar predictive words. Such forward
21% REVIEW OF THE YEAR
 REVIEW OF THE YEAR We have had another strong year of growth in which more customers took more products than ever before. High Definition (HD) was a standout performance reaching 30% penetration of the
PRELIMINARY RESULTS 2014 FOR THE YEAR ENDING 31st DECEMBER Tuesday 3rd March 2015
 PRELIMINARY RESULTS 2014 FOR THE YEAR ENDING 31st DECEMBER 2014 Tuesday 3rd March 2015 PRELIMINARY RESULTS 2014 HIGHLIGHTS Strong organic revenue growth of 6% Underlying PBT increased by 3% Established
2016 INTERIM RESULTS. Robert Pitt Group CEO Ryan Preston Group CFO
 2016 INTERIM RESULTS Robert Pitt Group CEO Ryan Preston Group CFO NOTE REGARDING FORWARD-LOOKING STATEMENTS Some statements in this announcement are forward-looking. They represent our expectations for
Jetix Europe N.V. Financial Results For the year ended September 30, November 15, Slide 1
 Jetix Europe N.V. Financial Results For the year ended September 30, 2007 November 15, 2007 Slide 1 Operating Review Paul Taylor Chief Executive Officer Slide 2 Overview One of Europe s leading kids entertainment
21ST CENTURY FOX REPORTS FIRST QUARTER INCOME FROM CONTINUING OPERATIONS ATTRIBUTABLE TO 21ST CENTURY FOX STOCKHOLDERS OF $1.
 21ST CENTURY FOX REPORTS FIRST QUARTER INCOME FROM CONTINUING OPERATIONS ATTRIBUTABLE TO 21ST CENTURY FOX STOCKHOLDERS OF $1.29 BILLION TOTAL SEGMENT OPERATING INCOME BEFORE DEPRECIATION AND AMORTIZATION
FY16 YEAR END RESULTS 5 APRIL 2016
 FY16 YEAR END RESULTS 5 APRIL 2016 DEFINITIONS AND IMPORTANT NOTICE The following definitions apply throughout Trading EBITDA (earnings before interest, tax, depreciation and amortisation): excludes exceptional
ARYZTA AG. H1 Results, FY March 2017
 ARYZTA AG H1 Results, FY 2017 13 March 2017 Forward Looking Statement This document contains forward looking statements which reflect the Board of Directors' current views and estimates. The forward looking
Interim Results 2018/19
 Interim Results 2018/19 Martin Morgan, Executive Chairman Richard Amos, Chief Financial Officer London, 21 February 2019 Safe Harbour Statement This presentation and the subsequent question and answer
First Quarter Earnings Release. April 22, 2015
 First Quarter 2015 Earnings Release April 22, 2015 Forward Looking Statements We are making some forward looking statements today that use words like outlook or target or similar predictive words. Such
Full Year Results 2014
 Legal disclaimer Information in this presentation may involve guidance, expectations, beliefs, plans, intentions or strategies regarding the future. These forward-looking statements involve risks and uncertainties.
Half Year Results. for the six months ended 30 November January Chairman Chris Stone CEO Adam Palser CFO Brian Tenner
 Half Year Results for the six months ended 30 November 2017 16 January 2018 Chairman Chris Stone CEO Adam Palser CFO Brian Tenner Agenda Overview and strategy update Financial highlights Financial performance
2017 Interim Results Presentation
 2017 Interim Results Presentation 28 th July 2017 www.morganadvancedmaterials.com Agenda Introduction and key highlights Pete Raby 2017 interim results Peter Turner Operational and strategic update Pete
FULL YEAR RESULTS PRESENTATION 2017 RESULTS FOR YEAR ENDED 30 NOVEMBER 2017
 FULL YEAR RESULTS PRESENTATION 2017 RESULTS FOR YEAR ENDED 30 NOVEMBER 2017 2017 Overview Encouraging full year performance with strong Q4 and exit rate into 2018 Adjusted profit before tax up 9% to 44.5m
2nd quarter 2017 results
 2nd quarter 2017 results Europe gaining further momentum Jacques van den Broek, CEO Robert Jan van de Kraats, CFO Randstad Holding nv disclaimer & definitions Certain statements in this document concern
2017/18 Half Year Results De La Rue plc 21 November 2017
 2017/18 Half Year Results De La Rue plc 21 November 2017 Page 1 Agenda Overview Martin Sutherland Financial performance Jitesh Sodha Strategic update Martin Sutherland Operational review Martin Sutherland
Ulf Santjer, Tel Dieter Bock, Tel
 For immediate release MEDIA CONTACT: INVESTOR CONTACT: Ulf Santjer, Tel. +49 9132 81 2489 Dieter Bock, Tel. +49 9132 81 2261 Herzogenaurach, Germany, February 10, 2006 PUMA AG announces its consolidated
Quarter ended 30 September Financial results & business update
 Quarter ended 30 September 2013 Financial results & business update 22 October 2013 Disclaimer Any remarks that we may make about future expectations, plans and prospects for the company constitute forward-looking
HALF YEAR RESULTS PRESENTATION 2018 RESULTS FOR THE SIX MONTHS ENDED 31 MAY 2018
 HALF YEAR RESULTS PRESENTATION 2018 RESULTS FOR THE SIX MONTHS ENDED 31 MAY 2018 2018 Overview Encouraging first half performance with accelerated momentum in Q2 Adjusted operating profit +6% to 20.4m
Year end report. January-December st of January 2018 Mikael Ericson, President and CEO Erik Forsberg, CFO
 Year end report January-December 2017 31 st of January 2018 Mikael Ericson, President and CEO Erik Forsberg, CFO Agenda 1. Highlights for the fourth quarter and FY 2017 2. Key messages from Capital Markets
Full Year Results 2018
 Full Year Results 2018 13 th February 2019 HT&E Limited ABN 95 008 637 643 Executive Summary Executive Summary Statutory Results Statutory Results Operational Performance Operational Performance Financial