Thematic Evaluation. Evaluation of IDB Group s Work Through Financial Intermediaries
|
|
|
- Ashley Bradford
- 6 years ago
- Views:
Transcription


1 Thematic Evaluation Evaluation of IDB Group s Work Through Financial Intermediaries
2 Original: English Evaluation of IDB Group s Work Through Financial Intermediaries Office of Evaluation and Oversight, OVE March 2016
3 This work is distributed under a Creative Commons license (CC BY-NC-ND 3.0 US). You are free to share, copy and redistribute the material in any medium or format, Under the following terms: Attribution - You must give appropriate credit, provide a link to the license, and indicate if changes were made. You may do so in any reasonable manner, but not in any way that suggests the licensor endorses you or your use. Non-Commercial - You may not use the material for commercial purposes. No Derivatives - If you remix, transform, or build upon the material, you may not distribute the modified material. No additional restrictions - You may not apply legal terms or technological measures that legally restrict others from doing anything the license permits. The link provided above includes additional terms and conditions of the license. Inter-American Development Bank, 2016 Office of Evaluation and Oversight 1350 New York Avenue, N.W. Washington, D.C RE CII/RE-18
4 Table of contents Acknowledgements Acronyms and Abbreviations Executive Summary 1. Evaluation Focus and Approach... 1 A. Access to finance in LAC... 2 B. Evaluation questions and methodology Portfolio and Objectives of FI Operations... 7 A. Portfolio overview... 7 B. Portfolio by product line... 9 C. Objectives of FI operations Design and Implementation of FI Operations A. How were FI clients selected?...17 B. What IDBG instruments were used?...20 C. How did the various windows determine eligibility and structure loans?...21 D. How did IDBG perform in terms of efficiency and speed?...24 E. How were E&S safeguards handled?...26 F. How were results monitored and lessons shared?...29 G. What internal incentives appear to drive IDBG s FI operations? Results for Clients and the IDB Group...33 A. Did IDBG FI operations expand access to finance for relevant beneficiaries?...34 B. Did IDBG support improve the performance and sustainability of client FIs?...40 C. Did IDBG FI operations enhance the functioning of FI markets?...42 D. Did IDBG FI operations help to improve the performance of beneficiaries?...45 E. How did IDBG FI operations affect IDBG s own profitability?...47 F. Did FI operations enhance IDBG s role in supporting the private sector in LAC? Conclusions and Recommendations Notes iii
5 Table of contents Electronic Annexes: Annex I Evaluation Portfolio and Sampling Approach Annex II Beneficiaries of FI Operations Annex III Portfolio Characterization by Window Annex IV Detailed Objectives by IDBG Window Annex V Evaluation Methodology Annex VI Cases from Selected FIs ELECTRONIC BACKGROUND REPORTS SME Finance Trade Finance Housing Finance Leasing and Factoring Green Lending Environmental and Social Safeguards Benchmarking of Development Finance Institutions OVE Survey of IDBG Staff OVE Survey of FI Clients IDBG External Feedback Survey for FI clients Country Profiles iv Evaluation of IDB Group s Work Through Financial Intermediaries
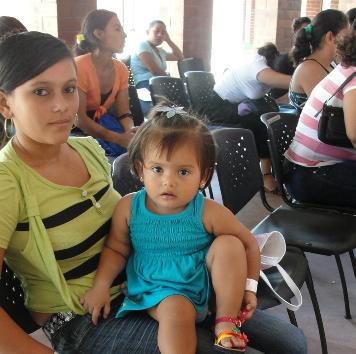
6 Acknowledgements This document was prepared under the guidance of Cheryl Gray (OVE Director) by a team composed of Roland Michelitsch and Alejandro Soriano (team leaders); the following OVE staff, research fellows, and consultants: Roni Szwedzki, Jose Claudio Pires, Eva Bolza-Schünemann, Danya Li Churanek, Ernesto Cuestas, Rocío Funes Aguilera, Juan Felipe Murcia Guerrero, Raphael Seiwald, Rafael Alcántara Sánchez, María Cabrera Escalante, Maria Camila García Jiménez, Ana Ramírez-Goldin, Mauricio Torres Velasquez, and Felipe Vargas Gomez; and external consultants Scott Stevenson, Nora D Alessio, Marco Aurelio Gonzalez Revatta, and Nathaniel Russell. Additional OVE staff Monika Huppi, Veronica Gonzalez Diez, Ulrike Haarsager, Jonathan Rose, Adriana Molina, Juan Manuel Puerta, and Lynn Scholl also provided valuable comments during OVE s internal review process. More than 300 people were interviewed or participated in the workshops and indepth surveys conducted for this evaluation. They encompassed both IDBG staff and external parties, including financial regulators, central bankers, commercial bankers, heads of banking associations, financial experts, academics, and representatives from other non-banking financial companies and financial technology companies. An expanded list of these counterparts is available in the various background reports supporting this evaluation. OVE owes special gratitude to the following IDBG staff who constructively contributed to the evaluation process: John Beckham, Gema Sacristán Postigo, Juan Antonio Ketterer, Tomás Miller Sanabria, Luiz Ros, Rachel Robboy, Laura Oradei-Bayz, Sandra Darville, Angela Miller, Jesús Fernández Muñoz, Jorge Roldán, Guillermo Collich, Maria Kronsteiner, Cornelius Roschanek, Karina Azzinnari, Gloria Lugo, Marisela Alvarenga, Hans Schulz, Nathaniel Jackson, Sergio Navajas, Verónica Trujillo, and Yuri Soares. Special thanks also go to IDB s Knowledge and Learning Department, and particularly to Alejandra Maruri and Carlos Molina, with whom OVE co-created a course on Analyzing LAC Financial Intermediaries. Similarly, OVE is very grateful to IDBG personnel in the 10 country offices where we conducted missions and workshops for this evaluation: Argentina, Brazil, Chile, Peru, Jamaica, Mexico, Costa Rica, El Salvador, Paraguay, and Colombia. In addition, we thank all IDBG staff and client financial institutions in the remaining countries that were interviewed remotely or independently surveyed in the context of this evaluation. Finally, OVE thanks the final beneficiaries, including SMEs, green companies, and woman entrepreneurs, who kindly shared their stories with us to illustrate the effects greater access to finance has had on their own development and well-being. v
7 Acronyms and Abbreviations 1TFI 2TFI A2F BNDES BOP CABEI CAF CAGR CAR CMF DEG DFI E&S EFS EIB ESG ESMS EU FELABAN FI FMO GDP IDB IDB-9 IDBG IIC IO LAC LLA M&E MIF MSME NBFI NPL NSG OMJ OPIC OVE PROPARCO ROA ROE SCF SG First-tier financial institution Second-tier financial institution Access to finance Banco Nacional de Desenvolvimento Economico e Social (Brazilian Development Bank) Base of the Pyramid Central American Bank for Economic Integration Corporación Andina de Fomento (Development Bank of Latin America) Compounded annual growth rate Capital adequacy ratio Capital Markets and Financial Institutions Division, IDB Deutsche Investitions- und Entwicklungsgesellschaft (German DFI) Development finance institution Environmental and social External Feedback System European Investment Bank Environmental, social, and governance Environmental and social management system European Union Latin American Bankers Association Financial intermediary Financierings-Maatschappij voor Ontwikkelingslanden (Dutch Development Bank) Gross domestic product Inter-American Development Bank IDB s Ninth General Capital Increase Inter-American Development Bank Group Inter-American Investment Corporation Investment officer Latin America and the Caribbean Loan loss allowance Monitoring and evaluation Multilateral Investment Fund Micro, small, and medium-sized enterprise Non-bank financial institution Nonperforming loan Non-sovereign-guaranteed Opportunities for the Majority Overseas Private Investment Corporation (United States DFI) Office of Evaluation and Oversight Société de promotion et de participation pour la coopération économique (French DFI) Return on assets Return on equity Structured and Corporate Finance Department Sovereign-guaranteed vi Evaluation of IDB Group s Work Through Financial Intermediaries
8 Acronyms and Abbreviations SME TA TFFP Small and medium-sized enterprise Technical assistance Trade Finance Facilitation Program vii

9 Among FIs, commercial banks are the main provider of credit to private sector firms in LAC. Credit to the private sector averages about 40% of LAC s GDP. About 85% of this credit is granted by approximately regulated FIs operating in LAC, of which about 800 are full commercial banks. Brandon Doran
10 Executive Summary This evaluation assesses the lending of the Inter-American Development Bank Group (IDBG) through financial intermediaries (FIs) from 2005 to It focuses on FI operations, an instrument IDBG uses to increase access to finance (A2F) in Latin American and the Caribbean (LAC) by supporting lending by regulated FIs (mostly commercial banks) to relevant beneficiaries. IDBG used FI operations intensively during the period. IDBG Management considers such operations to be a cost-effective mechanism to reach a large number of relevant beneficiaries. They are also a source of significant and relatively stable income for IDBG, and are thus important to its financial sustainability and growth. This is the first comprehensive evaluation the Office of Evaluation and Oversight has conducted on FI operations. It covers FI operations managed by all IDBG windows. These include three units within IDB: Capital Markets and Financial Institutions (CMF), which makes sovereign-guaranteed (SG) loans to the public sector, and Structured and Corporate Finance (SCF) and Opportunities for the Majority (OMJ), which make non-sovereign-guaranteed (NSG) loans to the private sector. IDBG also includes two windows outside of IDB the Inter-American Investment Corporation (IIC) and the Multilateral Investment Fund (MIF) that also work with the private sector. The evaluation comes at a critical moment for IDBG, with the merging of three IDBG private sector windows IIC, SCF, and OMJ into an expanded IIC. The consolidation aims to address the organizational fragmentation derived from overlapping mandates and different governance structures, balance sheets, and operating models. It also aims to improve synergies between public and private sector activities. But even after the consolidation, FI operations will continue to be managed by separate IDBG windows in IDB, IIC, and MIF. ix
11 Many factors affect A2F in LAC countries. On the supply side, potential constraints include limited liquidity (particularly for longer term-financing); information asymmetries (which can affect risk perceptions); lack of knowledge on how to serve certain market segments; and lack of competition, which leads to higher interest rates. Institutional factors, such as weak regulatory environments, inadequate creditor protections, and an absence of credit information, can also constrain the growth of credit markets. FI operations can address only some of these barriers. FI operations primarily provide funding to client FIs on attractive terms (especially longer tenors), with the expectation that this will make the FIs better able to serve relevant beneficiaries. To a lesser degree, FI operations also provide guarantees to incentivize FIs to extend credit for certain beneficiaries or types of projects that are of interest to IDBG. Finally, some FI operations focus on strengthening client FIs through equity investments or technical assistance. IDBG has a variety of other instruments that are better suited than FI operations to address other barriers constraining credit to relevant beneficiaries, such as problematic regulatory frameworks or the low creditworthiness of potential borrowers. For example, OVE s FI client survey showed that over half (59%) of client FIs perceived high informality amongst SMEs (small and mediumsized enterprises) as the main barrier, while FI funding constraints were an issue for only 18% of IDBG FI clients. In fact, OVE s survey shows that the availability of additional funding rarely drives FIs (9% of cases) to pursue a new business segment, while the perception of a business opportunity is frequently cited as the dominant factor (57% of cases). Portfolio and Objectives Between 2005 and 2014, IDBG approved 466 FI operations totaling $17 billion, accounting for about 14% of total IDBG approvals in the period. Over that period, approvals averaged $1.7 billion annually, briefly increasing to $3.7 billion annually in 2008 and 2009 during the global financial crisis. The funding was split about equally between SG loans to public entities (generally second-tier development banks, or 2TFIs) and NSG loans to private FIs. Lending was concentrated in higher-income countries, with about half going to two countries, Brazil and Mexico. More than four-fifths were senior loans and 13% were hybrid loan-guarantees; pure guarantees and subordinated loans and equity were very little used. Two-thirds of the approved amounts were disbursed; most of the undisbursed funds were liquidity lines approved during the financial crisis and guarantees used for contingency purposes. FI operations focused on six main product lines: SME financing (46% of approved amounts); housing finance (19%); trade finance, mostly through the Trade Finance Facilitation Program, or TFFP (13%); financing facilities providing liquidity to FIs through the Liquidity Program for Growth and Sustainability (12%); green lending (8%); and leasing and factoring (2%). x Evaluation of IDB Group s Work Through Financial Intermediaries
12 Executive Summary OVE found no single IDBG strategy for FI operations; instead, the different IDBG windows set their own objectives. The strategic objectives were set out more or less formally in documents of all kinds charters, mandates, sector frameworks, country strategies, business plans, programs, and guidelines. Project approval documents and contracts set out objectives for individual operations. Objectives for FI operations were set at three levels: FIs, final beneficiaries, and IDBG. A key objective was to expand A2F for targeted beneficiaries. FI operations also sought to improve the performance and sustainability of client FIs, and to a lesser extent to enhance the functioning of financial markets, promote innovation, and improve the performance of beneficiaries. Finally, IDBG also set objectives for itself regarding FI operations, including developing a leadership position in LAC, building knowledge and relationships, and achieving profitability. Selection, Structuring, and Implementation of FI Operations Only one-fifth of IDB Country Strategies during the evaluation period included the financial sector as a priority, even where IDBG had significant FI operations. Threequarters of FI approvals were in countries where the financial sector was not included in the Country Strategy as a priority. This reflected in part the relatively little attention given to private sector activities in these strategies, as well as the limited SG-NSG collaboration in the IDBG. The lack of diagnosis of A2F issues at the country level impeded the strategic selection of FI operations. Thus almost half of NSG operations originated opportunistically out of client requests, often during IDBG meetings with clients at periodic banking events. Country authorities commonly requested SG operations to advance public policy goals in their countries. Given the absence of overarching strategic goals for FI operations or a formal process to allocate FI operations across windows, different windows approached the same clients, sometimes competing with each other. Almost one-fourth of FIs received financing from at least two windows, with the biggest overlap between SCF and IIC. Three of the 2TFIs supported by CMF also received financing from NSG windows, and FIs reached through NSG operations were also sometimes reached indirectly through SG operations. IIC and particularly SCF focused mainly on the largest banks in each country. SCF approved operations with banks that, on average, ranked third in the country in terms of assets, while IIC s operations were on average with the fifth-largest bank. Working with the top FIs was partly driven by credit risk and cost considerations, with little focus on competition, even though LAC s financial systems all exhibit signs of limited competition. About 28% of IDBG s FI operations included technical assistance (TA). Most of the TA was connected with CMF lending to the public sector. As in other development finance institutions (DFIs), TA in IDBG could potentially be fee-based, but to date xi

13 FI operations focused on six main product lines of which SME financing accounted for 46%. IDB IDBG has provided it free of charge, without consideration of the degree to which it has funded a private or public good. Because TA is often donor-funded and can be difficult and slow to access, many investment officers (IOs), pressured to meet financial volume targets, report forgoing it altogether. FI operations were typically analyzed for eligibility on their individual merits; only IIC followed a portfolio view. NSG windows actively scrutinized first-tier FIs (1TFIs), while CMF delegated this due diligence to 2TFIs. This could result in 2TFIs using IDBG funds to finance 1TFIs that would not receive IDBG financing from NSG windows. NSG windows set prices in line with the market, while SG windows used a low flat price, potentially subsidizing FIs and beneficiaries. CMF provided longer tenors to 2TFIs than NSG windows provided to commercial banks (or 1TFIs), though lack of data prevented OVE from tracking tenors from client 2TFIs to banks. In a few cases, IDBG used incentives (mostly financial) to encourage FIs to meet certain conditions, a practice that some other DFIs also use. IDBG structured most FI operations by attempting to track the use of its proceeds, despite the fungibility of funding within FIs. For most lending, all IDBG windows set certain eligibility criteria and required FIs to submit a list of projects that would fulfill those criteria. FI clients told OVE that they selected projects that they thought would meet IDBG criteria from among their broader client base. If IDBG rejected xii Evaluation of IDB Group s Work Through Financial Intermediaries
14 Executive Summary any of those projects (for example, because of environmental and social concerns), the client FIs replaced them, even though they had already funded them. Attention to the performance of overall portfolios varied among the NSG windows (with IIC putting less emphasis on them, SCF starting to track them recently, and MIF and OMJ generally tracking them), whereas SG lending continued to focus primarily on tracking IDBG proceeds. For both public and private windows, FI operations were processed faster than non-fi operations, contributing significantly to the overall efficiency of the IDBG. The number of days from the initial assessment or proposal to approval was consistently lower for FI operations than for non-fi operations, with only a very brief exception at the height of the financial crisis. Also, large FI operations were processed faster than similar-sized non-fi operations. Despite this, FI clients are still not very satisfied with IDBG s processing times. Like other aspects of project design and implementation, environmental and social (E&S) safeguards were handled differently by the IDBG windows, and OVE found substantial weaknesses in some cases. Though IDB and IIC have different E&S policies, both clearly require all their operations to be environmentally sustainable, to cause no harm to local communities and the environment, and ideally to generate E&S benefits. IDB and MIF applied these requirements narrowly to the specific use of IDB proceeds. This encouraged cherry-picking of projects, with FIs selecting projects with lower E&S risk to assign to the IDB-funded portfolio. IIC, in contrast, encouraged FIs to apply the environmental and social management system (ESMS) to the broader relevant portfolio and reviewed the potential E&S risks of that portfolio during due diligence. For equity investments or subordinated loans, IIC required the application of the ESMS to the entire FI portfolio. FIs were required to provide risk mitigation measures according to their own categorization of operations as low-, medium-, and high-risk, but the E&S requirements applied were not consistently commensurate to the risk. Trade finance was automatically classified as low risk, but OVE found trade transactions bearing high E&S risks, particularly in high-risk sectors and with large companies. Furthermore, the risk classification and mitigation practices of 2TFIs did not always meet the goals of IDB s safeguard policy, particularly when undertaking large scale green infrastructure projects. In addition, IDBG s supervision of FIs safeguard performance was limited, since FIs often did not report even basic information. In some cases IDBG was able to strengthen the broader ESMS capacity of a range of FIs, though it has rarely attempted to do so at a country or regional level. IIC s Sustainability Week appears to have had significant success in building ESMS capacity, and green lending operations have supported FIs in developing E&S policies and implementing an ESMS. CMF also provided guidance to some 2TFIs as they were developing an ESMS and rolling out appropriate E&S risk mitigation mechanisms to xiii
15 FIs. FIs appreciated technical cooperation operations (TA) that strengthened ESMS capacity, though the TA sometimes came at a relatively late stage, especially when issues of noncompliance arose. Longer-term IDBG relationships with FIs also helped to build stronger ESMS systems. Overall, OVE s client FI survey found that 36% of FIs that received TA considered that the strongest contribution of that TA was to strengthen ESMS systems and develop green lending business portfolios. Despite improvements over time in IDBG s project evaluation architecture, the core issue of how to measure the results of FI operations was not effectively addressed. The idea of tracking specific subloans being funded by IDBG loans is conceptually flawed, given the fungibility of resources in FIs. Results reporting for FI operations reviewed by OVE was weak, though it improved somewhat near the end of the evaluation period. SG 2TFI operations, in particular, often lacked basic information on the results of FIs that received IDBG funds, or even the terms of the onlending to FIs (e.g., tenors, interest rates). Reporting also differed widely across delegated facilities, and was particularly limited for TFFP. Lessons learned were not systematically captured, though IDBG has recently made greater efforts to promote the dissemination and use of institutional knowledge to improve future operations. Incentives within the IDBG were skewed toward short-term and financial goals. When asked to prioritize the perceived incentives during the selection and design of FI operations, IOs ranked them as follows: first, risk mitigation; second, an immediate FI need for IDBG funding; and third, approval volumes, and in some windows disbursements. In fact, some IOs mentioned incentives to build volumes through large FI operations rather than several small ones. Finally, some IOs in SCF, OMJ, and MIF pointed to incentives created by the prestige of having led a highly innovative operation and to a certain recognition in becoming known as subject or country experts. Results: Financing of Relevant Beneficiaries Over a quarter of FI operations total approval volume of $15 billion (excluding the liquidity lines) was not disbursed. As of end-2014, the cut-off date of this evaluation s analysis, SCF had not disbursed about a third of the approval volume, of which the majority ($400 million) corresponded to one cancelled partial credit guarantee operation. This excludes SCF s trade lines because not all of them were meant to disburse. Out of 100 trade lines approved under the TFFP program providing initially uncommitted guarantees or loans, 12 had not been signed and another 19 were signed but not used. OMJ had not disbursed 39% of its approval volume, though this included several recently approved operations with pending disbursements. Only IIC and CMF (excluding liquidity lines) had disbursement rates above 80%. For the loans that were disbursed, IDBG reported reaching the expected number of final beneficiaries and accounting for the funds provided, though the level of achievement differed across products. IDBG usually set certain eligibility criteria and xiv Evaluation of IDB Group s Work Through Financial Intermediaries
16 Executive Summary required FIs to submit a list of projects that fulfilled them. The majority of housing operations (85%) met or exceeded their targets in terms of number of beneficiaries. About 60% of leasing and factoring operations, 50% of SME lending operations, and 25% of green lending reportedly reached or surpassed their targets. Trade lines had no preset targets. As IDBG proceeds were usually onlent, fewer beneficiaries translated into larger subloan sizes. For example, SME lending operations reached only about half the number of intended beneficiaries, with an average loan size twice as large as expected. Overall, IDBG FI operations reportedly reached an estimated 530,000 enterprises and 300,000 individuals from 2005 to 2014 representing about 4% of LAC micro, small, and medium-sized enterprises (MSMEs) and 2% of homeowners. These estimates differ from the vision targets reported by SCF, which sometimes reported the entire relevant portfolio of client FIs. Yet, as noted above, the fungibility of money makes it virtually impossible to attribute the funding of specific beneficiaries to IDBG, thus making beneficiary lists and estimates unreliable. To mitigate the implications of the fungibility of money, OVE used three proxy measures to assess the results of FI operations: (i) relevant portfolio increases; (ii) increase of the share of the relevant portfolio in the FI; and (iii) increase compared to the market. On the first measure, only one-quarter of FI operations (excluding TFFP) aimed at increasing the FIs relevant portfolios, and fewer than 10% set a specific target. FIs relevant portfolios were not tracked in about three-quarters of the cases, and the FIs definitions of those portfolios (for example, SMEs) differed from those of IDBG. However, OVE estimated that 86% of client FIs increased their relevant portfolios, though in 16% of operations the increase was less than the IDBG funding. Attribution to IDBG was evident only in operations with small FIs, and those in which IDBG s investment accounted for a significant share of the relevant portfolio. Though the relevant portfolio increased in almost all FI operations, in large FIs the relation between IDBG s investment and relevant portfolio growth was often too small to make a noticeable difference. In seven exceptional cases, relevant portfolios doubled each year during the IDBG investment period, and growth was considerably higher than IDBG s investments. These were either housing or green lending operations in which IDBG s investments were a significant part of the relevant portfolio. On the second measure, the share of the relevant portfolio in the FIs total portfolio grew in fewer than half of the operations. Although potentially driven by a number of factors, this could indicate a misalignment of strategic priorities of IDBG and FI clients regarding the supported business line. By product line, only green lending and housing portfolios showed increases in their shares of total FI portfolios in a majority of operations. Growth tended to be higher when IDBG funded a larger amount (more than 5%) of the relevant portfolio. External factors such as market demand may also have also affected the growth of relevant portfolios, despite both IDBG s support and the FIs interest. xv
17 On the third measure, a systematic comparison with FI markets was not possible because of data constraints, but where data were available for Peru and Mexico IDBG s FI clients had stronger relevant portfolio growth than non-clients. In Peru, the MSME portfolios of IDBG FI clients increased on average much more than the MSME portfolios of other FIs, indicating some convergence of goals between IDBG and client FIs and success in achieving them. The housing portfolio of IDBG s largest FI client in Mexico (accounting for 85% of IDBG s housing portfolio in the country) and of OMJ s housing client in Peru also grew faster than the market. Results: Strengthening of FIs, Markets, and Final Beneficiaries By their very nature FI operations affect client FIs funding mix and diversification, particularly the matching of long-term liabilities and assets. FI clients were very satisfied with the tenor of IDBG s financing, though the extent to which IDBG actually affected FIs funding mix is unclear, as in the majority of cases IDBG funding was a small share of the FI s long-term funding. There was ample liquidity in LAC during the period covered by the evaluation, and OVE found that client FIs increased their long-term funding as a share of total funding in line with the rest of LAC FIs, from 8%-9% in 2004 to 12%-13% in Client FIs also improved their financial performance, as did the rest of the LAC FI market. IDBG impacts on FI performance were stronger in the few cases in which IDBG provided equity or subordinated debt. About 9% of all IDBG FI operations included equity or subordinated lending (quasi-equity). While the size of IDBG s funding in equity was typically smaller than its funding in senior loans, it represented a much higher share of client FI equity than equivalent senior loans would represent in client debt. Through equity and subordinated loans, IDBG helped FIs strengthen their capital bases and increase or maintain lending. This also facilitated the FIs ability to raise other funds. In a few cases OVE found significant IDBG support for innovation. For example, innovation was at the center of IDB s support to green lending in Colombia and Mexico. MIF helped establish a viable factoring market in Nicaragua by providing funding and TA to the first pure factoring company in the country. IDBG also engaged agents of change in the form of either FIs or collective entities, such as banking associations or global alliances. In all cases, public and private coordination was critical to success. There is limited information on the effects of IDBG financing on beneficiaries, especially regarding lending interest rates. In using the FI mechanism, IDBG relies on FIs to make credit decisions, including the conditions under which credit is granted. In this context, IDBG rarely gathered information on credit conditions, particularly xvi Evaluation of IDB Group s Work Through Financial Intermediaries
18 Executive Summary interest rates for final beneficiaries. This is also the case for SG operations through 2TFIs, for which IDBG gathered interest rate data on subloans in only a few cases (less than 10%), and mostly at the initiative of certain IOs. In contrast, FI operations did include targets for minimum tenors of subloans, which were mostly achieved. In addition to credit lines, FI operations occasionally addressed A2F barriers by creating standardized products and/or targeting new beneficiary segments. One example is the women entrepreneurshipbanking initiative, in which IDBG created a customized product for FIs to address the needs of small businesses run by women. IDBG also provided some support to FIs to improve their risk assessments and the bankability of new clients, as well as to develop business lines such as green lending. There is little information about the effect of improved A2F on SME performance, though a few impact evaluations have found positive effects. A CMF study of the lending activity of a Colombian 2TFI found significant positive effects on firm output, employment, investment, and productivity over the four years after the first IDBG loan, and found that effects were more sustainable when firms received long-term credit. OVE s 2014 evaluation of support to firms in Brazil found that the impact on employment was even larger and more robust when credit was combined with business consulting. A literature review found the impact of A2F to be generally positive, though often ambiguous, depending both on the indicator analyzed and the methodology followed. There is some evidence that A2F increases recipient firms employment and export opportunities, but for most other variables results are not as clear. Results: IDBG Profitability and Role The evaluation found that FI operations particularly those with large FIs were key contributors to IDBG s profitability. On the income side, average interest gross margins for FI operations were at par with other types of IDBG operations. Yet lower origination and administration costs and smaller loan loss allowances due to lower credit risk turned FI operations into a critical driver of IDBG s profitability. Since these costs were to some extent fixed, larger operations, also usually involving larger FIs, were the most profitable. It is also clear that IDBG has built a presence among LAC FIs that together hold approximately 45% of LAC s total banking assets and has positioned itself as a strong development partner for FIs. Initially only IIC and MIF worked directly with FIs; IDB had no direct FI business until the beginning of the 2000s. Over the evaluation period IDBG aggressively pursued this market and managed to position itself as a strong multilateral partner to over 200 LAC FIs. IDBG is also recognized for its strong convening power, bringing LAC FIs and other parties related to A2F to numerous high-level events. The clients interviewed for this evaluation did, however, note a need to strengthen IDBG s local presence and responsiveness to market needs. xvii
19 Recommendations Building on the findings in this evaluation, OVE has five recommendations to complement the merge-out and other IDBG actions and ultimately to enhance the effectiveness of IDBG s FI operations. Since no single DFI currently implements all these practices, the combination of these recommendations aims at positioning IDBG as a leader in FI operations. Recommendation 1: Develop and implement a meaningful IDBG-wide strategic approach for working through FIs. This could be a new IDBG-wide strategy or an enhanced Sector Framework Document. It should be developed and approved jointly by the three governing bodies (IDB, IIC, and MIF) and should be accompanied by a meaningful results framework, with measurable goals, specific accountabilities, adequate resources (budgets and staff), and regular reporting on its implementation. The goal of the strategy should be to guide the IDBG in selecting FIs and instruments that have the potential to make the biggest development impact. It should address, at a minimum, the following topics: what criteria should govern the choice of FIs for support, and when should IDBG work through 2TFIs; under what conditions and terms is lending to public sector FIs with the use of a sovereign guarantee warranted; under what conditions are alternative types of instruments (such as equity, guarantees, or technical cooperation) appropriate for IDBG support to FIs; under what conditions and through what instruments should the IDB Group seek to provide complementary assistance to the public and private sectors for example, in strengthening competition or regulatory frameworks while (or in lieu of) providing direct liquidity support to FIs. Recommendation 2: Better integrate FI work across IDBG into Country Strategies. Issues of financial development and A2F are country-specific, and the Bank s approach should be tailored to country situations while also taking into account the demand-driven nature of IDBG s support. The new Country Strategy process, with its in-depth upstream country diagnostics, provides an opportunity for the IDBG to address A2F as a cross-cutting development issue. A comprehensive country focus on A2F issues, including the level of competition in the financial sector and the underlying reasons for limited A2F, would allow IDBG to gain a deeper perspective on the dynamics of financial markets in a country and the potential effects of various types of FI operations on those markets and on development more broadly. It should also lead to the use of the most appropriate instruments. Credit lines xviii Evaluation of IDB Group s Work Through Financial Intermediaries
20 Executive Summary whether public or private will be most appropriate where the main development constraint is liquidity, while other instruments may be better suited to help countries address other issues. Recommendation 3: Seek ways to generate income for IDBG that would facilitate the use of a wider range of instruments. The substantial income to IDBG from FI operations creates incentives to use that instrument even if it does not address the principal constraints to A2F in the country. Going forward, it will be important for IDBG to identify ways to finance non-lending work as well, as in many cases technical cooperation may be the instrument with the greatest potential development impact. Fee-for-service, donor contributions, and packages that bundle TA with lending and/ or equity investments are options to consider. Providing support for standardization of financial products in LAC may also help IDBG generate fee income and free up resources for complementary non-lending support. Recommendation 4: Strengthen monitoring and evaluation (M&E) and IDBG accountability for results by creating and applying adequate incentives and instruments. M&E instruments should reliably and consistently track the achievement of the outcomes of FI operations and facilitate their reporting to Management and the Board. Instead of trying to tie IDBG resources to individual FI loans, which is not sensible given the fungibility of money, IDBG should seek to measure the effect of its engagement on the relevant portfolios of the FI, ideally against a counterfactual. Monitoring will be more accurate and aligned with the FI s strategic priorities if the categorizations used for IDBG s M&E are based on the FI s own definitions for example, of what constitutes an SME. Strong IDBG monitoring should go beyond compliance with FI operations contractual covenants to help FIs strengthen business processes, sharing experiences and best practices among FIs. On a periodic basis, indepth impact evaluations can be used strategically to fill knowledge gaps. Recommendation 5: Review and strengthen the way environmental and social safeguards are applied to FI operations. Given the fungibility of resources at the FI level, it is not sensible in most cases to apply safeguards only to specific projects funded by IDBG. Rather, IDBG should focus on the development and application of E&S systems at the FI level, particularly as they apply to the relevant portfolio. It should also provide adequate support and supervision to ensure that IDBG s E&S policies are followed, tailoring them as needed to fit the specialized objectives and risks of different business lines. xix
, supporting lending by regulated FIs (mostly commercial banks) to relevant")
21 1 This evaluation focuses on FI operations, an instrument IDBG uses to increase access to finance (A2F) in Latin America and the Caribbean (LAC), supporting lending by regulated FIs (mostly commercial banks) to relevant beneficiaries. IDB
22 #1 Head Evaluation 1 : Unit Focus bold 48/40 and Approach This evaluation assesses investments by the Inter-American Development Bank Group (IDBG) through financial intermediaries (FIs) from 2005 to It focuses on FI operations, an instrument IDBG uses to increase access to finance (A2F) in Latin America and the Caribbean (LAC), supporting lending by regulated FIs (mostly commercial banks) to relevant beneficiaries. 1 IDBG used this instrument intensively during the period, approving 466 FI operations for over $17 billion. This is the first comprehensive evaluation the Office of Evaluation and Oversight (OVE) has conducted on FI operations. 2 It covers FI operations managed by all IDBG windows during These include three IDB divisions: (i) Capital Markets and Financial Institutions (CMF), within the Institutions for Development Department; (ii) Financial Markets, within the Structured and Corporate Finance Department (SCF); and (iii) the Opportunities for the Majority (OMJ) Initiative. 3 In addition, the Inter-American Investment Corporation (IIC) and the Multilateral Investment Fund (MIF) also have FI operations. The evaluation comes at a critical moment for IDBG, with the consolidation of IIC, SCF, and OMJ into an expanded IIC ( NewCo ). 4 The merger aims to address the organizational fragmentation derived from overlapping mandates and different governance structures, balance sheets, and operating models. It also aims to improve synergies between public and private sector activities. FI operations have played, and are likely to continue to play, a key role within IDBG. They are considered to be a cost-effective mechanism to reach a large number of relevant beneficiaries. 5 They are also a source of significant and relatively stable income for IDBG, and are thus important to its financial sustainability and growth. 6 In recent years, FI operations have accounted for over 40% of IDBG s non-sovereignguaranteed (NSG) operations, and they will continue to play an important part. 7 1
")
23 FI operations primarily provide funding to FIs on favorable terms with the expectation that the FIs will become better able to serve relevant beneficiaries. IDB Large FI operations are also likely to continue playing a key role in enabling a wide beneficiary reach and keeping financial results on target for both the NSG and sovereign-guaranteed (SG) sides. A. Access to finance in LAC IDBG s FI loans seek to reach underserved beneficiaries, including exporters and importers, housing buyers, and companies pursuing green investments. All are important for the region s growth and development. 8 Small firms are less productive in general than medium and large firms, and limited access to credit can hamper productivity growth. 9 In LAC imports and exports 25% and 23% of GDP, respectively lag behind those of most other regions. 10 Around 36% of LAC families live in substandard housing, but mortgage financing averages only 5.5% of GDP (versus 60% in developed economies). 11 And investors can face market failures (e.g., missing markets, information asymmetries) that lead to lower than socially optimal investments in green infrastructure as explored in further detail in a companion OVE evaluation. 12 Annex II expands on the economic importance of these beneficiaries. Among FIs, commercial banks are the main provider of credit to private sector firms in LAC. Credit to the private sector averages about 40% of LAC s GDP. About 85% of this credit is granted by approximately regulated FIs operating in LAC, of which about 800 are full commercial banks. About 1500 unregulated financial entities account for the remaining 15% of total formal credit to LAC s private sector. 13 Informal credit providers also play a role in some countries, but data about them are scarce. 2 Evaluation of IDB Group s Work Through Financial Intermediaries
24 1 Evaluation Focus and Approach IDBG s FI operations with the public and private sectors operate through different channels (Figure 1.1). Public sector operations, which are managed by CMF, typically reach FIs indirectly, by first channeling resources through public development banks (second-tier FIs, or 2TFIs) and obtaining a sovereign guarantee from the country governments. All other windows extend NSG lending directly to FIs. In all cases, the FIs make credit-granting decisions and usually bear the final beneficiaries credit risk. Funding Flow Mostly SG 2nd Tier FI Other Effects Figure 1.1 Stylized working of an FI operation IDBG NSG Client FI Beneficiaries SMEs, Homeowners, Exporters and Importers, Green Investments Desired Impact Increase in jobs, sales, productivity; improved housing; reduced GHG emissions Demonstration effects; increased competition Other FIs Many factors affect A2F in LAC countries. On the supply side, potential constraints include limited liquidity (particularly for longer term-financing); information asymmetries (which can affect risk perceptions); lack of knowledge about how to serve certain market segments; and lack of competition (leading to higher interest rates). Institutional factors such as weak regulatory environments, inadequate creditor protections, and an absence of credit information can also hinder the growth of credit markets. FI operations can address only some of these barriers. FI operations primarily provide funding to FIs on favorable terms (especially longer tenors), with the expectation that the FIs will become better able to serve relevant beneficiaries. To a lesser degree, FI operations also provide guarantees to incentivize FIs to extend credit for certain beneficiaries or types of projects that are of interest to IDBG. Finally, some FI operations focus on strengthening client FIs through equity investments or technical assistance (TA). However, other types of IDBG instruments are better suited to address other barriers constraining credit to relevant beneficiaries, such as problematic regulatory frameworks or the low creditworthiness of potential borrowers (see Table 1.1). For example, OVE s FI client survey showed that over half (59%) of client FIs perceived high informality amongst SMEs as the main barrier, while FI funding constraints were an issue for only 18% of IDBG FI clients. In fact, OVE s survey shows that the availability of additional funding rarely drives FIs (9% of cases) to pursue a new business segment; the perception of a business opportunity is the dominant factor (57% of cases). 3
25 Table 1.1. Using the appropriate tool to address A2F constraints Barriers to A2F Funding constraints / lack of liquidity: Unavailability of funding with the appropriate tenor and currency from deposits, credit lines or institutional investors; particularly affects higher-risk, private sector borrowers. Lack of competition: Reduced product offering or high interest rates and fees due to weak competition among FIs may price borrowers out of the market, mainly smaller ones. High risk perception, particularly for new products: Unavailability of instruments (e.g., guarantees and insurance) for FIs to manage portfolio risk, deterring them from even originating credit, especially for a longer term. Lack of knowledge on the part of the FI or borrower. Examples: FIs may lack the skills to appropriately assess green projects or the credit risk of SMEs; SMEs may lack the knowledge to prepare business plans. Externalities: Societal benefits, such as reductions in greenhouse gas emissions, that are hard to appropriate by the agents making the investments, e.g., companies engaging in green projects. Weak regulatory environment: Problematic laws and regulations, e.g., unclear creditor protection laws, or excessive capital requirements for lending to SMEs. Information about borrowers difficult or costly to obtain: Undeveloped financial infrastructure such as credit reporting, collateral registries or payment systems imposing additional costs on FIs and making it difficult to obtain financing, particularly for smaller borrowers. Crowding out: High interest rates on government debt may lead FIs to shun private, especially small, borrowers. Potential IDBG tools FI operation (loan): Provides the missing liquidity to the market. FI operation (equity): Supports the entry of new players or growth of smaller players in the market. FI operation (guarantee): Supports FIs in correcting information asymmetries and biases. FI operation (with TA to FIs or SMEs): Helps FIs build lending capacity; helps SMEs improve business plans and implementation. FI operation (SG loan) and non-fi operation (donor funds): Provides incentives to compensate private investors for positive externalities. Non-FI operation (TA to governments): Supports creation of a stronger enabling environment. Non-FI operation (TA/SG loan): Supports key market players (e.g., authorities, bank associations) in building financial infrastructure. Non-FI operation (SG policy loan): Supports macroeconomic reforms. The evaluation considers other types of IDBG support for expanding A2F only to the extent that is relevant to understanding the results of FI operations. Thus, the evaluation is not meant to be a financial sector review, but rather to assess the results of IDBG FI operations in the context of the countries financial sectors. B. Evaluation questions and methodology The evaluation addresses the following questions: What operations did IDBG support, and with what objectives? (Chapter 2) 4 Evaluation of IDB Group s Work Through Financial Intermediaries
26 1 Evaluation Focus and Approach How did the various IDBG windows differ in how they selected, structured, and implemented operations to achieve those objectives? (Chapter 3) To what extent were development-related objectives achieved, and to what extent can these achievements be attributed to IDBG? (Chapter 4) How did these operations affect IDBG profits, efficiency, and incentives? (Chapter 4) What recommendations can be made for future FI operations? (Chapter 5) OVE gathered project and client data through document reviews, interviews, and focus groups. 14 OVE reviewed data on all 466 FI operations and looked in depth at a representative sample of 131 FI operations to identify objectives, achievements, processes, and lessons (Annex I). 15 OVE interviewed all IDBG investment officers experienced with FI operations (about 40 interviews) and managers of all five IDBG windows. OVE visited 10 borrowing member countries 16 and interviewed representatives of 98 client FIs and 76 other key financial sector players. OVE also conducted 16 focus groups, with about 140 local participants, on regulatory challenges and the potential for innovation in increasing A2F. OVE also profiled A2F in LAC countries, conducted a client FI survey, and looked into the practices of other development finance institutions (DFIs). In profiling A2F in LAC countries, OVE relied on existing metrics and also conducted a literature review regarding the major constraints to A2F and the effects of greater A2F on final beneficiaries. OVE commissioned an independent in-depth survey to which 120 client FIs responded, sharing their views on IDBG s service and detailing their business interests. 17 OVE also drew on IDB s existing External Feedback System (EFS), a survey that captures client satisfaction, including that of FI clients. This report provides an overview of evaluation findings. Background reports to this report contain more detailed information on specific product lines (SMEs, mortgage lending, trade finance, green investments, leasing and factoring), environmental and social (E&S) safeguards related to FI operations, and the management of similar FI operations in other development finance institutions. 5

27 2 Housing finance has been provided to help address LAC s housing shortage. Loans to FIs are meant for onlending to low-income populations. Operations have also helped FIs raise additional funding by securitizing housing portfolios. IDB
.")
. Two-thirds of the approved amounts (65%, or $11.")
28 #2 2 Portfolio and Head Objectives 1 : Unit of FI bold #Pertinencia 48/40 Operations A. Portfolio overview Between 2005 and 2014, IDBG approved 466 FI operations totaling $17 billion, accounting for about 14% of total IDBG approvals in the period (Box 2.1). Over that period, approvals averaged $1.7 billion annually, briefly increasing to $3.7 billion annually in 2008 and 2009 during the global financial crisis when the IDBG injected liquidity into financial systems (Figure 2.1). Two-thirds of the approved amounts (65%, or $11.1 billion) were disbursed or used. The majority of operations that were not disbursed or used ($5.9 billion) were liquidity lines approved during the financial crisis, and guarantees. Box 2.1. Portfolio identification for this evaluation What s included? The portfolio included IDBG operations (i) that provided lending, guarantees, and equity to regulated FIs; and (ii) whose proceeds were to be applied to the following groups of relevant beneficiaries: Enterprises SME lending, trade finance, leasing and factoring, green lending, and liquidity lines, or Individuals homeowners using mortgage finance. What s excluded?: (i) Stand-alone grants (the definition of FI operations used requires that IDBG eventually also assumes credit risk, because the crux of this evaluation is assessing the commitment of IDBG financial resources to mostly private FIs); (ii) a handful of projects for other beneficiary groups, e.g., payroll credit or student lending; and (iii) projects supporting other financial services such as insurance, or lending provided by unregulated FIs, e.g., NGOs (although regulated NGOs are included). 7
29 Figure 2.1 Approvals peaked during the crisis years Source: OVEDA Total approval amounts ($m) $4,000 $3,000 $2,000 $1,000 $599m $727m $1,775m $3,755m $3,718m $1,119m $818m $1,056m $1,328m $2,139m Number of approvals $ Annual Approvals # Operations Over half of the funding went to larger and more advanced economies. Overall, more advanced A countries received 52% of approved amounts, while B, C, and D country groups averaged about 15% each. 18 Mexico and Brazil accounted for over half of the approved amounts (Figure 2.2). 19 Figure 2.2 Larger and more advanced countries received the majority of approvals Source: OVEDA BRAZIL $4.5b (27%) MEXICO $4.3b (25%) COSTA RICA COLOMBIA PANAMA EL SALVADOR PERU Jamaica. Chile Dominican Republic Argentina Paraguay. Ecuador Guatemala Uruguay. Honduras Nicaragua. Bolivia Trinidad & Tobago Barbados Suriname. Guyana Belize. Haiti $1b (6%) $1b (6%) $1b (6%) $0.8b (5%) $0.8b (5%) $3.7b (22%) REST OF LAC $17 billion / 466 OPERATIONS SG operations dominated by volume, NSG by number (Figure 2.3). CMF reached financial systems indirectly, usually channeling funds to public 2TFIs, while the NSG windows SCF, OMJ, IIC, and MIF lent directly to FIs. Annexes III and IV profile each of these IDBG windows and its objectives. 8 Evaluation of IDB Group s Work Through Financial Intermediaries
 Average size ($m) Volume ($m) IDBG provided")
30 2 Portfolio and Objectives of FI Operations MIF OMJ $3m $7m $11m $71m $151m $2,324m Figure 2.3 Approvals CMF and SCF had the largest amounts, IIC the highest numbers IIC 218 $5,022m Source: OVEDA $31m SCF 160 $ 9,464m $255m CMF 42 Operations (#) Average size ($m) Volume ($m) IDBG provided mostly senior loans and, less frequently, guarantees, subordinated loans, and equity. Of the FI operations, 83% were senior loans. Hybrid loanguarantee lines used in trade finance accounted for about 13% of resources. Pure guarantees, used mostly for green lending and housing, accounted for 3.3% of resources. Subordinated loans and equity investments accounted for less than 1% of the portfolio resources. B. Portfolio by product line FI operations focused on six main product lines: general SME financing; trade finance (mostly within the framework of the Trade Finance Facilitation Program, or TFFP); leasing and factoring; green lending; financing facilities providing liquidity to FIs (through the Liquidity Program for Growth and Sustainability); and housing finance. The most widely used product was SME lending (46% of approved amounts), followed by housing finance (19%), trade credit lines (13%), liquidity lines (12%), green lending (8%), and leasing and factoring (2%) (Figure 2.4). Support to micro, small and medium enterprises (MSMEs) has been widely used by different IDBG windows (Table 2.1). In 1995 IDB developed its first unified initiative to target SMEs the Strategy for Business Development for Small and Medium Enterprises, which aimed at supporting competition. At the time, IDB focused its support on long-term economic growth and job creation. 20 IIC also focused mainly on increasing A2F for SMEs. During the past 10 years, private sector windows including IIC began including micro-enterprises in their strategies and goals. 21 Loans for new investments and working capital are the most important products IDBG offers MSMEs. Almost half the amount in this area ($3 billion) was approved for one institution in Brazil (BNDES) in the form of three loans for SME support between 2007 and 2010 (Annex VI A). 9

31 Figure 2.4 Approval volumes were dominated by CMF and SCF and by SME lending Source: OVEDA CMF SCF IIC OMJ MIF General SME Lending AA: $4,709m / %D: 86% FI Liquidity Lines AA: $2,100m %D: 14% Trade AA: $2,137m %D: 57% Leasing and Factoring AA: $11m / %D: 100% Green Lending AA: $553m / %D: 67% Housing AA: $1,195m / %D: 41% General SME Lending AA: $1,126m / %D: 57% Housing AA: $1,834m / %D: 98% AA: Approved Amount %D: % Disbursed Green Lending AA: $821m / %D: 30% General SME Lending AA: $1,873m / %D: 81% Leasing and Factoring AA: $256m / %D: 100% Housing AA: $151m / %D: 93% Trade AA: $45m / %D: 0% Housing AA: $60m / %D: 33% General SME Lending AA: $91m / %D: 44% Leasing and Factoring AA: $8m / %D: 100% Housing AA: $10m / %D: 50% General SME Lending AA: $52m / %D: 58% Table 2.1. General SME finance Approved Disbursed By windows Instruments Types of FIs Top countries Amount: $7.9 bn. (46% of portfolio) Number: 246 operations Amount: $6.3 bn. (80% of approvals) CMF (60%), IIC (24%), SCF (14%), MIF and OMJ (2%) Senior loans (94%), Equity and subord. loans (5%), Guarantees (1% ) 2TB (62%), 1TB (36%), NBFIs (2%) Brazil (44%), Mexico (11%) Housing finance has been provided to help address LAC s housing shortage (Table 2.2). Loans to FIs are meant for onlending to low-income populations. Operations have also helped FIs raise additional funding by securitizing housing portfolios. IDBG s housing finance was concentrated in Mexico following the housing crises in the US and subsequently in Mexico. Well over half the approval amount ($1.8 billion) was in the form of five SG operations to one institution Sociedad Hipotecaria Federal, a large public housing finance company from 2008 onwards (Annex VI B). Half of the operations (28) were with non-bank financial institutions (NBFIs), often specialized housing finance companies, but together they accounted for only $720 million. Guarantees typically partial credit guarantees were rarely used (only by SCF and OMJ), mainly for NBFIs to help overcome relatively lower credit ratings and/or to reduce foreign exchange risk for clients. 10 Evaluation of IDB Group s Work Through Financial Intermediaries
32 2 Portfolio and Objectives of FI Operations Table 2.2. Housing finance Approved Disbursed By windows Instruments Types of FIs Top countries Amount: $3.3 bn. (19% of portfolio) Number: 51 operations Amount: $2.5 bn. (75% of approvals) CMF (56%), SCF (37%), IIC (5%), OMJ and MIF (2% Senior loans (85%), guarantee (11%), subordinated loans (4%) 2TB (65%), NBFIs (22), 1TB (13%) Mexico (70%), Peru (11%) CMF launched the Liquidity Program for Growth and Sustainability (LPGS) to maintain credit flows during the 2008 global financial crisis (Table 2.3). Projecting a reduction in financial flows to LAC and a resulting credit crunch, IDBG provided short-term resources as countercyclical support to the productive sector to finance working capital and trade finance needs, especially for MSMEs. The idea was to channel funds through 2TFIs to FIs (mostly commercial banks) and eventually to the productive sector. IDB tapped its Emergency Lending Facility and allocated a total of $6 billion to the program, capped at $500 million per country. Nine countries 24 expressed initial interest in participating in the program, but in the end IDB approved only five operations 25 for around 15% of the program amount, and only 5% was disbursed. Table 2.3. Liquidity to FIs Approved Disbursed By windows Instruments Types of FIs Top countries Amount: $2.1 bn. (12% of portfolio) Number: 6 operations 22 Amount: $0.3 bn. (14% of approvals) CMF (100%) Senior loans (100%) 2TB (100%) Costa Rica (24%), El Salvador (24%), Panamá (24%), Jamaica (14%), Dominican Republic (14%) The Trade Finance Facilitation Program (TFFP) was approved in 2004 as part of a bigger IDB program for reactivating trade finance in the region (Table 2.4). 26 At approval, TFFP was a revolving partial credit guarantee facility that supported shortterm trade credit transactions. Its objective was to support economic reactivation and growth through the expansion of international trade financing to [LAC] companies, acting as a countercyclical tool in times of liquidity shortages. 27 The approval of individual operations was delegated to Management with some limitations, including a maximum exposure of $400 million for the whole program. 11

33 The Trade Finance Facilitation Program was approved in 2004 as part of a bigger IDB program for reactivating trade finance in the region. Its objective was to support economic reactivation and growth through the expansion of international trade financing to [LAC] companies, acting as a countercyclical tool in times of liquidity shortages. IDB Approved Disbursed loans Used guarantees By windows Instruments Types of FIs Top countries Table 2.4. Trade finance Amount: $2.2 bn. (13% of portfolio) Number: 101 lines 23 Amount: $1.2 bn Number: 64 loans under credit lines Amount: $4.2 bn. Active lines as of 2014: 32% SCF (98%), IIC (2%) Lines for loans and/or guarantees (98%), guarantees (2%) 1TB (98%), 2TB (2%) Brazil (24%), Chile (12%), Argentina (8%) In 2008, in the context of the global financial crisis, a review of the program led to increasing the exposure limit to $1 billion and removing some limits. 28 The changes included the addition of direct loans (including B-loans) with up to 3-year tenors for financing trade transactions. Exposure of the TFFP slowly expanded to about $400 million by the end of 2011, mostly in the form of guarantees. Further expansion occurred after 2012 with the simplification of agreement documents, making it much easier for clients to select either guarantees or loans, or both. The program s exposure increased rapidly, almost reaching the limit of the program by the end of 2014, after the approval of four loans to three of the largest banks in Brazil, Mexico, and Chile, which together accounted for $500 million, almost half the total program. IDBG has provided two types of credit lines for green lending, responding to the prioritization of climate change in the Ninth General Capital Increase in 2010 (Table 2.5). These two main lines to FIs provided (i) funding to first-tier FIs (1TFIs) 12 Evaluation of IDB Group s Work Through Financial Intermediaries
34 2 Portfolio and Objectives of FI Operations through SCF s planetbanking initiative, and (ii) funding to 2TFIs through CMF. Green lending operations aim to mitigate greenhouse gas emissions by improving energy efficiency or investing in renewable energy. Subprojects of green lending are thus extremely varied in nature and size, ranging from new equipment and green loans for SMEs, to small hydropower plants and agribusinesses producing biofuel, to large-scale infrastructure projects such as wind farms. Most lending has been in Mexico, mainly through four SG operations (for over $800 million) to one large public institution to finance large infrastructure projects, including wind farms, a gas pipeline, and a photovoltaic system. Table 2.5. Green lending Approved Disbursed By windows Instruments Types of FIs Top countries Amount: $1.4 bn. (8% of portfolio) Number: 19 operations Amount: $0.6 bn. (60% of approvals) SCF (40%), CMF (60%) Senior loans (93%), subordinated loans (5%), guarantee (2% ) 1TFIs (60%), 2TFIs (40%) Mexico (62%), Brazil (13%) IDBG has had two initiatives to increase A2F through leasing and factoring (Table 2.6). The IIC/MIF SME Finance Facility 29 was approved in 2004, with the objective of developing partnerships with top financial institutions (including banks and leasing and factoring companies) to demonstrate benefits of new products. A second initiative was the Financial Institutions Program, 30 approved in 2005, which followed the Nuevo Leon Declaration s goal of enhancing financing to SMEs by mobilizing funds through eligible FIs, focusing, among others, on leasing and factoring operations. Most lending was done by IIC, though SCF also offered guarantee operations and MIF factoring in Central America. IIC approved seven operations (mostly in local currency) to leasing FIs in Colombia under a one-time swap operation. Table 2.6. Leasing and factoring Approved Disbursed By windows Instruments Types of FIs Top countries Amount: $0.3 bn. (2% of whole portfolio) Number: 43 operations Amount: $0.3 bn. IIC (93%), SCF (4%), MIF (3%) Senior loans (93%), guarantee (6% ), equity (1%) NBFIs (99), 1TB (1%) Colombia (25%), Chile (25%), Mexico (15%) 13
35 C. Objectives of FI operations There is no single IDBG strategy for FI operations; instead, the different IDBG windows have each set their own objectives. The strategic objectives are set out more or less formally in documents of all kinds charters, mandates, sector frameworks, Country Strategies, business plans, programs, and guidelines. 31 Project approval documents and contracts 32 set out objectives for individual operations. OVE compiled FI operation objectives from more than 100 FI-related strategy and program documents including Country Strategies applicable during the period and about 200 project documents. Objectives for FI operations have been at three levels: FIs, final beneficiaries, and IDBG (Table 2.7). A key objective was to expand A2F for the targeted relevant beneficiaries. First, IDBG sought to channel funds to these beneficiaries by stipulating the use of IDBG proceeds to fund a certain number of relevant beneficiaries or to target a particular profile of beneficiary. Second, IDBG sought to improve the conditions of the financing received by these final beneficiaries, particularly the lending tenor for example, by requiring subloans to be longer than 2 years. IDBG usually refrained from setting specific interest rate goals for subloans. Table 2.7. Typical objectives for FI operations Final beneficiary level FI level IDBG level p p p p p p p p p p Improve beneficiaries financing conditions Improve beneficiaries performance via financing Enhance systemic developmental effects Channel IDBG funding to specific relevant beneficiaries Improve FIs funding mix and diversification Improve FIs performance and sustainability Enhance FI market functioning and promote innovation Optimize the use of FI operations, e.g., speed and efficiency Strengthen IDBG capabilities to work with FIs Position IDBG as leading private sector institution Source: OVE analysis of relevant documents. In particular, FI project documents tended to contain the objectives for the final beneficiary and FI levels, and strategic documents had most IDBG level objectives. FI operations also sought to improve the performance and sustainability of client FIs. IDBG aimed to improve the FIs funding mix by providing funds at tenors not otherwise available in the market and by diversifying the FIs funding sources. 33 Almost all operations also set objectives (usually in the form of contractual covenants) to improve (or maintain) the FIs performance, e.g., capital adequacy, asset quality, and profitability. These covenants in loan contracts were intended to ensure repayment of IDBG funding, but FIs report they also served as an incentive to perform within the agreed ranges. In contrast, only a few operations targeted improvements of the FIs corporate governance or efficiency, though most projects have now started to build in 14 Evaluation of IDB Group s Work Through Financial Intermediaries
36 2 Portfolio and Objectives of FI Operations FI improvement objectives in the area of environmental and social (E&S) practices and systems. 34 Over time, IDBG began emphasizing objectives promoting the FIs success in serving beneficiaries relevant to IDBG, such as SMEs, or helping demonstrate the business case for serving these beneficiaries. 35 More recently, IDBG recognized the potential role of FI operations in enhancing the functioning of FI markets and promoting innovation. Objectives in this area were set mostly at the strategic level (particularly in CMF), but also in about a third of FI operations. They frequently aimed to promote market competition or to support deepening the FI market, for example, long-term capital markets. 36 In addition, some objectives focused on forging strategic partnerships in the region to promote collective action. OMJ, for example, aimed at scaling up innovative pilot projects through its Innovation and Opportunity Network, by including strategic allies and academia. 37 Improving financial infrastructure, such as credit registries or regulatory frameworks, was rarely reflected in objectives at the project level. Innovation has also been a significant focus. Almost half 38 of FI operations including almost all of OMJ s, the vast majority of MIF s, and more than half of housing and green lending operations have had goals related to innovation. Among operations with innovation objectives, about two-thirds built on an innovative product or service the FI was already offering, while one-third focused on introducing a new product to the FI for example, financial products not offered before (such as leasing and factoring); specific products that opened new markets, such as green products (renewable energy, energy efficiency, or green mortgages); or products focused on low-income segments or smallholder farmers. In some cases, projects also focused on creating a market infrastructure, such as e-platforms for bank transactions, to broaden access to financial services. FI operations also aimed to improve the performance of the beneficiaries funded, and to eventually have systemic development effects on LAC s economy. Most IDBG windows set these objectives within specific operations, while some, like OMJ, incorporated them as strategic objectives, by aiming to support the private sector to create jobs, increase income, and incorporate local communities as producers. 39 Ultimately, FI operations also aimed to boost productivity [and competitiveness] in LAC economies by facilitating access to finance. 40 IDBG also set objectives for itself: streamlined efficiency and speed (needed to deal with banking clients); improved strategic consistency and coordination across the several windows; broader use of TA; and broader organizational incentives (including recognition of the role of FI operations in generating profit for IDBG). IDBG also aimed to deepen its understanding of the FI market by strengthening relationships with FIs, building on existing relationships, and developing relationships with new client FIs. This was particularly relevant to windows like SCF, which had only recently (2003-4) been authorized to serve FIs. Over time IDBG also targeted other types of FIs, such as microfinance institutions, leasing/factoring companies, and capital market vehicles. 15
 and")
37 3 OVE s FI client survey showed a good match between FIs and IDBG s priorities. In fact, SMEs were the top priority for 70% of client FIs, followed by trade finance (32%) and microenterprises (31%). IDB
38 #3 Design and Head Implementation 1 : Unit bold 48/40 of FI Operations This chapter summarizes evaluation findings surrounding the processing selection, design, and implementation of FI operations, highlighting differences by window as appropriate and ending with a brief discussion of efficiency and internal incentives. Despite some differences among windows and products, the processing of IDBG FI operations follows a typical sequence. First, one of the IDBG windows selects the potential FI operation in response to A2F issues in a country. This process would ideally include some consideration of which IDBG window is best placed to address the development need, but this has not typically happened in practice, given the decentralized nature of IDBG decision-making. Second, the IDBG window designs the FI operation, aligning it with IDBG and country goals. This step includes the contractual structuring of the operation to achieve financial and development goals up to and including reaching financial closing. Third, IDBG supervises and evaluates the FI operation. This process includes the management of contractual covenants, disbursements, and repayments; the monitoring of results, evaluation, and reporting on achievements; and the management of lessons learned for application in future FI operations. A. How were FI clients selected? Only one-fifth (22%) of Country Strategies during the evaluation period included the financial sector as a priority, even where IDBG had significant FI operations. Three-quarters of FI approvals were done in countries where the financial sector was not a priority in the Country Strategy. 41 This reflected in part the relatively little attention given to IDB private sector activities in these strategies as well as the limited SG-NSG collaboration in the IDBG. This is expected to change with the merge-out, which envisages the full engagement of IIC 17
39 in IDBG s Country Strategies and a role for the country representative throughout the project cycle of private sector operations. 42 IIC s business plan highlights this strong partnership and close SG-NSG collaboration. The lack of diagnosis of A2F issues at the country level impeded strategic selection of FI operations; thus almost one-half of FI operations were more opportunistic. IDBG rarely conducted in-depth diagnostics of the financial sector at the country level. At the project level, FI operations focused on an intended beneficiary group, but typically stopped short of addressing the underlying constraints on A2F for that group. Almost half of FI operations originated opportunistically out of client requests. OVE s FI client survey showed a good match between FIs and IDBG s priorities. In fact, SMEs were the top priority for 70% of client FIs, followed by trade finance (32%) and microenterprises (31%). As to their origination, country authorities commonly requested SG operations to advance public policy goals. By contrast, NSG demand often arose from business meetings at periodic events, such as the Annual Assembly of the Latin American Banking Federation (FELABAN) or Foromic. IDBG had neither overarching strategic goals for FI operations nor a formal process to guide the allocation of FI operations across windows. Despite efforts to promote joint work, 43 different windows approached the same clients, sometimes competing with each other. Smaller FIs tended to work with MIF or OMJ, which on average had smaller operations. Almost one-fourth of FIs received financing from at least two windows, with the biggest overlap between SCF and IIC (Figure 3.1). Overlaps between SG and NSG operations also frequently occurred, partly because of the lack of clear criteria on when to use a sovereign guarantee. Three of the 2TFIs supported by CMF also received financing from NSG windows, and FIs reached through NSG operations were also sometimes reached indirectly through SG operations. 44 Coordination efforts among NSG windows have strengthened in recent years, and the merge-out should eliminate many overlaps in NSG operations, though SG-NSG coordination will still be an issue to be addressed. Figure 3.1 1TFIs reached, overlap, and footprint of NSG windows in LAC ( ) OMJ - Total FIs: 22 FIs Assets: $67 bn OMJ 1 FI 2 FIs 4 FIs Note: *Circle size proportional to client FIs Assets Source: OVE calculations, using information from local supervisors and IDBG systems. SCF - Total FIs: 122 FIs Assets: $1,464 bn SCF 37 FIs 3 FIs 4 FIs 1 FI MIF IIC MIF - Total FIs: 23 FIs Assets: $10 bn IIC - Total FIs: 140 FIs Assets: $1,180 bn Total LAC Regulated FIs: ~ 1,000 FIs Assets LAC: ~ $5,000 bn Total IDBG client FIs: ~ 262 (~26%) FIs Assets LAC: ~ $2,250 bn (~45%) 18 Evaluation of IDB Group s Work Through Financial Intermediaries
40 3 Design and Implementation of FI Operations Despite the already very high level of concentration in LAC, IIC and particularly SCF focused mainly on the largest banks in the country. SCF approved operations with banks that, on average, ranked third in the country in terms of assets, while IIC s operations were on average with the fifth-largest bank (Box 3.1). 45 IIC emphasized a portfolio view, selecting large FIs as clients to achieve volume and profitability. SCF did not follow a portfolio approach, but, to take advantage of their reach, increasingly promoted engagement with large FIs interested in developing specific businesses such as women s banking or green lending. CMF typically had soft eligibility criteria for 1TFIs of all sizes, usually requiring just a banking license or some minimum financial parameters. Box 3.1. IDBG s FI clients tended to be among the largest FIs in each country Two-thirds of the banks reached were among the top 10 in each country: 75% of the banks reached by IIC and 68% of those reached by SCF were in the top 10, ranked by size, in each country. For OMJ and MIF 67% and 57%, respectively, of the banks they reached were in the top 10. However, MIF and OMJ have relatively fewer operations with banks than IIC and SCF in their FI portfolios. Only 55% of OMJ client FIs and 45% of MIF client FIs are banks. Both windows have also focused their operations on non-bank FIs. On average, SCF s money went to the third-largest bank and IIC s to the fifth-largest bank in each country Group A Group B Group C Group D Ranking of Banks (by assets) Argentina Brazil Mexico Chile Colombia Peru Costa Rica Jamaica Suriname Trinidad and Tobago Panama Uruguay Belize Bolivia Dominican Rep. Ecuador El Salvador Guatemala Guyana Honduras Nicaragua Paraguay 10 IIC average bank client ranking IIC average rank SCF average bank client ranking SCF average rank # of banks AR BR MX CL CO PE CR JM SR TT PA UY BZ BO DO EC SV GT GY HN NI PY Source: Bankscope. OVEDA. Supervisory Authorities. OVE calculations. 19
41 B. What IDBG instruments were used? Almost all operations were direct senior loans (and occasionally guarantees), though all windows acknowledged a need to diversify instruments to better meet client needs. Staff and managers interviewed by OVE from all windows (except CMF), as well as many clients interviewed, mentioned the lack of local currency availability for FI operations as a limiting factor. Similarly, equity was perceived as highly desirable to have leverage to influence FI business, but only IIC and MIF had this instrument available, and both had limited capacity to invest equity. 46 Quasi-equity and subordinated debt could help to strengthen FIs capital positions and were also deemed extremely valuable. 47 CMF mentioned the need for contingent lines, especially in light of the LAC economic downturn. Yet IDB s high capital requirements and lower income currently make guarantees financially less attractive (Box 3.2). Box 3.2. Risk treatment of loans and guarantees There is currently no risk differentiation between various credit products and a trade finance guarantee, which may partly explain why the TFFP program moved from guarantees to loans. A trade finance guarantee is given the same internal risk rating as a 3-year fungible trade loan issued against a pool of revolving trade receivables. Under a standard risk approach, a guarantee issued in support of a specific underlying trade transaction is a non-fungible, off-balance-sheet contingent liability; it differs from a direct loan, which is a fungible on-balancesheet item. Additionally, each guarantee issued under a trade finance program covers a specific trade transaction (or grouping of trade transactions) such that the guarantee expires when the trade transaction is completed. Therefore, the guarantee is specifically tied to a pre-identified self-liquidating trade transaction, a characteristic that a loan does not have. Given these considerations, a direct loan represents additional risks relative to a guarantee a fact that is currently not appropriately reflected in IDB s capital requirements. IDBG s management is working on resolving these issues. TA proved particularly valuable when used for developing a standardized new product 48 in collaboration with FI clients, but TA funding was difficult to obtain. According to OVE s FI client survey, almost all client FIs (95%) valued TA as a way to improve their institutional capacities. Around 28% of IDBG s operations included TA. MIF used TA in almost 90% of its operations, OMJ and CMF in around half of their operations, and SCF and IIC in only 14% and 9% of their operations, respectively. In volume terms, CMF accounted for more than 80% of the total TA funds used. Much TA in IDBG could potentially be fee-based, 49 but to date it has been provided free of charge. Because it is often donor-funded and can be difficult and slow to access, many investment officers forgo it altogether. 20 Evaluation of IDB Group s Work Through Financial Intermediaries
42 3 Design and Implementation of FI Operations C. How did the various windows determine eligibility and structure loans? During the eligibility process, FI operations were typically analyzed mainly on their individual merits; only IIC followed a portfolio view. IDBG eligibility processes, which varied slightly by window, analyzed individual operations in isolation, rather than placing them in the context of an overall strategy to work through FIs in part because such a strategy did not exist. IIC, on the other hand, used a portfolio approach, balancing financial and development considerations (subject to meeting minimum standards for both). NSG windows actively scrutinized 1TFIs, while CMF delegated this due diligence to 2TFIs. All NSG windows carried out client due diligence, considering the governance of the FI. CMF followed similar criteria and due diligence for 2TFI operations; however, it delegated the selection and due diligence of recipient FIs to 2TFIs. This left the assessment of governance and E&S practices to the discretion of the 2TFIs. As a result, 2TFIs could potentially use IDBG funds to finance 1TFIs that would not normally receive IDBG financing from NSG windows for example, because of concerns about governance or ownership (e.g., by politically exposed persons). NSG windows set prices in line with the market, while SG windows used a low flat price, potentially subsidizing FIs and beneficiaries. CMF operations were priced at Libor plus a spread that never went above one percent, 50 with an average spread of 0.8%. NSG operations had spreads in line with the market. On average, SCF s spread was 2.6%, IIC s 2.7%, MIF s %, and OMJ s 3.1%. Lack of data prevented OVE from analyzing the financing terms provided from client 2TFIs to 1TFIs. However, observations during OVE missions revealed that IDBG often reached the same FIs through different parts of IDBG, but with different terms and conditions. The low pricing of SG operations suggests that FIs and beneficiaries could have been receiving some level of subsidy, though no data were available to measure that. Some windows used incentives (mostly financial) to encourage FIs to meet certain conditions. For instance, IIC structured an operation with a Chilean factoring company so that if it complied with the target ratios, the spread would decrease from 1.5% to 1.25%. OMJ and MIF mentioned the potential benefits of introducing incentives to promote innovation, though windows working with larger FIs perceived that incentives may not effectively influence FIs behavior and that IDBG s risk departments may not agree to the use of such tools. Other DFIs also use incentives in their operations (Box 3.3). CMF provided longer tenors to 2TFIs than NSG windows did to their direct clients, though data were not available on the tenor of loans from client 2TFIs to 1TFIs. CMF provided an average tenor of 20 years to 2TFIs, yet onlending tended to be much shorter. These long tenors also made it challenging to track whether the 21
43 2TFI continued to operate in line with IDB s expectations over the whole project horizon. 51 For NSG windows, average tenors were 4 years for IIC, 6 years for SCF and OMJ, and 7 years for MIF. 52 FI clients considered the tenor of IDBG s FI operations a clear strength. 53 Box 3.3. Other DFIs use of incentives to further achievement of development goals Other DFIs use incentives strategically to foster the achievement of development goals. In some operations, IFC introduced incentives to promote a certain portfolio growth: the FI operation set a spread that could be increased if portfolio growth went below a minimum threshold, or decreased if it exceeded a stretch target (subject also to a maximum level of nonperforming loans). Relevant portfolio volume ($) Potentially mobilize other funds Funding provided by DFI Baseline portfolio? Potential stretch target, above which discounts apply Potential minimum, below which penalties apply Baseline portfolio Target portfolio A few other DFIs have introduced incentives to promote E&S achievements. For example, FMO and PROPARCO have structured operations that allow for reducing margins upon reporting the achievement of certain E&S milestones. EBRD uses incentive payments (rebates) both to FIs and to the final beneficiaries for specific products like energy efficiency and renewable energy to encourage demand (beneficiaries) and compensate for higher processing costs (FIs). IDBG structured most FI operations by attempting to track the use of specific proceeds, not taking into account the fungibility of FI funding. For most lending, all IDBG windows set certain eligibility criteria and required FIs to submit a list of projects that would fulfill those criteria. On several occasions FI clients told OVE that they selected projects from their broader client base that they thought IDBG would like, and some projects were replaced because IDBG did not like them (for example, because of E&S concerns), even though these projects had been funded already. 22 Evaluation of IDB Group s Work Through Financial Intermediaries
44 3 Design and Implementation of FI Operations IDBG s covenants were mainly financial, and only rarely focused on development commitments (except E&S). To reduce credit risk, IDBG used financial covenants that project supervision officers monitored closely. Although FI project documents typically included expectations on development impacts (such as increasing the number of final beneficiaries), these expectations were rarely translated into contractual covenants. Attention to the performance of overall portfolios increased slightly in NSG projects particularly those of MIF and OMJ over (Figure 3.2). In contrast, SG lending appears to have continued to focus primarily on tracking the initial use of IDBG proceeds Figure 3.2 NSG windows increasingly set relevant FI portfolio objectives Percent of projects SG Use of proceeds objectives Relevant portfolio objectives NSG Use of proceeds objectives Relevant portfolio objectives IDBG loans varied significantly in disbursement patterns (Table 3.1). MIF, SCF (for trade finance), and CMF used multiple disbursements in most of their loans. CMF usually disbursed in tranches because of its very large amounts, and trade finance guarantees were approved individually. In most MIF loans, subsequent disbursements were contingent upon meeting certain development goals, effectively tying disbursements to the achievement of intermediate results. 55 Other SCF loans (non-trade finance) and OMJ and IIC loans tended to be disbursed at one time. Supervision of operations focused on minimizing credit risk by securing repayment of principal and interest. SG handed supervision over to local specialists, who also usually led (or co-led) project preparation. In contrast, SCF and IIC had dedicated supervision units that in most cases also handled repeat operations and renewals. The SCF supervision unit also monitored OMJ operations. In all cases, supervision focused mainly on financial covenants, with a lesser focus on the achievement of development targets presented in Board approval documents. In recent years SCF and OMJ improved 23
45 their systems for tracking development results. While these systems will now be replaced by new ones with the merge-out of NSG operations, IIC s new management information system is also expected to capture ongoing information on development results. Table 3.1. Disbursement patterns of different windows Window MIF CMF SCF (without TFFP) SCF (TFFP only) OMJ IIC Total Multiple disbursements Number (%) 14 (93%) 22 (73%) 13 (25%) 58 (84%) 5 (33%) 42 (23%) 154 (42%) Total disbursements Number D. How did IDBG perform in terms of efficiency and speed? Improving IDBG s efficiency and speed was seen as key to engaging the dynamic FI sector. For FIs, timeliness is almost as important as competitive pricing. As the different IDBG windows engaged FIs, they streamlined approval and supervision processes several times over the period, with a view to simplification. IDBG sought to address the challenge of speedy and efficient approval of FI operations by introducing programs to expedite approval processes and delegating authority to Management. IIC kicked off the Financial Institutions Program in 2004 to focus on meeting the enhanced SME lending mandate set forth in the Nuevo Leon Declaration. This program was supported by streamlined Board approval processes for transactions with eligible financial institutions. IIC then introduced the Program for Funding Specialized Financial Institutions in Mexico in 2007 and the Program for Funding Microfinance Institutions in Peru in Similarly, SCF introduced the Trade Finance Facilitation Program (TFFP) in 2004, delegating authority to the Bank s Management for reviewing and approving individual lines to issuing banks. Unfortunately, IDBG s systems do not separately capture key information about these programs, so it is difficult to assess these initiatives. For example, information about profitability is rarely disaggregated by program, business line or client. For both public and private windows, FI operations were processed faster than non-fi operations, significantly contributing to the overall efficiency of the IDBG. The number 24 Evaluation of IDB Group s Work Through Financial Intermediaries
46 3 Design and Implementation of FI Operations of days from the initial assessment or proposal to approval was consistently lower for FI operations than for non-fi operations, with only a very brief exception at the height of the financial crisis. This is not surprising, given the relatively simpler nature of FI operations. Also, large FI operations are processed faster than similar-sized non-fi operations. Despite this, FI (and other) clients are not very satisfied with IDBG s processing times. 56 Larger NSG FI operations tended to be processed faster than smaller FI-NSG operations, whereas the opposite was true for non-fi operations. Usually large NSG FI operations (above $30 million 57 ) are associated with regulated, consolidated, and mid/large-sized FIs, which tend to be relatively less risky and more advanced in management and governance. These characteristics are likely to reduce complexity in preparation, due diligence, and structuring of operations, and thus processing time. In contrast, smaller NSG FI operations are usually linked with small/mid-sized FIs, in less developed markets and/or with new products/niches, which can involve higher risks and complexity and thus longer processing times. This is reflected in the difference in average days needed to approve large NSG FI operations (155 days) and small ones (214 days) (Figure 3.3) Figure 3.3a Processing times are shorter for FIs, particularly large FI investments Number of days from start to approval NSG operations ( ) Note: Small: Under $30 million investment. Source: OVE s calculation using information from IDBG s systems FI-NSG Portfolio Non FI-NSG Portfolio Volume-wise, 2TFI operations also fostered IDBG s efficiency and were used frequently during the period of this evaluation. 2TFI operations have allowed the disbursement of large volumes of resources (in some cases reaching $1 billion), reaching multiple FIs with a single operation. This structure generates efficiencies in cost and time (compared with the alternative of reaching multiple FIs with individual operations), for both origination and supervision stages. Unfortunately, as previous chapters have mentioned, the supervision schemes of several of these operations did not collect and analyze key information at the levels of both the 1TFIs and the beneficiaries, which would be fundamental to an accountability and development impact analysis. 25
47 Figure 3.3b Processing times are shorter for FIs, particularly large FI investments Number of days from start to approval Large vs. small operations (avg ) Note: Small: Under $30 million investment. Source: OVE s calculation using information from IDBG s systems Large NSG FI Small NSG FI Large NSG Non-FI Small NSG Non-FI E. How were E&S safeguards handled? IDBG s E&S policies require all Bank operations and activities to be environmentally sustainable and in compliance with safeguard policies. IDBG has had two E&S policies applicable to FI operations IDB s Environment and Safeguards Compliance Policy (2006), and IIC s Environment and Social Sustainability Policy (2013). Both policies clearly require all IDBG operations to be environmentally sustainable, to cause no harm to local communities and the environment, and ideally to generate E&S benefits. IDB s implementation directives do not fully address the complexity of FI operations, 58 while IIC s have clear guidelines for FI operations. The evaluation found that the application of the E&S management system (ESMS) to FI portfolios differed across windows. IDB and MIF applied it narrowly to the specific use of IDB proceeds. This encouraged cherry-picking of projects, with FIs selecting projects with lower E&S risk to assign to the IDB-funded portfolio. By contrast, IIC encouraged FIs to apply the ESMS to the broader relevant portfolio and reviewed the potential E&S risks of that portfolio during due diligence. 59 For equity investments or subordinated loans, IIC required the application of the ESMS to the entire FI portfolio. 60 Many FIs encountered E&S covenants for the first time through IDB operations, though these covenants also differed across windows. NSG E&S covenants generally provided good guidance for FIs, though IIC s covenants were less precise. IDB s E&S operational manual for public sector FI operations did not highlight the importance of an ESMS for FIs. In no case did IDBG clearly refer to IDBG s safeguard policies. FIs were required to provide risk mitigation measures according to their own categorization of operations into low, medium, and high risk. For low-risk operations FIs needed to apply only an exclusion list and national laws. For moderate-risk 26 Evaluation of IDB Group s Work Through Financial Intermediaries
48 3 Design and Implementation of FI Operations operations FIs had to implement a basic ESMS. For higher-risk operations, FIs had to implement a more elaborate ESMS, including environmental impact assessments for projects financed with IDBG funds. OVE found, however, that the E&S requirements applied were not consistently commensurate to the risk. First, trade finance was automatically classified as low risk, but OVE found trade transactions bearing high E&S risks, particularly in high-risk sectors and with large companies (Box 3.4). Second, when working with public development banks, risk classification and mitigation did not always conform to IDB s safeguard policy (Box 3.5). Third, IDBG s E&S requirements sometimes applied only to subloans over $5 million (or even higher), automatically excluding most SME operations. It is not clear whether IDBG s Independent Consultation and Investigation Mechanism (MICI) could be effective in FI operations, as beneficiaries and affected communities were often not aware of IDBG s involvement. Box 3.4. Trade finance and pig iron in Brazil E&S implementation issues Using trade finance provided by IDB, a large Brazilian bank known in the marketplace for its commitment to sustainability financed a pig iron producer in Brazil through one of their Caribbean branches, with 47 transactions in 2013 and 2014 for a total amount of $26.7 million. Before receiving the trade finance, the pig iron producer had already been convicted in 2011 of illegally purchasing charcoal and thus contributing to deforestation of over 9 million acres of Amazonian rainforest. The company was obliged to recover the deforested area or pay a fine of $31.6 million. The membership of this pig iron company in the National Pact against Slavery had also been suspended since 2012, when the Ministry of Labor found 150 workers held in slavery-like conditions in a charcoal production site linked to its supply chain. The company was required to agree to a change in conduct. In 2015, the Brazilian Ministry of Environment announced an embargo against the company for violation of that agreement. This project is not an isolated case and reflects the challenges of E&S safeguard implementation. In fact, IDB had properly structured legal covenants, including giving it the right to reject noncompliant projects and demand the application of national E&S law. IDBG s supervision of FIs safeguard performance was limited, since FIs often did not report even basic information. Although both IDB and IIC required FIs to report on the E&S risks of subprojects, the reporting format often lacked even basic information on the subloans. In many SME operations FIs did not present the name of the company or the sector. When risk classifications were provided, projects were typically classified as low risk, but neither IDBG nor OVE was able to verify the appropriateness of classifications. IDB s supervision records did not include data on safeguard performance for 76% 61 of FIs. This may be due in part to FI operations having been considered low risk and ESG prioritizing its supervision on higher-risk activities, and in part to data not 27
49 having been appropriately entered into the system. IDB s (but not IIC s) implementation guidelines required periodic assessments of a representative sample of FI subprojects, but such assessments were not systematically carried out, except in green lending projects. Box 3.5. Wind farms in Mexico financed through a public development bank IDB financed several wind farms in Mexico for over $150 million through a public development bank. These wind farms had negative environmental impacts on migratory birds and were constructed in a sensitive area affecting indigenous populations. In a disbursement request to IDBG, the public bank categorized a wind farm as a low-risk operation and indicated that indigenous people were not affected by the project despite evidence of protests by indigenous people. In a separate NSG loan IDB directly financed that same wind farm and classified it as a high-risk (category A) operation. IDB financed other wind farms exclusively through the same public bank and relied on its ESMS capacity. There are indications that the development bank s ESMS was based on local law and did not follow IDB s E&S policies. IDB s ESG unit tried to follow project implementation closely and made use of its right to object because of insufficient information or weak mitigation measures. However, the project had already been licensed by the Mexican authorities and thus ESG could not confirm whether required public consultation with indigenous people had been conducted prior to project approval (as required by directive B.6). Only SCF (and to a lesser extent IIC) operations with potentially higher E&S risks typically involved IDBG s E&S specialists at project origination. This approach was aimed at improving FIs institutional capacity for E&S risk mitigation and at identifying action plans to implement an effective ESMS. The Environmental and Social Management Report of the IDB-ESG unit provides a good example of how to establish a proper baseline and gap analysis. In some cases IDBG was able to strengthen the broader ESMS capacity of a range of FIs, particularly when it collaborated beyond origination. IIC s Sustainability Week appears to have had significant success in building ESMS capacity (Box 3.6). In addition, in green lending operations, IDB s ESG unit supported FIs in developing E&S policies and implementing an ESMS. CMF also provided guidance to some 2TFIs as they were developing an ESMS and rolling out appropriate E&S risk mitigation mechanisms to FIs. Overall, FIs appreciated TA that strengthened ESMS capacity, though the TA sometimes came at a relatively late stage, especially when issues of noncompliance arose. Longer-term IDBG relationships with FIs also helped to build stronger ESMS systems. 62 Overall, OVE s client FI survey found that 36% of FIs that received TA considered that the strongest contribution of that TA was to strengthen ESMS systems and develop green lending business portfolios Evaluation of IDB Group s Work Through Financial Intermediaries
50 3 Design and Implementation of FI Operations Box 3.6. IIC s Sustainability Week The annual IIC Sustainability Week is a good example of how to promote organizational changes towards more sustainable business performance in FIs. Sustainability Week includes training sessions focused on environmental risk management, sustainable business opportunities, and corporate governance. All FIs with IIC funding are contractually required to participate in E&S training sessions to ensure compliance with IIC s safeguards policy. IIC started training courses in 1999, and since then around 1,700 people have been trained. This has also provided a mechanism for regional experience-sharing. The main goal of the training is to support FIs in implementing the required ESMS. FIs reported back that IIC s training had often been a strong incentive to raise the profile of sustainability issues and promote ESMS implementation. IDBG missed the opportunity to achieve significant improvements of FIs E&S management by following a sector-wide approach at the country or regional level. FIs showed higher commitment and better performance implementing an ESMS in countries that had introduced legally binding E&S regulations (such as Brazil and Peru), voluntary regulations, or collective sustainability initiatives for the financial sector (such as the green protocol in Colombia or the roundtable for improving E&S standards in Paraguay, supported by FMO). Yet IDBG did not systematically support E&S risk mitigation initiatives or regulations at the country or regional level by working with banking regulators, ministries, or banking associations. F. How were results monitored and lessons shared? IDB has strengthened its project evaluation architecture with the steady expansion in the scope and implementation of the Development Effectiveness Framework since The framework includes several instruments with which IDB assesses project evaluability, monitors progress, and measures results and impacts. 64 The redesigned NSG toolkit applied by SCF and OMJ to their operations since 2014 has increased the focus on project objectives and results indicators, including requiring evaluability assessments and results matrices for all projects (except TFFP). The project-level results frameworks for NSG operations were recently harmonized, both at the front end in the form of the DELTA (Development Effectiveness, Learning, Tracking and Assessment) tool, and at evaluation in the form of a harmonized Expanded Supervision Report that covers all private sector windows. Despite these improvements, the core issue of how to measure the results of FI operations remains a serious challenge. As the next chapter points out, the idea of tracking specific subloans being funded by IDBG funds is conceptually flawed in an environment of fungible resources. IDBG needs to move to a broader tracking of relevant portfolios ideally against a counterfactual at the FI and/or market 29
51 level if the monitoring and evaluation (M&E) of FI operations is to become more meaningful. Causal attribution will remain difficult, but could be reinforced by periodic, longer term evaluations. When relevant portfolios were tracked, FI operations used a definition of relevant portfolio that was not aligned with that of the FI. For example, IDBG s SME definitions tended to be standardized to simplify internal reporting and differed from the definitions used by FIs to track their own business. Most FIs were unable to accurately report results according to IDBG s definitions, yet they could readily track data such as size and performance of relevant portfolios according to their own definitions. These were also the data that drove FIs own strategic decision-making, such as whether to grow a certain portfolio. Many FIs do capture relevant information for their own use, but IDBG does not systematically obtain it. 65 Box 3.7 shows how definitions vary widely also among different DFIs, but some have started to use the FI s own definition. Precise definitions for example, what is a new beneficiary, or how to measure improved financing conditions for SMEs getting a mix of fee and non-fee based products would also be important for the achievement of other objectives. Box 3.7. Portfolio definitions in other DFIs Relevant portfolio definitions, particularly those for SMEs, vary by institution. IFC uses a loan size proxy for FI operations, and so do FMO and OPIC. a EIB uses the EU definition. Proparco does not use a single definition but often applies the SME definition used by the local bank, which tends to be smaller than the definitions of the EU and IFC. The FI s own definition is likely the most relevant for the market context and is the only one in which a strategic alignment between the FI s and DFI s definitions can be achieved. a Verifying the accuracy of IFC s loan size proxy (IFC, 2013). In brief, the loan size proxy classifies loans under $10,000 as micro, under $100,000 as small, and under $1 million ($2 million in more advanced countries) as medium-sized companies. In that publication, IFC compared the loan size proxy to the World Bank Group definition used for direct lending. Results reporting was weak, particularly for SG 2TFI operations. SG 2TFI operations often lacked basic information on the results of the FIs that were reported as having accessed IDBG funds, or the terms of the onlending (e.g., tenors, interest rates). Similarly, for final beneficiaries the average amounts and terms were not consistently available, nor was their profile (e.g., sales or employees of MSMEs) or the use of funds (e.g., capital investment or working capital). There were, however, a few in-depth evaluations that reported on results for beneficiaries (e.g., for SMEs in terms of increases in sales or employees). Reporting differed widely across delegated facilities, and was limited for TFFP. With regard to programs, the delegation of authority from the Board of Directors to Management was typically accompanied by systematic and periodic subsequent reporting. However, the scope and detail of the reporting differed widely across different programs. The 30 Evaluation of IDB Group s Work Through Financial Intermediaries
52 3 Design and Implementation of FI Operations NSG Quarterly Reports the main tool for reporting to the Board provided detailed information for some operations under delegated authority: amounts as small as $1-2 million by individual operation, and in some areas even the pipeline of projects was being reported. In other cases, like the TFFP program, approvals as large as $ million were not individually reported. 66 Lessons learned were not systematically captured; however, IDBG made efforts to promote dissemination and use of institutional knowledge to improve future operations. Project closing reports generally reported positive results, whether or not there was evidence to support them. In OVE interviews, staff indicated that at least for SG operations, completion reports have limited value as they receive insufficient funding and little attention from Management. Yet the NSG closing reports frequently shared the same issue of quality and evidence, as well as insufficient attention to the relevance of the operations. IDB recently introduced BRIK as a repository of institutional knowledge the IDBG s single-point access to its knowledge products, including books, working papers, technical notes, discussion papers, annual reports, and so on. In 2010, IIC, in collaboration with IDB s Knowledge and Learning sector, also introduced the internet portal Lessons in Action, containing about 100 lessons learned from its closing reports. OVE identified a need to improve the quality of lessons, and is working with Management in this area. 67 G. What internal incentives appear to drive IDBG s FI operations? Incentives within the IDBG are skewed toward short-term and financial topics. When asked to prioritize the perceived incentives during FI operations design, IOs ranked them as follows: first, risk mitigation; second, an immediate FI need for IDBG support; and third, approval volumes, and in some windows disbursements. In fact, some IOs mentioned incentives to build volumes through large FI operations rather than several small ones. Finally, some IOs in SCF, OMJ, and MIF pointed to incentives created by the rewards of having led a highly innovative operation and to certain recognition in becoming subject or country experts. Within IDBG, only IIC built organizational incentives supported in part by a variable, performance-based compensation framework. IDB windows SCF, OMJ, and CMF were bound by IDB s performance evaluation and compensation system, based on annual goals and with limited room for variable compensation. IOs perceived that although they tried to incorporate desired behaviors, such as innovation, the center of gravity remained on approvals and disbursements. Furthermore, bonuses and promotions were also limited by IDB-wide procedures. In contrast, IIC experimented with a system that introduced variable pay based on a matrix combining approvals, disbursements, profitability, and development scores. Other DFIs, and particularly IFC, use long-term performance awards, once the development and financial results of the FI operations in which IOs have participated have materialized; selection criteria include development results as well as financial performance, and the awards involve monetary rewards as well as public recognition

53 4 To assess whether FI operations achieved their objectives, OVE analyzed the achievement of targets for a random, representative sample of 125 FI operations plus 6 liquidity lines, and compared results indicators before and after the operation for the sample with those of a set of about 200 client FIs. IDB
54 4 Results for Clients and the IDB Group This chapter assesses the results of FI operations for FIs, final beneficiaries, and the IDBG. To assess whether FI operations achieved their objectives, OVE analyzed the achievement of targets for a random, representative sample of 125 FI operations (plus 6 liquidity lines), and compared results indicators before and after the operation for the sample with those of a set of about client FIs (regardless whether these FIs belong to the sample). OVE considered external market indicators to determine whether FI operations were able to influence the FI market, for example by promoting competition among FIs in a country. OVE also assessed the extent to which IDBG could feasibly have contributed to these achievements and identified factors that seem to have strengthened IDBG s contribution through FI operations. (Box 4.1 lists the evaluative questions used for this part of the analysis.) 33
55 Box 4.1. Objectives of FI operations and related evaluative questions Objectives for FIs and beneficiaries Did IDBG operations expand A2F for relevant beneficiaries? o Did the money reach the FIs? o Was the money used for eligible beneficiaries? o Did the relevant portfolio increase? o Did this portfolio increase compared to the FIs overall portfolio increase; and to the market? Did IDBG improve the performance and sustainability of client FIs? o How did the relevant portfolio perform? o Did the FIs improve their performance and sustainability? o Did FIs increase their market share? Did IDBG operations enhance the functioning of FI markets? o Did FI operations affect competition? o Did FI operations promote collective market action to improve A2F? Did IDBG operations improve performance of beneficiaries? o Did operations address the most important A2F barriers for beneficiaries? o Did FI operations affect financing for relevant beneficiaries? o Did FI operations improve performance of relevant beneficiaries? Objectives for IDBG How did IDBG FI operations affect IDBG profitability? Did FI operations enhance IDBG s role in supporting the private sector in LAC? A. Did IDBG FI operations expand access to finance for relevant beneficiaries? a) Did the FIs use IDBG resources? Over a quarter of FI operations total approval volume of $15 billion (excluding the liquidity lines) was not disbursed. SCF did not disburse about a third of the approval volume, of which $400 million corresponded to one cancelled partial credit guarantee operation. This excludes SCF s trade lines because they were not always meant to disburse. Out of 100 trade lines approved under the TFFP program providing initially uncommitted guarantees and loans, 12 were not signed 70 and another 19 signed but not used so about a third of the approvals were never used. OMJ did not disburse 39% of its approval volume, though this includes several recently approved operations with pending disbursements. Only IIC and CMF had disbursement rates above 80% (Table 4.1). 34 Evaluation of IDB Group s Work Through Financial Intermediaries
56 4 Results for Clients and the IDB Group Table 4.1. Only IIC and CMF had disbursement rates above 80% Percent of approvals disbursed a Window CMF without liquidity lines SCF without trade lines SCF only trade lines IIC MIF OMJ a Or issued, in the case of guarantees. b Over 100% due to revolving credit lines. By volume b By number b) Were IDBG resources used for relevant beneficiaries? IDBG reported reaching the expected number of final beneficiaries and accounting for the funds provided, but reported beneficiary listings are unreliable and the level of reported achievement differed across products. As mentioned in the previous chapter, IDBG usually set certain eligibility criteria and required FIs to submit a list of projects that would fulfill them. The majority of housing operations (85%) met or exceeded their targets in terms of number of beneficiaries. About 60% of leasing and factoring operations, 50% of SME lending operations, and 25% of green lending reached or surpassed their targets for numbers of beneficiaries. Trade lines had no preset targets. As IDBG proceeds were usually onlent, fewer reported beneficiaries translated into larger subloan sizes. For example, SME lending operations reportedly reached only about half the number of intended beneficiaries, with an average loan size twice as large as expected. Overall, between 2005 and 2014, IDBG FI operations reached an estimated ,000 enterprises and 300,000 individuals, representing about 4% 72 of MSMEs and 2% 73 of homeowners in the region. Yet the fungibility of money makes it difficult to attribute the funding of specific beneficiaries to IDBG, thus making beneficiary lists unreliable. As Chapter 3 described, IDBG s FI operations typically employ use of proceeds to structure operations, which can result in cherry-picking final beneficiaries. FIs obtain funding from different sources and use this funding to acquire assets other than loans; hence, attribution for specific loans is virtually impossible. FIs can and do report to IDBG loans that would have been granted anyway, or that had already been granted. Other DFIs that tried to control the link between their own funding and specific beneficiaries even more tightly than IDBG came to the same conclusion. 74 In fact, FIs told OVE that they often chose projects for the reporting that they thought IDBG would approve of, and sometimes substituted individual loans when IDBG did not approve of the original choice (despite the fact that they had already financed these projects). As long as an FI has a large enough portfolio, it will almost certainly be able to provide IDBG with a list that fulfills certain eligibility requirements (Box 4.2). 35
57 To mitigate the implications of the fungibility of money, OVE used three alternative measures: (i) relevant portfolio increases, (ii) increase of the share of the relevant portfolio in the FI, and (iii) increase compared to the market. None of these measures is conclusive in terms of causal attribution, but each can serve as a rough indicator. The first measure, whether the relevant portfolio increased, is already a much better measure than use of proceeds to assess whether relevant beneficiaries A2F increased. Within an FI, the total size of these portfolios is unique and objectively ascertainable as it does not require the FI to pick any list of beneficiaries following a third party s (IDBG s) eligibility criteria. The tracking of the FIs relevant portfolios following the FI s own definition is thus not affected by the fungibility of funds. Any increase in the relevant portfolio (asset) is additional, since it requires that borrowers have received more funding, irrespective of which FI funding source (liability) is used. For the second measure, an increase in the share of the relevant portfolio in the FI could be an indication of the FI s commitment to that segment and could help to signal whether IDBG s funding may have helped increase the focus on that portfolio. An assessment of the third measure whether IDBG s client increased the relevant portfolio by more or less than their competitors was, unfortunately, only possible in a small number of cases where information for non-idbg clients was available. It would indicate that IDBG had selected FI clients with a greater focus on relevant beneficiaries. Box 4.2. Measuring results through use of proceeds vs. relevant portfolio growth Given the fungibility of funding, a self-selected list of projects does not ensure that the FI increases financing to relevant beneficiaries Relevant portfolio volume ($)? Unclear if portfolio increases or not IDBG funded portfolio ( list ) Focusing instead on portfolio growth requires FIs to increases financingpotentially beyond IDBG s funding Relevant portfolio volume ($)? Potentially mobilize other funds DFI funding Baseline portfolio Baseline portfolio Target list Baseline portfolio Target portfolio Use of proceeds ( List ) Makes IDBG s attribution challenging: FIs could report projects as financed with IDBG funds that they would have funded anyway, or that they had already funded. Can resultin cherry picking of beneficiaries: FI clients often selected projects from their portfolio based on projects fit with IDBG requirements. Sometimes clients swapped projects already funded when IDBG expressed concerns. Portfolio growth Leads to increased financing for relevant beneficiaries: By definition, additional beneficiaries obtain financing. Allows for better IBDG attribution: The increased of the relevant portfolio would be tied to IDBG s funding. Requires FI definition of relevant portfolio: FIs make strategic decisions and track data based on their own portfolio definition. Could also include mobilization objetives: IDBG coulds require portfolio growth by more than IDBG funds. 36 Evaluation of IDB Group s Work Through Financial Intermediaries
58 4 Results for Clients and the IDB Group c) Did the FIs relevant portfolios increase? Despite its potential use as a proxy measure of better A2F for beneficiaries, only onequarter of FI operations (excluding TFFP) aimed at increasing the FIs relevant portfolios, and fewer than 10% set a specific target. Furthermore, FIs relevant portfolios were not tracked in about three-quarters of the cases, and the definitions differed from those of IDBG. SCF and OMJ intended to increase the relevant portfolios more frequently than other windows, often in housing operations and in more recent operations. Information on relevant portfolios was not routinely collected, especially for SG, trade, and some green lending operations. When a relevant portfolio was tracked, in almost all cases the SME definitions of FIs differed from IDBG s, and FIs did not track portfolios according to IDBG s definition or use that definition for strategic decision making. Even in housing, the definitions sometimes differed for example, the FI might use a higher income cutoff for the beneficiaries than IDBG uses. 75 Despite these limitations, OVE estimated that 86% of client FIs grew their relevant portfolios during the FI operation (though in 16% of operations this increase was less than the IDBG funding). The remaining 14% recorded annual declines in their relevant portfolios (Figure 4.1). The median annual growth rate of relevant portfolios was 20% but the average 59% because of seven operations with growth rates above 100% (Figure 4.2 and Table 4.2). Growth of relevant portfolios was consistent across products and windows, except that fewer SCF trade operations (two-thirds) recorded an increase, and a high proportion of CMF s SG operations had relevant portfolio declines (27%). Growth of Relevant Portfolio Amount Figure 4.1 Relevant portfolio growth vs. IDBG investment Source: OVE calculations based on a sample of 125 FI operations. 50% More than 3 times 8% 13% 2 to 3 times IDBG amount 1 to 2 times IDBG amount 0 16% 14% Lower than IDBG amount Negative FI Operations 37
59 Figure 4.2 Distribution of increases in relevant portfolios Source: OVE Distribution of FI operations (%) 20% 18% 16% 14% 12% 10% 8% 6% 4% 2% 0% 8% 19% 16% median (20%) average (59%) 9% 9% 6% 5% 5% 3% 2% 2% < -20% -20% to -10% -10% to 0% 0% to 10% 10% to 20% 20% to 30% 0% 0% 11% 30% to 40% 40% to 50% 50% to 60% 60% to 70% 70% to 80% 80% to 90% 90% to 100% > 100% Compounded annual growth rate of relevant portfolio amount (%) Table 4.2. Increases in relevant portfolios by products and windows Product Sample (#) Negative (%) Positive (%) Window Sample (#) Negative (%) Positive (%) General SME lending CMF (w/o liquidity lines) Green lending SCF (w/o trade lines) Housing IIC Leasing and factoring MIF Trade (TFFP) OMJ Total Total Source: OVE calculations based on a sample of 125 FI operations. Attribution to IDBG was evident in operations in which IDBG s investment accounted for a significant share of the relevant portfolio. Only in operations with small FIs can a modest but significant relationship be discerned between IDBG s investment (as a share of the FI s relevant portfolio) and relevant portfolio growth (Figure 4.3). Though the relevant portfolio increased in almost all FI operations, in large FIs the relation between IDBG s investment and relevant portfolio growth is likely too small to make a noticeable difference. In seven exceptional cases, relevant portfolios doubled each year during the IDBG investment period, and growth was considerably higher than IDBG s investments. These were either housing or green lending operations, and in all of the cases IDBG s investments were a significant part of the relevant portfolio (at least 6%). In four of these, IDBG s investment volume was even higher than the existing relevant portfolio volume, indicating that IDBG contributed strongly to that growth. 38 Evaluation of IDB Group s Work Through Financial Intermediaries
60 4 Results for Clients and the IDB Group CAGR In relevant portfolio amount (In percentage points) Figure 4.3 IDBG s investment and relevant portfolio growth Nore: *Small: Loan portfolio < $200 million; Medium: $200 million - $5 billion; Large: > $5 billion. CAGR = Compounded Annual Growth Rate. Source: OVE calculations based on the sample of 125 FI operations. -40 IDBG investment/fi relevant portfolio Large FIs Medium FIs Small FIs Linear (Small FIs) Relation between IDBG investment and CAGR of relevant portfolio amount d) How did changes in the relevant portfolio compare with broader FI and market trends? The share of the relevant portfolio in the FIs total portfolio grew in fewer than half of the operations, though on average growth in this share was slightly positive 3.3 percentage points per year (Figure 4.4). Although potentially driven by a number of factors, this could indicate a misalignment of strategic priorities of IDBG and FI clients regarding growth of the supported business line. By product line, only green lending and housing portfolios showed increases in their shares in a majority of operations (Table 4.3). Growth tended to be higher when IDBG funded a larger amount (more than 5%) of the relevant portfolio. Distribution of FIs (%) average (3.3) 30% median (0) 25% 24% 22% 20% 19% 15% 10% 9% 5% 0% 1% 3% 3% 1% 1% 0% 1% 0% < to -8-8 to -6-6 to -4-4 to -2-2 to to 2 2 to 4 4 to 6 6 to 8 8 to 10 Annual change in relevant portfolio share (in percentage points) 9% > 10 Figure 4.4 Change in relevant portfolio as share of total FI portfolio Source: OVE calculations based on a sample of 125 FI operations. 39
61 Table 4.3. Distribution of changes in relevant portfolio shares by product line Product # Negative (%) Zero (%) Positive (%) Department # Negative (%) Zero (%) Positive (%) SME lending CMF (w/o liquidity lines) Green lending SCF (w/o trade lines) Housing IIC Leasing/ factoring MIF Trade OMJ Total Total Source: OVE calculations based on a sample of 125 FI operations. Data constraints prevented a systematic comparison of results with the FI market; however, in two cases Peru and Mexico IDBG s FI clients had stronger relevant portfolio growth than non-clients. In Peru, the MSME portfolios of IDBG FI clients increased on average much more than the MSME portfolios in other FIs, indicating some convergence of goals between IDBG and client FIs and success in achieving them. The housing portfolio of IDBG s largest FI client in Mexico (accounting for 85% of IDBG s housing portfolio in the country) and OMJ s housing client in Peru also grew faster than the market. B. Did IDBG support improve the performance and sustainability of client FIs? a) How did the relevant portfolios perform? IDBG did not systematically collect performance data for relevant portfolios, though where information was available, performance worsened. IDBG s FI operations rarely had the quality of relevant portfolios as an objective and therefore did not systematically collect relevant portfolio performance data, such as nonperforming loans (NPLs) information that is probably the best available indicator for efficiency of resource allocations. Moreover, a systematic comparison of the NPLs of relevant portfolios with the FI market was not possible. Yet OVE collected information for 30 operations and found that the NPLs of relevant portfolios increased from 3.2% to 4.7% over the evaluation period. However, in Peru at least, where the regulator makes available NPLs for all banking institutions, IDBG clients relevant portfolios performed better on average than the market, indicating that IDBG worked with FIs that were better at efficiently allocating funding. b) Did the performance of client FIs improve? FI operations by their very nature affect client FIs funding mix and diversification, particularly matching FIs long-term liabilities and assets. Funding mix and diversification targets were seldom preset in quantitative terms in FI operations, but 40 Evaluation of IDB Group s Work Through Financial Intermediaries
62 4 Results for Clients and the IDB Group FI clients improved their long-term asset-liability ratio from 2.36 to 1.39 on average during the time of the IDBG operation. Clients were very satisfied with the tenor of IDBG s financing. 76 Deposits remained the most significant funding source for banks, growing on average from 65% to 70% of funding during the time of IDBG operations. 77 In a context of ample liquidity and funding sources, client FIs increased their long-term funding as a share of total funding in line with the rest of LAC FIs, from 8%-9% in 2004 to 12%-13% in 2014 (Figure 4.5). Long-term funding participation 16% 14% 12% 10% 8% 6% 4% 2% 0% Figure 4.5 Growth in long-term funding Source: Bankscope. LAC FIs IDBG FIs The extent to which IDBG affected client FIs funding mix is unclear, as in the majority of cases IDBG funding was a small share of FIs long-term funding. IDBG funding accounted on average for 3.6% of FIs long-term funding (0.9% of FIs total funding). For 2TFIs, IDBG s share of long-term funding averaged 3.0%, and for NBFIs it was 2.7%. IDBG was also able to mobilize additional resources from the private sector and other investors, increasing the share of FIs long-term funding to 3.8% (1% of total funding). 78 In addition, about one-quarter of FIs mentioned that having passed IDBG s due diligence was likely to increase their access to other funders or capital markets, especially other DFIs. However, IDBG did not actively leverage its reputation to help FIs gain access to additional funds. Client FIs improved their financial performance, as did the rest of the LAC FI market. About half of the operations had financial targets on capital adequacy ratios (CAR), NPLs, return on assets (ROA), and/or return on equity (ROE). About three-quarters of these operations achieved at least one of these targets. Regardless of whether targets had been set, OVE compared average client FIs indicators before and after IDBG s FI operation: (i) CARs remained between 13-15%; (ii) total portfolio NPLs improved from 5% to 3.5% (as opposed to the NPLs of the relevant portfolios, which worsened); (iii) ROAs improved from 1.2% to 1.4%; and (iv) ROEs decreased from 12% to 11.5%. The financial performance of IDBG client FIs was similar to or better than the market (Figure 4.6), with high returns over the entire period. 41
63 Figure Returns on equity of IDBG clients and other FIs in LAC Source: Bankscope. Return on average equity (%) LAC FIs IDBG FIs IDBG impacts on FI performance were stronger in the few cases in which IDBG provided equity or subordinated debt. About 9% of all IDBG FI operations included equity or subordinated lending (quasi-equity). While the size of IDBG s funding in equity was typically not larger than IDBG s funding in senior loans, it represented a much higher share of client FI equity than equivalent senior loans would represent in client debt. Through equity and subordinated loans, IDBG helped FIs strengthen their capital bases and increase or maintain lending. Increasing capital also facilitated raising other funds. IDBG s equity has a more direct link to FI performance (Box 4.3 describes an example). Box 4.3. The power of quasi-equity Costa Rica s largest bank had deteriorating capital adequacy ratios (CARs). In 2013, IDBG provided a subordinated loan of $100 million only 0.9% of the FI s total funding, but 8.3% of its capital to strengthen the bank s capital structure. The CAR increased from 10.6% to 12.6%, allowing this publicly owned bank to maintain market share. It is important to note, however, that public banks in Costa Rica have numerous advantages compared to private banks, such as preferential access to low-cost deposits. C. Did IDBG FI operations enhance the functioning of FI markets? a) Did FI operations affect competition in the FI market? There are signs of low competition in the LAC FI market, but IDBG does not seem to have focused on increasing competition, since it typically supported the top FIs in each country. LAC s financial systems all exhibit signs of limited competition: high levels 42 Evaluation of IDB Group s Work Through Financial Intermediaries
64 4 Results for Clients and the IDB Group of concentration (with the top 10 players accounting for over 50% of the banking market and in most cases for 80% or more); 79 unusually high profitability levels and pricing spreads; few new FI entrants (except through acquisitions, including through regional financial groups); and alternative sources of A2F (such as stock markets, pension funds, and insurance companies) that are rudimentary or in development and often under the control of the same banking groups. 80 As was noted in Chapter 3, weighted by the amount approved, SCF worked on average with the third-largest bank and IIC with the fifth-largest bank in each country. This investment pattern could potentially have detracted from, rather than increasing, competition. b) Did FI operations promote collective market action to improve A2F? IDBG FI operations rarely had market-wide objectives, though in some cases they had systemic effects. In Paraguay, for example, the public and private sector sides of the Bank took complementary roles in helping to improve A2F: SG operations supported a 2TFI to increase long-term credit in the country, MIF and IIC focused on microfinance in rural areas, and SCF emphasized trade finance. Occasionally, IDBG also promoted the entry of new players, as when IIC and MIF jointly supported one of the largest Ecuadorian banks in entering the highly-concentrated Colombian SME lending market. And the IDB s LPGS, launched during the financial crisis, might have helped bolster market-wide confidence even though in the end it was only partially used (Box 4.4). Box 4.4. Liquidity Program for Growth and Sustainability (LPGS) CMF launched the LPGS in 2008 as a direct response to the global financial crisis, to maintain the flow of credit to the real economy, offsetting in part, and on a temporary basis, shortfalls in normal credit flows to the region. The LPGS project design leaned on CMF s multisector operations, channeling funds through 2TFIs to FIs and eventually to the productive sector. Key facts on the Liquidity Program for FIs Approved Disbursed By windows Instruments Types of FIs Top countries Amount: $2.0 bn. (12% of whole portfolio) Number: 5 operations Amount: $285m. (14% of approvals) CMF (100%) Senior loans (100%) 2TFI (100%) Costa Rica (25%), El Salvador (20%), Panamá (25%), Jamaica (15%), Dominican Rep. (15%) Eligible borrowers included national governments, central banks, or 2TFIs with sovereign guarantees, with financing to be channeled to local FIs that met basic creditworthiness criteria and complied with norms and regulations in the country. While the program and approval documents of individual loans emphasized MSMEs, the program s operating guidelines had soft eligibility criteria for onlending to the productive sector, and loan resources were made available to a broad spectrum of private sector companies. Lending terms and conditions to subborrowers were freely established by local FIs. 43
65 Box 4.4 (continued). Liquidity Program for Growth and Sustainability (LPGS) This program was set up within the Emergency Lending category, and IDB allocated a total of $6 billion. The program had a country limit of $500 million, intended to make the credit line attractive for the region s smaller economies. Pricing of the loans was significantly higher than typical SG loans Libor +400 basis point (bps), as compared to CMF s average spread on other operations of 80 bps above Libor. The loans had a 5-year maturity with a 3-year grace period, but were targeted toward addressing firms short-term (up to 2 years) financing needs, especially working capital loans and trade credits. IDB approved only a third ($2 billon) of the total allocated emergency funds of $6 billion, and disbursed only 5% ($285 million) in two countries. After nine countries expressed initial interest in participating in the program, IDB approved five operations for $2 billion. Of the approved amounts, the program disbursed only 14% $186 million in El Salvador and $98 million in Jamaica. Three operations under the program were cancelled as FIs demand was limited partly because the liquidity crunch in the region was short-lived and credit demand was restricted by heightened risk aversion, and partly because of the high pricing. In El Salvador, the funds were reportedly channeled through 10 1TFIs (commercial and public banks) to about 1200 beneficiaries a, with an average loan size of about $150,000. In Jamaica, funds reportedly reached about 80 beneficiaries through four 1TFIs, with a higher average loan size of more than $1 million. FI client interviews revealed that subloans were mostly granted to large corporates, rather than MSMEs. Acknowledging the extremely high economic uncertainty at that time, it is still difficult to verify whether large corporates had access to funding in LAC at the time of disbursement. An ex-post evaluation of the program b found that merely announcing the emergency line mitigated macroeconomic uncertainty in the participating countries. According to the study, this confidence effect, which is typically associated with insurance, was considered sufficient to reduce uncertainty in the markets and to mitigate a decrease in credit growth to the private sector. a Estimation by OVE, based on the loan s Project Completion Report, which reported that 1915 credits were granted, totaling about $290 million. Of this amount, about $187 million was funded by IDB. b Ricardo N. Bebczuk, 2010, The Financial Impact of the IDB s Liquidity Program for Growth Sustainability. CEDLAS and Department of Economics Universidad Nacional de La Plata, Argentina. About 37% of FI operations used innovation as a key criterion for selecting the FI. Innovation was at the center of IDB s support to green lending in Colombia, first with a credit line for the largest Colombian bank, and later supporting the public 2TFI in standardizing green lending lines to make them a viable business line (Box 4.5). MIF helped establish a viable factoring market in Nicaragua by providing funding and TA to the first pure factoring company in the country. IDBG also engaged agents of change in the form of either FIs or collective entities, such as banking associations or global alliances. For example, SCF supported a mortgage securitization company in Brazil that boosted the housing market through the standardization of mortgage securitization Evaluation of IDB Group s Work Through Financial Intermediaries
66 4 Results for Clients and the IDB Group Box 4.5. Crafting a profitable product IDBG and a Colombian 2TFI identified five highly standardizable green investment solutions. Although this loan did not fully disburse, it is creating pressure on other banks to join the business and support a green protocol, thus providing a demonstration effect for green investments. This FI was one of the driving forces for setting up a green protocol for the Colombian financial sector in 2012 a self-regulatory mechanism to improve the participating FIs sustainable business performance. The green protocol is managed by the Colombian Banking Association, and the President of Colombia is a signing party to the protocol. This creates an environment of peer pressure for other banks to join the green protocol. The 2TFI secured the services of a technical service provider to assess energy savings potential, and on the basis of this potential, firms apply for credit from commercial banks with partial 2TFI funding. The novelty of the scheme is that it includes performance insurance from a local insurer to cover risks associated with the technical performance of the projects, thus diminishing uncertainty. D. Did IDBG FI operations help to improve the performance of beneficiaries? a) Did FI operations improve financing conditions for relevant beneficiaries? There is limited information on the effects of IDBG financing on beneficiaries, especially regarding lending interest rates. In using the FI mechanism, IDBG relies on FIs to make credit decisions, including the conditions under which credit is granted. In this context, IDBG rarely gathered information on credit conditions, such as interest rates for final beneficiaries. This is also the case for SG operations through second-tier banks, for which IDBG collected interest rate information for relevant beneficiaries in only a few cases (less than 10%), and mostly at the initiative of individual IOs. Final beneficiaries are rarely aware that IDBG is the reported source of funding for their subloans, or that it is IDBG s intent to improve their A2F. Regarding subloan tenors, FI operations included targets that were mostly achieved. About half of the operations had the goal of achieving minimum tenors of subloans. Of those, about 80% set specific targets and 60% reached or exceeded them. SME lending averaged 51 months (versus a 38-month target) and housing 144 months (versus a 167-month target). A more meaningful target would have been tenor improvements in the relevant portfolio, ideally against prevailing market conditions, but this was not consistently tracked. There is no information on how financing conditions changed or how funds were used at the beneficiary level. How SME beneficiaries used funds (for example, whether for capital investments or working capital or consumption) was not routinely tracked, nor was the extent to which housing loans were used for low-income housing. Green 45

67 IDBG also targeted a specific segment of new beneficiaries; for example, the women entrepreneurshipbanking initiative was jointly initiated by MIF (with TA) and SCF (with lending) to create a customized product for FIs to address the needs of small businesses run by women, who are traditionally underserved by the financial sector. IDB lending projects gathered little information on environmental outcomes (such as reduction of greenhouse gas emissions), 82 in part because of the technical difficulty of obtaining and consolidating such data. Together with weak eligibility conditions, 83 this lack of monitoring makes it impossible to connect project inputs and desired outcomes at the beneficiary level. b) Apart from credit per se, did FI operations generally increase A2F for relevant beneficiaries? In addition to credit lines, IDBG occasionally addressed A2F barriers by creating standardized products and/or targeting new beneficiary segments. The support for Nicaragua s factoring market, mentioned above, is one example. IDBG also targeted a specific segment of new beneficiaries; for example, the women entrepreneurshipbanking initiative was jointly initiated by MIF (with TA) and SCF (with lending) to create a customized product for FIs to address the needs of small businesses run by women, who are traditionally underserved by the financial sector. This clear client profile incentivized FIs to target these new clients. More generally, FIs are typically looking for a clear, standardized product they can sell to the intended beneficiaries. IDBG provided some support to FIs to improve their risk assessments and the bankability of new clients, but only a handful of FI operations sought to enhance beneficiaries bankability. IDBG was involved in several operations aimed at 46 Evaluation of IDB Group s Work Through Financial Intermediaries
68 4 Results for Clients and the IDB Group improving FIs risk assessment. IDBG worked with credit reporting institutions to improve the quality of SMEs payment records, 84 allowing SMEs to build credit histories that were accessible to FIs and facilitate a risk assessment for new beneficiary clients. In addition, IDBG worked with FIs to introduce them to innovative risk assessment tools, such as psychometric screening, which are considered more suited to unbanked clients. 85 IDBG targeted a specific set of new clients in only about 13% of its FI operations although only 11% met the preset targets, largely because of ambiguity in the definition of new. Finally, IDBG was involved in providing TA for addressing bankability for specific segments and topics, such as SMEs, climate change, and gender. 86 For example, IDBG worked with a large FI in El Salvador on providing training for SMEs to improve their entrepreneurial skills and make them more attractive to receive a loan. 87 c) Did beneficiary performance improve as a result of greater A2F? There is little information about the effect of improved A2F on SME performance such as an increase in jobs, sales, and productivity but a few impact evaluations have found positive effects. A CMF study of the lending activity of Bancoldex, 88 a Colombian 2TB, found significant positive effects on firm output (increase of 24%), employment (11%), investment (70%), and productivity (10%) over the four years after the first IDBG loan, and found that effects were more sustainable when firms received long-term credit. An OVE evaluation of programs of support for firms in Brazil 89 found that the impact on employment was even larger and more robust when credit was combined with business consulting. A literature review found the impact of A2F to be generally positive, but results were somewhat ambiguous, depending both on the indicator analyzed and the methodology followed. There is some evidence that access to finance increases recipient firms employment 90 and export opportunities, but for most other variables results are not as clear. 91 Macroeconomic studies also show a positive correlation between improved A2F and economic performance, at least up to a point. 92 E. How did IDBG FI operations affect IDBG s own profitability? A final dimension of results that is relevant to the evaluation is the results for the IDBG as a financial institution. The evaluation found that FI operations particularly those with large FIs were key contributors to IDBG s profitability. On the income side, average interest gross margins for FI operations were at par with other types of IDBG operations. 93 Yet lower origination and administration costs 94 and smaller loan loss allowances (LLAs) 95 due to lower credit risk turned FI operations into a critical driver of IDBG s profitability. Since these costs were to some extent fixed, larger operations, also usually involving larger FIs, were the most profitable. For example, IIC estimates that without large FIs, IIC s interest and fee income would drop by 34%, but smaller 47
69 FIs are estimated to have negative profitability if origination, supervision, and LLA costs are factored in. 96 While the interest margin charged by IIC for small FIs was more than twice as high as for large ones (3.2% vs. 1.5%), this was insufficient to compensate for the higher processing costs. IDBG s FI (including trade) operations tend to have lower credit risk, and thus lower LLA requirements, which positively affects net income. As of 2014, none of SCF s regular and very few of its trade operations 97 were classified as high-risk (RC6-8), compared to 19% of non-fi operations. Similarly, in IIC, only 0.5% of the FI portfolio was classified as high-risk, compared with 7.8% of the portfolio excluding FIs. This difference has a significant impact on LLA requirements, net income, profitability, and capital. Profitability varied by window and product. Profitability was not a key consideration on the SG side. On the NSG side, IIC and SCF loans were the highest contributors to profitability. There is little information for guarantees, especially those for TFFP, including whether overall program costs are being profitably amortized. Equity has rarely been used, so there is no discernable effect on returns. Finally, TA has been provided purely on a nonreimbursable basis, which adds to costs (unless it is fully donor-funded) without commensurate income. Since cost accounting is generally weak at IDBG, the profitability estimates discussed above should be treated as tentative. Around 80% of IDBG s costs are fixed and are related to human resources staff and specialized consultants. The allocation of these resources to individual operations is not always accurate. Similarly, IDB s capital allocations use a single source of capital for both SG and NSG operations, so SCF and OMJ lack a real profit and loss statement only a pro forma one was prepared over the last few years that could assess the real cost of resources against a market benchmark. SCF and OMJ will be integrated into NewCo, thus funding themselves independently under that structure, which could improve the profitability analysis for NewCo as a whole. Accurate cost accounting currently not being done in IIC would still be required for clear profitability analysis. F. Did FI operations enhance IDBG s role in supporting the private sector in LAC? Starting almost from scratch, IDBG built a presence among LAC FIs that together hold approximately 45% of LAC s total banking assets (Figure 4.7). Initially only IIC and MIF worked directly with FIs; IDB had no direct FI business until the beginning of the 2000s. Subsequently IDBG aggressively pursued this market and was able to position itself as a strong multilateral partner to over 200 LAC FIs. For example, a survey of client FIs conducted by Management shows that the overwhelming majority (94%) were satisfied with IDBG. 98 They were especially satisfied with investment 48 Evaluation of IDB Group s Work Through Financial Intermediaries
70 4 Results for Clients and the IDB Group officers authority (92%), tenors (90%), and technical expertise (89%). Similarly, FIs were reasonably satisfied with IDBG s clarity of process (82%), flexibility of financial products (82%), and capacity to convene local partners (81%). 100% 80% Figure 4.7 Client FIs together hold approximately 45% of LAC s total banking assets 60% 40% Avg. 45% Note: Only FIs directly reached by IDBG are included. Source: OVE s calculations, using information from local regulators and Bankscope. 20% 0% Ecuador Peru Guatemala Uruguay El Salvador Costa Rica DR Nicaragua Mexico Colombia Suriname Honduras Belize Paraguay Chile Bolivia Brazil Argentina Guyana IDBG is also recognized for its strong convening power on A2F issues. Over time, IDBG has been able to convene LAC FIs and other parties related to A2F, such as regulators and financial technology companies, to numerous high-level events for example, the annual gathering called Foromic sponsored by MIF, and IDBG s leading role in sponsoring Felaban s Annual Meeting. Additionally, IDBG had a strong role in the sponsorship of global initiatives such as the Global Banking Alliance for Women, Green lending through the Clean Technology Fund, and IIC s approach to gather financial technology companies to promote innovation. Similarly, IDBG has been recognized as a generator of useful market knowledge and metrics, such as a recent IDB study on housing, 99 and MIF s creation of the Global Microscope and A2F metrics. 100 However, there is room for improvement in IDBG s local presence and responsiveness to market needs. Management s survey also showed that client FIs were least satisfied with time to access financing (55%) and with IDBG s local presence (74%) for example, there is no field presence in São Paulo, Brazil s financial hub. Other DFIs consider field presence critical (Box 4.6). The Development Effectiveness Overview (2014) emphasized that IDBG still has not reached its 2015 target of basing 40% of professional staff in the country offices. Yet it made some progress in 2014, reaching 31%, compared to its baseline of 26% between 2006 and Client responsiveness is also likely to increase with closeness of relationship. For example, the survey shows that satisfaction was extremely high for IOs (96% positive) compared to Portfolio Management Officers (86%), in part because of IOs much stronger field presence. By 49

71 Green lending operations aim to mitigate greenhouse gas emissions by improving energy efficiency or investing in renewable energy. Subprojects of green lending are thus extremely varied in nature and size, ranging from new equipment and green loans for SMEs, to small hydropower plants and agribusinesses producing biofuel,to large-scale infrastructure projects such as wind farms. IDB far, the lowest satisfaction was in the area of timeliness, even though clients considered this to be the second most important factor. This result can be explained in part by IDBG s exhaustive due diligence procedures. However, it is important to remark that almost invariably FI clients appreciate the seal of approval that IDBG confers in terms of market perception once they have passed IDBG s due diligence process. (Box 4.7) Box 4.6. Presence of DFIs in LAC Development finance institutions (DFIs) consider having a local presence in the target region to be a competitive operational advantage, although for some of them operational volumes are too small to justify a permanent office. DFIs prefer to have staff on the ground, at a minimum through regional hub offices, often in the larger countries. IFC, for example, has the vast majority of its LAC FI staff in the field. With a strong local presence, the DFI can establish stronger relationships with the clients, generate more business, and monitor operations better, partly because of better country knowledge. DFIs with smaller country presences in their respective target regions (mostly such European DFIs as FMO, DEG, and PROPARCO), tend to partner with each other and commonly work with larger, less risky FIs and develop long-term relationships with them. As a comparison, IDBG had about 45% of its FI operation IOs in LAC country offices 50 Evaluation of IDB Group s Work Through Financial Intermediaries
72 4 Results for Clients and the IDB Group Box 4.7. FIs perception of IDBG and other DFIs In the client FI survey, OVE asked how FI clients perceived DFIs financial and nonfinancial additionality. OVE evaluated their relative positioning in the following areas: loan tenors, interest rates, covenants, technical assistance, support for future business and reputational effect. OVE included the following DFIs in the comparison: IDBG, IFC, the European DFIs (DEG, FMO, and PROPARCO) and the regional development banks (CAF and CABEI). IDBG: IDBG s relative strength as a strategic partner (48% rated IDBG as the best). For the rest of the attributes, IDBG also ranked the highest for about 40% of FI clients. IFC: For clients that also had operations with IFC (45), they considered that its relative strength was its contribution to the FI s reputation (47% of clients rated IFC as the best), and as a strategic partner (36%). IFC ranked lower in appropriateness of covenants (13%) and technical assistance (17%). European DFIs: Clients that also had operations with these DFIs (40) ranked them higher in the provision of best tenors (48% rated them as best) and technical assistance (44%). However, they ranked significantly lower in the perception of positive reputational effects and as strategic partners. Regional development banks: Finally, clients of regional development banks (34) perceived they provided the highest financial additionality in terms of interest rates (47% of rated them as best), tenors (41%), and appropriateness of covenants (48%). Based on the results of a survey conducted by an external survey firm from November 2015 February 2016, with responses of 120 FIs that were clients of IDBG (51% response rate). 51

73 5 This evaluation reviewed the objectives, content, and results of IDBG lending through FIs from 2005 through Through this lending IDBG worked with both publicly-owned second-tier banks and private sector commercial banks to increase A2F for underserved clients and to support the development of LAC s financial sector. IDB
74 5 Conclusions and Recommendations This evaluation reviewed the objectives, content, and results of IDBG lending through FIs from 2005 through Through this lending IDBG worked with both publicly-owned secondtier banks and private sector commercial banks to increase A2F for underserved clients and to support the development of LAC s financial sector. IDBG approved almost 500 FI operations for $17 billion during the period, about one-half (in volume) to public sector entities and one-half to the private sector. The four private sector windows (three of which have merged into a new IIC beginning January 1, 2016) have developed a direct client base of over 200 FIs that together account for approximately 45% of LAC s banking assets. In addition, IDBG is recognized for its convening power with public and private players in the financial sector, for example through MIF s publications and support for particularly innovative projects. Though IDBG can use other instruments including policy advice, TA, equity, and guarantees for financial sector strengthening and A2F, loans to FIs to finance onlending to beneficiaries have been the main tool it has used. The evaluation found that FI operations have been conducted without clear overarching IDBG strategic objectives or consistent processes. The various windows have each had their own goals, emphases, and procedures. For example, IIC has viewed FI operations as a cost-efficient means to reach their intended beneficiaries (SMEs). SCF has viewed FI operations in part as a way to motivate client FIs to pursue specific types of lending, such as green or women-focused lending. MIF has 53
75 focused more on promoting innovative approaches that have the potential to be scaled up at a market level. On the public sector side, CMF has used FI operations to build relationships with large second-tier public development banks. But IDBG as a whole has not had a strategy to address such overarching questions as how to best use the broad mix of FI operations and instruments to improve A2F for final beneficiaries and what the implications of this are for the work of the various windows. And the absence of an overarching strategic approach for IDBG has not only compromised the achievement of the best possible results, but it has led at times to overlap and even direct competition among the various windows. In addition, the sporadic coverage of both financial sector issues and private sector operations in Country Strategies has reduced IDBG s ability to deploy its best combination of instruments to address financial sector constraints and issues effectively at the country level. In this strategic vacuum, much FI lending has been more opportunistically demand-driven. Despite LAC s limited FI competition as evidenced, among other indicators, by high interest spreads (Annex II) IDBG windows devoted a large share of resources to the largest FIs in each country, potentially decreasing competition rather than enhancing it. Assessing results and IDBG contributions, whether at the FI or ultimate beneficiary levels, is made particularly difficult by weak M&E processes in most IDBG projects. Given the fungibility of money, it does not make sense to measure results by compiling a list of loans financed by IDB loan proceeds, as most projects did. Rather, results need to be measured by more aggregate measures, such as the increase in the overall relevant portfolio of the FI or, even better, the increase in the share of that portfolio in the FI s overall operations or the increase in the FI s relevant portfolio compared to growth in similar lending in the country. If assessed by those broader measures, OVE finds that IDBG likely had some positive results when it was a substantial lender or, more rarely, an equity investor to a smaller bank. OVE s judgment is that IDBG s loans to large banks were generally too small to have a significant impact, unless they supported the introduction of a specific new product or service. In many cases the results for IDBG may have been more consequential than those for the countries, as FI operations have become a key way to enhance the profitability of IDBG s private sector windows. On the income side, average interest gross margins for FI operations were at par with other types of IDBG operations. Yet lower origination and administration costs and smaller LLAs due to lower credit risk turned FI operations into a critical driver of IDBG s profitability. Since these costs were to some extent fixed, larger operations, also usually involving larger FIs, were the most profitable. IDBG s recent merge-out of the IDB s private sector windows into IIC provides an opportunity to address many of the issues identified in this evaluation, though effective implementation will be critical. Merging three of the four private sector windows will clearly lead to increased coordination among them. However, enhanced 54 Evaluation of IDB Group s Work Through Financial Intermediaries
76 5 Conclusions and Recommendations IDB-IIC coordination is likely to remain a challenge, as past failures in crossinstitutional coordination suggest. 101 The reorganization envisages much greater private sector engagement in Country Strategies and a key role for an IDBG-wide country representative, which can help ensure that key challenges are prioritized and appropriate instruments used. A wider IDBG product range using, for example, more equity, quasi-equity, local currency, guarantees, and TA could also help to better address the challenges to A2F, and the IDBG needs to find ways to make such tools financially and operationally viable. Building on the findings in this evaluation, OVE has five recommendations to complement the merge-out and other IDBG actions and ultimately to enhance the effectiveness of IDBG s FI operations. Since no single DFI currently implements all these practices, the combination of these recommendations aims at positioning IDBG as a leader in FI operations. Recommendation 1: Develop and implement a meaningful IDBG-wide strategic approach for working through FIs. This could be a new IDBG-wide strategy or an enhanced Sector Framework Document. It should be developed and approved jointly by the three governing bodies (IDB, IIC, and MIF) and should be accompanied by a meaningful results framework, with measurable goals, specific accountabilities, adequate resources (budgets and staff), and regular reporting on its implementation. The goal of the strategy should be to guide the IDBG in selecting FIs and instruments that have the potential to make the biggest development impact. It should address, at a minimum, the following topics: what criteria should govern the choice of FIs for support, and when should IDBG work through 2TFIs; under what conditions and terms is lending to public sector FIs with the use of a sovereign guarantee warranted; under what conditions are alternative types of instruments (such as equity, guarantees, or technical cooperation) appropriate for IDBG support to FIs; under what conditions and through what instruments should the IDB Group seek to provide complementary assistance to the public and private sectors -- for example, in strengthening competition or regulatory frameworks while (or in lieu of) providing direct liquidity support to FIs; Recommendation 2: Better integrate FI work across IDBG into Country Strategies. Issues of financial development and A2F are country-specific, and the Bank s approach should be tailored to country situations while also taking into account the demanddriven nature of IDBG s support. The new Country Strategy process, with its in-depth upstream country diagnostics, provides an opportunity for the IDBG to address A2F 55

77 In the case of environmental safeguards, OVE recommended to review and strengthen the way environmental and social safeguards are applied to FI operations by focusing on the development and application of E&S management systems at the FI level, particularly as they apply to the relevant portfolio. IDB as a cross-cutting development issue. A comprehensive country focus on A2F issues, including the level of competition in the financial sector and the underlying reasons for limited A2F, would allow IDBG to gain a deeper perspective on the dynamics of financial markets in a country and the potential effects of various types of FI operations on those markets and on development more broadly. It should also lead to the use of the most appropriate instruments. Credit lines whether public or private will be most appropriate where the main development constraint is liquidity, while other instruments may be better suited to help countries address other issues. Recommendation 3: Seek ways to generate income for IDBG that would facilitate the use of a wider range of instruments. The substantial income to IDBG from FI operations creates incentives to use that instrument even if it does not address the principal constraints to A2F in the country. Going forward, it will be important for IDBG to identify ways to finance non-lending work as well, as in many cases technical cooperation may be the instrument with the greatest potential development impact. Fee-for-service, donor contributions, and packages that bundle TA with lending and/ or equity investments are options to consider. Providing support for standardization of financial products in LAC may also help IDBG generate fee income and free up resources for complementary non-lending support. 56 Evaluation of IDB Group s Work Through Financial Intermediaries
The link provided above includes additional terms and conditions of the license.
 This work is distributed under a Creative Commons license https://creativecommons.org/licenses/by-nc-nd/3.0/us/ (CC BY-NC-ND 3.0 US). You are free to share, copy and redistribute the material in any medium
IDB EXTERNAL FEEDBACK SYSTEM 2015 REPORT
 IDB EXTERNAL FEEDBACK SYSTEM 2015 REPORT 1 Since its launch in 2012, the External Feedback System (EFS) has delivered key insights into what our partners value and how we can further enhance our role in
The link provided above includes additional terms and conditions of the license.
 This work is distributed under a Creative Commons license https://creativecommons.org/licenses/by-nc-nd/3.0/us/ (CC BY-NC-ND 3.0 US). You are free to share, copy and redistribute the material in any medium
Approach Paper. Oversight Study: The Evolution of Administrative Spending in the Inter-American Development Bank
 Approach Paper Oversight Study: The Evolution of Administrative Spending in the Inter-American Development Bank This work is distributed under a Creative Commons license https://creativecommons.org/licenses/by-nc-nd/3.0/us/
Approach Paper. Evaluation of Contingent Lending at the IDB
 Approach Paper Evaluation of Contingent Lending at the IDB Inter-American Development Bank February 2016 This work is distributed under a Creative Commons license https://creativecommons.org/licenses/by-nc-nd/3.0/us/
LISTENING ENGAGING IMPROVING IDB External Feedback System
 LISTENING ENGAGING IMPROVING 2014 IDB External Feedback System Since its creation, the Inter-American Development Bank (IDB) has been committed to aligning its work with the unique and evolving development
Corporate Evaluation. Comparative Study of Equity Investing in Development Finance Institutions
 Corporate Evaluation Comparative Study of Equity Investing in Development Finance Institutions Original: English Comparative Study of Equity Investing in Development Development Finance Institutions (DFIs)
The link provided above includes additional terms and conditions of the license.
 This work is distributed under a Creative Commons license https://creativecommons.org/licenses/by-nc-nd/3.0/us/ (CC BY-NC-ND 3.0 US). You are free to share, copy and redistribute the material in any medium
Agenda item 12: Consideration of accreditation proposals
 Page 5 (h) (j) (k) (l) (m) (n) Also requests the Appointment Committee to provide additional recommendations on the salary levels for consideration by the Board at its eleventh meeting; Decides that the
IFC Response to Third Monitoring Report of IFC s Response to: CAO Audit of a Sample of IFC Investments in Third-Party Financial Intermediaries
 March 9, 2017 IFC Response to Third Monitoring Report of IFC s Response to: CAO Audit of a Sample of IFC Investments in Third-Party Financial Intermediaries IFC would like to thank CAO for the monitoring
Green Bond Workshop. Monitoring, Reporting and Market Aspects. Amal-Lee Amin
 Green Bond Workshop Monitoring, Reporting and Market Aspects Amal-Lee Amin Inter-American Development Bank Climate Change and Sustainable Development Sector Climate Change Division INTERNATIONAL CONTEXT
Third Monitoring Report of IFC s Response to: CAO Audit of a Sample of IFC Investments in Third-Party Financial Intermediaries
 MONITORING REPORT CAO Audit of IFC CAO Compliance March 6, 2017 Third Monitoring Report of IFC s Response to: CAO Audit of a Sample of IFC Investments in Third-Party Financial Intermediaries Office of
Corporate Evaluation. Inter-American Investment Corporation Tenth Annual Independent Validation Report
 Corporate Evaluation Inter-American Investment Corporation Tenth Annual Independent Validation Report Inter-American Development Bank Inter-American Investment Corporation June 2014 Classification: Public
CALVO HORNERO, Antonia and MATARÁN SERRANO, Pedro Carlos
 CALVO HORNERO, Antonia and MATARÁN SERRANO, Pedro Carlos Analysis of the effects of the updating model of VAT and GNI contributions to the budget of the European Union The updating model of contributions
The link provided above includes additional terms and conditions of the license.
 This work is distributed under a Creative Commons license https://creativecommons.org/licenses/by-nc-nd/3.0/us/ (CC BY-NC-ND 3.0 US). You are free to share, copy and redistribute the material in any medium
FROM BILLIONS TO TRILLIONS:
 98023 FROM BILLIONS TO TRILLIONS: MDB Contributions to Financing for Development In 2015, the international community is due to agree on a new set of comprehensive and universal sustainable development
Opportunities for Working with the Inter- American Development Bank in Latin America and the Caribbean
 EL THE GRUPO IDB DEL GROUP BID Opportunities for Working with the Inter- American Development Bank in Latin America and the Caribbean Nathaniel Jackson Vice Presidency of Private Sector and Non- Sovereign
Mid-term Evaluation of IDB-9 Commitments Assessment of IDB-9 s. Private Sector. Development Framework. Background Paper
 Mid-term Evaluation of IDB-9 Commitments Assessment of IDB-9 s Private Sector Development Framework Background Paper Inter-American Development Bank March 2013 Classification: Public Document Original
Mid-term Evaluation of IDB-9 Commitments Country Programming
 Mid-term Evaluation of IDB-9 Commitments Country Programming Background Paper Inter-American Development Bank March 2013 Classification: Public Document Original Version: English This work is distributed
Microfinance in Latin America and the Caribbean Data Update- April 5, 2008
 -2008 Data Update- April 5, 2008 This note summarizes the results of a recently completed IDB survey of microfinance in the region. The survey includes information on microfinance activities in 25 countries
FROM BILLIONS TO TRILLIONS: TRANSFORMING DEVELOPMENT FINANCE POST-2015 FINANCING FOR DEVELOPMENT: MULTILATERAL DEVELOPMENT FINANCE
 DEVELOPMENT COMMITTEE (Joint Ministerial Committee of the Boards of Governors of the Bank and the Fund on the Transfer of Real Resources to Developing Countries) DC2015-0002 April 2, 2015 FROM BILLIONS
Annual Report 2015 Financial Statements
 Annual Report 2015 Financial Statements Letter of Transmittal As required by the By-Laws of the Inter-American Development Bank, the Board of Executive Directors hereby submits to the Board of Governors
TC Document/ FORMAT AND CONTENT
 TC Document/ FORMAT AND CONTENT I. Basic Information for TC [OPUS generates Basic Information and PTL follows rest of template] Country/Region: TC Name: TC Number: Team Leader/Members: Indicate if: Operational
Creating Green Bond Markets Insights, Innovations,
 Sustainable Banking Network (SBN) Creating Green Bond Markets Insights, Innovations, and Tools from Emerging Markets October 2018 Executive Summary Sustainable Banking Network Executive Summary The emergence
SECOND REPORT TO THE G20 ON THE MDB ACTION PLAN TO OPTIMIZE BALANCE SHEETS JUNE 2017
 SECOND REPORT TO THE G20 ON THE MDB ACTION PLAN TO OPTIMIZE BALANCE SHEETS JUNE 2017 The G20 Leaders endorsed the MDB Action Plan to Optimize Balance Sheets at the 2015 November Antalya meeting. The Plan
SUMMARY DOCUMENT: DELIVERING THE RENEWED VISION
 PUBLIC DOCUMENT OF THE INTER-AMERICAN DEVELOPMENT BANK SUMMARY DOCUMENT: DELIVERING THE RENEWED VISION FOR THE IDB GROUP PRIVATE SECTOR MERGE-OUT May 8, 2015 This document is a summary of the document
GROWING AS EQUALS. Banking on women, a business opportunity
 GROWING AS EQUALS Banking on women, a business opportunity 1 Table of Contents: This report was prepared by: Stephanie Oueda, Head of Gender, Diversity and Inclusion, IDB Invest; Lauren Murphy, Investment
The Role of Development Banks for Financing Sustainable Development. Stephany Griffith-Jones OFSE, Wien : 9 th November 2017
 The Role of Development Banks for Financing Sustainable Development Stephany Griffith-Jones sgj2108@columbia.edu OFSE, Wien : 9 th November 2017 Some theoretical insights DBs need, unrecognized in "efficient"
Private Financing of Public Infrastructure through PPPs in Latin America and the Caribbean
 Private Financing of Public Infrastructure through PPPs in Latin America and the Caribbean Executive Summary Public Disclosure Authorized Public Disclosure Authorized Public Disclosure Authorized Public
SECTOR ASSESSMENT (SUMMARY): FINANCE 1
: FINANCE 1") Country Partnership Strategy: Pakistan, 2015 2019 SECTOR ASSESSMENT (SUMMARY): FINANCE 1 1. Sector Performance, Issues and Opportunities 1. Financial sector participants. Pakistan s financial sector is
Country Partnership Strategy: Pakistan, 2015 2019 SECTOR ASSESSMENT (SUMMARY): FINANCE 1 1. Sector Performance, Issues and Opportunities 1. Financial sector participants. Pakistan s financial sector is
BUILDING A LOCAL VENTURE CAPITAL INDUSTRY
 THE MULTILATERAL INVESTMENT FUND: LESSONS LEARNED BUILDING A LOCAL VENTURE CAPITAL INDUSTRY IN LATIN AMERICA AND THE CARIBBEAN 15 YEARS INVESTING IN THE REGION By Susana Garcia-Robles / Established in
Enterprise Surveys e. Obtaining Finance in Latin America and the Caribbean 1
 Enterprise Surveys e Obtaining Finance in Latin America and the Caribbean 1 WORLD BANK GROUP LATIN AMERICA AND THE CARIBBEAN SERIES NOTE NO. 12/13 Basic Definitions Countries surveyed in and how they are
UDC /.64:[658.14:336.71(497.7)
") UDC 334.722.012.63/.64:[658.14:336.71(497.7) EVALUATION OF SMES FINANCING IN MACEDONIA FROM THE SUPPLY SIDE PERSPECTIVE Efimija Dimovska, FON University - Skopje Faculty of Economics efimija@gmail.com
UDC 334.722.012.63/.64:[658.14:336.71(497.7) EVALUATION OF SMES FINANCING IN MACEDONIA FROM THE SUPPLY SIDE PERSPECTIVE Efimija Dimovska, FON University - Skopje Faculty of Economics efimija@gmail.com
Annual Report 2016 Financial Statements
 Annual Report 2016 Financial Statements Letter of Transmittal As required by the By-Laws of the Inter-American Development Bank, the Board of Executive Directors hereby submits to the Board of Governors
INTER-AMERICAN INVESTMENT CORPORATION Condensed Financial Statements (Unaudited) March 31, 2018
 March 31, 2018") Condensed Financial Statements (Unaudited) March 31, 2018 BALANCE SHEET (Unaudited) USD Thousands March 31, 2018 December 31, 2017 ASSETS Cash and cash equivalents $ 20,542 $ 20,755 Investment securities
Condensed Financial Statements (Unaudited) March 31, 2018 BALANCE SHEET (Unaudited) USD Thousands March 31, 2018 December 31, 2017 ASSETS Cash and cash equivalents $ 20,542 $ 20,755 Investment securities
Trujillo, Verónica and Navajas, Sergio (2014). Financial Inclusion in Latin America and the Caribbean: Data and Trends. MIF, IDB.
. Financial Inclusion in Latin America and the Caribbean: Data and Trends. MIF, IDB.") About the Multilateral Investment Fund (MIF) Founded in 1993 as a member of the Inter-American Development Group, the Multilateral Investment Fund (MIF) was established to develop effective solutions that
About the Multilateral Investment Fund (MIF) Founded in 1993 as a member of the Inter-American Development Group, the Multilateral Investment Fund (MIF) was established to develop effective solutions that
Information Statement. Inter-American Development Bank
 Information Statement Inter-American Development Bank The Inter-American Development Bank (Bank or IADB) intends from time to time to issue its debt securities with maturities and on terms based on market
Armenia German-Armenian Fund GAF Loan Programme for the Promotion of Micro and Small Private Enterprises
 Armenia German-Armenian Fund GAF Loan Programme for the Promotion of Micro and Small Private Enterprises Ex post evaluation OECD sector BMZ project ID Project-executing agency Consultant 24030 Financial
Introduction. The Assessment consists of: A checklist of best, good and leading practices A rating system to rank your company s current practices.
 ESG / CSR / Sustainability Governance and Management Assessment By Coro Strandberg President, Strandberg Consulting www.corostrandberg.com September 2017 Introduction This ESG / CSR / Sustainability Governance
COUNTRIES BLENDED FINANCE. in the LEAST DEVELOPED EXECUTIVE SUMMARY AND ACTION AGENDA
 BLENDED FINANCE in the LEAST DEVELOPED COUNTRIES < < < < < < < <
Introduction. The Assessment consists of: Evaluation questions that assess best practices. A rating system to rank your board s current practices.
 ESG / Sustainability Governance Assessment: A Roadmap to Build a Sustainable Board By Coro Strandberg President, Strandberg Consulting www.corostrandberg.com November 2017 Introduction This is a tool for
Labour. Overview Latin America and the Caribbean. Executive Summary. ILO Regional Office for Latin America and the Caribbean
 2017 Labour Overview Latin America and the Caribbean Executive Summary ILO Regional Office for Latin America and the Caribbean Executive Summary ILO Regional Office for Latin America and the Caribbean
THE WESTERN HEMISPHERE CREDIT & LOAN REPORTING INITIATIVE
 THE WESTERN HEMISPHERE CREDIT & LOAN REPORTING INITIATIVE Massimo Cirasino, World Bank José Antonio García, CEMLA Mario Guadamillas, World Bank Margaret Miller, World Bank Table of Contents Project Summary...1
PUBLIC DISCLOSURE AUTHORISED
 PUBLIC DISCLOSURE AUTHORISED CARIBBEAN DEVELOPMENT BANK EXECUTIVE SUMMARY WITH MANAGEMENT RESPONSE PROJECT COMPLETION VALIDATION REPORT THIRD CONSOLIDATED LINE OF CREDIT CARIBBEAN FINANCIAL SERVICES CORPORATION
RESTRUCTURING PAPER ON A PROPOSED PROJECT RESTRUCTURING ACCESS TO LONGER TERM FINANCE FOR MICRO, SMALL AND MEDIUM ENTERPRISES PROJECT
 Public Disclosure Authorized REPORT NO.: RES33563 RESTRUCTURING PAPER Public Disclosure Authorized ON A PROPOSED PROJECT RESTRUCTURING OF ACCESS TO LONGER TERM FINANCE FOR MICRO, SMALL AND MEDIUM ENTERPRISES
IMF POLICIES AND PRACTICES ON CAPACITY DEVELOPMENT
 August 26 2014 IMF POLICIES AND PRACTICES ON CAPACITY DEVELOPMENT IMF staff regularly produces papers proposing new IMF policies, exploring options for reform, or reviewing existing IMF policies and operations.
Economic Watch. Penetration of Credit in Mexico: Evolution and Comparison with Some Latin American Countries. Mexico. Introduction
 Economic Watch Mexico Economic Analysis Mexico Adolfo Albo M. a.albo@bbva.com Fco. Javier Morales E. fj.morales@bbva.com Penetration of Credit in Mexico: Evolution and Comparison with Some Latin American
May 8, 2006 INTRODUCTION
 THE INDEPENDENT EVALUATION OFFICE OF THE INTERNATIONAL MONETARY FUND POSSIBLE TOPICS FOR EVALUATION OVER THE MEDIUM TERM May 8, 2006 INTRODUCTION This note identifies possible topics for evaluation by
Corporate Governance in Latin America
 7.4 Corporate Governance in Latin America Daniel Blume, OECD and Felipe Alonso, Curtis, Mallet-Prevost, Colt and Mosle There has been a remarkable level of recent activity to develop and improve voluntary
The Big Business of Small Enterprises
 The Big Business of Small Enterprises An IEG Evaluation of WBG Experience with Targeted Support for SMEs 2006-12 Andrew H. W. Stone IEG, Private Sector JOINT MNSFP-MENA Chief Economist Seminar January
Verónica Trujillo Sergio Navajas OCTOBER 2016 FINANCIAL INCLUSION AND FINANCIAL SYSTEMS IN LATIN AMERICA AND THE CARIBBEAN.
 Verónica Trujillo Sergio Navajas OCTOBER 2016 FINANCIAL INCLUSION AND FINANCIAL SYSTEMS IN LATIN AMERICA AND THE CARIBBEAN Data and Trends ABOUT THE MULTILATERAL INVESTMENT FUND The Multilateral Investment
Transition to formality
 Transition to formality A regional knowledge sharing forum for Latin American and Caribbean countries 24th to 28th August 2015 Lima, Perù Formalization of the Informal Economy The Need for an Integrated
Decision 3/CP.17. Launching the Green Climate Fund
 Decision 3/CP.17 Launching the Green Climate Fund The Conference of the Parties, Recalling decision 1/CP.16, 1. Welcomes the report of the Transitional Committee (FCCC/CP/2011/6 and Add.1), taking note
PROGRAM-FOR-RESULTS INFORMATION DOCUMENT (PID) CONCEPT STAGE Report No.:
 CONCEPT STAGE Report No.:") Public Disclosure Authorized Public Disclosure Authorized Public Disclosure Authorized Public Disclosure Authorized PROGRAM-FOR-RESULTS INFORMATION DOCUMENT (PID) CONCEPT STAGE Report No.: 113653 Program
Public Disclosure Authorized Public Disclosure Authorized Public Disclosure Authorized Public Disclosure Authorized PROGRAM-FOR-RESULTS INFORMATION DOCUMENT (PID) CONCEPT STAGE Report No.: 113653 Program
FINANCIAL INFORMATION FORUM OF LATIN AMERICAN AND CARIBBEAN CENTRAL BANKS. Identifying a Minimum Set of Standard Financial Information
 FINANCIAL INFORMATION FORUM OF LATIN AMERICAN AND CARIBBEAN CENTRAL BANKS Identifying a Minimum Set of Standard Financial Information Identifying a Minimum Set of Standard Financial Information Final Report
GLOBAL PROGRESS REPORT
 SUSTAINABLE BANKING NETWORK (SBN) GLOBAL PROGRESS REPORT FEBRUARY 2018 EXECUTIVE SUMMARY International Finance Corporation [2018], as the Secretariat of the Sustainable Banking Network (SBN). All rights
PARTNERSHIP FOR MARKET READINESS (PMR) PRESENTATION OF THE PMR FY17 EXPENSES AND PROPOSAL FOR THE PMR FY18 BUDGET
 PRESENTATION OF THE PMR FY17 EXPENSES AND PROPOSAL FOR THE PMR FY18 BUDGET") PARTNERSHIP FOR MARKET READINESS (PMR) PRESENTATION OF THE PMR FY17 EXPENSES AND PROPOSAL FOR THE PMR FY18 BUDGET March 6, 2017 BACKGROUND 1. Per the PMR Governance Framework, the PMR Secretariat is responsible
PARTNERSHIP FOR MARKET READINESS (PMR) PRESENTATION OF THE PMR FY17 EXPENSES AND PROPOSAL FOR THE PMR FY18 BUDGET March 6, 2017 BACKGROUND 1. Per the PMR Governance Framework, the PMR Secretariat is responsible
IDB GROUP SUPPORT TO THE SMALL AND MEDIUM ENTERPRISE SECTOR ( )
") IDB GROUP SUPPORT TO THE SMALL AND MEDIUM ENTERPRISE SECTOR (1990 2002) ACHIEVEMENTS, LESSONS, AND CHALLENGES MARCH 2003 The Inter-American Development Bank Sustainable Development Department MICRO, SMALL,
IDB GROUP SUPPORT TO THE SMALL AND MEDIUM ENTERPRISE SECTOR (1990 2002) ACHIEVEMENTS, LESSONS, AND CHALLENGES MARCH 2003 The Inter-American Development Bank Sustainable Development Department MICRO, SMALL,
Building Effective Governments. Executive Summaries of the Caribbean Country Studies. Guyana
 Building Effective Governments Executive Summaries of the Caribbean Country Studies Guyana Building Effective Governments Executive Summaries of the Caribbean Country Studies Editors of the Executive Summaries:
financing your desire to grow The Corporation Serving private businesses in Latin America and the Caribbean
 financing your desire to grow The Corporation Serving private businesses in Latin America and the Caribbean Tahuamanu Plant (Bolivia) In much of Latin America and the Caribbean, economic strategies increasingly
Is Export Promotion Effective in Latin America and the Caribbean?*
 Is Export Promotion Effective in Latin America and the Caribbean?* Christian Volpe Martincus Inter-American Development Bank 7 th World Conference of Trade Promotion Organizations The Hague October 13,
Ten key messages of the Latin American and Caribbean regional consultation on Financing for Development
 Ten key messages of the Latin American and Caribbean regional consultation on Financing for Development ECLAC, Santiago, 12-13 March 2015 1. Monterrey and Doha have a different political process and history
Blended Concessional Finance: Governance Matters for Impact
 www.ifc.org/thoughtleadership NOTE 66 MAR 2019 Blended Concessional Finance: Governance Matters for Impact By Kruskaia Sierra-Escalante, Arthur Karlin & Morten Lykke Lauridsen Blended concessional finance,
Low-carbon Development and Carbon Finance at the IDB Maria Netto Sustainable Energy and Climate Change Unit (ECC)
") Low-carbon Development and Carbon Finance at the IDB Maria Netto Sustainable Energy and Climate Change Unit (ECC) 11th Annual Workshop on Greenhouse Gas Emission Trading Oct 3 rd, 2011 Context for IDB
Low-carbon Development and Carbon Finance at the IDB Maria Netto Sustainable Energy and Climate Change Unit (ECC) 11th Annual Workshop on Greenhouse Gas Emission Trading Oct 3 rd, 2011 Context for IDB
Mid-term Evaluation of IDB-9 Commitments Operational Performance and Budget
 Mid-term Evaluation of IDB-9 Commitments Operational Performance and Budget Background Paper Inter-American Development Bank March 2013 Classification: Public Document Original Version: English This work
New Avenues for Financing Infrastructure Managing Risks and Contingent Liabilities in LAC
 DMF STAKEHOLDERS FORUM 2014 DEBT MANAGEMENT IN DEVELOPING COUNTRIES: NEW FRONTIERS AND ONGOING CHALLENGES New Avenues for Financing Infrastructure Managing Risks and Contingent Liabilities in LAC Edgardo
Green Finance for Green Growth
 2010/FMM/006 Agenda Item: Plenary 2 Green Finance for Green Growth Purpose: Information Submitted by: Korea 17 th Finance Ministers Meeting Kyoto, Japan 5-6 November 2010 EXECUTIVE SUMMARY Required Action/Decision
Regional Financial Institutions and the Role of the BNDES in Latin America
 Regional Financial Institutions and the Role of the BNDES in Latin America BY ADRIANO VILELA SAMPAIO Introduction The expanding influence of emerging economies in the last few decades can be seen in many
GLOBAL EQUITY MANDATES
 MEKETA INVESTMENT GROUP GLOBAL EQUITY MANDATES ABSTRACT As the line between domestic and international equities continues to blur, a case can be made to implement public equity allocations through global
PRIVATE SECTOR DEVELOPMENT STRATEGY: FOSTERING DEVELOPMENT
 DOCUMENT OF THE INTER-AMERICAN DEVELOPMENT BANK PRIVATE SECTOR DEVELOPMENT STRATEGY: FOSTERING DEVELOPMENT THROUGH THE PRIVATE SECTOR APPROVED JUNE 22, 2011 This document was prepared by VPP/VPP in collaboration
Making Sustainability Count: From the WAVES Partnership to a Global Program on Sustainability
 Making Sustainability Count: From the WAVES Partnership to a Global Program on Sustainability Raffaello Cervigni November 22, 2017 Wealth Accounting and the Valuation of Ecosystem Services www.wavespartnership.org
PROJECT INFORMATION DOCUMENT (PID) APPRAISAL STAGE
 APPRAISAL STAGE") Public Disclosure Authorized Public Disclosure Authorized Public Disclosure Authorized Public Disclosure Authorized Project Name Region Country PROJECT INFORMATION DOCUMENT (PID) APPRAISAL STAGE Russia
Public Disclosure Authorized Public Disclosure Authorized Public Disclosure Authorized Public Disclosure Authorized Project Name Region Country PROJECT INFORMATION DOCUMENT (PID) APPRAISAL STAGE Russia
MDGs Example from Latin America
 Financing strategies to achieve the MDGs Example from Latin America Workshop Tunis 21-24 24 January,, 2008 Rob Vos Director Development Policy and Analysis Division Department of Economic and Social Affairs
The effectiveness and efficiency of a country s public sector is vital to
 Executive Summary The effectiveness and efficiency of a country s public sector is vital to the success of development activities, including those the World Bank supports. Sound financial management, an
Macedonia: Macedonia Microcredit Bank (MMB) ProCredit Bank Financial intermediaries of the formal sector. Microcredit Bank
 ProCredit Bank Financial intermediaries of the formal sector. Microcredit Bank") Macedonia: Macedonia Microcredit Bank (MMB) ProCredit Bank Ex post evaluation report OECD sector BMZ project ID 2002 66 098 Project executing agency Consultant - 24030 Financial intermediaries of the formal
Macedonia: Macedonia Microcredit Bank (MMB) ProCredit Bank Ex post evaluation report OECD sector BMZ project ID 2002 66 098 Project executing agency Consultant - 24030 Financial intermediaries of the formal
Q & A CREA TU FUTURO PROGRAM ALONG WITH THE REGION S
 CREA TU FUTURO PROGRAM Q & A 1. What is the Investment Operations Department (INO)?. What is this program about?. How long does the program last?. In which divisions can I work? 5. Which are the program
Report and Recommendation of the President to the Board of Directors
 Report and Recommendation of the President to the Board of Directors Project Number: 47934 June 2014 Proposed Senior Loan Khan Bank Supporting Micro, Small, and Medium-Sized Enterprises (Mongolia) This
Measuring Loss on Latin American Defaulted Bank Loans: A 27-Year Study of 27 Countries
 Measuring Loss on Latin American Defaulted Bank Loans: A 27-Year Study of 27 Countries Lew Hurt Vice President Portfolio Strategies Group Citibank, New York Akos Felsovalyi Vice President Portfolio Strategies
I. INTRODUCTION 3. II. G-20 PRINCIPLES 3 A. MDB Tasks 3 B. IMF Tasks 5 C. Joint IMF and MDB Tasks 6 III. CONCLUSION 8.
 GROUP OF TWENTY Coordination Between the International Monetary Fund and Multilateral Development Banks on Policy-Based Lending: Update on the Implementation of the G20 Principles Prepared by Staffs of
Agenda item 18: Policies on the formal replenishment process
 Page 10 Also requests the Secretariat to take into account in developing the terms of reference of the procedure: (i) (ii) The need for the assets of the GCF to be covered by the appropriate privileges
INDEPENDENT AUDITORS REPORT AND FINANCIAL STATEMENTS
 INDEPENDENT AUDITORS REPORT AND FINANCIAL STATEMENTS Regional Fund for Agricultural Technology December 31, 2016 and 2015 KPMG LLP Suite 12000 1801 K Street, NW Washington, DC 20006 Report of Independent
Joint IFI/DFI Action Plan to Respond to the Financial Crisis in Africa
 COMMUNIQUE By THE AFRICAN DEVELOPMENT BANK GROUP African Development Bank African Development Fund THE AGENCE FRANCAISE DE DEVELOPPEMENT GROUP Agence Française de Développement Proparco DEVELOPMENT BANK
Financing strategies to achieve the MDGs in Latin America and the Caribbean
 UNDP UN-DESA UN-ESCAP Financing strategies to achieve the MDGs in Latin America and the Caribbean Rob Vos (UN-DESA/DPAD) Presentation prepared for the inception and training workshop of the project Assessing
MEMORANDUM OF UNDERSTANDING. between THE EUROPEAN INVESTMENT BANK. and THE INTER-AMERICAN DEVELOPMENT BANK
 MEMORANDUM OF UNDERSTANDING between THE EUROPEAN INVESTMENT BANK and THE INTER-AMERICAN DEVELOPMENT BANK 13 December 2004 MEMORANDUM OF UNDERSTANDING between THE EUROPEAN INVESTMENT BANK and THE INTER-AMERICAN
Role of National Development Banks in Promoting Climate Finance
 Role of National Development Banks in Promoting Climate Finance Maria Netto mnetto@iadb.org Jose Juan Gomes juang@iadb.org Capital Markets and Financial Institutions Inter-American Development Bank Low
Private Sector Facility: Working with Local Private Entities, Including Small and Medium-Sized Enterprises
 Private Sector Facility: Working with Local Private Entities, Including Small and Medium-Sized Enterprises GCF/B.09/12 5 March 2015 Meeting of the Board 24-26 March 2015 Songdo, Republic of Korea Agenda
Audited Financial Statements as of December 31, 2014 and 2013
 Audited Financial Statements as of December 31, 2014 and 2013 2014 ANNUAL REPORT cover Independent Auditors Report The Board of Governors Inter-American Investment Corporation: We have audited the accompanying
Ben S Bernanke: Modern risk management and banking supervision
 Ben S Bernanke: Modern risk management and banking supervision Remarks by Mr Ben S Bernanke, Chairman of the Board of Governors of the US Federal Reserve System, at the Stonier Graduate School of Banking,
MANAGEMENT S DISCUSSION AND ANALYSIS OF FINANCIAL CONDITION AND RESULTS OF OPERATIONS
 MANAGEMENT S DISCUSSION AND ANALYSIS OF FINANCIAL CONDITION AND RESULTS OF OPERATIONS The following discussion contains an analysis of our financial condition and results of operations for the nine months
INSURANCE AND PENSION FUNDS February 2019
 AIMM Sector Framework Brief Sector Economics and Development Impact Department International Finance Corporation INSURANCE AND PENSION FUNDS February 2019 Development Impact Thesis IFC s operations for
BANK LENDING SURVEY Results for Portugal January 2017
 BANK LENDING SURVEY Results for Portugal January 2017 I. Overall assessment According to the results of the January survey conducted on the five banking groups included in the Portuguese sample, credit
Grupo Santander achieved healthy, geographically balanced and sustainable growth. Alfredo Sáenz Second Vice-Chairman and Chief Executive Officer
 Grupo Santander achieved healthy, geographically balanced and sustainable growth. Alfredo Sáenz Second Vice-Chairman and Chief Executive Officer Letter from the Chief Executive Officer Grupo Santander
SECTOR ASSESSMENT (SUMMARY): FINANCE
: FINANCE") Inclusive Financial Sector Development Program, Subprogram 1 (RRP CAM 44263 013) SECTOR ASSESSMENT (SUMMARY): FINANCE 1. Sector Performance, Problems, and Opportunities a. Sector Context and Performance
Inclusive Financial Sector Development Program, Subprogram 1 (RRP CAM 44263 013) SECTOR ASSESSMENT (SUMMARY): FINANCE 1. Sector Performance, Problems, and Opportunities a. Sector Context and Performance
Rethinking the Role of the State in Finance
 GLOBAL FINANCIAL DEVELOPMENT REPORT 2013 Rethinking the Role of the State in Finance WB/IMF/FRB Seminar for Senior Bank Supervisors from Emerging Economies Washington, DC, October 15, 2012 http://www.worldbank.org/financialdevelopment
Mobilizing Islamic Finance for Long Term Financing: Lessons From Conventional Finance. Ana Carvajal
 Mobilizing Islamic Finance for Long Term Financing: Lessons From Conventional Finance Ana Carvajal Istanbul, November 2015 The Context: Gaps in long term finance Infrastructure Financing gap estimated
EVFIN Joint response to the Green Paper on Long Term Financing of the European Economy
 EVFIN Joint response to the Green Paper on Long Term Financing of the European Economy Brussels, June 12, 2013 Long Term financing supports in particular businesses with long-term financing needs from
Role of MDBs in financing of countries NDCs
 Role of MDBs in financing of countries NDCs Climate Change and Sustainability Division 2/11/2016 Amal-Lee Amin Inter-American Development Bank Infrastructure and Environment Sector Climate Change and Sustainability
People s Republic of China: Promotion of a Legal Framework for Financial Consumer Protection
 Technical Assistance Report Project Number: 47042-001 Policy and Advisory Technical Assistance (PATA) October 2013 People s Republic of China: Promotion of a Legal Framework for Financial Consumer Protection
Ex Post-Evaluation Brief El Salvador: SMEs Credit Line for Environmental Loans Via Cabei
 Ex Post-Evaluation Brief El Salvador: SMEs Credit Line for Environmental Loans Via Cabei Programme/Client Credit line for environmental lending to SMEs through CABEI (IVF) 2005 66 232 Programme executing
Considering Market Features in Latin America as Part of a Transfer Pricing Analysis
 Considering Market Features in Latin America as Part of a Transfer Pricing Analysis In the context of the various tax and transfer pricing discussions taking place currently internationally, the OECD recently